Abstract
Considerable research has been devoted to developing machine-learning models for continuous Blood Pressure (BP) estimation. A challenging problem that arises in this domain is the selection of optimal features with interpretable models for medical professionals. The aim of this study was to investigate evidence-based physiologically motivating features based on a solid physiological background of BP determinants. A powerful and compact set of features encompassing six physiologically oriented features was extracted in addition to another set of features consisting of six commonly used features for comparison purposes. In this study, we proposed a BP predictive model using Long Short-Term Memory (LSTM) networks with multi-stage transfer learning approach. The proposed model topology consists of three cascaded stages. First, a BP classification stage. Second, a Mean Arterial Pressure (MAP) regression stage to further approximate a quantity proportional to Vascular Resistance (VR) using the extracted Cardiac Output (CO) from the PPG signal. Third, the main BP estimation stage. The final stage (final BP prediction) is able to exploit embedded correlations between BP and the proposed features along with derived outputs carrying hemodynamic characteristics through the sub-sequence stages. We also constructed traditional single-stage Artificial Neural Network (ANN) and LSTM-based models to appraise the performance gain of our proposed model. The models were tested and evaluated on 40 subjects from the MIMIC II database. The LSTM-based multi-stage model attained a MAE ± SD of 2.03 ± 3.12 for SBP and 1.18 ± 1.70 mmHg for DBP. The proposed set of features resulted in drastic error reduction, of up to 86.21%, compared to models trained on the commonly used features. The superior performance of the proposed multi-stage model provides confirmatory evidence that the selected transferable features among the stages coupled with the high-performing multi-stage topology enhance blood pressure estimation accuracy using PPG signals. This indicates the compelling nature and sufficiency of the proposed efficient features set.
1. Introduction
The growing demand for continuous Blood Pressure (BP) monitoring has encouraged many researchers to develop machine-learning models for BP estimation using PPG signals to remedy the shortcomings of cuff-based BP devices. This area of research has gradually expanded and made tremendous progress over the last decade. However, there are still many gaps in this area of research that need to be filled. For instance, reflections from various studies have shown that optimizing the feature set and finding the optimal combination of features that have the greatest impact on blood pressure estimation remains an area of research [1]. Despite decades of research, the best PPG features for BP estimation continue to be debated. Redundant and irrelevant features carry the risk of overfitting the model and hence affect the accuracy and complicate the interpretability of the model. It is vital to understand and explain how specific Photoplethysmography (PPG) features can be selected to achieve higher performance and reliable predictions of blood pressure [1].
Different types of features can be extracted from PPG signals: temporal, frequency domain, and morphological features [2,3,4,5,6]. Several studies have used a broad range of features: tens to hundreds of features [7,8,9,10].
Recently, researchers have shown increased interest in developing advanced models, such as Convolutional Neural Networks (CNN) [9,10,11,12,13]. Many of them tend to use automated feature extraction from raw PPG signals or images of PPG waveforms. Besides the computational complexity and cost of CNN models, the features extracted from such networks are unknown, making them uninterpretable for medical professionals [1], raising serious consideration.
Multi-stage models were also proposed recently and showed remarkable performance. A prior work [10] has successfully shown the effectiveness of a multi-stage deep neural network in estimating blood pressure from PPG signals. This study has proposed a multi-stage network comprised of two successive stages. The first stage includes two CNNs to extract the features vector from pre-processed PPG signals. The second stage includes two LSTM neural networks, each intended to estimate the final SBP and DBP, respectively. Further, they considered the dynamic relationship between SBP and DBP. This was achieved by combining a primary estimate of SBP with the produced features vector to improve the accuracy of DBP and vice versa. The generated output vector of the CNN consisted of 60 elements. The model achieved a MAE ± SD of 3.97 ± 5.55 mmHg for SBP and 2.10 ± 2.84 mmHg for DBP.
From another point of view, there are multiple PPG features that are commonly extracted for BP prediction through the feature-engineering technique. These features are cycle duration, systolic time, diastolic time, peak to notch time, and peak width at different amplitude levels [2,4]. On the other side, there is a great focus on EEG-PPG-based approaches for BP prediction. ECG-PPG-based approach models are usually used to estimate blood pressure based on PAT (Pulse Arrival Time) and PTT (Pulse Transit Time) features [2]. One study [14] highlighted that the changes in stroke volume and vascular resistance might alter the reliability of PAT and PPT measurements; thus, the estimated BP would not be related to physiological changes in BP. These effects would carry significant consideration in BP measurement.
From a physiological point of view, the Mean Arterial Pressure (MAP) is regulated by the alterations of either the cardiac output (CO) or the systematic vascular resistance (SVR), also called total peripheral resistance (TPR) [15]. BP is maintained based on the hemodynamics principles of blood flow and volume (SV and CO) and the behavior of blood vessels (SVR). SVR is the resistance of blood flow through the vessel. Whereas CO is the volume of blood pumped by the heart’s ventricle per minute [15]. It is hard to obtain a direct clinical measurement for Vascular Resistance (VR) unless accurate BP and CO readings are available [15]. However, previous studies have shown that variations in PPG morphology, in particular notch position [16,17], notch position with respect to pulse peak [16], and systolic amplitude [16,18], is highly correlated with blood pressure and are mediated by vascular tone (the degree of vascular resistance) [16,17]. Another study [19] has demonstrated that pulse width at the half height of the systolic peak amplitude of finger PPG is more sensitive to alterations in vascular resistance compared to systolic amplitude. For CO, it has been previously reported by [20] that the area under the arterial pulse curve corresponds to the stroke volume. Hence, CO could be extracted from the PPG signal by computing the area under the curve (representing stroke volume; blood volume ejected by the heart per beat) and the heart rate.
Study [21] has performed a regression analysis to assess the relationship between three powerful PPG morphological features and BP. The features extracted were pulse width, pulse height (systolic amplitude), and area under the curve. It was found that systolic amplitude is inversely proportional to SBP. The pulse width and the area under the curve were directly proportional to SBP.
In another study [22], 13 features were extracted: systolic amplitude, diastolic amplitude, systolic area, inflection point area, systolic time (crest time), diastolic time, pulse interval, peak-to-peak interval, width at half maximum of systolic amplitude, augmentation index (ratio of systolic amplitude to diastolic amplitude), and stiffness index (ratio of systolic amplitude to diastolic time). They reported that specific PPG features embed a hidden relationship with BP, particularly the area under the curve (related to cardiac output) and the heart rate, which significantly impacted the BP estimation. Their models’ performance results showed that utilizing the area under the curve and the heart rate has comparable performance with the performance obtained using the entire 13 features. This indicates the dominance and significance of these features over the rest of the features.
Together, these studies [16,17,18,19,20,21,22] provide important insights into the significance of specific PPG features (CO, stroke volume (SV), heart rate (HR), peak width (PW), systolic amplitude (SA), and systolic-to-notch amplitude difference (SN)) in BP estimation compared to other features.
Despite the popularity of most of these features, they have rarely been used alone and independently in a BP predictive model. The challenging problem of finding an appropriate set of features and providing a trustworthy interpretable model for medical professionals [1] has received substantial interest and remains an open problem in this area. The use of CNN-based models and automated feature extraction turns out to be problematic because of their computationally complex nature. In addition, machine-learned features are not physiologically interpretable. It means that we cannot capture relevant physiological information from CNN models concerning the reasoning behind the model predictions and the relationship between features and output predictions. For this study, it was of interest to investigate the feasibility of achieving high-performing and interpretable models for BP using evidence-based physiologically motivating features only.
In contrast to other studies, which presented the use of automated feature extraction, we adopted an alternative perspective, which is centered on interfacing human physiology of BP and the development of a cuffless BP monitoring system. To fuel this area of research with a reliable and explainable model for medical professionals, we utilized PPG physiologically motivating features. These features are CO, SV, HR, SN, SA, and PW. The features were selected based on the solid background of BP physiological determinants and their correlation with PPG signals, as described above [16,17,18,19,20,21,22]. Further, we extracted other commonly used features [2,4,22] for comparison purposes.
Furthermore, we developed a multi-stage three-step prediction model. The proposed model was implemented with two different networks: Artificial Neural Network (ANN) and LSTM, to examine the proposed features’ significance on the performance of different networks. The proposed model utilizes classification and regression algorithms to improve the final estimation accuracy of SBP and DBP. The proposed model topology consists of three cascaded stages: a BP classification stage, a MAP regression stage, and finally, the main BP estimation stage. The classification stage performs the auxiliary task of discriminating the class of blood pressure, i.e., normotension, hypertension, or hypotension. Followed by a regression stage, which performs another auxiliary task of predicting the MAP value to further approximate a value proportional to VR. The objective of the third and final stage is to estimate SBP and DBP values based on the proposed features and derived outputs from previous stages.
To leverage the significance of the proposed features, we adopted a transfer learning approach [23] in our model. Powerful features are transferred through the three successive stages of the proposed model. The fixed-feature extraction method [23] was employed by freezing the first two successive source stages of the auxiliary tasks. Then, obtaining their output predictions (the predicted BP class, predicted MAP, and the approximated VR) as additional features to feed the final target stage.
The auxiliary models were also trained on the proposed features set. The MAP predicted by the second stage was also used along with the extracted CO to compute an approximated quantified value corresponding to VR.
The proposed model concept is to first utilize classification to enhance the regression task and, second, to exploit the dynamic relationship between MAP and VR and the SBP and DBP. To our knowledge, the use of classification to improve the performance of a regression model has not been performed in this area of research. However, it has been performed in other research areas. For instance, in [24], classification was used in improving age prediction. Whereas in [25], the joint classification-regression framework was used to enhance the prediction of the Remaining Useful Life (RUL) of industrial manufacturing systems. In addition, as mentioned earlier, one study [10], has used SBP to improve DBP prediction and vice versa. In our case, we use MAP prediction to boost the prediction accuracy of both SBP and DBP. With our novel approach, the final stage (final BP prediction) will exploit the embedded correlations between the proposed physiologically motivating features, derived outputs from the sub-sequence stages, and BP with the aim of alleviating the prediction error of BP.
From another standpoint, we constructed other traditional deep learning models, such as single-stage ANN and LSTM-based models to appraise the performance gain of our proposed model. This paper provides several key contributions:
- The use of carefully selected features based on BP physiological domain knowledge instead of using a combination of a large number of features and machine-learned features having an ambiguous relationship with BP.
- The proposed set of features maximizes efficiency and accuracy.
- Providing an interpretable model for medical professionals.
- The use of BP physiological determinants and hemodynamic factors (MAP, CO, and VR) to enhance our BP predictive model performance.
- The use of a classification task to enhance the regression model performance.
- Providing valuable independent predictions from high-performing models, i.e., giving information about BP status (normal, hypertension, or hypotension) and providing an estimate of MAP.
2. PPG Signal Processing and Features Extraction
The study was conducted in the form of a series of steps and experiments. First, the data collection, processing, and extraction of two sets of features: the commonly used temporal features and the proposed set of physiologically motivating features. Second, the implementation of traditional single-stage ANN and LSTM models trained on both sets of features and the development of the multi-stage model customized to be trained on the proposed set of features and derivation of other parameters.
Figure 1 illustrates an overview of the multi-step procedure that was executed to process the PPG signal and extract the features to train the traditional single-stage models and the proposed model. The dataset must be pre-processed to reject the out of band noise. Then, the signal should be segmented as a preparatory step for feature extraction.
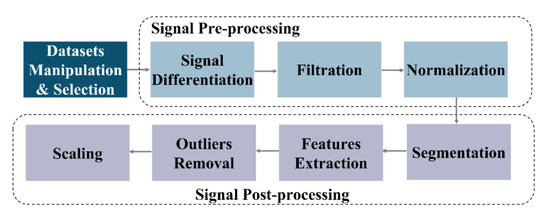
Figure 1.
PPG Signal Processing and Feature Extraction.
The first step was to select the dataset to train the deep learning models. The dataset was acquired from a public database, Physionet’s MIMIC II [26]. The PPG and BP data of 40 subjects were obtained. The corresponding systolic BP (SBP) and diastolic BP (DBP) were extracted from the Arterial Blood Pressure (ABP) signal. To qualify the database for training the classification model (first stage of the multi-stage model), we labeled the BP category based on the extracted SBP and DBP values into 0 (normotension), 1 (hypertension), and 2 (hypotension) classes. Figure 2 illustrates the SBP and DBP values distribution in the dataset we used.
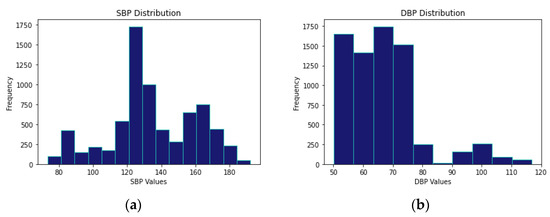
Figure 2.
SBP and DBP Values Distribution in the used Dataset. (a) SBP Values Distribution. (b) DBP Values Distribution.
2.1. Signal Pre-Processing
- Differentiation: First and second derivatives of the PPG signal were computed prior to feature extraction to visualize the dicrotic notch, which tends to disappear in the original PPG signal in particular cases.
- Filtering: Like other physiological signals, PPG signals are susceptible to motion artifacts and other noise sources that cause signal distortion. Further, signal differentiation amplifies the high-frequency components and adds intensive noise to the signal. Accordingly, the raw PPG signals de-noising process was performed using an IIR Butterworth digital Low-Pass Filter (LPF) designed with a cut-off frequency of 5 Hz.
- Normalization: The PPG signal was normalized to a particular range (0 to 1) using min-max Formula (1).
Since all the critical points (peaks, valleys, and notch) can be detected from the second derivative, we used the normalized filtered second derivative PPG signal to extract the features. In Figure 3, the critical points of the PPG signals are shown on the acquired original PPG signal aligned with the normalized filtered second derivative PPG.
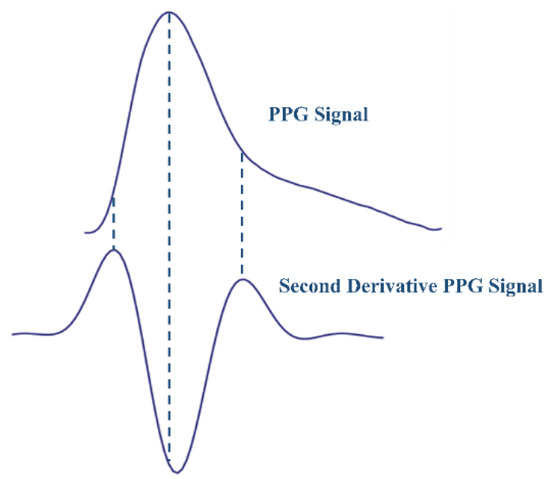
Figure 3.
The Acquired PPG Signal and the Filtered Normalized Second Derivative.
2.2. Signal Post-Processing
- Peak Detection: An automated algorithm was developed to detect peaks, valleys, and dicrotic notches (the local minimum, localized between the peak and valley of each segment) using the adaptive thresholding technique and comparison of neighboring digital samples technique [27].
- Segmentation: The PPG signal was segmented into frames, each containing two valleys and one systolic peak, representing one cardiac cycle. Using the peak detection algorithm, peaks and valleys were detected with a high accuracy of approximately 99%. Accordingly, segments were generated based on detected valleys. Each segment is defined from a preceding valley (beginning of a segment) to a consecutive valley (end of a segment), including one peak. After the segmentation step, the total number of segments gained to train the models was 7186 segments, along with corresponding SBP and DBP values extracted from the Arterial Blood Pressure (ABP) signal.
- Feature Extraction: Two sets of features were extracted from PPG signals. See Table 1 and Figure 4. The first feature set contains commonly used temporal features, whereas the proposed set of features comprises only physiologically relevant features for BP estimation. For the commonly used features set, we selected six temporal features shown in Figure 4a. These features are the heart rate (HR), crest time (CT), diastolic time or peak-to-valley interval (PVI), valley-to-valley interval (VVI), peak-to-peak interval (PPI), and peak width at notch level (PWn). PWn was a new feature to be tested.
For the proposed set of features, we extracted eight physiologically motivating features, illustrated in Figure 4b. These features are peak width at half amplitude (PW0.5), systolic amplitude (SA), systolic-to-notch amplitude difference (SN), HR, stroke volume (SV), PPI, CO, and PWn. PPI was included as it is necessary for HR calculation. PWn was included to be combined with SN, providing the model with the notch position and the corresponding width.

Table 1.
The Two Sets of Features Extracted.
Table 1.
The Two Sets of Features Extracted.
| Feature Set | Features | References |
|---|---|---|
| Proposed Features | CO, HR, SV, PPI, PW0.5, SA, SN, PWn. | [16,17,18,19,20,21,22] |
| Commonly Used Features | HR, PVI, VVI, PPI, CT, PWn. | [2,4,22] |

Figure 4.
(a) Commonly Used Features Set. (b) Proposed Set of Features (Physiologically Motivating).
The area under the curve (AUC) was computed in a valley-to-valley temporal window using the Simpson integration rule (approximated by second-order polynomial quadratic interpolant) using (2) [28].
where ∆t = ((valley + 1) − valley)/n, t0 = valley (beginning of segment), tn = valley + 1 (end of segment), and t0,…, tn are the ends of the n subintervals. As mentioned earlier, CO, SV, HR, and VR represent the hemodynamic parameters that govern blood flow and pressure. Since the area under the pulsatile blood flow PPG waveform is proportional to SV, thus, a quantity proportional to cardiac output could be calculated as the instantaneous product of SV(AUC) and HR using (3) [29].
CO = SV ∗ HR
- 4.
- Outliers Removal: Outliers were detected and removed using the statistical interquartile rule [30].
- 5.
- Scaling: Scaling was accomplished using the Z-score method expressed by (4).
3. The Proposed Multi-Stage Model
3.1. Features Analysis
We performed a quantitative Principal Components Analysis (PCA) analysis to analyze the variance that each feature contributes to the main Principal Components (PCs). A correlation analysis was performed to assess the correlation between features. The Analysis of Variance (ANOVA) method was used to examine the influence of features on the target BP classes (for the classification model). In both sets of features, the absolute total variance was obtained for each feature using the first principal components achieving 95% of the overall variance. The results of these analyses are shown in Table 2 and Table 3 for both the commonly used features and the proposed features, respectively.
Table 2.
The Analysis of Commonly Used Features Set.
Table 3.
The Analysis of the Proposed Features Set.
As can be noted in Table 2, PPI, VVI, and HR features in the commonly used features set to have approximately similar total variance contributions (PPI: 0.61, HR:0.61, VVI:0.62). Further, we can see that these three features have very high similar ANOVA scores compared to other features in this dataset. The reason behind that is the high correlation between these features (PPI, VVI, and HR).
The proposed feature set analysis is presented in Table 3. Based on correlation and PCA analyses, PPI and SV are highly correlated with HR and CO. Thus, they are likely to be redundant features. These two features were removed to be left with six features in the proposed set; see Table 4. This allows for a fairer comparison since the set of commonly used features contains six features. Further, the correlation analysis of the proposed features clearly showed that other features, such as PW0.5, SA, SN and PWn, are not highly correlated with other features and have a unique variance contribution, meaning they are independent and non-redundant. If we take a deeper look at the total variance contribution and ANOVA scores of the six selected features (CO, HR, PW0.5, SA, SN and PWn) in the proposed set after reduction, we will find that the total variance contributed by each feature is relatively high. In addition, the ANOVA scores of the selected features showed a more balanced distribution compared to the commonly used feature set. This means that the proposed selected features have more variability and a high degree of separability between the three classes of BP, considering that they are not highly correlated and each one has its own significant contribution and independence.
Table 4.
Proposed Feature Selection.
3.2. Deep Learning Models
3.2.1. LSTM
The LSTM network was used to build both the traditional LSTM-based models and the proposed multi-stage LSTM model. LSTM was selected because of its powerful ability to learn temporal and long-term dependencies of time-series sequential PPG features.
As shown in Figure 5, the input of our LSTM is six timestep sequential features matrix (5), where T is the timesteps and n is the dimension of the features vector. The sequential input matrix is passed to six LSTM cells (6 timesteps). LSTM uses a gating mechanism to regulate the flow of sequential information to store important data and forget useless information. Each LSTM cell has three main gates: the forget gate, input gate, and output gate.
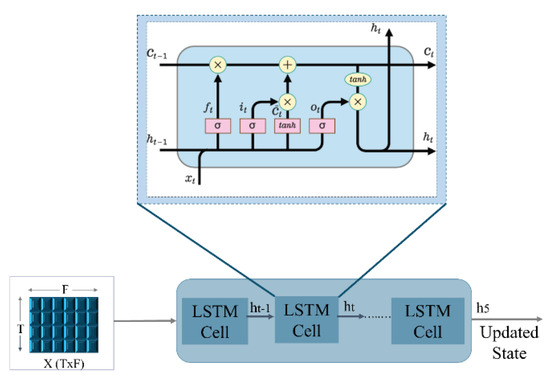
Figure 5.
LSTM Cells Internal Structure.
The output of the forget gate is a sigmoid function denoted by applied to the weighted previous hidden state wf [ht−1] with the added bias of the gate (6). The forget gate decides which pieces of information in the sequential data are irrelevant and must not be considered. Then, the input gate uses a sigmoid function to add new important information from the current timestep (7) to be passed to the candidate cell state . applies a tanh function to the hidden state of the previous timestamp t-1 and the input x at the current timestamp t (8) to get the memory vector of the new information for the current timestamp. The cell state stores information about what needs to be forgotten from the previous state and what needs to be kept from the current timestep of the sequence (9). Finally, in the output gate , a sigmoid function is passed through the previous hidden state ht−1 and the current input data (10). The output is then passed along with tanh of the updated cell state to obtain the current hidden state (11) (the final output of the LSTM block at timestamp t). The process is repeated at each of the six timesteps to get the final hidden state h5 from the last LSTM cell, which is then passed to the other layers to make predictions.
3.2.2. Traditional Single-Stage ANN and LSTM
The experimental design of this study was geared toward, first, the investigation of the significance of the two sets of features on traditional models. Second, the comparison between the traditional models and the proposed model’s performance on the proposed features set. Third, the impact of the two sets of features on the performance of different networks (ANN and LSTM). Accordingly, a conventional feed-forward backpropagation ANN was constructed with two hidden fully connected (FC) layers and two output neurons in the output layer to simultaneously estimate SBP and DBP. Then, an LSTM-based single-stage model was built with two hidden layers. The input layer of the LSTM model was fed with one batch of six features at six different sequential inputs (timestamps) at a time. Four conventional models were implemented. Each of the two networks (ANN and LSTM) was first trained on the commonly used features set (HR, PVI, VVI, PPI, CT, PWn) and second on the proposed features set (CO, HR, PW0.5, SA, SN, PWn). The design parameters of both traditional models are described in Table 5. The number of epochs was 1000 for both traditional models. Figure 6 shows the traditional models’ designs. For all models implemented in this paper, the batch size used was 32 and ADAM was used for optimization.
Table 5.
Traditional ANN and LSTM Models Design Parameters.
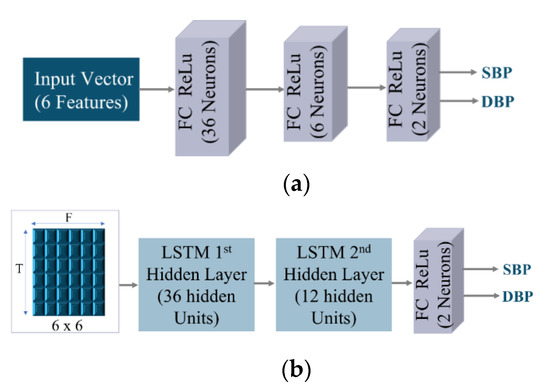
Figure 6.
Traditional Model Design. (a) ANN Model. (b) LSTM Model.
The loss metric Mean Absolute Error (MAE) was calculated using (12).
3.2.3. Proposed Multi-Stage Model
We propose a novel multi-stage model with a three-step prediction approach to utilize the physiologically rich domain information contained in the PPG signals for BP prediction. In contrast to other methods, which used automated feature extraction techniques with a large number of features, raising several considerations about the efficiency, complexity, and human interpretability of such models, our proposed model only uses six evidence-based physiologically motivating features (PW0.5, SA, SN, HR, CO, and PWn) mentioned earlier to derive other physiological targets (MAP and VR) and BP class to further boost the estimation accuracy and reduce errors.
The schematic representation of the proposed model is displayed in Figure 7. Figure 7a shows the general representation of the proposed model. Figure 7b demonstrates the proposed LSTM multi-stage model design. The proposed model consists of three successive stages trained independently. Each stage has its intended function that contributes significantly to the final stage. The first stage is mainly used to classify BP (normotension, hypertension, and hypotension). The second stage uses the six selected proposed features along with the BP class predicted by the first stage to predict MAP and, consequently, compute the approximated value corresponding to VR from the predicted MAP and CO (extracted from the PPG signal). The first and second-stage pre-trained source models act as feature extractors. All outputs derived from the two previous stages, along with the six physiologically motivating features, were transformed into a new feature space enriched with physiological information to feed the last stage and estimate SBP and DBP. In this fashion, the final stage representing the main task of BP prediction, obtains information from other tasks. This allows for the preservation of knowledge from previous stages, inductive and dynamic transfer of data, and the exploitation of commonalities and domain information among the tasks. Therefore, by assembling the predictions made by subnetworks, the final stage model’s robustness and performance are expected to improve.
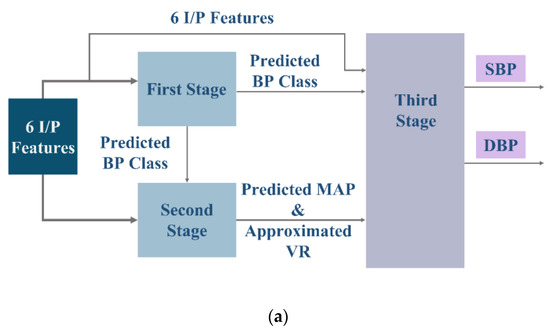
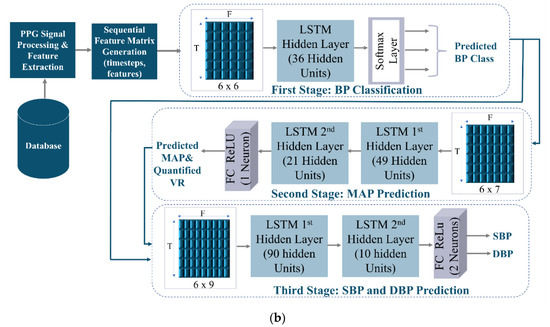
Figure 7.
The proposed LSTM Multi-Stage Model. (a) General Architecture of the Proposed Multi-Stage Model. (b) The Proposed LSTM Multi-Stage Model Design.
Figure 7b depicts the detailed design of the proposed multi-stage model. The features passed to each stage of the proposed model are the following:
First-Stage Input Features = {CO, HR, PW0.5, SA, SN, PWn.}.
Second-Stage Input Features = {CO, HR, PW0.5, SA, SN, PWn., Predicted BP Class}.
Third-Stage Input Features = {CO, HR, PW0.5, SA, SN, PWn., Predicted BP Class, Predicted MAP, Approximated VR}.
The design of the proposed multi-stage LSTM model shown in Figure 7b is as follows:
- 1.
- First-Stage (BP Classification): The first stage is a multi-class classifier predictive model that approximates a mapping function from sequential input features. The objective of this stage is to identify the blood pressure class among three possible ranges. The model was designed with one hidden LSTM layer. In the dense output FC layer, a Softmax activation function was used. The Softmax function is applied to the final hidden state h5 of the last LSTM cell to obtain a vector of probabilities distribution of possible classes (13). Which is then mapped to one output class (the one with the highest probability) using the argmax function (14).
The purpose of the classification model is to enhance the regression output of the second stage and the final stage. The range of MAP values predicted in the second stage, and the SBP and DBP values predicted in the third stage can vary enormously. Using the BP class predicted by the first stage, the range of predictions of the following stages will be restricted to a specific limit and not confused with a wide range of intervals.
BP Class = argmax (BP Class Probabilities)
The loss was measured by categorical cross-entropy, and the loss metric was the accuracy of classification. The performance of the classifier was measured by the following metrics: Precision and Recall of each category; both metrics were calculated using (15) and (16) [23], respectively.
- 2.
- Second-Stage (MAP Prediction and VR Approximate Quantification): The reference MAP was extracted from (17), and accordingly, reference VR was computed from reference MAP and the extracted CO (from PPG) using (18). When MAP is divided by CO, we can obtain a quantity that is proportional to VR. In the second stage, the six proposed sequential input features merged with the BP class predicted by stage one are passed to the input layer. Two hidden LSTM layers were employed. The output layer is a dense layer consisting of one neuron to produce a prediction of MAP. The ReLU activation function was applied to the final hidden state h5 of the second LSTM hidden layer. The potential benefit of predicting MAP is that it is a relevant index that carries both SBP and DBP components, as expressed by (17). This means it can convey decisive significant information, thus, promoting the decision-making process of the last stage to predict final SBP and DBP values. Moreover, approximated VR was quantified by dividing the predicted MAP over the CO. The primary advantage of combining these four parameters (predicted class, predicted MAP, extracted CO, and approximated VR) is that it will intensify the decisive physiological information and the diagnostic parameters being transferred to the final stage.
MAP = DBP + 1/3(SBP − DBP)
MAP = CO ∗ SVR
- 3.
- Third-Stage (SBP and DBP Prediction): The final stage of the multi-stage model is intended to predict BP values from the six extracted proposed feature input sequence combined with other predictions derived from the previous two stages (BP Class, MAP, approximated VR). The model consists of two LSTM hidden layers and a dense layer (2 neurons) with a ReLU activation function applied to the final hidden state h5 of the second layer to produce SBP and DBP simultaneously. Accordingly, the final stage is expected to provide outstanding performance since it exploits preserved information and inherent correlations from the previous sub-sequence stages, physiologically motivating features, and BP, considering that MAP, CO, and VR indicate physiological changes in BP.
The same proposed multi-stage approach was implemented using an ANN network instead of LSTM to compare the performance of both networks on the proposed set of features. Further, to investigate if the proposed features will perform remarkably on both networks, Table 6 and Table 7 show the proposed multi-stage models’ designs of both ANN and LSTM. The number of epochs in the classification stage was 500, while it was 1000 epochs in all other regression stages.
Table 6.
ANN Multi-Stage Model Design Parameters.
Table 7.
LSTM Multi-Stage Model Design Parameters.
4. Results and Discussion
Table 8 introduces the results of the traditional models trained on both the commonly used features set and the proposed features set using both ANN and LSTM networks. Further, the proposed models’ performance on the proposed set of features using ANN and LSTM networks is provided. The empirical results confirm the validity and reliability of our proposed algorithm. According to the universal standards of the Association for the Advancement of Medical Instrumentation (AAMI) for BP measurement systems, tolerable errors of 5 ± 8 mmHg are acceptable. Our ANN-based multi-stage model achieved 2.86 ± 2.62 for SBP and 1.54 ± 1.07 mmHg for DBP, whereas the proposed LSTM-based multi-stage model attained 2.03 ± 3.12 for SBP and 1.18 ± 1.70 mmHg for DBP, fulfilling the standard requirement. For MAP prediction, the multi-stage LSTM model achieved a MAE ± SD of 1.47 ± 2.00 and a BP classification accuracy of 99.3%.
Table 8.
Comparison Between Single-Stage Traditional Models and Proposed Multi-Stage Models Results.
As apparent in Table 8, prominently, the physiologically motivating features have shown a powerful impact on both ANN-based models and LSTM-based models in both traditional single-stage models and the proposed multi-stage models.
The proposed set of features resulted in drastic error reduction compared to models trained on the set of commonly used features. Compared to the ANN model trained with the commonly used features, the multi-stage ANN model trained with the proposed set of features resulted in a dramatic MAE reduction of 54.31% for SBP and 62.71% for DBP and decreased error variability by 69.57% by 86.21% for SBP and DBP, respectively. Compared to the single-stage LSTM trained on the commonly used features, the multi-stage LSTM model trained on the physiologically oriented features decreased MAE by 37.92% and 40.70% for SBP and DBP, respectively. Further, the SD of SBP was reduced by 41.79% and of DBP by 61.96%. The observed reduction in error could be attributed mainly to the proposed set of features and supplementarily to the proposed model topology.
The experimental findings were further analyzed employing a regression analysis graph. We used a scatter plot to visualize the relationship between the actual values and predictions. Figure 8 presents the ground-truth diagram of the predicted SBP values and the actual SBP values of the four main models: traditional single-stage ANN and LSTM models (trained on the commonly used features) and the proposed multi-stage ANN and LSTM models (trained on the proposed set of features). The comparative graphs reveal that the LSTM multi-stage model yields increasingly stable predictions and a high degree of collinearity (R2 = 0.98). The single-stage LSTM model achieved R2 = 0.93 using the set of commonly used features, and the single-stage ANN showed R2 = 0.82 with a considerable fluctuations between predicted and actual values. The residual errors produced by the models were analyzed by means of Mean Squared Error (MSE). For the traditional, single-stage models trained on the commonly used features set, the ANN model achieved a poor MSE of 113.41, while the LSTM model achieved a good MSE of 39.49 due to the robustness of the LSTM network. For the proposed models trained on the proposed features, the ANN multi-stage model attained a MSE of 36.76. On the other hand, the LSTM multi-stage model achieved a MSE of 13.91, registering the best MSE among all other models. Overall, our proposed multi-stage LSTM model obtained the most robust results compared to other models. The ANN multi-stage model trained on the proposed features showed remarkable results compared to the traditional ANN trained on the commonly used features.
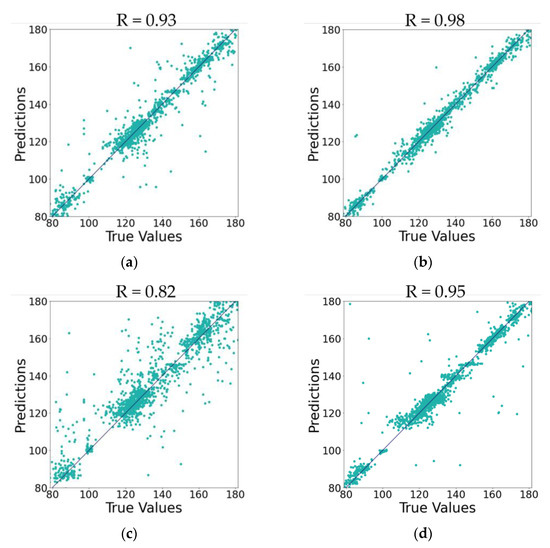
Figure 8.
Ground-Truth Graph for SBP True Values vs. Predictions of Single-stage Models (trained on commonly used features set) and Multi-stage Models (trained on proposed features set). (a) For Single-Stage LSTM. (b) For Multi-Stage LSTM. (c) For Single-Stage ANN. (d) For Multi-Stage ANN.
Additional analysis was performed using the permutation importance technique to assess the feature impact on the proposed model, the decrease in model performance when a feature is randomly shuffled. It was conducted on the last stage of the multi-stage ANN model. The result of this analysis revealed the ranking of the most influential feature to the least: Predicted MAP, CO, quantified VR, Predicted Class, HR, PW0.5, SA, SN, PWn. The Predicted MAP, CO, and quantified VR are the top-ranking impactful features, which validates that MAP, cardiac output, and vascular resistance are the most impactful features for BP estimation and shows the extreme contributions of the physiologically oriented features and the proposed multi-stage approach.
The outstanding performance of both the traditional models and the proposed model, either using ANN or LSTM networks trained on physiologically oriented features (shown in Table 8), suggests the strong link that exists between the proposed set of features (physiologically motivating) and BP.
The present results in this study make several noteworthy contributions in at least three major aspects. First, the proposed set of physiologically motivating features forms an optimal, compact, and minimal predictive feature set. Second, the multi-stage model serves as a supplementary tool for these features to promote BP prediction accuracy by means of intrinsic correlations between BP and physiological features, thus achieving a premium performance. Third, the LSTM and ANN networks exhibited considerable performance variability in conventional single-stage models (trained on a commonly used features set) but comparable performance in multi-stage models trained on the proposed set of features. This signifies the dominance and importance of the proposed feature set. A possible explanation of the LSTM network’s preference over the ANN network is that it carries an inherent advantageous ability to model temporal variations and handling long-term dependencies.
Table 9 demonstrates a comparison between the performance of our proposed model and the state-of-the-art models. The most intriguing observation to emerge from the data comparison provided in Table 9 is that compared to existing complex CNN-based state-of-art models, our LSTM-based multi-stage model trained with only six features (physiologically motivating) stands out by providing the best remarkable performance. The multi-stage CNN-LSTM model proposed in [10] showed satisfactory performance; 3.97 ± 5.55 for SBP and 2.10 ± 2.84 for DBP on 200 subjects. The model presented in [13] has an acceptable error; however, the data size is small. The model introduced in [9] has a relatively high but acceptable standard deviation, particularly for SBP (5.59 ± 7.25) compared to other models. With a comparable number of subjects, the proposed CNN-LSTM model in [11] obtained 4.43 ± 6.09 for SBP and 3.23 ± 4.75 for DBP on 45 subjects. Whereas our model achieved a MAE ± SD of 2.03 ± 3.12 for SBP and 1.18 ± 1.70 for DBP on 40 subjects. Compared to the other state-of-the-art models, the performance of our model achieved superior performance. Hinting at the compelling nature, sufficiency, and efficiency of the proposed features set reinforced with the logical ground of BP physiological determinants correlation with PPG signals. This resulted in prominent performance with efficient and balanced complexity and is further bolstered with the proposed multi-stage topology.
Table 9.
Comparison with the State-of-art Models.
Future research should consider the potential effects of notch disappearance in some cases more carefully if features were to be extracted directly from the original PPG signal. Researchers are encouraged to improve signal processing algorithms to enhance notch visibility and extract the proposed features from the original PPG signal. Notch detection is important for extracting SN, which has been linked to vascular tone, as mentioned earlier. Future investigations on a larger data size are necessary to validate the conclusions drawn from this study.
5. Conclusions
Although considerable research has been devoted to BP estimation using PPG and ECG signals, less attention has been paid to the use of only physiologically influential features based on the hemodynamic parameters that govern BP regulation. In this paper, we proposed a novel multi-stage model for cuffless BP estimation using physiologically motivating features. The features were selected based on the solid rationale of BP physiological determinants having a strong correlation with specific features of PPG signals. The superior performance of the proposed multi-stage model provides affirmative evidence that the selected transferable features among the stages combined with the powerful multi-stage topology have a remarkable role in enhancing blood pressure estimation accuracy, which also signifies the convincing quality and sufficiency of the proposed features set. This paper emphasized the significance of proper feature formation, taking into consideration the efficiency, accuracy, and interpretability of the model.
Author Contributions
Conceptualization, M.A.; methodology N.F.A.; software, N.F.A.; validation, N.F.A.; formal analysis, N.F.A.; investigation, N.F.A.; resources, M.A.; data curation, N.F.A.; writing—original draft preparation, N.F.A.; writing—review and editing, N.F.A.; visualization, N.F.A.; supervision, M.A.; project administration, M.A.; funding acquisition, M.A. All authors have read and agreed to the published version of the manuscript.
Funding
This research was funded by United Arab Emirates University, Arab Emirates, under grant G00003441.
Data Availability Statement
The data generated during and/or analyzed during the current study are not publicly available but are available from the corresponding author on reasonable request.
Conflicts of Interest
There is no conflict of interest.
References
- Maqsood, S.; Xu, S.; Tran, S.; Garg, S.; Springer, M.; Karunanithi, M.; Mohawesh, R. A survey: From shallow to deep machine learning approaches for blood pressure estimation using biosensors. Expert Syst. Appl. 2022, 197, 116788. [Google Scholar] [CrossRef]
- El-Hajj, C.; Kyriacou, P. Cuffless blood pressure estimation from PPG signals and its derivatives using deep learning models. Biomed. Signal Process Control 2021, 70, 102984. [Google Scholar] [CrossRef]
- Wang, G.; Atef, M.; Lian, Y. Towards a Continuous Non-Invasive Cuffless Blood Pressure Monitoring System Using PPG: Systems and Circuits Review. IEEE Circuits Syst. Mag. 2018, 18, 6–26. [Google Scholar] [CrossRef]
- Elgendi, M. On the Analysis of Fingertip Photoplethysmogram Signals. Curr. Cardiol. Rev. 2012, 8, 14–25. [Google Scholar] [CrossRef]
- Elgendi, M.; Fletcher, R.; Liang, Y.; Howard, N.; Lovell, N.H.; Abbott, D.; Lim, K.; Ward, R. The use of photoplethysmography for assessing hypertension. NPJ Digit. Med. 2019, 2, 60. [Google Scholar] [CrossRef] [PubMed]
- Castaneda, D.; Esparza, A.; Ghamari, M.; Soltanpur, C.; Nazeran, H. A review on wearable photoplethysmography sensors and their potential future applications in health care. Int. J. Biosens. Bioelectron. 2018, 4, 195–202. [Google Scholar] [CrossRef]
- Gaurav, A.; Maheedhar, M.; Tiwari, V.N.; Narayanan, R. Cuff-less PPG based continuous blood pressure monitoring—A smartphone-based approach. In Proceedings of the 2016 38th Annual International Conference of the IEEE Engineering in Medicine and Biology Society (EMBC), Orlando, FL, USA, 16–20 August 2016. [Google Scholar]
- Liu, M.; Po, L.-M.; Fu, H. Cuffless Blood Pressure Estimation Based on Photoplethysmography Signal and Its Second Derivative. Int. J. Comput. Theory Eng. 2017, 9, 202–206. [Google Scholar] [CrossRef]
- Rong, M.; Li, K. A multi-type features fusion neural network for blood pressure prediction based on photoplethysmography. Biomed. Signal Process Control 2021, 68, 102772. [Google Scholar] [CrossRef]
- Esmaelpoor, J.; Moradi, M.H.; Kadkhodamohammadi, A. A multistage deep neural network model for blood pressure estimation using photoplethysmogram signals. Comput. Biol. Med. 2020, 120, 103719. [Google Scholar] [CrossRef]
- Yang, S.; Zhang, Y.; Cho, S.-Y.; Correia, R.; Morgan, S.P. Non-invasive cuff-less blood pressure estimation using a hybrid deep learning model. Opt. Quantum Electron. 2021, 53, 93. [Google Scholar] [CrossRef]
- Leitner, J.; Chiang, P.-H.; Dey, S. Personalized Blood Pressure Estimation Using Photoplethysmography: A Transfer Learning Approach. IEEE J. Biomed. Health Inform. 2021, 26, 218–228. [Google Scholar] [CrossRef]
- Wang, C.; Yang, F.; Yuan, X.; Zhang, Y.; Chang, K.; Li, Z. An End-to-End Neural Network Model for Blood Pressure Estimation Using PPG Signal. In Artificial Intelligence in China; Liang, Q., Wang, W., Mu, J., Liu, X., Na, Z., Chen, B., Eds.; Springer: Singapore, 2020; pp. 262–272. [Google Scholar]
- Avolio, A.; Cox, J.; Louka, K.; Shirbani, F.; Tan, I.; Qasem, A.; Butlin, M. Challenges Presented by Cuffless Measurement of Blood Pressure if Adopted for Diagnosis and Treatment of Hypertension. Pulse 2022, 1–12. [Google Scholar] [CrossRef]
- Trammel, J.E.; Sapra, A. Physiology, Systemic Vascular Resistance. 2020. Available online: https://www.ncbi.nlm.nih.gov/books/NBK556075/ (accessed on 15 September 2022).
- Tusman, G.; Acosta, C.M.; Pulletz, S.; Böhm, S.H.; Scandurra, A.; Arca, J.M.; Madorno, M.; Sipmann, F.S. Photoplethysmographic characterization of vascular tone mediated changes in arterial pressure: An observational study. Int. J. Clin. Monit. Comput. 2018, 33, 815–824. [Google Scholar] [CrossRef]
- Park, J.; Seok, H.S.; Kim, S.-S.; Shin, H. Photoplethysmogram Analysis and Applications: An Integrative Review. Front. Physiol. 2022, 12, 808451. [Google Scholar] [CrossRef]
- Bhat, S.; Adam, M.; Hagiwara, Y.; Ng, E.Y.K. THE BIOPHYSICAL PARAMETER MEASUREMENTS FROM PPG SIGNAL. J. Mech. Med. Biol. 2017, 17, 1740005. [Google Scholar] [CrossRef]
- Awad, A.A.; Haddadin, A.S.; Tantawy, H.; Badr, T.M.; Stout, R.G.; Silverman, D.G.; Shelley, K.H. The relationship between the photoplethysmographic waveform and systemic vascular resistance. Int. J. Clin. Monit. Comput. 2007, 21, 365–372. [Google Scholar] [CrossRef]
- Vakily, A.; Parsaei, H.; Movahhedi, M.; Sahmeddini, M. A System for Continuous Estimating and Monitoring Cardiac Output via Arterial Waveform Analysis. J. Biomed. Phys. Eng. 2017, 7, 181–190. [Google Scholar]
- Augustine, S. Non-Invasive Estimation of blood pressure using a linear regression model from the photoplethysmogram (PPG) Signal. In Proceedings of the International Conference on Information Technology, Electronics and Communications, Hyderabad, India, 30–31 March 2013. [Google Scholar]
- Dagamseh, A.; Qananwah, Q.; Al Quran, H.; Ibrahim, K.S. Towards a portable-noninvasive blood pressure monitoring system utilizing the photoplethysmogram signal. Biomed. Opt. Express 2021, 12, 7732. [Google Scholar] [CrossRef]
- Mukhlif, A.A.; Al-Khateeb, B.; Mohammed, M.A. An extensive review of state-of-the-art transfer learning techniques used in medical imaging: Open issues and challenges. J. Intell. Syst. 2022, 31, 1085–1111. [Google Scholar] [CrossRef]
- Chen, J.; Cheng, L.; Yang, X.; Liang, J.; Quan, B.; Li, S. Joint Learning with both Classification and Regression Models for Age Prediction. J. Physics: Conf. Ser. 2019, 1168, 032016. [Google Scholar] [CrossRef]
- Wu, J.-Y.; Wu, M.; Chen, Z.; Li, X.; Yan, R. A joint classification-regression method for multi-stage remaining useful life prediction. J. Manuf. Syst. 2020, 58, 109–119. [Google Scholar] [CrossRef]
- PhysioNet. physionet.org. Available online: https://physionet.org/ (accessed on 15 September 2022).
- Argüello-Prada, E.J. The mountaineer’s method for peak detection in photoplethysmographic signals. Revista Facultad de Ingeniería Universidad de Antioquia 2018, 90, 42–50. [Google Scholar] [CrossRef]
- Süli, E.; Mayers, D.F. An Introduction to Numerical Analysis. Math. Comput. 1990, 54, 903. [Google Scholar] [CrossRef]
- King, J.; Lowery, D.R. Physiology, Cardiac Output. Nih.gov. 2019. Available online: https://www.ncbi.nlm.nih.gov/books/NBK470455/ (accessed on 15 September 2022).
- Vinutha, H.P.; Poornima, B.; Sagar, B.M. Detection of Outliers Using Interquartile Range Technique from Intrusion Dataset. In Information and Decision Sciences; Satapathy, S., Tavares, J., Bhateja, V., Mohanty, J., Eds.; Springer: Singapore, 2018; pp. 511–518. [Google Scholar] [CrossRef]
Publisher’s Note: MDPI stays neutral with regard to jurisdictional claims in published maps and institutional affiliations. |
© 2022 by the authors. Licensee MDPI, Basel, Switzerland. This article is an open access article distributed under the terms and conditions of the Creative Commons Attribution (CC BY) license (https://creativecommons.org/licenses/by/4.0/).