Article

A Synthesis of Pulse Influenza Vaccination Policies Using an Efficient Controlled Elitism Non-Dominated Sorting Genetic Algorithm (CENSGA)

College of Computer and Information Sciences, King Saud University, Riyadh 11543, Saudi Arabia
*
Author to whom correspondence should be addressed.
Electronics 2022, 11(22), 3711; https://doi.org/10.3390/electronics11223711
Submission received: 15 October 2022 / Revised: 4 November 2022 / Accepted: 10 November 2022 / Published: 13 November 2022
(This article belongs to the Special Issue Applications of Artificial Intelligence for Health)

Abstract

:
Seasonal influenza (also known as flu) is responsible for considerable morbidity and mortality across the globe. The three recognized pathogens that cause epidemics during the winter season are influenza A, B and C. The influenza virus is particularly dangerous due to its mutability. Vaccines are an effective tool in preventing seasonal influenza, and their formulas are updated yearly according to the WHO recommendations. However, in order to facilitate decision-making in the planning of the intervention, policymakers need information on the projected costs and quantities related to introducing the influenza vaccine in order to help governments obtain an optimal allocation of the vaccine each year. In this paper, an approach based on a Controlled Elitism Non-Dominated Sorting Genetic Algorithm (CENSGA) model is introduced to optimize the allocation of the influenza vaccination. A bi-objective model is formulated to control the infection volume, and reduce the unit cost of the vaccination campaign. An SIR (Susceptible–Infected–Recovered) model is employed for representing a potential epidemic. The model constraints are based on the epidemiological model, time management and vaccine quantity. A two-phase optimization process is proposed: guardian control followed by contingent controls. The proposed approach is an evolutionary metaheuristic multi-objective optimization algorithm with a local search procedure based on a hash table. Moreover, in order to optimize the scheduling of a set of policies over a predetermined time to form a complete campaign, an extended CENSGA is introduced with a variable-length chromosome (VLC) along with mutation and crossover operations. To validate the applicability of the proposed CENSGA, it is compared with the classical Non-Dominated Sorting Genetic Algorithm (NSGA-II). The results indicate that optimal vaccination campaigns with compromise tradeoffs between the two conflicting objectives can be designed effectively using CENSGA, providing policymakers with a number of alternatives to accommodate the best strategies. The results are analyzed using graphical and statistical comparisons in terms of cardinality, convergence, distribution and spread quality metrics, illustrating that the proposed CENSGA is effective and useful for determining the optimal vaccination allocation campaigns.

1. Introduction

Influenza, also known as flu, is a seasonal disease that is responsible for diverse health complications that can lead to hospitalization or even death [1]. The dynamic nature of the flu virus is reflected in its mutability from season to season, as well as in the fact that individuals who contract the disease may develop different symptoms. With the introduction of vaccinations for different diseases starting from the nineteenth century, this remarkable era of vaccination has had a promising influence on public health and population growth [2]. Since then, a succession of well-planned campaigns have been documented, for instance, to reduce or eradicate hepatitis, yellow fever, polio and measles [3]. Although vaccinations against contagious diseases are currently considered as an intuitive strategy to control an outbreak or epidemic, policymakers are still facing a big challenge in allocating vaccine doses to the public, especially for mutant diseases or pandemics, when the aim is eradicating the disease or keeping it within a tolerable level with minimal cost [4].
Vaccination strategy planning and optimization is a multi-disciplinary field in which mathematical models, epidemiological models, and decision-making are combined to allocate vaccine doses to the population. Major efforts in tackling vaccination allocation from multiple perspectives are usually defined using mathematical models, which can be solved with exact or approximate solution methods. In general, metaheuristic algorithms provide a useful tool that can help the decision-maker to realize an optimal (or near-optimal) solution within a reasonable time under multiple parameters, especially when the problem size is large and/or there exist a substantial number of underlying constraints. Nonetheless, the use of metaheuristics to develop an optimal vaccination allocation policy still has potential to be explored.
This work proposes a vaccination allocation policy using Pulse vaccination, based on an SIR (Susceptible–Infected–Recovered) epidemiological model that simulates the behavior of an infectious disease. A Pulse vaccination policy requires allocating vaccine doses in certain time steps, as well as vaccinating a predetermined proportion of the susceptible individuals, so that they become part of the recovered population, according to references [5,6,7]. This approach permits two types of control policies: heterogenous and homogeneous vaccination. Heterogenous vaccination involves conducting different sizes of Pulse control policies at arbitrary time periods. On the other hand, homogeneous vaccination refers to giving the same sizes of Pulse control vaccines at similar time periods. Both controls have multiple objectives, since the target is to minimize both the infection volume and the vaccination campaign costs. In this research, both types of Pulse vaccination are presented, since we formulate our problem as a two-phased Pulse vaccination that aims to model the flu dose allocation problem mathematically.
In every epidemic cycle, there are two distinct dynamic regimes: a guardian phase and a contingent phase. The guardian phase aims to keep the infection under control. The contingent phase requires a set of variant-timing vaccination policies on different quantities of susceptible individuals in order to form a complete optimal campaign. The idea is to synthesize optimal policy phases in order to reach a final combined optimal campaign. This allows for an effective controlling campaign, as shown in Section 5. The common methodology of vaccination found in the literature is based on a single vaccination policy used across the epidemic’s time horizon, which is an inapplicable policy in reality, and tends to be far from optimal [8,9,10]. Therefore, a more compromised paradigm has been recognized in some other works, which involves a compromise between the effectiveness of the campaign to control the epidemic and the cost of its implementation. This methodology involved multi-objective genetic optimization approaches. The multi-objective paradigm has been enhanced by features such as local searches for better convergence, a hash table to avoid the re-evaluating of repeated solutions, and some adaptations in genetic operators.
Genetic algorithms (GAs) are population-based algorithms in which a set of solutions is considered in each generation. GAs mimic the behavior of natural evolution, which optimizes biological features using the principles of selection, crossover (recombination) and mutation. The essential component of GAs is reproduction, wherein a set of candidate solutions engages in a selection process; solutions with good genes within the population are selected, making up a set of parents for the next generation. From this set of relatively good solutions, the next generation is formed by applying the processes of crossover, and on some occasions, mutation, to produce a set of offspring. Both parent and offspring sets are then combined to form a new population that engages again in the selection process. Solutions are ranked by their state of being dominated by, or being dominant over, other solutions based on their fitness (objective function of the solution). In the final generation, the best solutions are those belonging to the first front, which are not dominated by any other solution (known as the Pareto front) [11]. This paper deals with the question of finding an estimate of the Pareto-optimal set for the vaccination allocation problem using a Controlled Elitist NSGA-II (the Non-Dominated Sorting Genetic Algorithm) [12], which is a fast and elitist multi-objective optimization engine that makes selections considering both the non-dominance ranking and the crowding distance.
The research’s novelty in this multi-disciplinary field stems from its design of an enhanced multi-objective metaheuristic approach, namely, a Controlled Elitist Non-Dominated Sorting Genetic Algorithm (CENSGA), for optimizing the strategy of planning the flu vaccine allocation. For similar optimization problems, CENSGA has yielded promising results in complex instances with recurrent values of objective coefficients [13]. Thus, the proposed research’s adoption of CENSGA is inspired by the encouraging outcomes of the approach as applied to similar optimization domains. CENSGA has been identified as a robust optimization tool for reaching optimal parameters in diverse allocation problems, including supplier selection and order allocation [14], job–shop scheduling [15], the geometric configuration of parallel manipulators [16], hub location–allocation [17], and economic/emission load dispatch [18]. To tackle the vaccination allocation problem, the calibration of our model will be performed based on the related previous works [6], in order to approximate most of the problem parameters.
The remainder of this paper is organized as follows: In Section 2, related works are mentioned, followed by the introduction of some preliminaries in Section 3. After that, the problem description is formulated in Section 4, whereas the optimization model proposed to solve the vaccination allocation problem is explained in Section 5. In Section 6, parameter tuning is briefly discussed, while results and efficiency performance measures are given and discussed in Section 7 and Section 8, respectively. Finally, the concluding and perspective remarks are given in Section 9.

2. Literature Review

A well-known attempt to address the distribution of influenza vaccine shots optimally using metaheuristic techniques was carried out by Patel et al. [19]. The nature of an outbreak is generally non-linear, complex, and stochastic, and so the problem is difficult to solve optimally using mathematical models. Thus, the researchers simulated a stochastic pandemic, wherein genetic algorithms (GA) and Random Mutation Hill Climbing (RMHC) were used to minimize morbidity and mortality rates in the population with a given availability of vaccine doses. The results demonstrated that, under different coverage settings, the policy of vaccine distribution had a significant impact, compared to random mass vaccination.
Another related problem associated with infectious diseases is heterogeneity in transmission spread, vulnerability and contact frequencies in different populations [20]. Hu et al. [21] attempted to maximize the effects of distributing vaccine doses to susceptible individuals among different age groups. A differential evolution (DE) algorithm was developed to guide the distribution of the available vaccines optimally. The effects of vaccination duration and vaccine coverage were considered. The objective was to reduce the prevalence of infection incidences in the corresponding population. Performance was examined using a classical epidemiology model (in this case, SEIR (Susceptible–Exposed–Infected–Recovered)). The results indicate that the DE algorithm was promising in terms of offering a vaccine distribution solution. However, the researchers emphasized that the effectiveness of the vaccination depends on choosing the right vaccination time and duration. To address these issues, the role of planning in vaccination campaigns is a critical area that must reach a compromise in relation to the intended factors [22].
In the study of da Cruz et al. [6], the researchers considered an evolutionary multi-objective optimization algorithm and a stochastic simulation of the SIR epidemic dynamics. A bi-objective genetic algorithm, NSGA-II, was proposed as a way to lower control costs, as well as the number of infected individuals. The optimization process consisted of two stages, in which a complete set of policies is formed by applying different styles of heterogenous vaccination followed by homogenous policies to reduce the integral infection at first, and then keep the infection at below harmful levels. The optimization algorithm was combined with a quadratic approximation as a local search, as well as a hash table for information storage. The results were proven to be statistically significant compared to the conical form of NSGA-II. This work is closely related to our work in this paper.
One major contribution of our study is introducing a modified GA with a variable-length chromosome (VLC) extension to address the problem of the time-varying polices employed in the contingent phase. The most demanding issues when modeling VLC are the adaption of the GA processes and evaluating the fitness function. Numerous variations in VLCs have been introduced in the literature for several problems. In [23], the authors suggested a VLC to represent QoS-aware multi-path web-service composition plans in order to find the optimal path using GA. In their work, the customer service requirements are represented as a directed graph, and the service selection and composition problem is translated into a pattern-matching problem of service travel flow. The crossover process is updated and programmed by cut and splice models on the graph paths, while the mutation process remains as it is, similar to other GA processes. VLC has also been used on planning problems. For example, the authors in [24] proposed a VLC for a system that considers planning dilemmas, i.e., finding a good sequence of actions that satisfies the provided objectives. In addition, in the graph-based paradigm, Cruz-Piris et al. [25] modeled a VLC to address a road traffic coordination multi-path problem, in which the genes of the chromosome encode the path branch. VLC was also operated on the complex chromosome in genetic programming (GP) [26], which is a peer evolutionary technique used to find an optimal computer program. However, this approach was designed for problems represented in a tree-based structure only. In [27], the authors proposed a unique pixel-level Multi-Spectral (MS) very high-resolution (VHR) image segmentation algorithm based on variable-length NSGA-II clustering. In their approach, they maintained centroids for segmentation via gene value, which implies a flexible chromosome style used to address the shrinking or extending of chromosome length, without comprising the quality of the segmentation results. Adding this property with the necessary updating of crossover and mutation processes helped to amend the optimization’s main drawbacks; a similar approach is employed in our work.

3. Preliminaries

3.1. Multi-Objective Evolutionary Optimization

The multi-objective evolutionary algorithm (MOEA) is a stochastic optimization technique used to solve many NP-hard real-world optimization problems [28,29]. The mathematical definition of a multi-objective problem (MOP) can be formulated as (assuming a minimization problem):
minimize F(x) = (f1(x), f2(x), f3(x),…, fm(x))Tsubject to xΦ
The function F: Φ → Rm maps xΦ decision vector to M real-valued objective functions. Here, Φ is the decision (variable) space and Rm represents the objective space [30]. The objectives in Equation (1) predominately collide with each other. Finding a single solution that optimizes all objectives at once is usually not feasible, since the improvement of one objective may cause the deterioration of another [28]. Therefore, an MOEA aims to find a solution set by employing the concept of domination to find optimal Pareto solutions [29]. Pareto-optimal solutions are the best trade-off solutions in the population, obtained by calculating the objective value for each decision vector, which is used to determine the rank of dominance in the population; it then selects a potentially better solution to join the reproduced population [28,29]. The concepts of dominance and Pareto-optimality are formally defined as follows [28,30]:
Definition 1.
A vector X1 = (x1.1, …, x1.n)T is said to dominate another vector X2 = (x2.1, …, x2.n)T, denoted as X1 ≺ X2 iff ∀ i ∈ {1, …, n}, x1.i ≤ x2.i and X1 ≠ X2.
Definition 2.
A feasible solution x1 ∈ Φ of the problem in Equation (1) consisting of all non-dominated solutions is called a Pareto-optimal solution, iff ∄ x2 ∈ Φ such that F(x2) ≺ F(x1).
Definition 3.
A Pareto set (PS) consists of the collection of all the Pareto-optimal solutions, denoted as
PS = {x1 ∈ Φ| ∄x2 ∈ Φ, F(x2) ≺ F(x1)}.
The image of the PS in the objective space is called the Pareto front (PF)
PF = {F(x1)|x1 ∈ PS}.

3.2. Epidemiological Models

Epidemiological models examine the spread of infectious diseases in a population over a time period, by classifying the individuals in a set of disjoint classes. An individual within a certain time unit is recognized on one class only. Studying individuals’ behavior and their movements between compartments helps in assessing and forming appropriate procedures and policies to override or mitigate the effects of diseases as much as possible by vaccination, for example, or by applying any countermeasure means [7,31]. The following section describes the compartmental model used in this work, the SIR (Susceptible–Infected–Recovered) model.

SIR Model

The epidemiological model SIR was first outlined by Kermack and McKendrick in 1927 [32]. Their contribution is still the most widely used to illustrate infectious disease dynamics. The SIR model depicts the spread behavior of an infectious disease. For a contiguous virus such as influenza, the transmission dynamic comes in stages. It starts when individuals susceptible to contamination with the virus particle become infected after the incubation time passes. Subsequently, when the infectious individual has recovered and gained immunity, they move into the recovered class. If there is a reliable vaccine for the virus, the susceptible individual is moved instantly to the recovered class, without passing through the infected class, after the vaccine immunizes that individual [6,8] (Figure 1 demonstrates the SIR normal dynamics).
Mathematically, the SIR model uses three differential equations to describe an infectious disease. The initial value problem is presented in Equation (2). Here, S, I and R represent the numbers of individuals in each compartment, respectively: susceptible, infected and recovered. N is the total number of individuals in the population (it must be constant on each time unit t: S(t) + I(t) + R(t) = N, ∀ t ≥ 0). The parameters’ descriptions and their values are listed in Table 1. As N is supposed to be fixed across time, the birth rate and mortality rate are made equal [6].
d S d t = μ N μ S β I S N   ,   S 0 = S o   0   , d I d t = β I S N γ I μ I   ,   I 0 = I o   0 , d R d t = γ I μ R   ,   R 0 = R o   0 ,
A key number integrated with the epidemiological model is the reproduction number (R0); it represents the number of secondary cases generated from exposure to a primary individual [33]. The R0 value is determined by the epidemiological model used; for instance, for SIR, R0 = β/(μ + γ) [34]. The value of R0 is fixed and reflects the necessity of employing vaccination or any countermeasure strategies. If R0 < 1, then the disease dies out, and henceforth, tends towards an “infection-free equilibrium” without intervention; here, the endemic cannot hold the growth since each infected individual on average infects less than one member of the population. However, if R0 > 1, then the disease invades the population and stabilizes at an “endemic equilibrium”. In fact, the disease then turns to an endemic state, where the disease self-sustains in the population at a certain level, having the ability to propagate continuously [34,35]. The only way to diminish the effect of an infectious disease with R0 > 1 is by introducing a relevant countermeasure strategy, which in this study is vaccination. Another number that is key to the vaccination process is known as the effective reproduction number (REF). This represents the number of secondary cases generated from exposure to a primary individual during vaccination. The value of REF can be updated with the progress of vaccination, unlike R0. Therefore, reaching the state of REF < 1 is desirable in marking the end of the contiguous disease and halting the vaccination process. The value of REF can be derived from R0, by REF = s(t).R0 [36].
Using a specific time unit (t.u.), the period defined to determine a complete vaccination campaign is Tcntrl = Ttmp + Tgc = 150 (t.u.). At time unit 50, the system reaches “endemic equilibrium”, which is marked as Ttmp = 50 (t.u.), and this separates the time periods into before and after the infection stabilized. From the beginning of endemic equilibrium at Ttmp to Tcntrl, the optimization system is dedicated to finding a guardian control policy, while during the time period from τ0 to Ttmp, the optimization system operates under the contingent control phase to find a set of policies that are able to contain the infection, as shown in Figure 2. The guardian phase is better applied indefinitely, but since this is an unrealistic situation, it will be considered over a time period of length Tgc. The initial SIR condition for the contingent control is supposed to be (s0, i0, r0) = (0.99, 0.01, 0). However, for the guardian control, the initial system condition will be (se, ie, re) (0.067, 0.085, 0.848). Remarkably, the value of ie = 0.085 is greater than the acceptable tolerance ratio itol = 0.01, so this is a clear justification of the importance of deploying the guardian control policy in order to minimize the infection volume after completing the contingent control policies. The setup of SIR parameter values in this context mimics a hypothetical disease that is hard to control but for which there is an efficacious vaccine (refer to Table 1).

4. Problem Description

The role of vaccination allocation is a paramount aspect in controlling the spread of infectious diseases, especially influenza and other contagious viruses. The effect of vaccination in reducing the fraction of susceptible individuals in order to control the outbreak/epidemic at an early point in time is directly related to avoiding or reducing an increase in the overall infection volume. A two-fold effect of vaccination is well recognized: a direct advantage for the vaccinated, due to acquiring full or partial immunity, and an indirect benefit for the unvaccinated by reducing the risk of exposure to the disease [37].

Pulse Vaccine Allocation

This work is based on Pulse vaccination, which means that in a predetermined time period, there is a vaccination policy that will be applied on a certain percentage of susceptible individuals. This approach allows different/exact sizes of Pulse control actions at arbitrary/autonomous time points in order to form a complete vaccination campaign [3,6,7]. According to the work of A. C. S. DUSSE et al. [3], applying a deterministic (discrete) or stochastic (continuous) SIR system in Pulse vaccination yields negligible differences in the obtained findings. Moreover, the effects of Pulse vaccination on a continuous system can be observed as a transformation of the continuous system to a non-continuous system. The Pulse action affects the functions (S), (I), and (R) by turning them into step functions [3]. Thus, the aim of this research is to study Pulse vaccination control from a discrete time optimization point of view.
Let a vaccination time horizon defined by TR and Ω = {τ0, …,τN} represent a set of pivot points in the closed time interval [0,T], such that: τk < τk+1, τ0 = 0 and τN = T. These timeframes do not have to be equidistant. Consider an epidemiological model compartment x be a state variable belonging to Φ, and the control vaccination rates belonging to Uk = {v0, …,vk}, for all k = 0, …, N − 1. The system state at instance τk is denoted by x(τk) and the control action is denoted by u[k]. The instant of time that comes immediately after τk is τk+1, and is defined as a time instant “just after” the Pulse action in τk [5]. In short, the Pulse control problem is defined formally by T. Yang in [38] as follows:
Definition 4.
In a Pulse control problem, the state at each time τk, x(τk) ∈ Φ can be changed by x(τk+) = x(τk) + u[k], with u[k] ∈ Uk.
The dynamic of the system under the effect of Pulse control can be outlined in this form:
x(t + 1) = f(t, x(t)),
x(τk+) = x(τk) + u[k],
t∈(τk+,τk+1],
k = 0, …, N − 1,
Activating the control action (vaccination policy) at each timeframe establishes a new initial condition for the system to be the input of the subsequent timeframe. A complete vaccination campaign is constituted by linking each timeframe outcome with the next according to Equation (3); the whole process is in line with “Bellman’s Optimality Principle”: an optimal solution (set of policies) has the property, no matter of its initial policy, that the remaining policies must form an optimal solution from that initial policy [39].

5. Optimization Model

5.1. Proposed Model

This paper pursues multi-objective pulsive vaccination control using an open-loop continuous variable dynamic optimization procedure to solve the epidemiological problem, using the SIR model as the dynamic system and two multi-objective optimization techniques, NSGA-II and CENSGA, to be described in Section 5.2. Optimization is one of the most active and effective techniques used to control vaccination policies. The limited number of vaccine doses added to time constraints overwhelms the infection volume. A cost-effective vaccination campaign is crucial to mediate between the reductions in infection volume and the cost of vaccination administration.
The mathematical formulation of the problem is described as follows. Let xΦ constitute the decision variable vector; Φ ⊂ Rn is the decision variable space; [f1 (x), …, fm (x)] is the vector of objective functions to be minimized and X* is the set of optimal solutions, which consist of all decision vectors for which the corresponding objective vector cannot be ameliorated in any dimension without a recession in another one (recall the definitions in Section 2). In the optimization set-up, we must determine the chromosome representation and fitness equation that helps in examining the objective functions. For the sake of this work, we adopt the general framework methodology found in [3,6,7] to test the suggested CENSGA technique under the same conditions and parameter calibrations.
A.
Fitness Function
The fitness function contributes to determining the quality of a given chromosome (solution), and it returns numerical value(s) reflecting the evaluation status of the instance. In determining the fitness equation, it is necessary to combine the objectives and constraints to obtain a set of feasible chromosome instances. Essentially, the goal here is minimizing the volume of an infected population over time and, at the same time, to obtain a campaign that offers an effective cost within the vaccination policies [3,6].
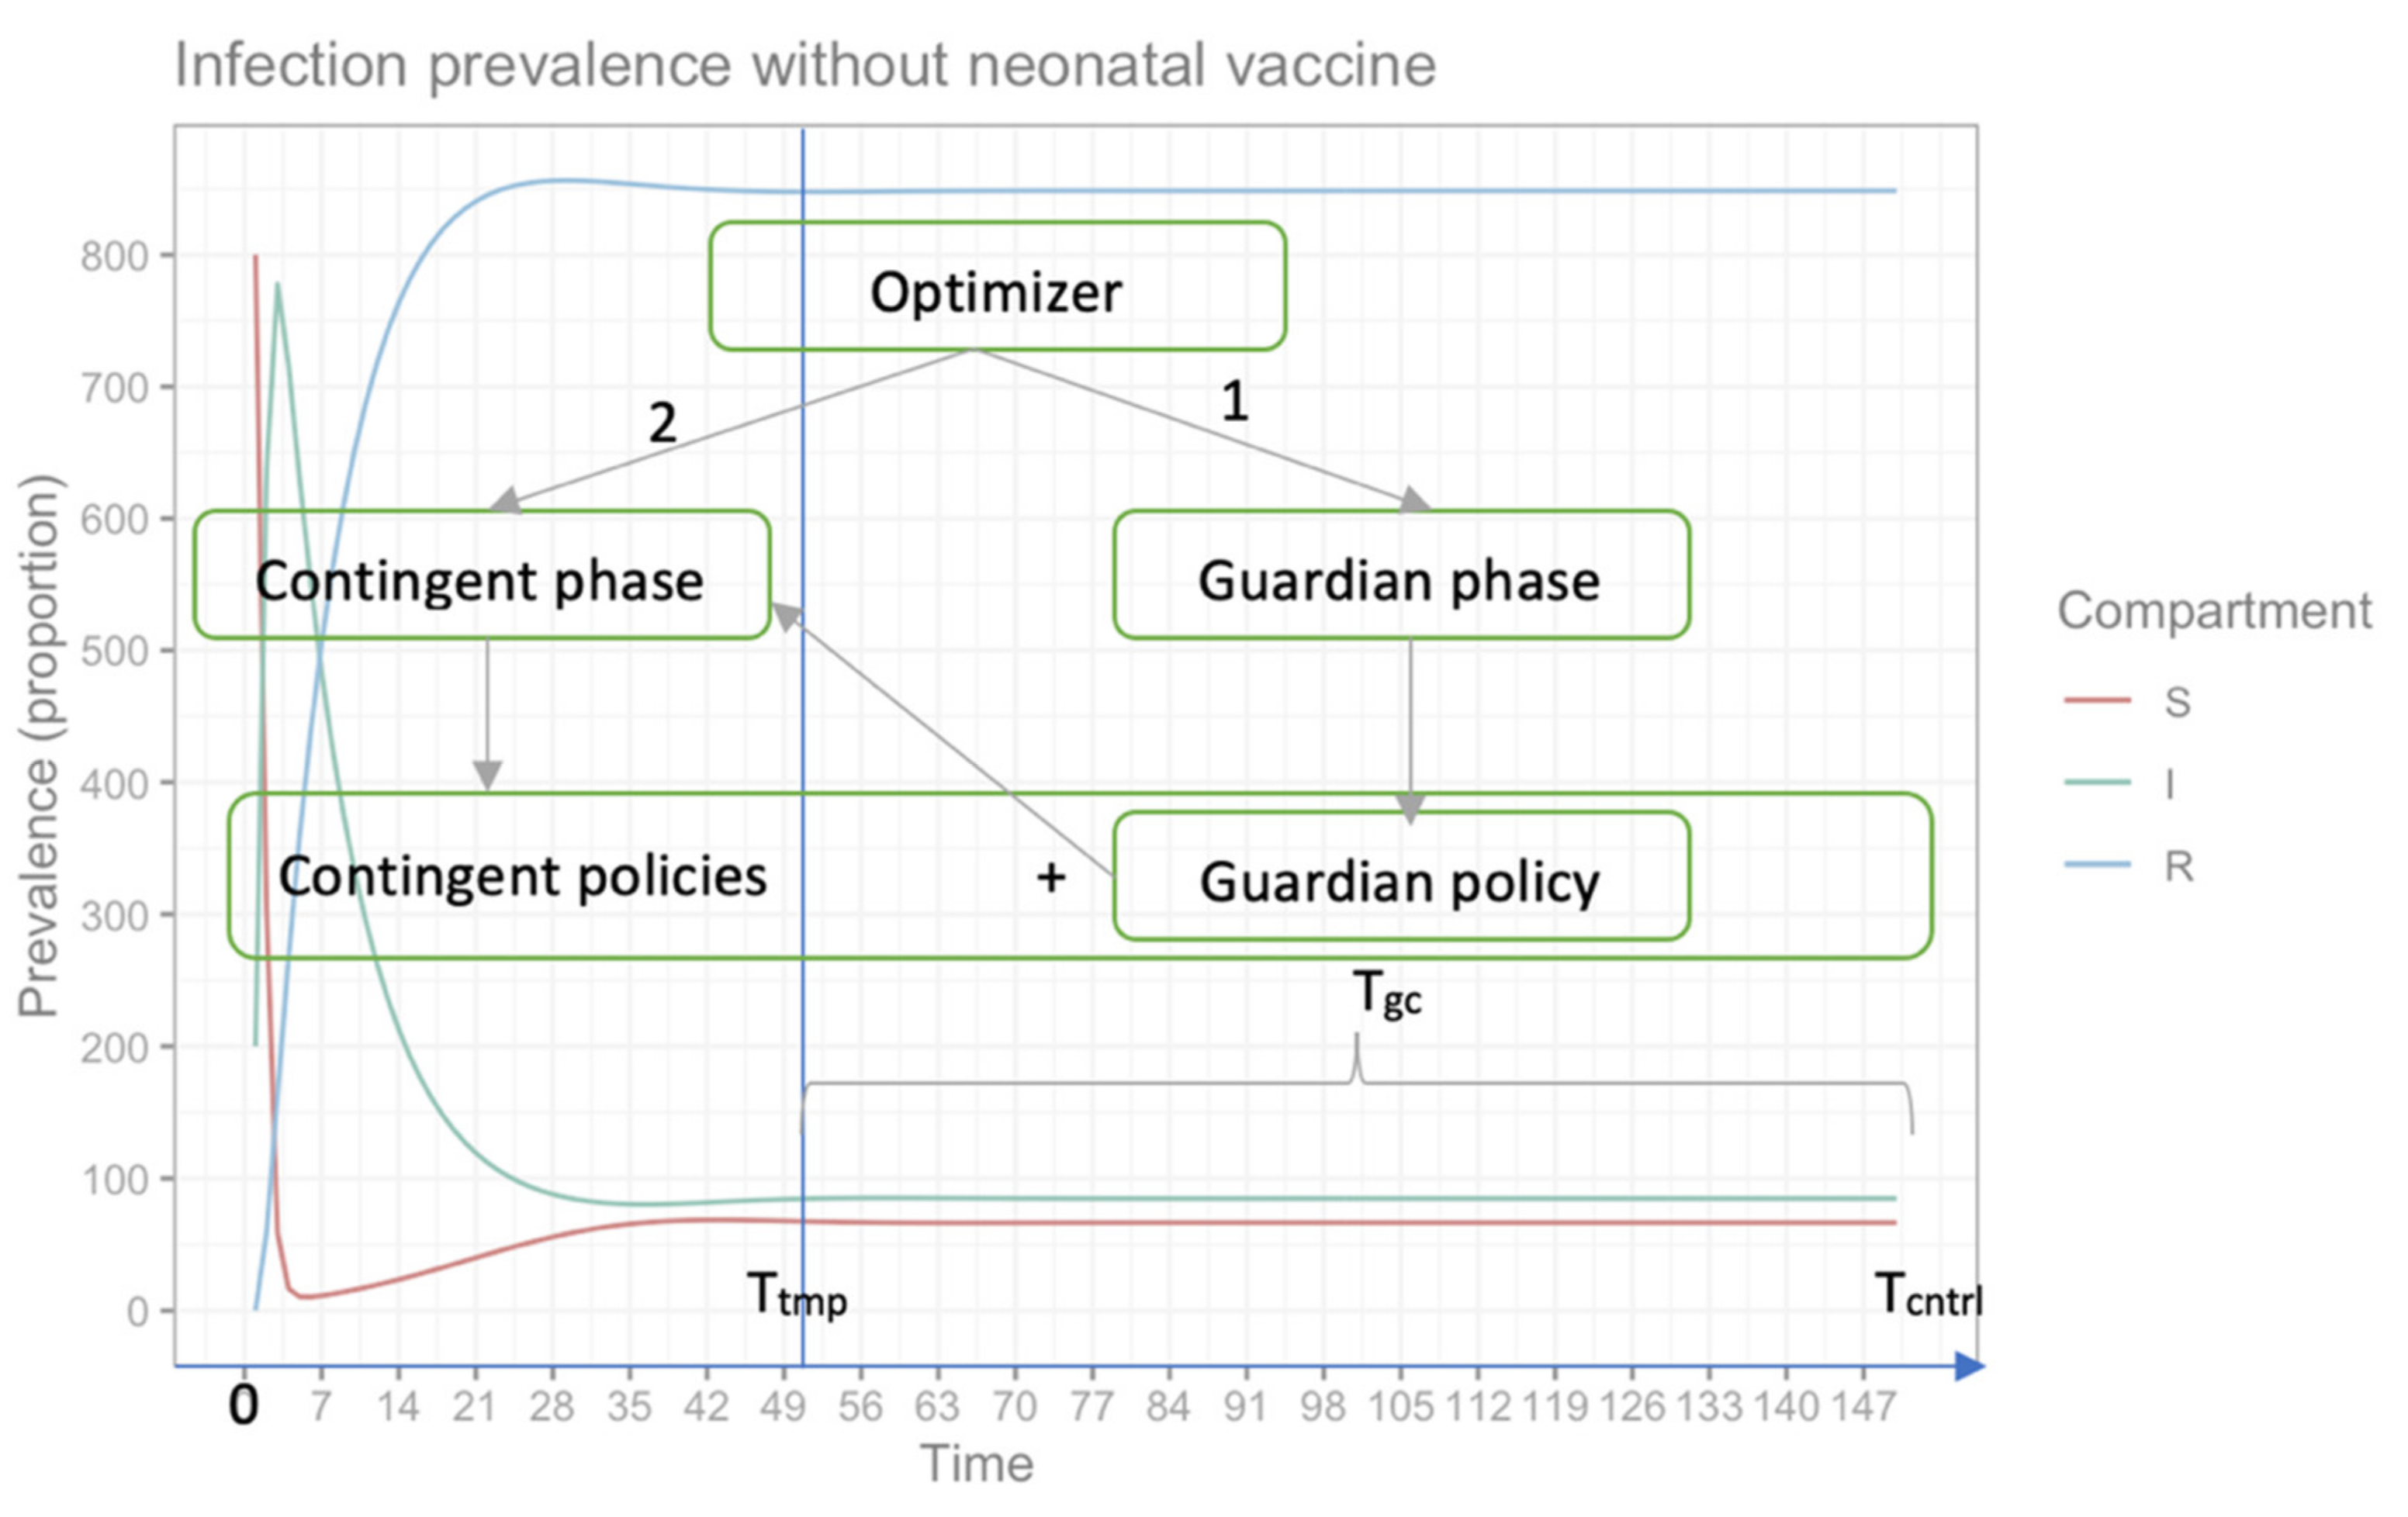
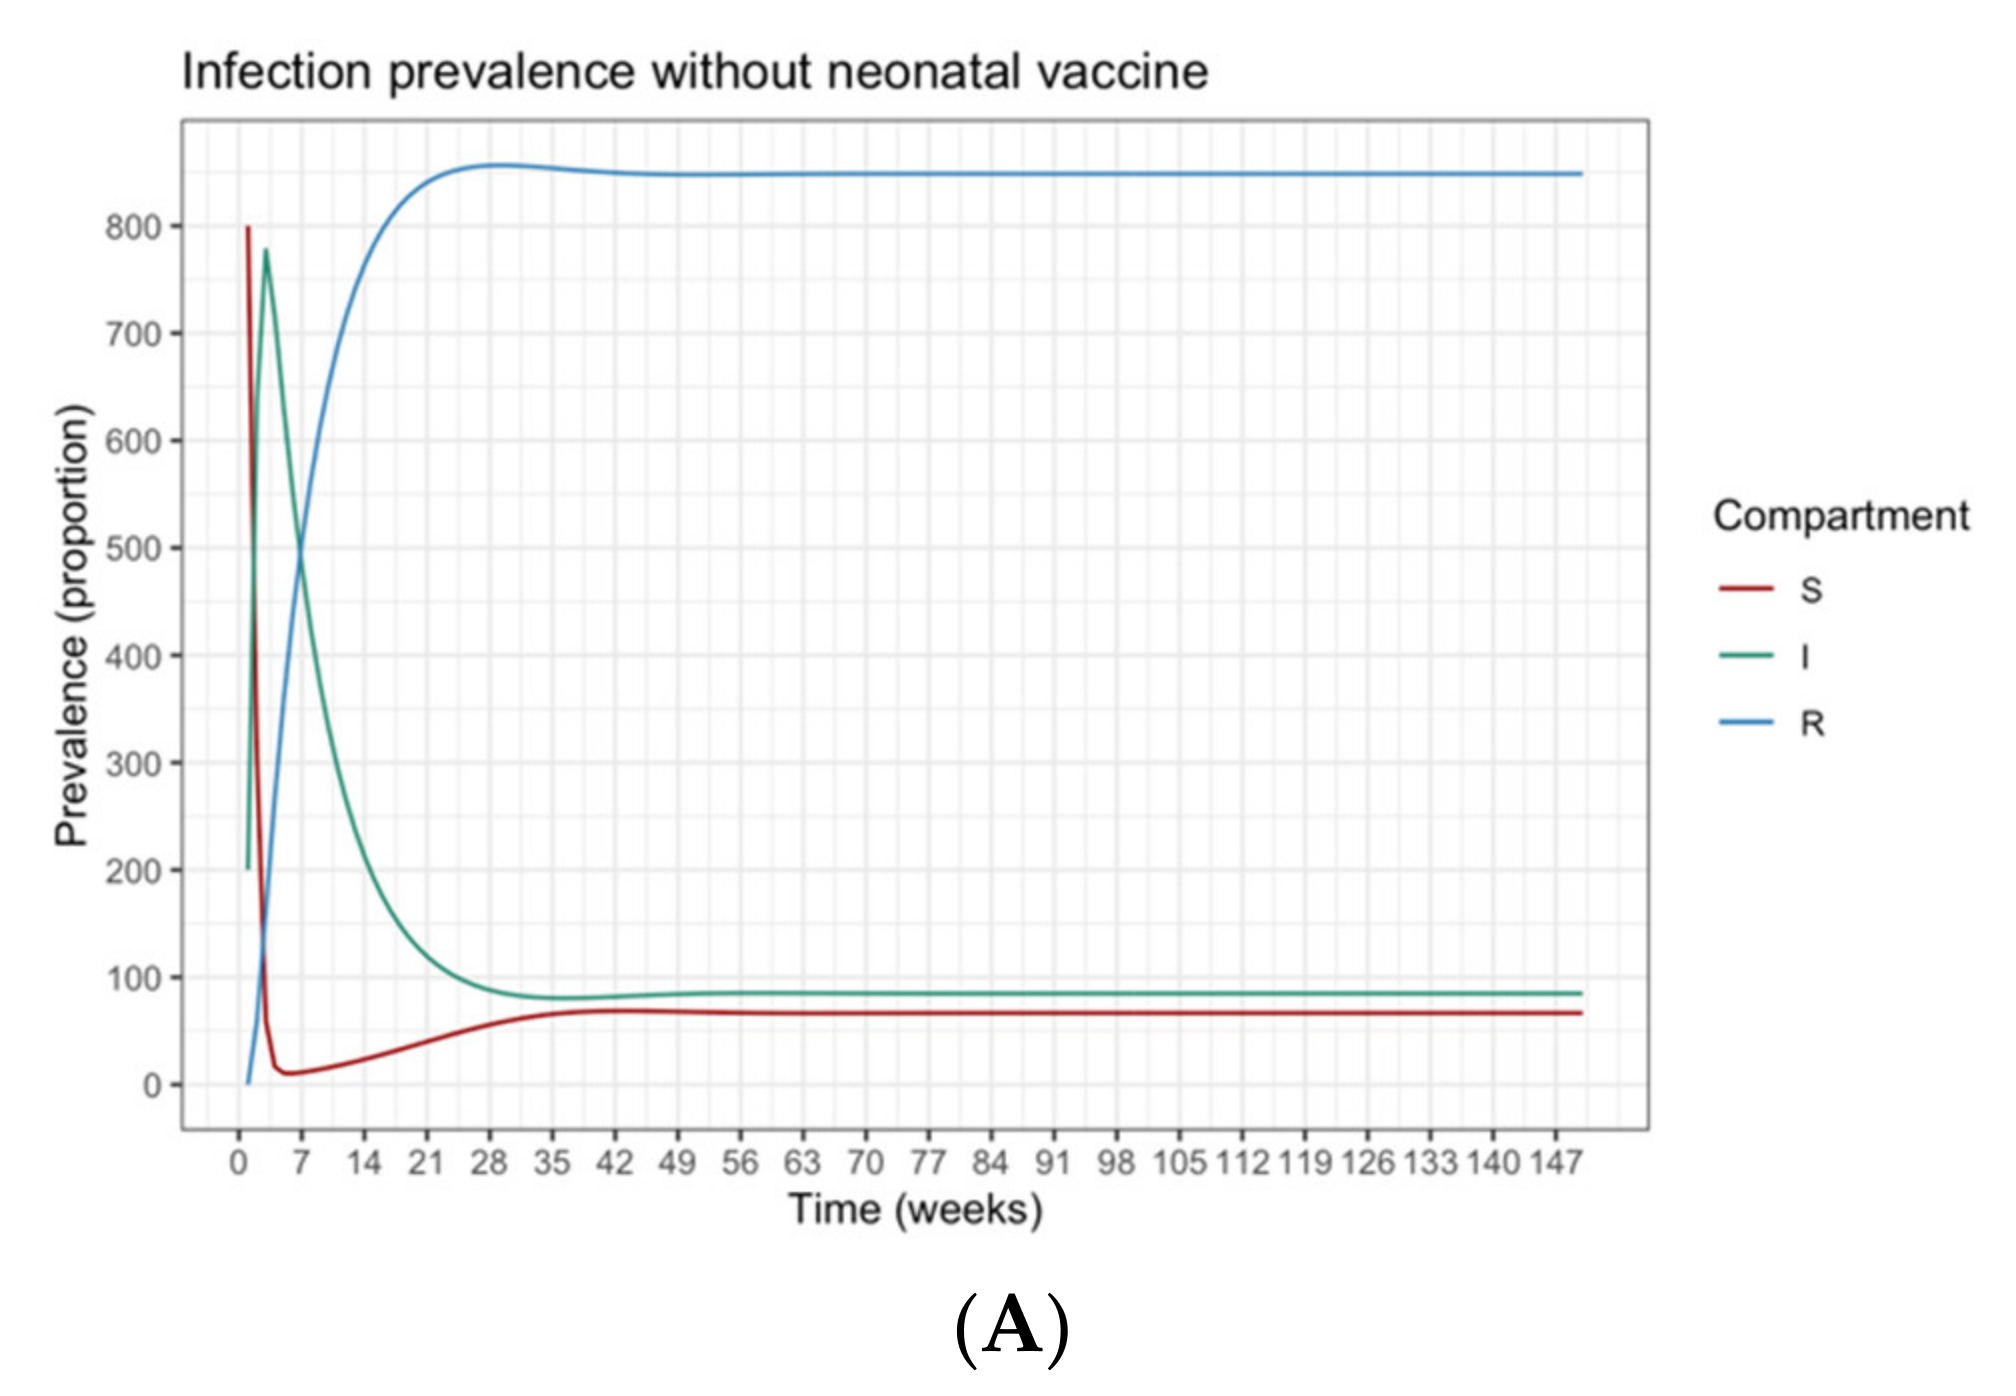
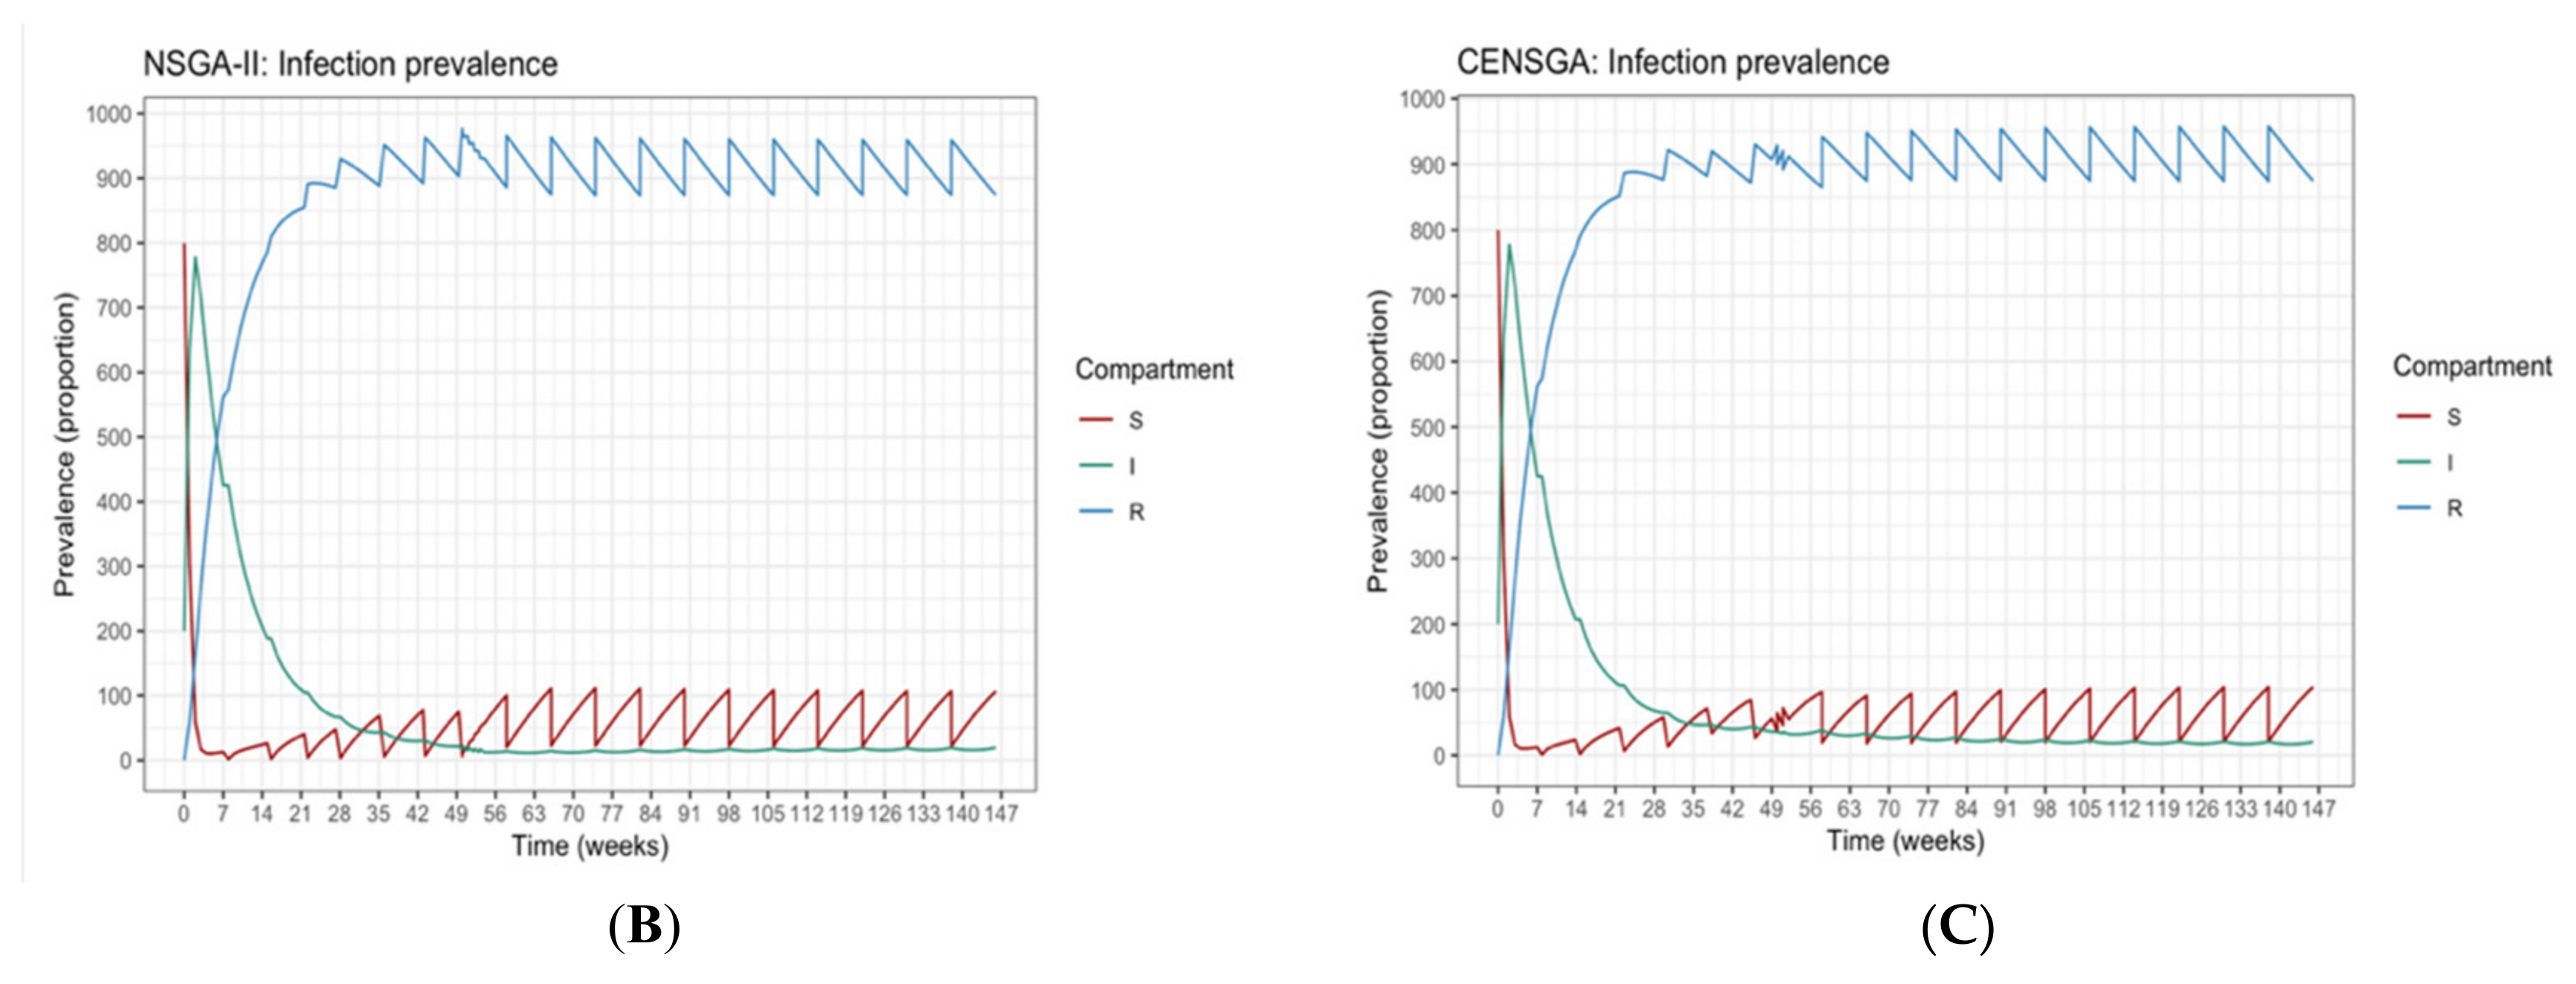
The optimization process has two phases: the guardian control determines a set of non-dominated guardian policies, and the contingent control determines a set of contingent policies. The outcome of the contingent phase is complemented with the best guardian control policy selected from the guardian phase to form a complete vaccination campaign. The purpose of two-phased optimization is to maintain an acceptable level of infected individuals in a finite time near to the disease-eradication ratio (i.e., compartment (I) ≤ tolerance ratio ( i t o l )   > 0), which could be achieved by incorporating a fixed-guardian control policy following a contingent vaccination phase in order to avoid an/another outbreak.
The cost function employed as the second objective function follows the exact cost function defined by Cruz et al. [6]. For the sake of comparison, the same simulation parameters and calibration values in [6] are used here as well. There are fixed and variable cost parameters that contribute to the implementation of vaccination policies. Starting with the fixed-cost part, the constants shown in Equation (4) are assumed to be c1 = 10, c2 = 1 and c3 = 1. Thereby, c1 · Ngc is the fixed part of the cost function with the implementation of all policies in the guardian control phase, i.e., Ngc is the number of times the selected guardian control policy will be applied. The second term c2 · Ngc · (1 + vgc)2 is the essence of the cost function that articulates the variable monetary cost related to the effort required to reach the vgc proportion of the susceptible population in all policies. The last term, c3 · ∑ vgc ·S[k], stands for the cost of all vaccines in all vaccination policies. Without losing generality, the same definition principle is applicable for the cost function of the contingent control phase found in Equation (6), where Ncc indicates the number of contingent control policies that are planned to be administrated.
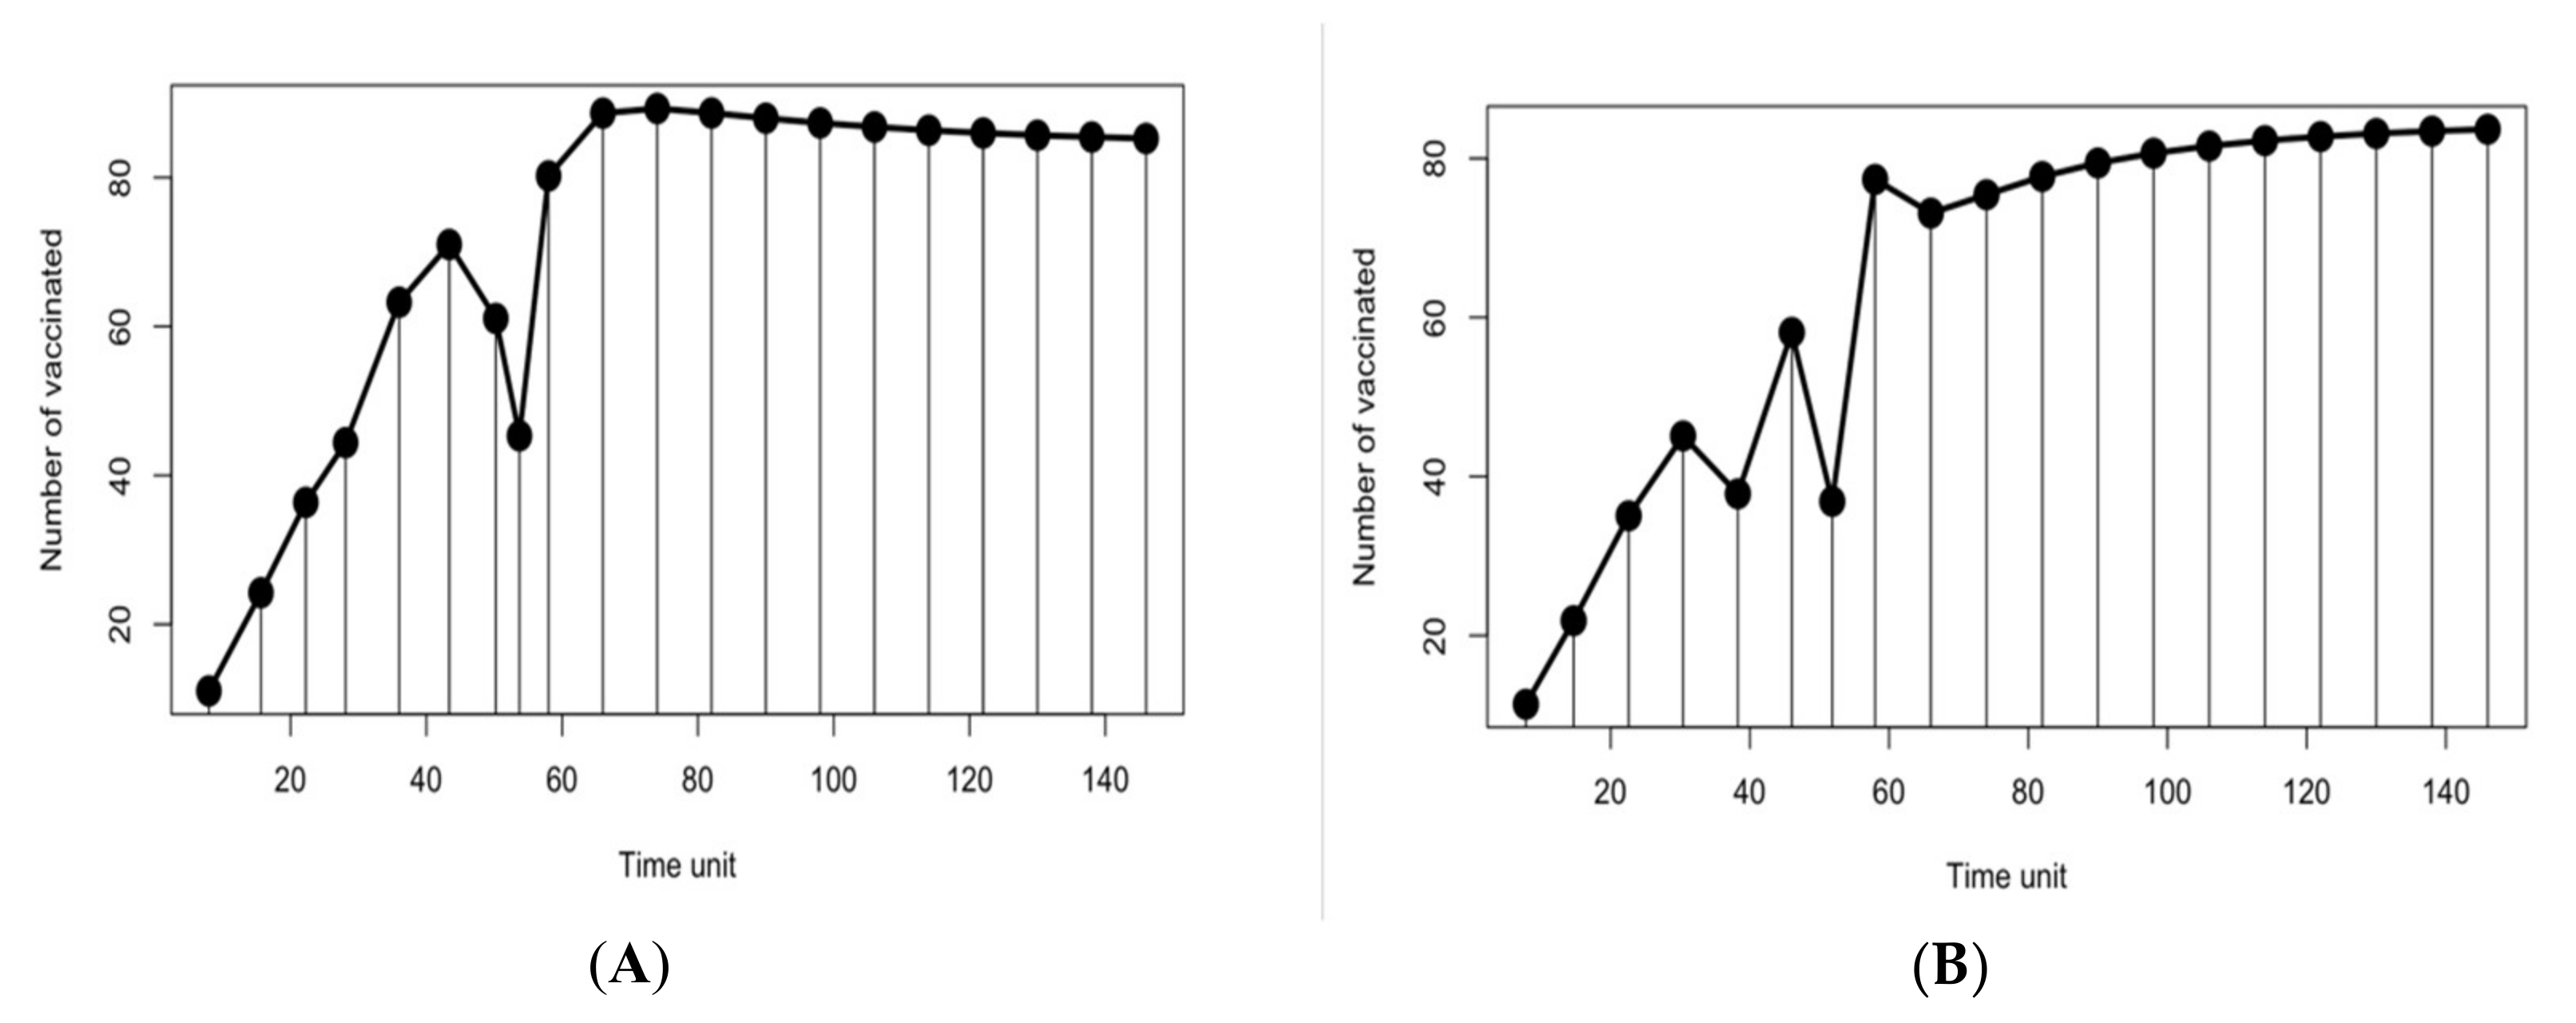
Mathematically, the time considered to determine the multi-objective control period is Tcntrl = Ttmp + Tgc, where Tcntrl belongs to the closed interval [0, Tcntrl], and has to be partitioned into a set of events Ω = {τ0, , τN}, such that: τ0 = 0, τN = Tcntrl, and τk+1τk = ΔT. The time between each τk and τk+1 is considered as a state of the optimization problem. The guardian phase of the multi-objective optimization model is depicted in Equation (4). The role of this phase is to find a set of non-dominated guardian control policies, X*gc= {(Δτgc, vgc), }; these are the decision variables used to derive a candidate solution with a constant time interval between campaigns, Δτgc, and with a constant proportion of susceptible population, which must be vaccinated at each campaign, vgc. The guardian control policy should begin at time Ttmp and be applied indefinitely, up to disease eradication or, in our multi-objective period, until Tcntrl.
The multi-objective optimization model of the contingent phase is depicted in Equation (6). The role of this phase is to determine a non-dominated set of complete vaccination campaigns. This phase appoints a fixed-guardian control policy after a set of variable contingent control policies (refer to Figure 2 and Figure 3). The set of non-dominated complete control policies for vaccination is described by
X* = {(Δτ1, v1, Δτ2, v2, …, ΔτNcc, vNcc, Δτgc, vgc), …}
Each contingent control is described by Ncc value pairs of the time interval between campaigns, Δτk, and the fraction of susceptible individuals to be vaccinated, vk, k∈ {1, 2, …, N}. The extra pair (Δτgc, vgc) is derived from phase 1, which represents a guardian control policy chosen from solutions X*gc. The resulting optimization problem for the guardian control phase is described by Equation (6).
min X g c F 1 = T t m p T c n t r l I t   d t F 2 = C 1 · N g c + C 2 · N g c 1 + v g c 2 + C 3 · k = 1 N g c v g c ·   S k  
subject to (5):
d S d t = μ N μ S β I S N ,     S 0 = S 0 · N 0 d I d t = β I S N μ I γ I ,     I 0 = I 0 · N 0 t k = T t m p + k · Δ τ g c , τ   τ k + , τ k + 1   s τ k + = s k + = s k 1 v g c i τ k + = i k + = i k i t   i t o l   ·   N ,         t T t m p , T t m p + T g c     k = 1 N g c Δ τ k T g c ;       N g c = T g c Δ τ g c k = 0 , 1 , , N g c 1 0.40   v m i n     v g c   v m a x   0.95 1     Δ τ m i n < Δ τ k < Δ τ m a x   20
The guardian control has the following constraints, as described by Equation (5). The system dynamic is determined by the SIR model (see Equation (2)), starting at the endemic equilibrium point {s(0), i(0), r(0)} = {0.067, 0.085, 0.848}, which is the infection-free value of the SIR model under constant Pulse vaccination [6,35]; functions dS/dt and dI/dt behave accordingly. From the beginning of guardian control, vaccination moments occur periodically kth times in a harmonic manner tk = Ttmp + Δtgc. At each unit of time (tk), a constant Pulse vaccination policy vgc (proportion of the susceptible to be vaccinated) is carried on, propagating the direct positive effect of vaccination on the population, as described in S(tk+), and I(tk+). The notation (+) indicates the moment after the vaccination carried out via the Pulse vaccination policy. To keep the infected population under control, during guardian control, the disease should remain below an acceptable value, by i(t)   itol. N, where i(t) is an instance of dI/dt at time (tk). The number of times the guardian control policy is going to applied is determined by Ngc, taking into consideration the total sum of time periods, must not exceed Tgc. The proportion of susceptible population to be vaccinated in each policy is bounded in the range [vmin, vmax] = [0.40, 0.95], while the time between two successful vaccination policies must be in the range [tmin, tmax ] = [1,20]. This search range includes values that theoretically prove that the infected population tends to zero over time [35]. The effects on compartment (R) are omitted for the sake of brevity, but this will not have any effects on the resulting output, as the system is an open system.
In contrast to the fixed-time policy applied during the guardian phase, time-variant control policies are considered for the contingent control phase, as described by Equation (6). The objective functions of the contingent phase are close to the ones anticipated in the guardian phase. In addition, the contingent phase objective functions consider the entire time horizon, which combines the contingent policies to stabilize disease fluctuation with the guardian policy to keep the infection volume under control. To sum up, a selected guardian control policy will be applied repeatedly on the time interval [Ttmp, Tcntrl], while the contingent control policies are administrated on the time window [0, Ttmp]. In the contingent control phase, both policies’ parts are connected to form a complete vaccination campaign that operates on the entire optimization time horizon [0, Tcntrl].
min X c c F 1 = 0 T c n t r l I t   d t F 2 = C 1 · N T o t a l + C 2 · k = 1 N c c 1 + v k 2 + N g c 1 + v g c 2 + C 3 · k = 1 N T o t a l v k ·   S k  
subject to (7):
d S d t = μ N μ S β I S N ,     S 0 = S 0 · N 0 d I d t = β I S N μ I γ I ,     I 0 = I 0 · N 0 ,   τ   τ k + , τ k + 1   t k = τ k 1 + Δ τ k s τ k + = s k + = s k 1 v k i τ k + = i k + = i k v k = v k ,                                         1 k   N c c v g c   ,   N c c + 1 k   N g c Δ τ k = Δ τ k ,                                         1 k   N c c Δ τ g c   ,   N c c + 1 k   N g c i t   i t o l   ·   N ,         t T t m p , T t m p + T g c     k = 1 N g c Δ τ k T g c ;       N g c = T g c Δ τ g c k = 1 N c c Δ τ k T t m p ;   N T o t a l = N g c + N c c ;   N c c   T t m p   Δ τ 1 , , T t m p   Δ τ k ,     Δ τ k T t m p   k = 0 , 1 , , N g c 1 0.40   v m i n     v k   v m a x   0.95 1     Δ τ m i n < Δ τ k < Δ τ m a x   20
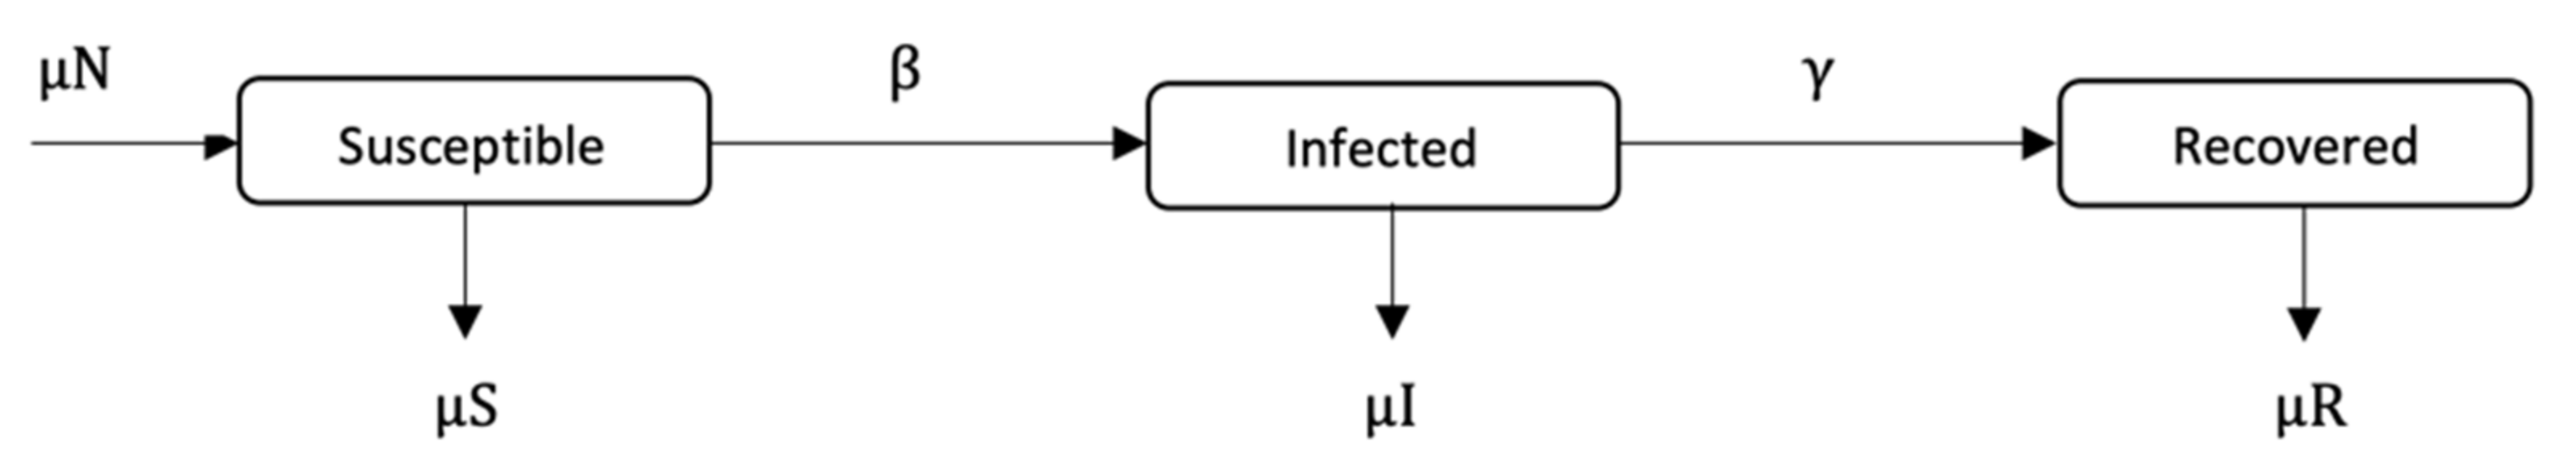
The contingent phase combines guardian and contingent policies to form a final vaccination campaign. This considers the optimization problem in the contingent phase as an extension of the former optimization problem with their mutual set of constraints, as described by Equation (7). The system still behaves dynamically using the SIR model with the same parameters as before. The initial state of susceptible, infected and recovered populations is assumed to be {s(0), i(0), r(0)} = {0.80, 0.20, 0}. Each k policy is indicated by the pair (tk,vk), representing the times and fractions of the susceptible population to be vaccinated. In the contingent control time window, again, the term (tk,vk) has variant values. In contrast, in the timeframe of guardian control, (tk,vk) has constant value. The sum of time intervals must not exceed their bounds Ttmp and Tgc. The number of policies, Ncc, in the contingent control can vary from ⌊Ttmptmax to ⌊Ttmptmin, while the number of guardian control stages, Ngc, is the same as Equation (4). The terms vk and Δτκ are vaccination proportion and time periods for the entire system time horizon, where the contingent control starts first and proceeds until administrating Ncc vaccination policies; this is followed by the application of Ngc guardian control vaccination policies. For both stages, there are Ncc different contingent control vaccination policies and Ngc constant guardian control vaccination polices to be applied in the duration [0, Tcntrl]. Henceforth, dividing the time limit of each stage Ttmp and Tgc over the possible policies’ durations Δtgc andt1, , Δtcc} produces the number of policies in each stage Ngc and Ncc, respectively. The total number of policies in the final vaccination campaign is NTotal = Ncc + Ngc. Following the same condition employed in phase 1, the disease should remain below an acceptable value, where (I) ≤ itol·N (i.e., itol = 0.01), to be maintained by applying the selected policy from the guardian control stage repeatedly until Tcntrl. To simplify the system, (R) compartment again is not mentioned, as declared earlier.
B.
Chromosome Representation
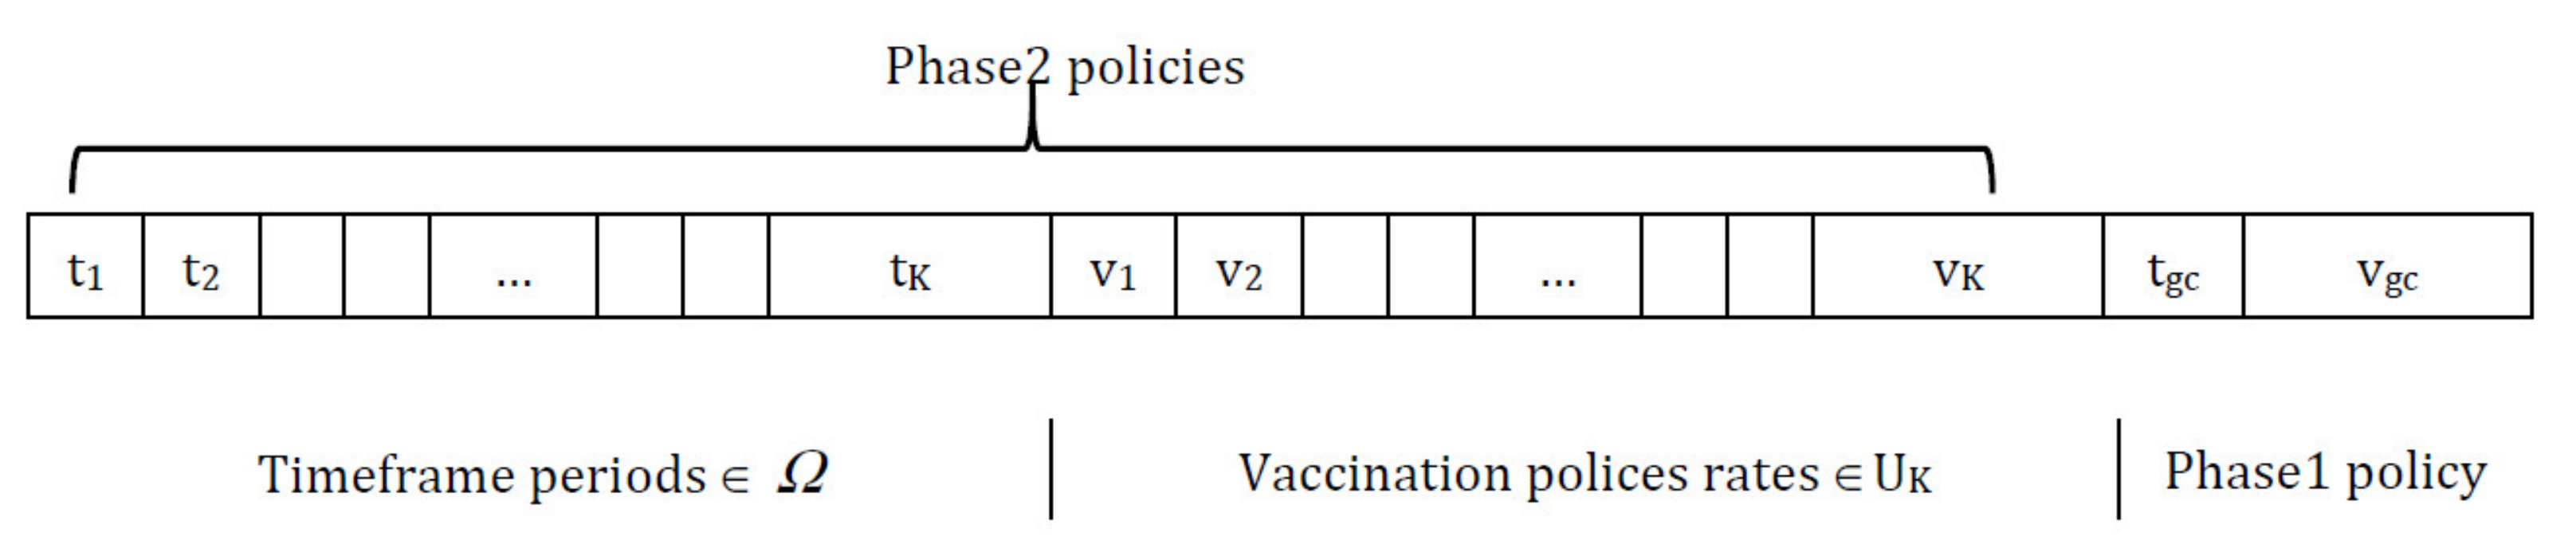
The representation of a chromosome is composed of a series of genes. The chromosome is mainly divided into three sub-lists; genes in the first part symbolize the timeframe period in each gene to represent τk+1τk = Δtk, while the second part of the chromosome indicates the set of vaccination polices, as each gene represents a proportion of the vaccination vK. The last part shows the policy chosen from the guardian phase, where tgc is the time period between two consecutive vaccination policies and vgc is the proportion to be vaccinated, as shown in Figure 3.
The first two parts of the chromosome belong to the contingent phase. The chromosome is depicted as a sequence of times followed by a sequence of vaccination proportions that will be employed at each abovementioned time period. It is worth noting that the chromosome lengths are of variable size, related to the number of vaccination policies applied over the indicated time horizon. The use of variable-length chromosomes (VLC) is motivated by many works found in the literature, such as [24,25,40,41,42,43]; for this work, no mapping from genotype to phenotype is needed, so there is no encoding/decoding process. To serve the purpose of this paper, VLC is utilized without adding an extra burden on the CPU time or memory utilization during the evolutionary processes (i.e., crossover/mutation). The condition applied to the chromosome length is that the number of timeframe periods must be the same as the number of vaccination policies. In other words, for each timeframe, an associate vaccination policy is to be applied.
The lower and upper limits of policies in a chromosome are fixed. We begin by defining a particular limit to the number of policies in a chromosome, say, 1 ≤ k ≤ 20. However, we do not know exactly how many policies are required. This should also be identified by Δtk on the fitness function, where 0 ≤ ∑ΔtkT. So, the chromosome should be able to increase or decrease the number of policies from individual to individual, or from generation to generation.

5.2. Non-Dominated Sorting Genetic Algorithm (NSGA)

A new paradigm of multi-objective algorithms has recently been dominating in the literature. These algorithms do not switch multi-objective problems into single-objective ones; instead, they are heuristics oriented towards guiding the multi-objective search. In order to tackle the complex vaccination problem with its contradictory objectives, a compromise-based approach must be applied to find the set of near-optimal solutions. In principle, the evolutionary multi-objective problem produces a set of optimal solutions (known as non-dominated or Pareto-optimal solutions), rather than a single optimal solution.
The motivation for using the multi-objective approach in solving complex problems in optimization is that it does not require special equations, which helps to simplify the problem. The nature of multi-objective optimization allows for a compromise (tradeoff) between some contradictory issues, and then leaving the final decision to the policymaker. In other words, there is no single best solution for all dimensions, but rather there are several candidate solutions [29]. In the current paper, the proposed mathematical model is solved by applying two Pareto-based metaheuristic algorithms: NSGA-II and CENSGA.
A.
NSGA-II
A non-elitist multi-objective genetic algorithm NSGA (or NSGA-I), proposed by Deb, Agarwal and Meyarivan [44], was one of the first EAs that was able find multiple Pareto-optimal solutions in one single simulation run. Several drawbacks were noted, such as the high computational complexity O(MN3), lack of elitism and the necessity of a sharing parameter. NSGA serves as a basis of two other metaheuristic algorithms, NSGA-II and CENSGA, whose implementations differ in several aspects. The powerful NSGA-II is one of the most widely implemented algorithms within this category; it is well known for its outstanding enhanced features, such as its fast non-dominating sorting-procured O(MN2), elitist-preserving mechanism and no-niching parameter. The main idea of NSGA-II is to reproduce a new population from an initial population without losing good solutions, and assure better convergence to the optimal Pareto-optimal front with a good spread of the solutions [44].
The best solutions and Pareto fronts are obtained by prioritizing solutions using non-dominated sorting. Non-dominated sorting considers two parameters: Np, which represents the number of solutions dominating a certain solution, and Sp, which represents the set of solutions derived by a certain solution. The sorting process is a labelling procedure carried out repeatedly, wherein each solution must be ranked with a number, potentially non-unique, that indicates the front it belongs to. For minimization problems, the best solution is assigned to the first front, the second solution is assigned to the second front, and so on. The ranking of the solutions works as a measure of fitness. The fast non-dominated sorting operator is used to associate a rank to each solution relative to its dominance level. However, within the same rank, a set of solutions is assigned. Thereby, a measure of the density of solutions belonging to the same rank (front) is applied, which is denoted as the crowding distance (CD) [14]. Algorithm 1 outlines a summary of the NSGA-II algorithm [12].
Algorithm 1. Template for NSGA-II algorithm [12]
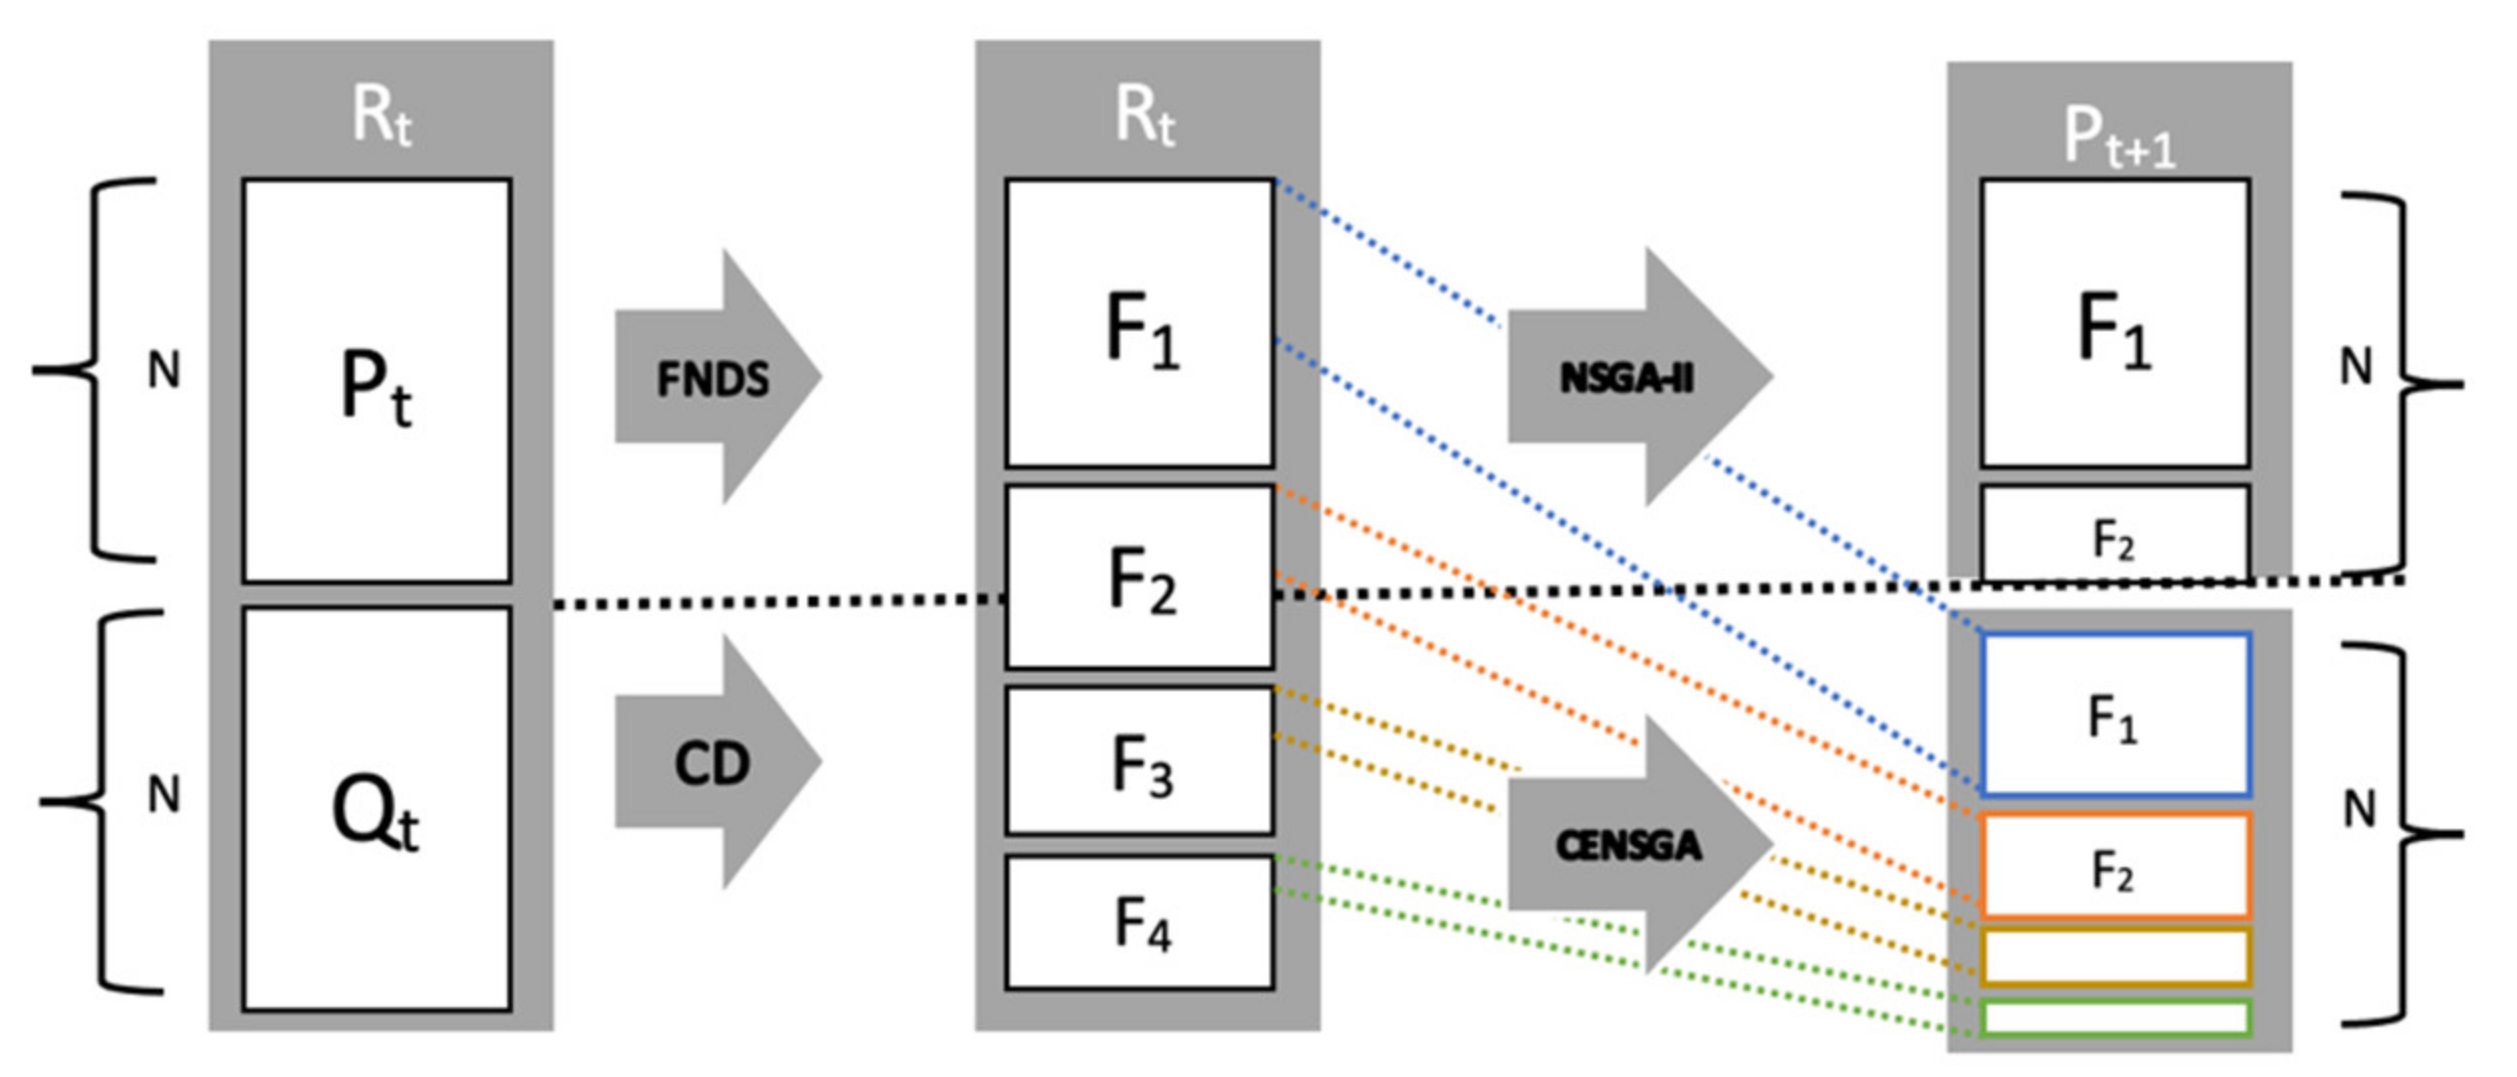
    Rt = PtQt    //combine parent Pt and children population Qt
    F = fast-non-dominated-sort (Rt) //rank all non-dominated fronts of Rt
    Pt+1 = and i = 1
    until |Pt+1| + |Fi| ≤ N   //until the new population is filled
      Pt+1 = Pt+1Fi   //include i-th non-dominated front in Pt+1
      //calculate crowding distance for each solution in Fi for partial inclusion
      crowding-distance-assignment (Fi)
      i = i + 1
      Sort (Fi, ≺n)      //sort in ascending order using ≺n
    Pt+1 = Pt+1Fi [1:(N − |Pt+1|)] //choose the first N elements inFi
    Qt+1 = make-new-pop (Pt+1) //using selection, crossover, and mutation
      t = t + 1
The new population pool Pt+1 is created by adding solutions from fronts in a consecutive manner, starting from the first front F1, until the size of the parenting pool reaches N. Individuals on all fronts are ordered using a crowding distance that calculates the distance between neighboring solutions. Thereafter, the best fronts are included entirely in NSGA-II, while solutions of the last-accepted front are sorted and selected according to a crowded comparison criterion. The crowded comparison criterion uses a special relation ≺n to promote diversity in the solutions within this front, where ≺n is defined as follows:
if (irank < jrank) or ((irank = jrank) and (idistance > jdistance)), then, SELECT i
In other words, the solutions with lower ranks are preferred when there are differences in the non-dominated ranks. Apart from that, if both solutions are on the same front, then the larger crowding distance (i.e., solutions from less dense regions) is preferred. This forms the population Pt+1 of size N. At this point, the parent population Pt+1 proceeds for selection, crossover, and mutation to construct a new population Qt+1 of size N [12]. In our work, the bounded Simulated Binary Crossover (SBX) [45] and bounded Polynomial Mutation [46] are used as recombination operators, where these are the same GA operators used in [6].
B.
CENSGA
In this paper, we present an extended version of NSGA-II that is denoted by Controlled NSGA-II or CENSGA. CENSGA was first proposed by Deb and Goel [12], with the main differences related to the selection strategy. In particular, CENSGA gives all fronts the ability to participate in the selection process through a geometric distribution with various priorities that reflect the front level. 
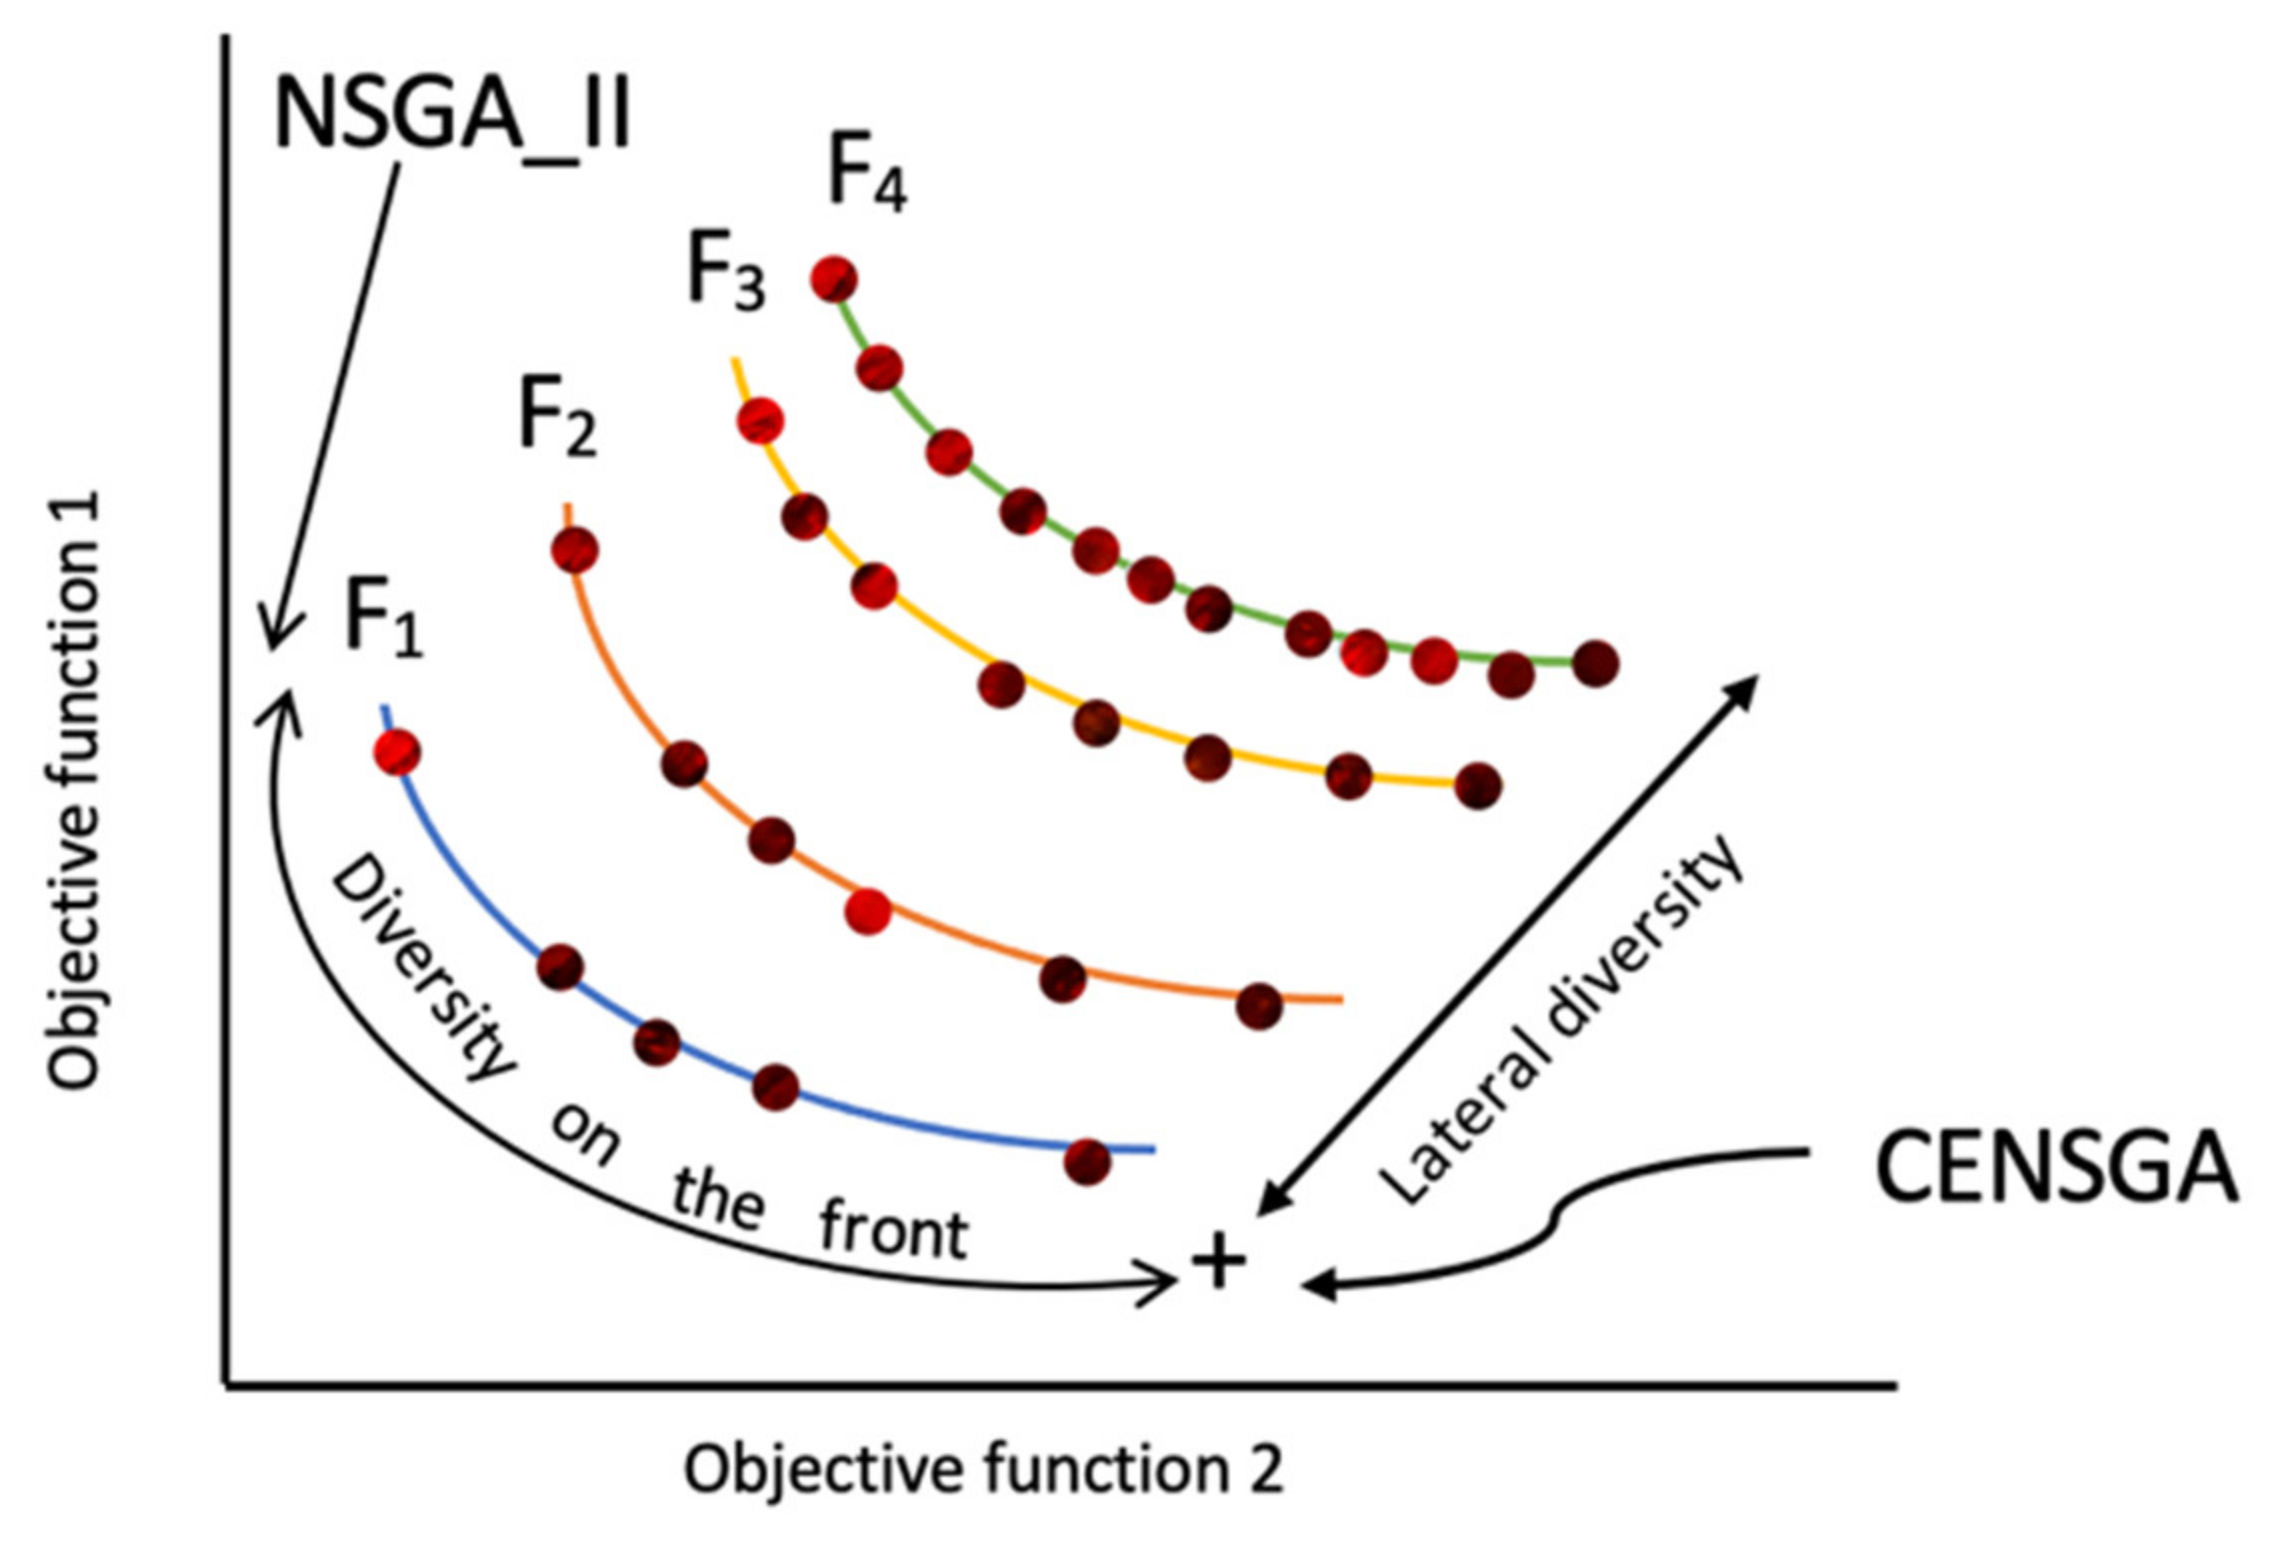
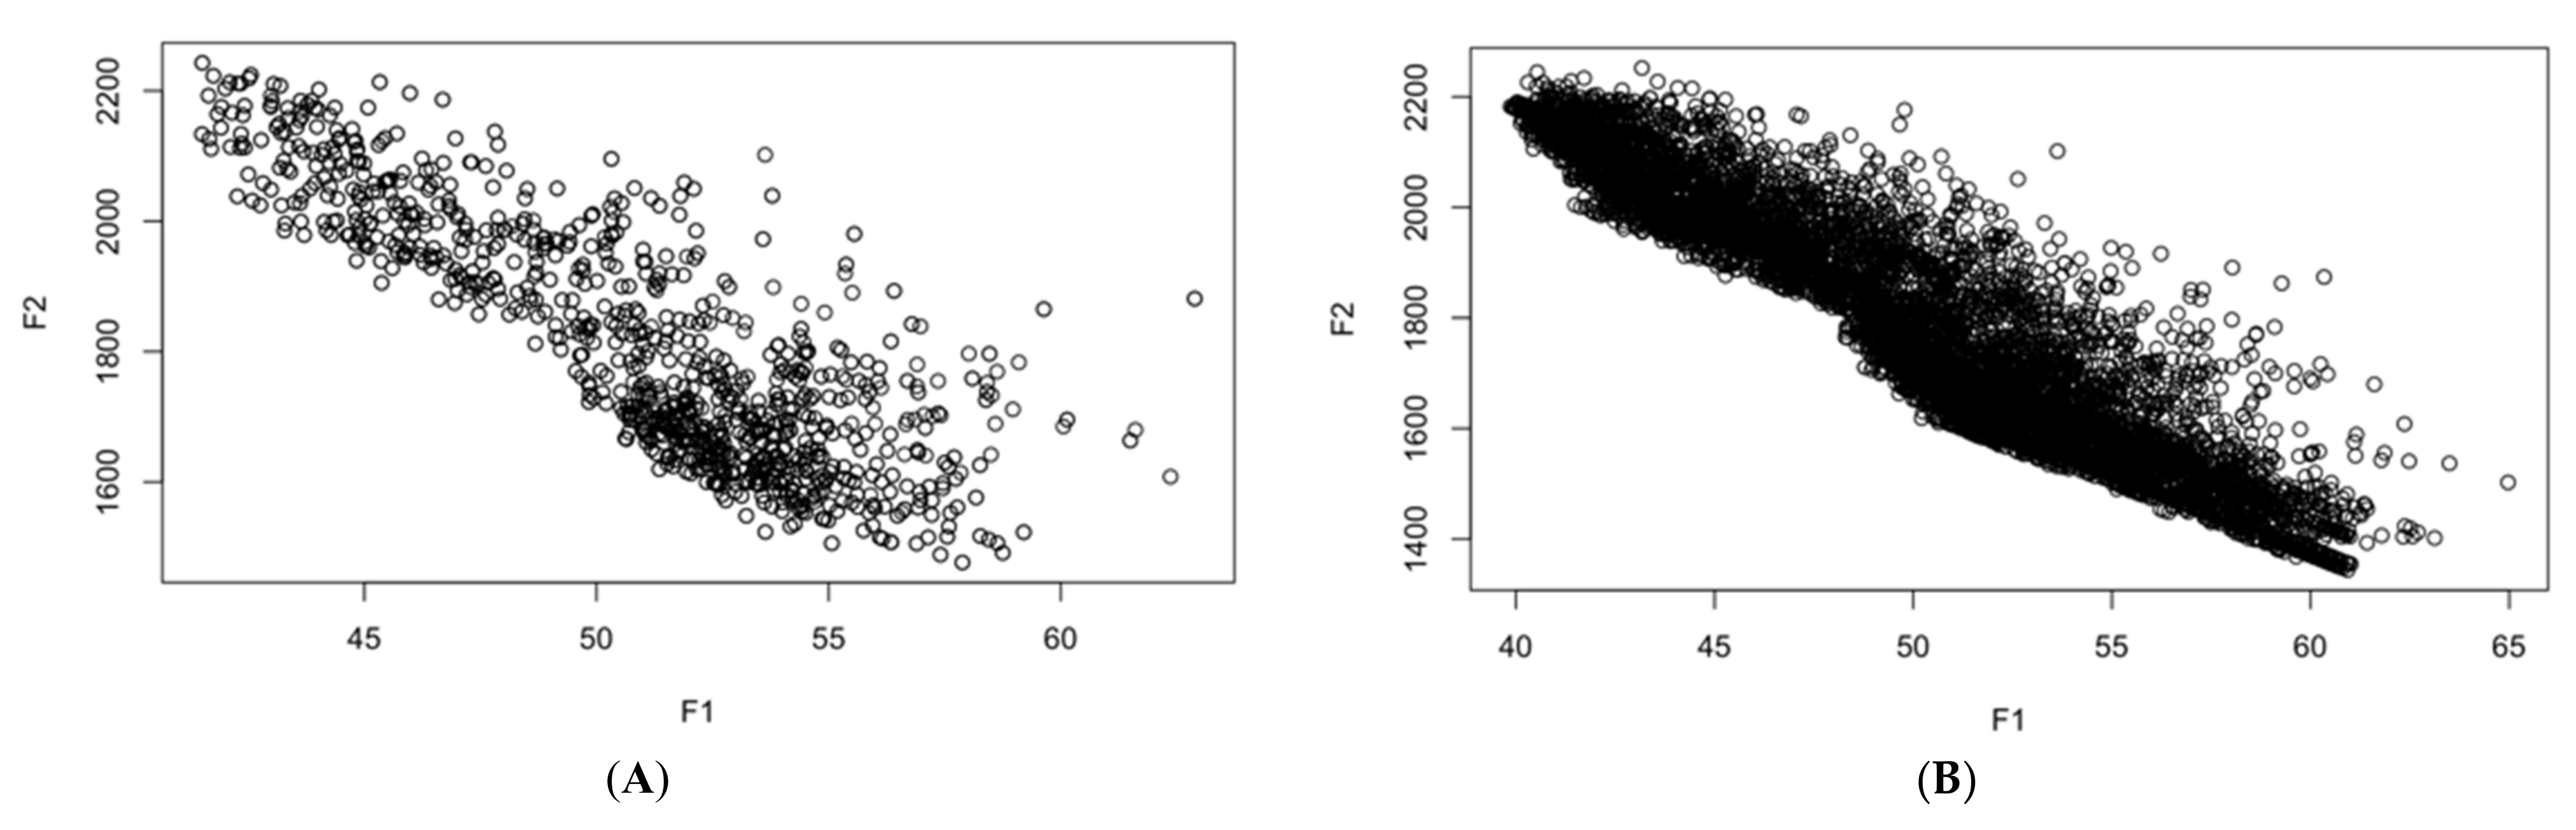
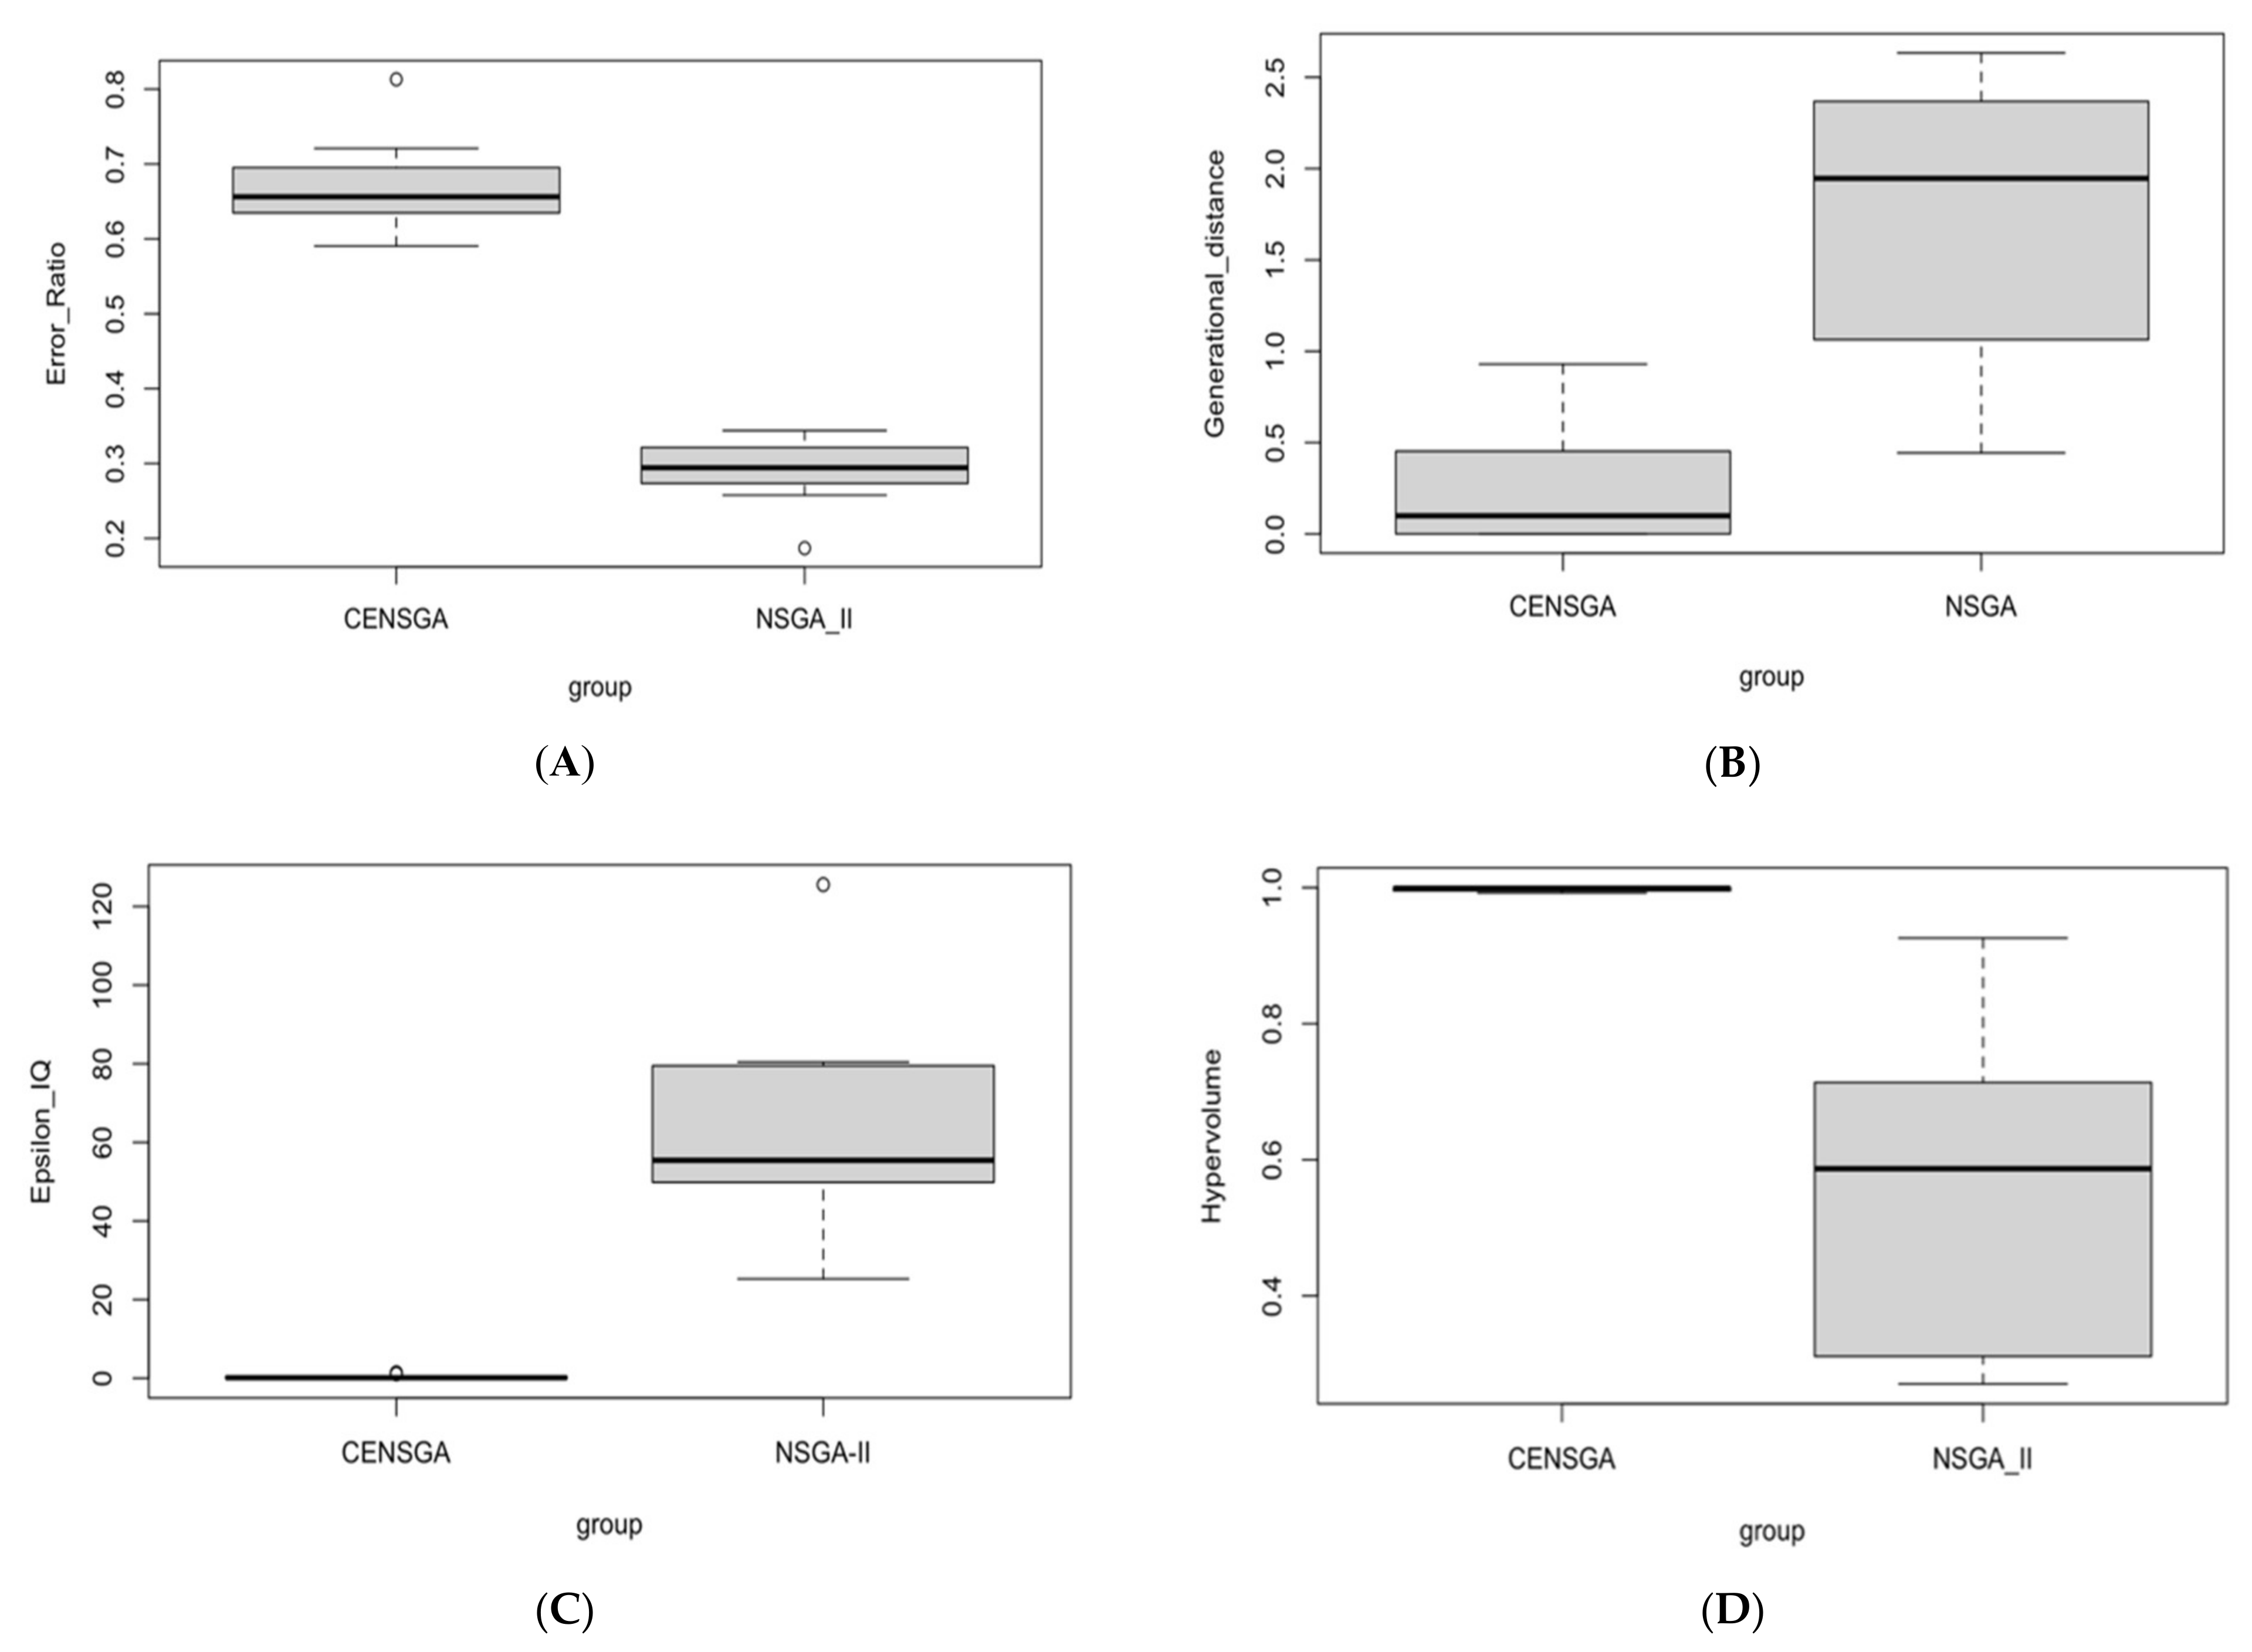
Figure 4 shows that the reproduction of the new population under CENSGA is more varied than under NSGA-II.
The two-fold affirmation of elitist solutions in NSGA-II will cause a rapid exclusion of solutions belonging to non-elitist fronts. Although the 
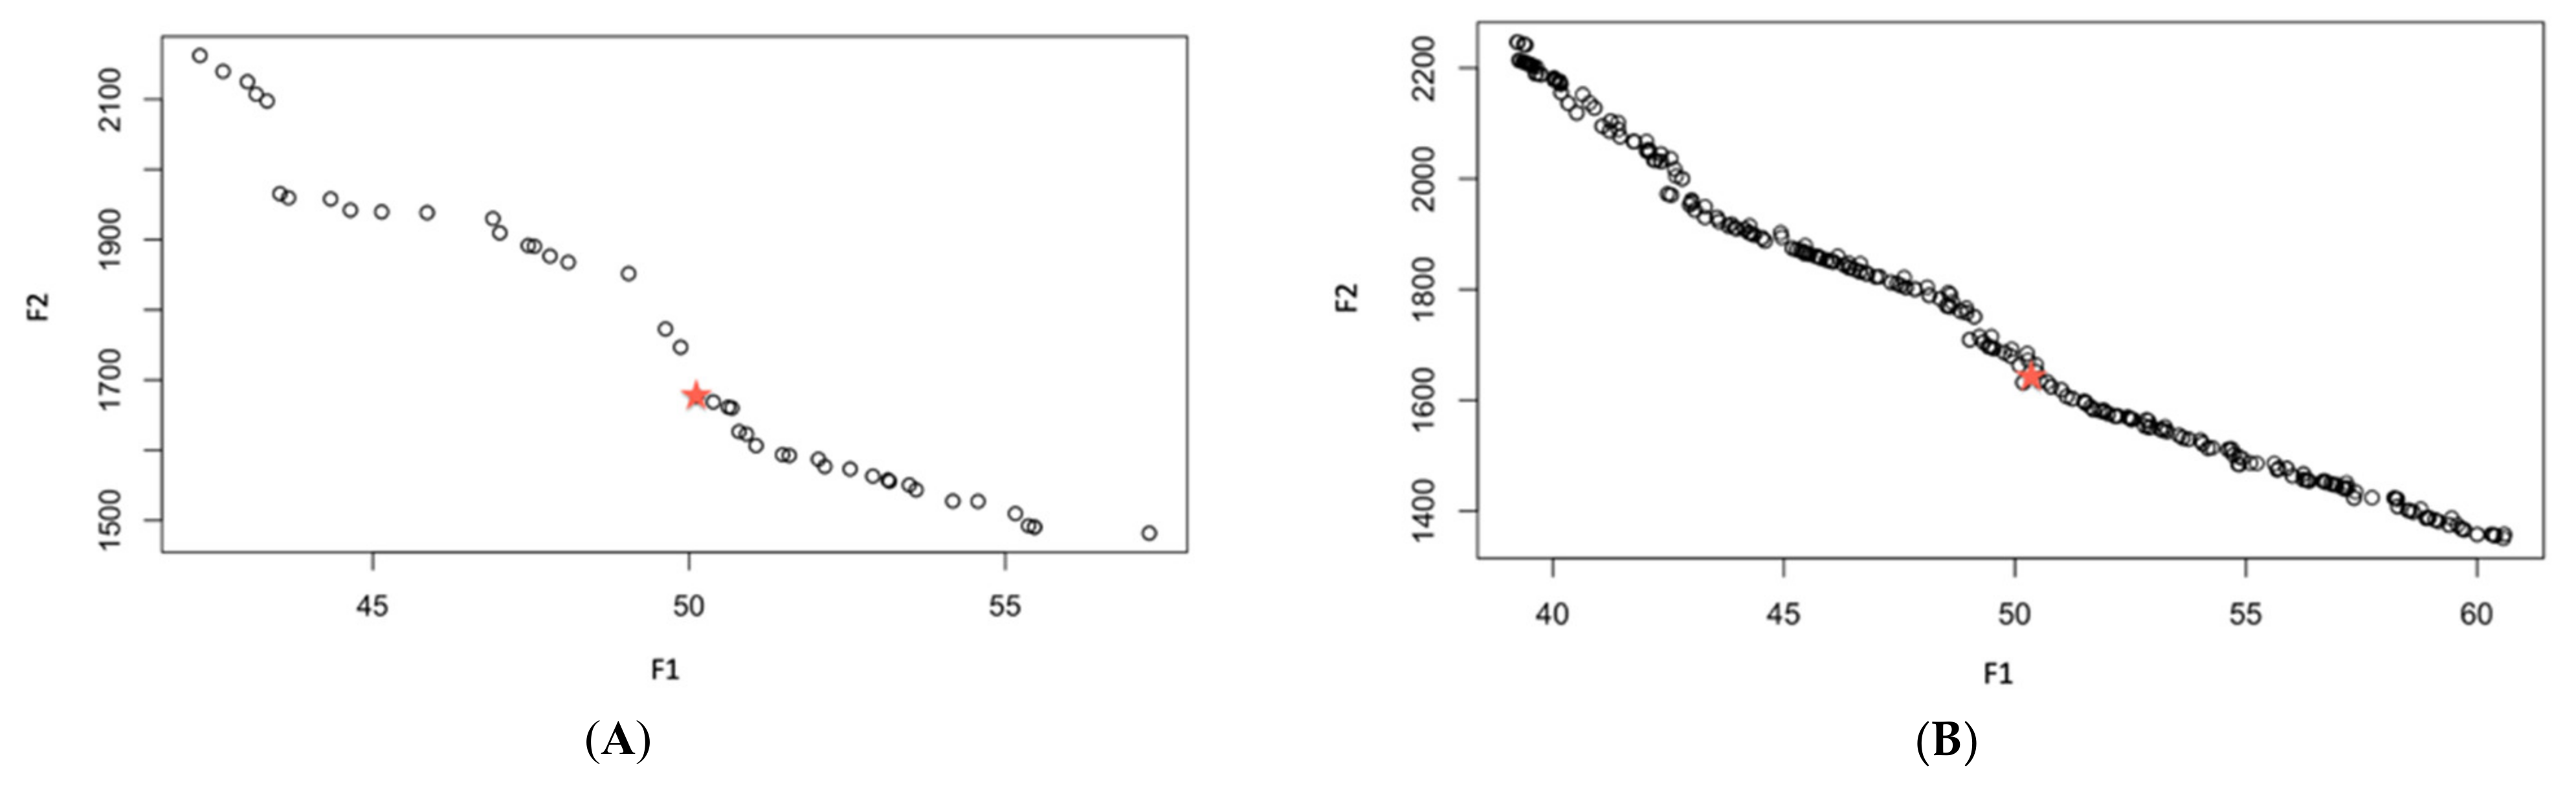
CD operator will preserve diversity along the current non-dominated front, lateral diversity will be absent. Basically, under such conditions, the search may wane due to the lack of diversity in certain decision variables. Thus, the ability to direct the search towards better regions of optimality may be paralyzed. Therefore, in order to prevent premature convergence, a search algorithm more effectively adopts diversity in both directions—along the Pareto-optimal front and lateral to the Pareto-optimal front [12], as presented in Figure 5.
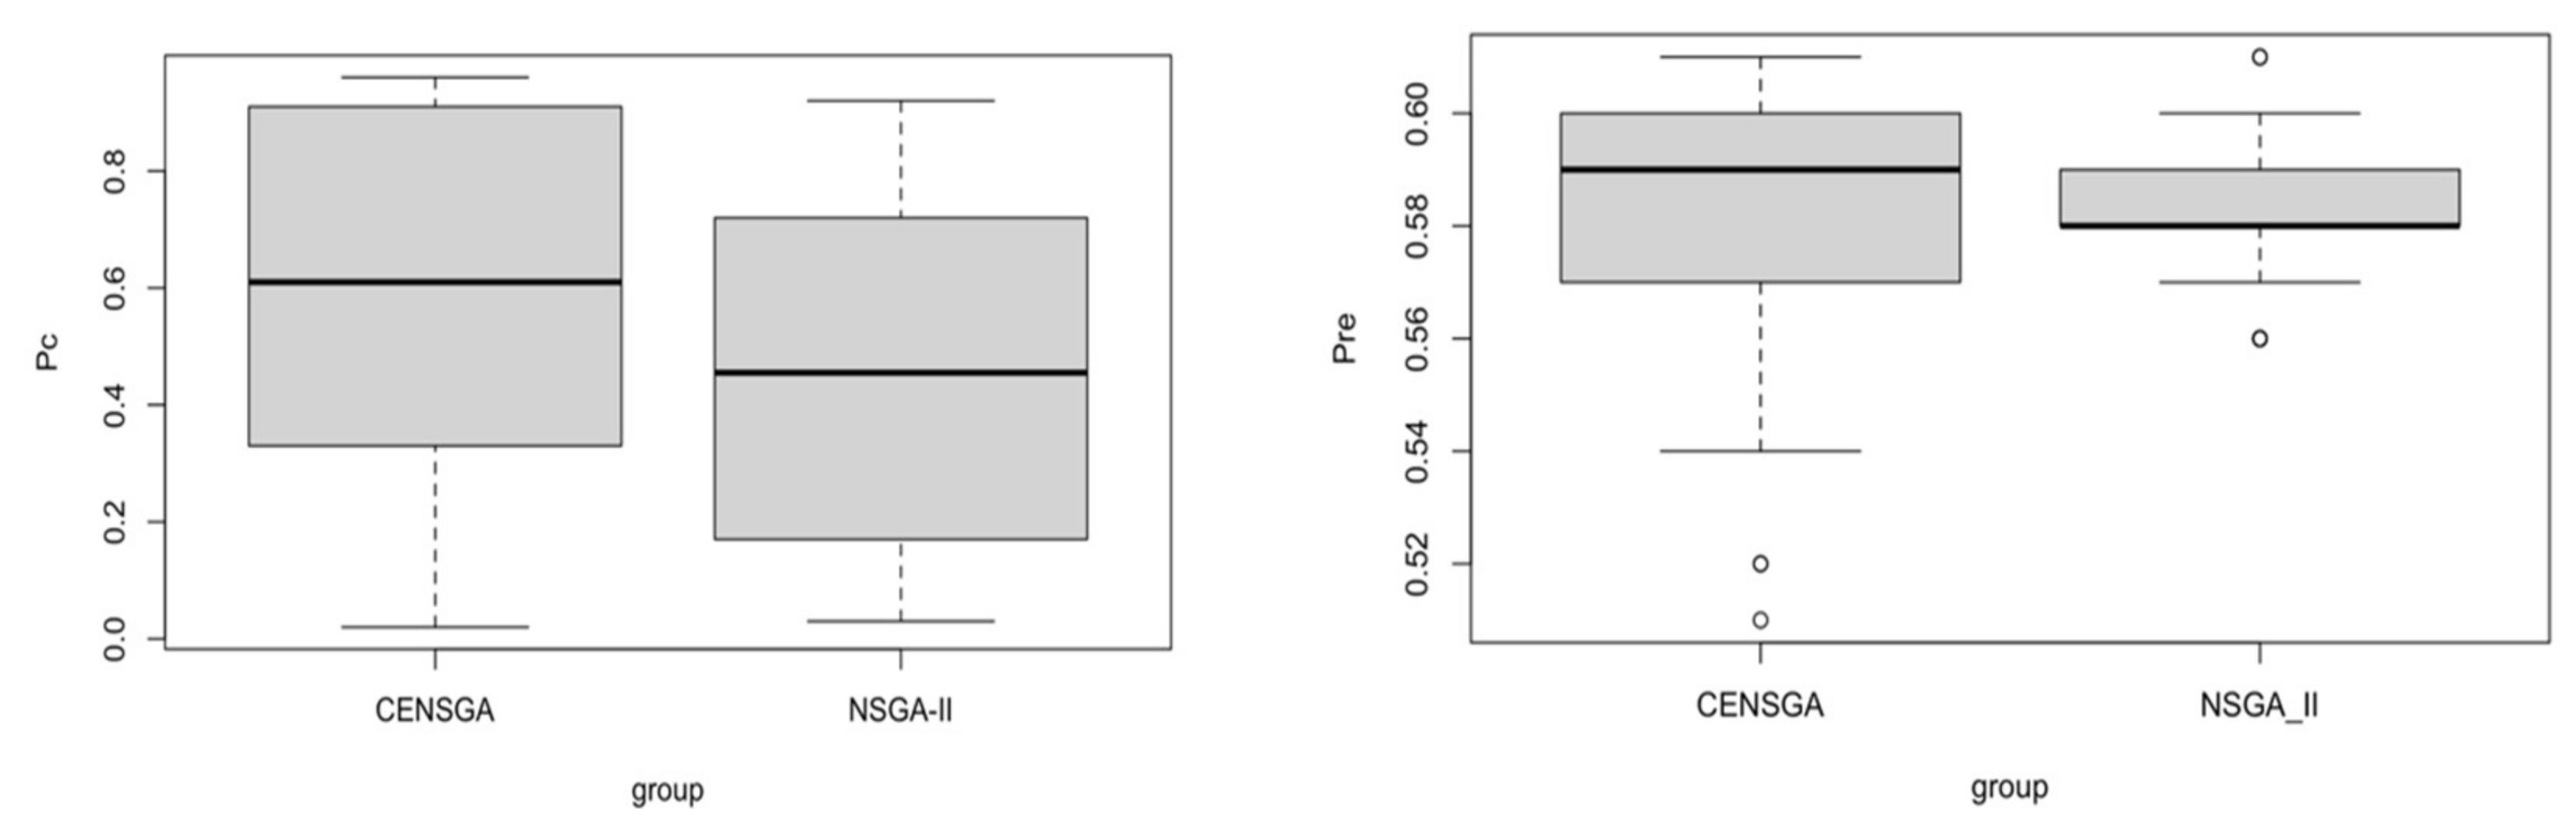
In CENSGA, the selection operator is modified to encourage more diversity by allowing all fronts to participate in the selection strategy. The participation of fronts is controlled by a geometric distribution that prioritizes them, ensuring that better fronts have a greater influence in shaping the next generation. This process is calculated by Equation (8):
n i = r · n i 1    
where ni represents the number of individuals in the ith front and r (<1) identifies the reduction rate. In a population of size N, let k be the number of non-dominated fronts; then, the maximum number of individuals allowed in each front fi ∈ (1, 2, , k) is computed as follows:
n i = N · r i 1 1 r 1 r k
At front fi, the selection of ni individuals is performed by the CD operator. The geometric distribution ensures an exponential reduction in the number of solutions over the fronts [14,47]. Algorithm 2 shows the pseudo-code for the controlled selection, while 
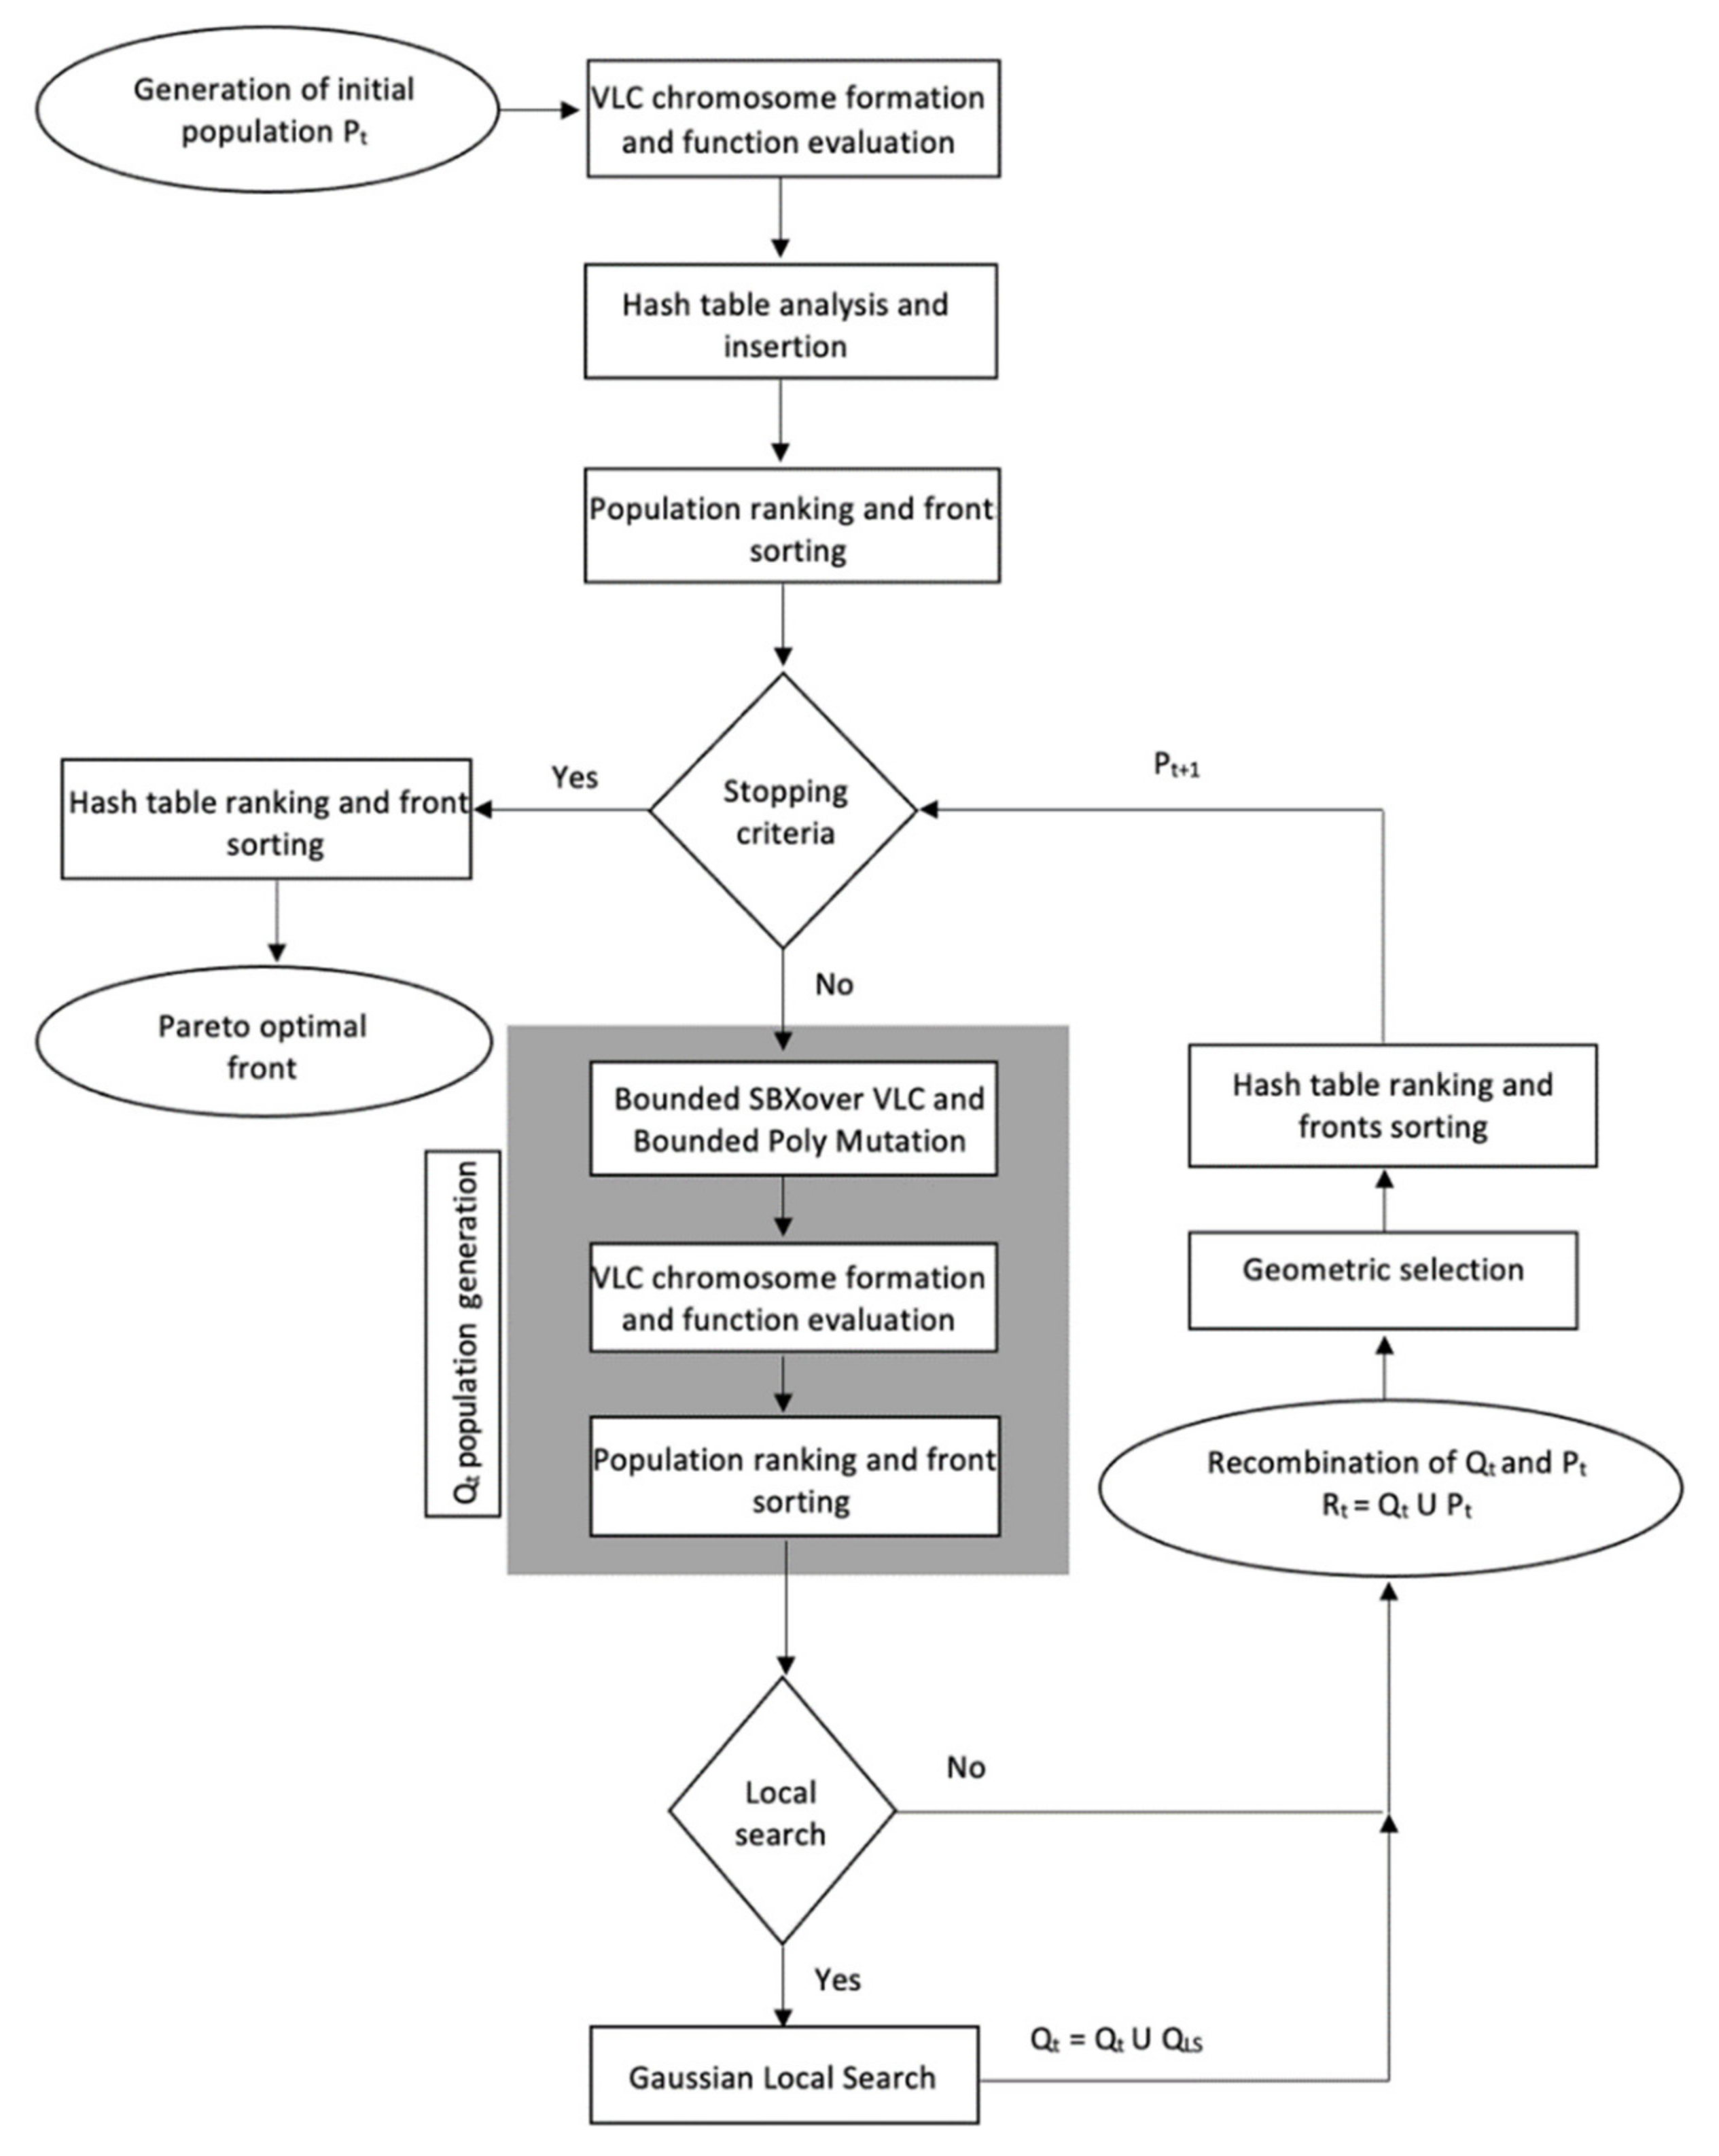
Figure A1 presents a flowchart of the CENSGA algorithm.
Algorithm 2. Pseudo-code for CENSGA Controlled geometric selection
    Rt = PtQt         //combine parent Pt and children population Qt
    F = fast-non-dominated-sort (Rt) //rank all non-dominated fronts of Rt
    Pt+1 =  and i = 1
    repeat
       n i = N · r i 1 1 r / 1 r k //Geometric distribution to decide
                     number of individuals at front i
      crowding-distance-assignment (Fi)//calculate crowding distance for each solution in
                      Fi for partial inclusion
      Sort(Fi, ≺n)      //sort in ascending order using ≺n
      Pt+1 = Pt+1Fi [1:ni]   //include ni non-dominated front in
                  Pt+1 according to Geometric distribution
      i = i + 1
    until |Pt+1| + | Fi [1:ni]| ≤ N  //until the new population is filled
    Qt+1 = make-new-pop (Pt+1)  //using selection, crossover, and mutation
    t = t + 1
C.
Local search via Gaussian approximation.
Deterministic search methods were proven to find the local optimal solution with fast and precise convergence properties. A promising means to enhance the local search beyond local optimality is by combining evolutionary algorithms and classical deterministic search methods. Our work is inspired by a local search scheme proposed in [6] that boosts the convergence and improves the quality of solutions. This hybrid method selects solutions from the non-dominated front (recombined population) to feed the local search’s initial population. The Gaussian approximation with scalarized weighted sums [29] is used as a function to generate newly approximated Pareto-optimal solutions, which may yield new opportunities to search areas closer to the true optimal front.
The hybrid scheme embeds the local search in the canonical NSGA-II and CENSGA algorithms, such that the process of the local search is triggered every 20 generations. The local search has the following fundamental actions: (1) A set of (r) solutions is chosen at random from the existing non-dominated front. (2) Around each solution (r) chosen in the former step, a set of (m) new points is created autonomously, by Gaussian distribution, with standard deviations equal to 0.01 times the size of the search space for each decision dimension. (3) The fitness value is evaluated on the new points to associate their objective values. (4) The new r × m solutions are introduced into the current population.
The setup of the experiments conducted here is as follows: (r) is set to hold four randomly chosen solutions selected from the existing non-dominated front, with m = 2s, and s = 2·n + 1, where (n) is the search space dimension of the problem. The number of newly produced solutions for each set of approximated functions has been set as p = N/2, where N is the population size of the evolutionary algorithm. In other words, in each iteration, when the local search is triggered, 2N new solutions are produced; then, the selection operator is performed over 4N solutions, with 2N solutions coming from the current iteration of the optimization process and 2N coming from the local search.
D.
Evolutionary algorithm using a hash table
In order to maintain a unique set of solutions and most effectively utilize the processor time, a hash table was incorporated into the evolutionary algorithm, as proposed in [6]. A good data structure and a good hashing function has a mean search time computationally equivalent to O(1) for an element in the array [48].
The current research benefits from a hash table in storing the non-repetitive generated solutions during the evolutionary iterations in the optimization process. When a new offspring is obtained by a genetic operator, it passes through a verification process to acknowledge that there is no comparable member on the hash relation. This step assures there is no repetition among the hash relation members. When an offspring matches a member stored in the hash table, a random vector with Gaussian distribution (zero-mean and standard deviation equal to 1.0 percent of the search space dimension) is added to the offspring coordinates, generating a new offspring around the original member. In this way, the hash table encourages diversity, and only new solutions are evaluated.
During the optimization run, the algorithm is executed for several generations, and on each iteration, the hash table is updated accordingly. Hence, the relation of solutions is set with the initial population and expands in each iteration of the optimization process. In the final iteration, non-dominated sorting is applied over all stored solutions during the optimization process. The return result is a set with all non-dominated solutions that were involved in all executions. An outline of the CENSGA algorithm is presented in Algorithm 3.
Algorithm 3. CENSGA Outline Algorithm
   P1InitialPopulation()   //P1 is the initial population generations
   [H, P1 ] ← AnalyzeInsertHashTable(H, P1) //H is the hash table
   [H, P1 ] ← EvaluatePopulation(H, P1)
   NDS1NonDominatedSorting(P1) //NDS contains First Pareto front of P1
   NDS1CrowdingDistance(NDS1)
   for t from 1 to t step 1 do  //t is the number of generations
    QtGeometricSelectionAndRecombination(Pt)
    QtCrossover&Mutation(Qt)
    [H, Qt ] ← AnalyzeInsertHashTable(H, Qt)
    if it is desired to execute local search then
     LLocalSearch(NDSt, H)
     QtQtL
    end if
    [H, Qt ] ← EvaluatePopulation(H, Qt)
    RtPtQt
    NDStNonDominatedSorting(Rt)
    NDStCrowdingDistance(NDSt)
    Pt+1FillNondominated(GeometricSelection(NDSt))
   end for
   PFNonDominatedSorting(H)   //Final pareto front PF

6. Parameter Tuning

Different approaches can be utilized to tune the parameters of an algorithm [49,50,51]. In this work, the Taguchi method is applied to calibrate the parameters of the two metaheuristic algorithms tested. The Taguchi method is a robust and powerful tool for optimizing the performance settings of algorithms [52]. The design of the Taguchi test involves the concept of orthogonal arrays (OA) used to study the effects of different permutations of decision variables or factors on many levels with less trials, contrary to performing all analyses, as in the full factorial design [51]. In Taguchi designs, the signal-to-noise (SNR) ratio is used to find the optimal level of control factors and to reduce the effect of noise factors. Control factors, in our case, are the algorithm’s parameters that can be controlled. Noise factors cannot be controlled while the algorithm is executed, but can be controlled during experimentation. Therefore, in a Taguchi-designed experiment, the noise factors can be manipulated to encourage underling variability to occur to identify optimal parameters settings that make the algorithm robust, or at least resistant to variation from these noise factors. Thus, the signal-to-noise (SNR) ratio is employed. Furthermore, the expected outcome (response) is minimization, so a smaller-the-better type of response is applied. Equation (10) represents the SNR ratio as follows [53]:
SNR = −10 × log(S(G2)/n)
where G is the responses used for the respective parameter levels and n is the number of responses in the parameter levels.
The parameter calibration test is executed by the Orthogonal Arrays (OA) (i.e., Taguchi representation) L9 (3^4) and L27 (3^5); that is, 9 and 27 test runs are designed from four and five parameters, with three levels of potential parameter values. Table 2 shows the parameters of NSGA-II and CENSGA, and the levels defined for them. Using Minitab software, for NSGA-II and CENSGA, the effect plots for the SNR ratio are computed.
The objective function values are computed by implementing the algorithms for the two-staged Pulse vaccination problem. For each combination of parameters, the bi-objective functions of the model, z1 and z2, are considered jointly, and two objective values are obtained. Hence, for each objective function, the mean of the population’s values obtained for the problem can be calculated. This produces two mean values that are converted to a single objective function value using the weighted-sum approach [29].
Z = w1 × Z1 + w2 × Z2
where the weight parameters w1 and w2 indicate the contribution of the objectives to the combined objective value; in this work, the values are set to 0.5, indicating equally significant objectives. Figure 6 and Figure 7 depict the SNR ratio of the Taguchi test runs for NSGA-II and CENSGA, respectively. In NSGA-II, the SNR ratio is applied twice, since the first round indicates a significant value for the population size among the other parameters only. Therefore, a second SNR round is applied by stabilizing the first parameter with the best value obtained from the first round, using the same levels for the other parameters employed when using representation L9 (3^3). The best calibrations of the parameters determined by the Taguchi method are tabulated in Table 3.

7. Results

After the execution of the multi-objective optimization algorithms for the guardian phase of the problem formulated in Equation (4), a set of non-dominated guardian control solutions were determined, with 597 and 1132 solutions for NSGA-II and CENSGA, respectively. All these solutions verify the constraints and belong to the non-dominated Pareto front. In this phase, the evolutionary algorithms evaluated 6000 and 25,248 different solutions for NSGA-II and CENSGA, respectively. Figure 8 shows the non-dominated Pareto front of the guardian phase of the problem.
The outcome of the guardian phase is passed to the contingent phase as a fixed policy, since there is a recurrent Pulse guardian policy that will be applied to control the infection rate. Consequently, the guardian control policy was selected from the optimal non-dominated solution of the guardian phase, which is marked with a red symbol in Figure 8. This corresponds to the guardian control policy Δtgc = 8.3335 and vgc = 0.8752, which were included in Equation (6).
All solutions generated by the evolutionary algorithms with the local search operator based on a hash table are visualized in Figure 9, where 77,000 solutions for NSGA-II and 637,560 for CENSGA are evaluated in all executions of the contingent phase. In general, the solutions obtained by the two algorithms belong to the same exploration area. Conversely, CENSGA can exploit more due to the introduction of Controlled elitism procedure; the search algorithm effectively obtains diversity in both directions, i.e., the Pareto-optimal front and lateral to the Pareto-optimal front. The Pareto front of the contingent phase of the optimization process is represented in Figure 10. All those solutions verify all constrains. The red star marks the selected Pareto-optimal solution for both fronts from the optimal non-dominated solution set. The final non-dominated set of complete controls shows a higher number of smooth, better spaced and more variable solutions on CENSGA’s Pareto front compared to NSGA-II’s Pareto front.
A fast non-dominated sorting procedure was executed using the objective functions of the final hash table. A partial set of the sorted non-dominated set of robust complete control policies is presented in Table 4. This table shows the top 30 solutions’ objective function values. Two probabilities are defined: Pc indicates the disease is “under control” after the end of the contingent phase, calculated as the ratio of realizations in which the number of infected individuals approaches 0.01N or below; and the probability of disease eradication, PRE, is defined as the ratio of realizations in which REF is under one within the simulation time horizon.
The performance indices of the top 30 solutions of NSGA-II and CENSGA are indicated in Table 4. The mean values of PC and PRE presented in Table 4 and Figure 11, Figure 12 and Figure 13 are now analyzed for the sake of comparison. The data are analyzed using the indicated two probabilities PC and PRE. By definition, multi-objective problems are characterized by the fact that an improvement in one objective usually causes a deterioration in the other objective, which may lead to a biased judgment if we build our comparison based only on objective values. Thus, we selected two candidate solutions from both Pareto fronts by marking the midpoints in Figure 10 with a red star (i.e., solution 8 for NSGA-II and solution 10 for CENSGA). The candidate solutions represent average and non-extreme points among their relative fronts. It is noticeable that, on average, CENSGA outperforms NSGA-II with respect to objective one value, and in the performance probability PC, while in the probability PRE, both algorithms perform equally. Furthermore, the mean probability of disease eradication is increased from 46% to 58% (an increase of almost 12%), while the probability PRE holds its position. Besides this, we can observe a slight geometric closeness among the candidate solutions, with an increase in the probability of disease eradication from 58% to 74% (an increase of 16%); however, the probability of PRE records a limited improvement, by 1%, in favor of the CENSGA policy. This means that the candidate CENSGA solution tends to be both financially cheaper and more effective in disease control. This can be explained by the “time is money policy”, which reflects that the correct determination of campaign timing is a key aspect of vaccination, which is reflected in cost saving. It is worth mentioning that both algorithms perform well in the selected solutions. A quick glance at Figure 12 indicates that the CENSGA solution suggests almost the same number of vaccination campaigns (minus one) as the NSGA-II control, while decreasing the proportion of the vaccination ratio (refer to Figure 12). This enhances the considered time window in which the number of those susceptible becomes lower and the number of those recovered becomes higher—due to the combined effect of the vaccination and the correct initiation of the campaigns. This is reflected more obviously in the number of realizations in which the disease is under control and progressing to eradication. The SIR behavior of these solutions is visualized in Figure 11. The mean number of vaccinated individuals in each campaign is presented in Figure 12, while Figure 13 outlines the difference in mean performance of PC and PRE.
It is worth mentioning that the candidate solutions may have better options, such as solutions 4 and 9 for NSGA-II and solutions 4 and 7 for CENSGA. However, all these solutions are rejected, even though they show better PC and PRE values, as they all involve costly vaccination campaigns. The same narrative is applied to other similar solutions as well.

8. Efficiency Performance Measures

The quality indicators (QI) for multi-objective optimization involve considerably large numbers of performance measures. These measurements have been proposed to approximate the quality of the produced Pareto front. In this work, the algorithms are coded using R Studio 2022.02.2 (Build 485) and implemented on a PC using MacOS Big Sur, 2.40 GHz Quad-Core Intel Core i5, RAM 16 GB 2133 MHz LPDDR3. To evaluate the algorithms, we applied a set of performance indicators that fall under four principal classes: cardinality, convergence, distribution and spread. In practice, when the real Pareto front is unknown, the reference set often consists of the non-dominated solutions of the collections of all solutions produced during the search [54]. For instance, we combined the Pareto fronts of NSGA-II and CENSGA, and then applied fast non-dominated sorting, ranking and crowd distance functions in the collection to produce the reference set.
1.
Error ratio (ER)
This measure of cardinality is given by the following formula:
E R P = 1 P a P e a
where
e a 0                   i f   p o i n t   a   b e l o n g s   t o   t o   P F 1                                                                           o t h e r w i s e  
A set of non-dominated points ∈ (P) within the reference set (PF) will have an error ratio of 0; otherwise, the error ratio will be assigned as 1 [54].
2.
Generational distance (GD)
This indicator of convergence is given by the following formula:
G D P , P F = 1 P a P min r P F | | F a F r | | 2 1 2  
GD measures the distance between a given Pareto front (P) with the reference set (PF), where min r P F | | F a F r | | denotes the minimum Euclidean distance between point (a) and the points ® in (PF). This indicator measures the distance between the Pareto front of a particular algorithm and the reference set. The lower the outcome of GD, the better the performance is [55].
3.
ε-indicator (ε-IQ)
This indicator of convergence and spread is given by the following formula:
ε X P , P F = max p f P F min p P max j 1 m p f j p j
The ε-indicator is to be minimized, where ε X P 1 , P F < ε X P 2 , P F indicates that the set P1 dominates P2. It scales the gap of a particular set to the true Pareto front, represented here by the reference set [54].
4.
Hypervolume metric (HV)
This indicator of convergence and distribution is given by the following formula:
H V P , P F = λ a P ,   a     r a ; r
where λ denotes the Lebesgue measure [56]. In other words, a measure of the union of boxes. Given Pareto front P⊂ Rm with a reference point rPF, where [a;r] = {sRm | a ≤ s and s ≤ r} denotes the box bounded below by aP and above by rPF. HV favors a higher quality value for a set of given solutions. This can be interpreted as implying that the bigger the volume of the union of the hypercubes determined by each of the Pareto front solutions and the reference set points, the better it is [54].

8.1. Analysis and Comparison of Results

Besides the previous case study, a quality performance measurement was performed to evaluate the effectiveness of the proposed optimization algorithm. Model parameters were taken from the literature and are representative of various real estimated influenza scenarios. For testing, a set of different scenarios are suggested based on real epidemic situations. Table A1 characterizes the suggested epidemics with their origin sources. A total of nine computational experiments were planned and executed, considering different SIR parameters settings. For each pair of γ ∈ {1/5, 1/7, 1/9} and β ∈ {1.18, 2.36, 4.72}, NSGA-II and CENSGA were run independently on the last phase of the optimization problem. The parameters used for the optimization algorithms are set similarly. The number of generations was set to 50, the population size to 40, the probability of crossover to 1, the probability of mutation to 0.2 and the distribution index for crossover and mutation to 10. The final quality performance measures are presented in Table 5.
The collection of values tabulated in Table 5 indicate the performances of both algorithms in all experiments. In general, CENSGA performed better than NSGA-II in all IQs under different scenarios. For instance, a higher error ratio means the less representative an algorithm is of the reference set. In all experiments, CENSGA has a better representation on the reference set than NSGA-II. The same performance is shown by generational distance, where, in this IQ, it is shown that CENSGA tends to be more convergent to the reference set than NSGA-II, particularly in scenarios 1, 6 and 9, in which all CENSGA points are included in the reference set. The convergence and space IQ (i.e., ε-indicator) affirm the findings of the previous two IQs, especially in scenarios 6, 8 and 9, where all CENSGA points are well-spaced over the front. Finally, the distribution of the points on the front was greater in CENSGA in comparison to NSGA-II, which means that CENSGA performs well in terms of the hypervolume indicator in all experiments; in scenarios 2, 3, 6 and 9, the differences are remarkable.

8.2. Statistical Analysis

A non-parametric test called the Wilcoxon Rank Sum test was applied to analyze the results statistically [57]. The results for the non-parametric Wilcoxon Rank Sum test for the four metrics are given in Table 6. In this statistical test, the null hypothesis (H0) is defined as “The difference between the two metrics medians are equal”, while the alternative hypothesis is given by “At least one median is different”. The hypothesis is analyzed with confidence 0.95. This means that, if the statistical test returns a p-value less than 0.05, then the metrics may be considered significantly different.

Statistical Test

According to the statistical test results reported in Table 6, the p-value of the Wilcoxon Rank Sum non-parametric test for all performance metrics is less than 0.05; thus, H0 is rejected for all performance measures. In this way, for each IQ measure, the nine experiment cases were compared using the non-parametric Wilcoxon Rank Sum test. For each metric, the indicator values are presented in Figure A2. Statistical differences were detected in all mean experiments according to the p-values presented in Table 6. Therefore, it can be concluded that the proposed optimization engine CENSGA with the local search and hash table was outstanding in all mean experiments for diseases with diverse dynamical parameters.

9. Conclusions

This paper has presented a multi-objective optimization methodology for allocating a set of vaccination control policies over a specified time horizon. The goal is to minimize the volume of the infected population and the cost of vaccination campaigns. We used an SIR model to simulate an epidemic in order to synthesize a two-phased control system: the guardian control and the contingent control. For each control policy, the time interval between vaccination policies and the proportion to be vaccinated are considered as decision variables. In this way, a high infection curve is mitigated within a cost-wise budget. To solve the synthesis problem, a non-dominated metaheuristic algorithm CENSGA is designed, which provides fast, elitist and efficient solutions. For better convergence, the CENSGA was incorporated with local searches, and a hash table was embedded to hold non-dominated solutions from every generation in order to avoid the repetition or unnecessary revaluation of old solutions. A final set of Pareto-optimal solutions of the complete vaccination campaign was determined via a multi-objective algorithm, indicating multiple trade-offs between public health and cost units. Thus, the proposed approach delivers alternative robust solutions for vaccination campaigns to the policymaker. The statistical analysis of the proposed approach indicates the significant applicability of the proposed CENSGA compared to the well-known NSGA-II.
The proposed approach of synthesizing a set of optimal vaccination policies via two phases—the guardian and the contingent controls—and the robust dominance approach can be applied in other situations, using models that are more detailed and realistic. In the future, a range of potential extensions can be added, such as an age structure, a spatial structure, seasonality, modeling the epidemic with SEIR and performing a population-based local search, in addition to considering real-life applications.

Author Contributions

Conceptualization, A.K.A. and M.H.; methodology, A.K.A.; software, A.K.A.; validation, A.K.A.; formal analysis, A.K.A.; investigation, A.K.A.; resources, A.K.A.; writing—original draft preparation, A.K.A.; writing—review and editing, M.H.; visualization, A.K.A.; supervision, M.H.; project administration, M.H.; funding acquisition, A.K.A. All authors have read and agreed to the published version of the manuscript.

Funding

This work was supported by the “Research Center of College of Computer and Information Sciences”, Deanship of Scientific Research, King Saud University.

Data Availability Statement

Not applicable.

Acknowledgments

This research project was supported by a grant from the “Research Center of College of Computer and Information Sciences”, Deanship of Scientific Research, King Saud University.

Conflicts of Interest

The authors declare no conflict of interest.

Appendix A

Table A1. Suggested epidemic experiments with their origin sources.
#Type of InfluenzaLocationR0 valueEstimated R0Estimated Experiments
12009 influenza A/H1N1 pandemicDenmark [58]2.8–4.03.5γ = 1/5, β = 1.18
2SARS-CoVHong Kong, Vietnam, Singapore, and Canada [59]3.1–4.54.2γ = 1/5, β = 2.36
31918 Influenza A/H1N1 PandemicDenmark [58]3.6–5.44.73γ = 1/5, β = 4.72
4MERS-COVSaudi Arabia, South Korea [59]2.0–7.06.88γ = 1/7, β = 1.18
5COVID-19 AlphaIran [60]2.26–12.138.26γ = 1/7, β = 2.36
6COVID-19 DeltaIran [60]3.0–23.39.29γ = 1/7, β = 4.72
7COVID-19 OmicronSouth Africa [61]1.5–24.013.77γ = 1/9, β = 1.18
8Seasonal influenza epidemics (H1N1)United Kingdom [58]16.0-21.016.52γ = 1/9, β = 2.36
9Seasonal influenza epidemics (H1N1)United Kingdom [58]16.0-21.018.59γ = 1/9, β = 4.72
Figure A1. Flowchart of the CENSGA algorithm.
Electronics 11 03711 g0a1
Figure A2. Performance measures of all mean experiment cases. (A) Error ratio. (B) Generational distance. (C) ε-indicator. (D) Hypervolume.
Electronics 11 03711 g0a2

References

  1. Paget, J.; Spreeuwenberg, P.; Charu, V.; Taylor, R.J.; Iuliano, A.D.; Bresee, J.; Simonsen, L.; Viboud, C. Global mortality associated with seasonal influenza epidemics: New burden estimates and predictors from the GLaMOR Project. J. Glob. Health 2019, 9, 020421. [Google Scholar] [CrossRef] [PubMed]
  2. Plotkin, S.A.; Orenstein, W.A.; Offit, P.A. (Eds.) Plotkin’s Vaccines, 7th ed.; Elsevier: Philadelphia, PA, USA, 2018. [Google Scholar]
  3. Cardoso, R.T.N.; Dusse, A.C.S.; Adam, K. Optimal Vaccination Campaigns Using Stochastic SIR Model and Multiobjective Impulsive Control. Trends Comput. Appl. Math. 2021, 22, 201–220. [Google Scholar] [CrossRef]
  4. World Health Organization, Global Influenza Programme, University of Edinburgh, and World Health Organization, A Manual for Estimating Disease Burden Associated with Seasonal Influenza. 2015. Available online: http://apps.who.int/iris/bitstream/10665/178801/1/9789241549301_eng.pdf?ua=1 (accessed on 7 March 2020).
  5. Cardoso, R.T.N.; Takahashi, R.H.C. Solving Impulsive Control Problems by Discrete-Time Dynamic Optimization Methods. Trends Comput. Appl. Math. 2008, 9, 21–30. [Google Scholar] [CrossRef] [Green Version]
  6. Da Cruz, A.R.; Cardoso, R.T.N.; Takahashi, R.H.C. Multiobjective synthesis of robust vaccination policies. Appl. Soft Comput. 2017, 50, 34–47. [Google Scholar] [CrossRef]
  7. Dusse, A.C.S.; Cardoso, R.T.N. Using a Stochastic SIR Model to Design Optimal Vaccination Campaigns via Multiobjective Optimization. In Trends in Biomathematics: Modeling Cells, Flows, Epidemics, and the Environment; Mondaini, R.P., Ed.; Springer International Publishing: Cham, Switzerland, 2020; pp. 245–258. [Google Scholar] [CrossRef]
  8. Hethcote, H.W. The Mathematics of Infectious Diseases. SIAM Rev. 2000, 42, 599–653. [Google Scholar] [CrossRef] [Green Version]
  9. Hinman, A. Eradication of Vaccine-Preventable Diseases. Annu. Rev. Public Health 1999, 20, 211–229. [Google Scholar] [CrossRef]
  10. Kim-Farley, R. Global Immunization. Annu. Rev. Public Health 1992, 13, 223–237. [Google Scholar] [CrossRef]
  11. Goldberg, D.E. Genetic Algorithms in Search, Optimization, and Machine Learning; Addison-Wesley Pub. Co.: Reading, MA, USA, 1989. [Google Scholar]
  12. Deb, K.; Goel, T. Controlled Elitist Non-dominated Sorting Genetic Algorithms for Better Convergence. In Evolutionary Multi-Criterion Optimization; Springer: Berlin/Heidelberg, Germany, 2001; pp. 67–81. [Google Scholar]
  13. Jaszkiewicz, A. A Comparative Study of Multiple-Objective Metaheuristics on the Bi-Objective Set Covering Problem and the Pareto Memetic Algorithm. Ann. Oper. Res. 2004, 131, 135–158. [Google Scholar] [CrossRef]
  14. Hajipour, V.; Tavana, M.; Santos-Arteaga, F.J.; Alinezhad, A.; di Caprio, D. An efficient controlled elitism non-dominated sorting genetic algorithm for multi-objective supplier selection under fuzziness. J. Comput. Des. Eng. 2020, 7, 469–488. [Google Scholar] [CrossRef]
  15. Yazdani, M.; Zandieh, M.; Tavakkoli-Moghaddam, R. Evolutionary algorithms for multi-objective dual-resource constrained flexible job-shop scheduling problem. Opsearch 2019, 56, 983–1006. [Google Scholar] [CrossRef]
  16. Lara-Molina, F.A.; Rosario, J.M.; Dumur, D. Multi-objective optimization of Stewart-Gough manipulator using global indices. In Proceedings of the 2011 IEEE/ASME International Conference on Advanced Intelligent Mechatronics (AIM), Budapest, Hungary, 3–7 July 2011; pp. 79–85. [Google Scholar] [CrossRef]
  17. Ghodratnama, A.; Tavakkoli-Moghaddam, R.; Kalami-Heris, S.M.; Nagy, G. Solving a novel multi-objective uncapacitated hub location problemby five meta-heuristics. J. Intell. Fuzzy Syst. 2015, 28, 2457–2469. [Google Scholar] [CrossRef]
  18. Abul’Wafa, A.R. Optimization of economic/emission load dispatch for hybrid generating systems using controlled Elitist NSGA-II. Electr. Power Syst. Res. 2013, 105, 142–151. [Google Scholar] [CrossRef]
  19. Patel, R.; Longini, I.M.; Halloran, M.E. Finding optimal vaccination strategies for pandemic influenza using genetic algorithms. J. Theor. Biol. 2005, 234, 201–212. [Google Scholar] [CrossRef]
  20. Hu, X.; Zhang, J. Optimizing Vaccine Distribution for Different Age Groups of Population Using DE Algorithm. In Proceedings of the 2013 Ninth International Conference on Computational Intelligence and Security, Emei Mountain, China, 14–15 December 2013; pp. 21–25. [Google Scholar] [CrossRef]
  21. Hu, X.-M.; Zhang, J.; Chen, H. Optimal Vaccine Distribution Strategy for Different Age Groups of Population: A Differential Evolution Algorithm Approach. Hindawi 2014, 2014, 7. [Google Scholar] [CrossRef] [Green Version]
  22. Da Cruz, A.R.; Cardoso, R.T.N.; Takahashi, R.H.C. Multi-objective Design with a Stochastic Validation of Vaccination Campaigns. IFAC Proc. Vol. 2009, 42, 289–294. [Google Scholar] [CrossRef]
  23. Jiang, H.; Yang, X.; Yin, K.; Zhang, S.; Cristoforo, J.A. Multi-path QoS-Aware Web Service Composition using Variable Length Chromosome Genetic Algorithm. Inf. Technol. J. 2010, 10, 113–119. [Google Scholar] [CrossRef] [Green Version]
  24. Brie, A.H.; Morignot, P. Genetic Planning Using Variable Length Chromosomes. In Proceedings of the Fifteenth International Conference on International Conference on Automated Planning and Scheduling, Monterey, VA, USA, 5–10 June 2005; pp. 320–329. [Google Scholar]
  25. Cruz-Piris, L.; Marsa-Maestre, I.; Lopez-Carmona, M.A. A Variable-Length Chromosome Genetic Algorithm to Solve a Road Traffic Coordination Multipath Problem. IEEE Access 2019, 7, 111968–111981. [Google Scholar] [CrossRef]
  26. Banzhaf, W. (Ed.) Genetic Programming: An Introduction on the Automatic Evolution of Computer Programs and Its Applications; Morgan Kaufmann Publishers: San Francisco, CA, USA; Dpunkt-Verlag: Heidelburg, Germany, 1998. [Google Scholar]
  27. Pal, R.; Mukhopadhyay, S.; Chakraborty, D.; Suganthan, P.N. Very high-resolution satellite image segmentation using variable-length multi-objective genetic clustering for multi-class change detection. J. King Saud Univ. Comput. Inf. Sci. 2022, 34, S1319157821003694. [Google Scholar] [CrossRef]
  28. Zhou, A.; Qu, B.-Y.; Li, H.; Zhao, S.-Z.; Suganthan, P.N.; Zhang, Q. Multiobjective evolutionary algorithms: A survey of the state of the art. Swarm Evol. Comput. 2011, 1, 32–49. [Google Scholar] [CrossRef]
  29. Gunantara, N. A review of multi-objective optimization: Methods and its applications. Cogent Eng. 2018, 5, 1502242. [Google Scholar] [CrossRef]
  30. Hu, S.; Wu, X.; Liu, H.; Wang, Y.; Li, R.; Yin, M. Multi-Objective Neighborhood Search Algorithm Based on Decomposition for Multi-Objective Minimum Weighted Vertex Cover Problem. Sustainability 2019, 11, 3634. [Google Scholar] [CrossRef] [Green Version]
  31. Hagens, A.; İnkaya, A.Ç.; Yildirak, K.; Sancar, M.; van der Schans, J.; Acar Sancar, A.; Ünal, S.; Postma, M.; Yeğenoğlu, S. COVID-19 Vaccination Scenarios: A Cost-Effectiveness Analysis for Turkey. Vaccines 2021, 9, 399. [Google Scholar] [CrossRef]
  32. Kermack, W.; McKendrick, A. A contribution to the mathematical theory of epidemics. Proc. R. Soc. Lond. Ser. Contain. Pap. Math. Phys. Character 1927, 115, 700–721. [Google Scholar] [CrossRef] [Green Version]
  33. Aletreby, W.T.; Alharthy, A.M.; Faqihi, F.; Mady, A.F.; Ramadan, O.E.; Huwait, B.M.; Alodat, M.A.; Lahmar, A.B.; Mahmood, N.N.; Mumtaz, S.A.; et al. Dynamics of SARS-CoV-2 outbreak in the Kingdom of Saudi Arabia: A predictive model. Saudi Crit. Care J. 2020, 4, 79. [Google Scholar] [CrossRef]
  34. Van den Driessche, P. Reproduction numbers of infectious disease models. Infect. Dis. Model. 2017, 2, 288–303. [Google Scholar] [CrossRef]
  35. Shulgin, B. Pulse vaccination strategy in the SIR epidemic model. Bull. Math. Biol. 1998, 60, 1123–1148. [Google Scholar] [CrossRef]
  36. Hill, A.N.; Longini, I.M. The critical vaccination fraction for heterogeneous epidemic models. Math. Biosci. 2003, 181, 85–106. [Google Scholar] [CrossRef]
  37. Duijzer, L.E.; van Jaarsveld, W.; Dekker, R. The benefits of combining early aspecific vaccination with later specific vaccination. Eur. J. Oper. Res. 2018, 271, 606–619. [Google Scholar] [CrossRef] [Green Version]
  38. Yang, T. Impulsive control. IEEE Trans. Autom. Control 1999, 44, 1081–1083. [Google Scholar] [CrossRef]
  39. Bertsekas, D.P. Dynamic Programming and Optimal Control, Volume 1, 2nd ed.; Athena Scientific: Belmont, MA, USA, 2000. [Google Scholar]
  40. Ha, V.-P.; Dao, T.-K.; Pham, N.-Y.; Le, M.-H. A Variable-Length Chromosome Genetic Algorithm for Time-Based Sensor Network Schedule Optimization. Sensors 2021, 21, 3990. [Google Scholar] [CrossRef]
  41. Kim, I.Y.; de Weck, O.L. Variable chromosome length genetic algorithm for progressive refinement in topology optimization. Struct. Multidiscip. Optim. 2005, 29, 445–456. [Google Scholar] [CrossRef]
  42. Gobeyn, S.; Goethals, P.L.M. A Variable Length Chromosome Genetic Algorithm Approach to Identify Species Distribution Models Useful for Freshwater Ecosystem Management. In Environmental Software Systems. Computer Science for Environmental Protection; Hřebíček, J., Denzer, R., Schimak, G., Pitner, T., Eds.; Springer International Publishing: Cham, Switzerland, 2017; Volume 507, pp. 196–208. [Google Scholar] [CrossRef] [Green Version]
  43. Pawar, S.N.; Bichkar, R.S. Genetic algorithm with variable length chromosomes for network intrusion detection. Int. J. Autom. Comput. 2015, 12, 337–342. [Google Scholar] [CrossRef]
  44. Deb, K.; Pratap, A.; Agarwal, S.; Meyarivan, T. A fast and elitist multiobjective genetic algorithm: NSGA-II. IEEE Trans. Evol. Comput. Evol. Comput. 2002, 6, 182–197. [Google Scholar] [CrossRef] [Green Version]
  45. Deb, K.; Sindhya, K.; Okabe, T. Self-adaptive simulated binary crossover for real-parameter optimization. In Proceedings of the 9th annual conference on Genetic and evolutionary computation (GECCO’07), London, UK, 7–11 July 2007; p. 1187. [Google Scholar] [CrossRef]
  46. Deb, K.; Deb, D. Analysing mutation schemes for real-parameter genetic algorithms. Int. J. Artif. Intell. Soft Comput. 2014, 4, 1. [Google Scholar] [CrossRef]
  47. Mohapatra, P.; Nayak, A.; Kumar, S.K.; Tiwari, M.K. Multi-objective process planning and scheduling using controlled elitist non-dominated sorting genetic algorithm. Int. J. Prod. Res. 2015, 53, 1712–1735. [Google Scholar] [CrossRef]
  48. Szymanski, T.G. Hash table reorganization. J. Algorithms 1985, 6, 322–335. [Google Scholar] [CrossRef]
  49. Najafi, A.A.; Niaki, S.T.A.; Shahsavar, M. A parameter-tuned genetic algorithm for the resource investment problem with discounted cash flows and generalized precedence relations. Comput. Oper. Res. 2009, 36, 2994–3001. [Google Scholar] [CrossRef]
  50. Tavakkoli-Moghaddam, R.; Vazifeh-Noshafagh, S.; Taleizadeh, A.A.; Hajipour, V.; Mahmoudi, A. Pricing and location decisions in multi-objective facility location problem with M/M/m/k queuing systems. Eng. Optim. 2017, 49, 136–160. [Google Scholar] [CrossRef]
  51. Uray, E.; Carbas, S.; Geem, Z.W.; Kim, S. Parameters Optimization of Taguchi Method Integrated Hybrid Harmony Search Algorithm for Engineering Design Problems. Mathematics 2022, 10, 327. [Google Scholar] [CrossRef]
  52. Kv, S.; Baskar, J.; Paul, P. Overview on L9 Taguchi Optimizational Method. Int. J. Adv. Res. Eng. Technol. 2019, 10, 652–658. [Google Scholar] [CrossRef]
  53. Montgomery, D.C. Design and Analysis of Experiments, 8th ed.; John Wiley & Sons, Inc.: Hoboken, NJ, USA, 2013. [Google Scholar]
  54. Li, M.; Yao, X. Quality Evaluation of Solution Sets in Multiobjective Optimisation: A Survey. ACM Comput. Surv. 2020, 52, 26. [Google Scholar] [CrossRef]
  55. Santos, T.; Xavier, S. A Convergence indicator for Multi-Objective Optimisation Algorithms. TEMA 2018, 19, 437–448. [Google Scholar] [CrossRef] [Green Version]
  56. Audet, C.; Bigeon, J.; Cartier, D.; le Digabel, S.; Salomon, L. Performance indicators in multiobjective optimization. Eur. J. Oper. Res. 2021, 292, 397–422. [Google Scholar] [CrossRef]
  57. Higgins, J.J. An Introduction to Modern Nonparametric Statistics; Brooks/Cole: Pacific Grove, CA, USA, 2004. [Google Scholar]
  58. Biggerstaff, M.; Cauchemez, S.; Reed, C.; Gambhir, M.; Finelli, L. Estimates of the reproduction number for seasonal, pandemic, and zoonotic influenza: A systematic review of the literature. BMC Infect. Dis. 2014, 14, 480. [Google Scholar] [CrossRef] [Green Version]
  59. Xu, H.; Zhang, Y.; Yuan, M.; Ma, L.; Liu, M.; Gan, H.; Liu, W.; Lum, G.G.; Tao, F. Basic Reproduction Number of the 2019 Novel Coronavirus Disease in the Major Endemic Areas of China: A Latent Profile Analysis. Front. Public Health 2021, 9, 575315. [Google Scholar] [CrossRef]
  60. Sheikhi, F.; Yousefian, N.; Tehranipoor, P.; Kowsari, Z. Estimation of the basic reproduction number of Alpha and Delta variants of COVID-19 pandemic in Iran. PLoS ONE 2022, 17, e0265489. [Google Scholar] [CrossRef]
  61. Liu, Y.; Rocklöv, J. The effective reproductive number of the Omicron variant of SARS-CoV-2 is several times relative to Delta. J. Travel Med. 2022, 29, taac037. [Google Scholar] [CrossRef]
Figure 1. General outline of SIR model.
Electronics 11 03711 g001
Figure 2. Anatomy of the optimizer’s main components.
Electronics 11 03711 g002
Figure 3. Chromosome representation.
Electronics 11 03711 g003
Figure 4. Selection strategy of CENSGA.
Electronics 11 03711 g004
Figure 5. Controlled elitism procedure is illustrated.
Electronics 11 03711 g005
Figure 6. Main effects plot for the SN ratio of NSGA-II in (A) round 1 and (B) round 2.
Electronics 11 03711 g006
Figure 7. Main effects plot for SN ratio of CENSGA.
Electronics 11 03711 g007
Figure 8. Non-dominated pareto front of the guardian phase of the problem. Where, Black circles are solutions belong to PF, while red star indicates the selected solution Δtgc = 8.3335 and vgc = 0.8752. (A) NSGA-II, (B) CENSGA.
Electronics 11 03711 g008
Figure 9. Image set of all obtained solutions considering all executions of the evolutionary algorithms for the contingent phase presented in Equation (6). (A) NSGA-II, (B) CENSGA.
Electronics 11 03711 g009
Figure 10. Non-dominated Pareto front of the contingent phase problem. (A) NSGA-II, (B) CENSGA.
Electronics 11 03711 g010
Figure 11. SIR behavior under different situation. (A) SIR general behavior. (B) Behavior of the selected solution from NSGA-II. (C) Behavior of the selected solution from CENSGA.
Electronics 11 03711 g011aElectronics 11 03711 g011b
Figure 12. Mean number of vaccinations for (A) solution 8 from the NSGA-II non-dominated set and (B) solution 10 from the CENSGA non-dominated set.
Electronics 11 03711 g012
Figure 13. Mean values of PC and PRE.
Electronics 11 03711 g013
Table 1. Model parameters.
ParameterDefinitionValue
βTransmission rate2.36 (t.u.)−1
γRecovery rate of infected individuals1/7 (t.u.)−1
μ1Birth and mortality rate1/7 (t.u.)−1
R0Reproduction number15
itolTolerance ratio0.01
1 All newborns have no birth immunity against flu. Additionally, according to the CDC estimation between 2010 and 2020, flu is annually responsible for 9 million–41 million illnesses, 140,000–710,000 hospitalizations and 12,000–52,000 deaths. https://www.cdc.gov/flu/about/burden/index.html [accessed on 1 November 2022].
Table 2. The levels defined for the parameters of NSGA-II and CENSGA.
AlgorithmParametersParameters Levels
Level 1Level 2Level 3
NSGA-IIPopulation size (A)255070
Maximum generation (B)3050100
Crossover percentage (C)0.60.751
Mutation percentage (D)0.10.20.4
CENSGAPopulation size (A)255070
Maximum generation (B)3050100
Geometric distribution (C)0.10.50.9
Crossover percentage (D)0.60.751
Mutation percentage (E)0.10.20.4
Table 3. Optimal values for the parameters of NSGA-II and CENSGA.
AlgorithmParametersOptimal Value
NSGA-IIPopulation size (A)70
Maximum generation (B)50
Crossover percentage (C)1
Mutation percentage (D)0.2
CENSGAPopulation size (A)70
Maximum generation (B)100
Geometric distribution (C)0.9
Crossover percentage (D)1
Mutation percentage (E)0.1
Table 4. Top 30 non-dominated solutions.
Solution #NSGA-IICENSGA
F1F2PCPREF1F2PCPRE
157.275461481.7840.030.5840.179712155.6310.930.56
242.265282162.2720.910.5639.226172246.8020.960.57
342.483871972.4310.910.5642.483871972.4310.510.59
443.328052097.4670.900.6149.022401709.2730.910.61
543.531461965.4150.500.5842.341672031.0650.720.58
649.044021851.6180.170.5750.178261632.0850.600.60
749.626231772.6590.080.5848.956361757.9000.920.61
850.123841676.4110.580.6057.338331423.5450.020.54
949.865421746.7250.880.6155.678791474.3480.050.59
1055.461001490.2850.070.5850.092971663.3200.740.61
1146.897651929.9520.620.5940.517512118.7970.910.51
1249.626231772.6590.080.5842.560961970.5380.620.60
1348.088371867.6850.450.5839.265452214.0840.950.57
1444.332121957.9200.580.5839.249222246.2830.960.57
1555.157761509.7110.090.5854.855111483.8550.090.58
1650.789421626.5210.440.6041.071642095.0110.910.55
1745.857731938.3580.720.5950.783631624.5020.460.60
1842.631342139.6780.920.5644.590671887.6260.400.61
1947.007481909.5770.550.5940.334982136.1600.920.52
2050.676611660.0340.490.6054.612291511.1370.120.57
2145.857731938.3580.720.5945.187991874.3210.330.59
2244.644551941.9960.450.5842.962601953.1690.570.61
2354.567211527.1070.120.5854.176201513.5150.130.58
2443.017302124.9420.900.5740.334982136.1600.920.52
2551.057531606.5000.300.5943.293241930.2750.540.59
2654.169091527.4880.140.5949.903591679.9940.640.59
2743.666101959.6210.460.5854.732711501.4570.070.58
2845.138411939.5800.270.5648.384271783.3140.150.61
2953.587851543.4450.180.6041.454572076.0250.850.60
3052.044411587.1480.300.6051.001401618.9190.400.59
Average48.3939841807.511570.460.5846.49238471847.384730.580.58
Table 5. Nine computational experiments and their associated QI values.
#ExperimentsNSGA-IICENSGA
ERGDε-IQHVERGDε-IQHV
1γ = 1/5, β = 1.180.7062.36855.1200.7140.32600.0180.999
2γ = 1/5, β = 2.360.6791.57679.5120.3070.3440.4530.3620.995
3γ = 1/5, β = 4.720.6761.034480.4190.310980.3990.2390.3180.998
4γ = 1/7, β = 1.180.7112.633125.5540.6320.3530.0030.11950.99985
5γ = 1/7, β = 2.360.7272.58167.0800.9260.3050.9291.0940.992
6γ = 1/7, β = 4.720.7421.06441.4470.2710.279001
7γ = 1/9, β = 1.180.6881.94649.8320.7620.3650.8451.3840.995
8γ = 1/9, β = 2.360.6562.10855.4250.5870.40950.09900.9992
9γ = 1/9, β = 4.720.8130.44425.2570.4740.187001
Table 6. p-values returned by the Wilcoxon Rank Sum test.
p-ValueERGDε-IQHV
0.00041229480.0010605760.0004010390.0004094601
Publisher’s Note: MDPI stays neutral with regard to jurisdictional claims in published maps and institutional affiliations.

