Article

Learning to Co-Embed Queries and Documents

1
School of Law, Guangdong University of Technology, Guangzhou 510520, China
2
Sino-French Institute of Nuclear Engineering and Technology, Sun Yat-sen University, Zhuhai 519082, China
3
Department of Machine Learning, Mohamed bin Zayed University of Artificial Intelligence, Abu Dhabi 028113333, United Arab Emirates
*
Author to whom correspondence should be addressed.
Electronics 2022, 11(22), 3694; https://doi.org/10.3390/electronics11223694
Submission received: 11 August 2022 / Revised: 28 September 2022 / Accepted: 4 November 2022 / Published: 11 November 2022
(This article belongs to the Special Issue Natural Language Processing and Information Retrieval)

Abstract

:
Learning to Rank (L2R) methods that utilize machine learning techniques to solve the ranking problems have been widely studied in the field of information retrieval. Existing methods usually concatenate query and document features as training input, without explicit understanding of relevance between queries and documents, especially in pairwise based ranking approach. Thus, it is an interesting question whether we can devise an algorithm that effectively describes the relation between queries and documents to learn a better ranking model without incurring huge parameter costs. In this paper, we present a Gaussian Embedding model for Ranking (GERank), an architecture for co-embedding queries and documents, such that each query or document is represented by a Gaussian distribution with mean and variance. Our GERank optimizes an energy-based loss based on the pairwise ranking framework. Additionally, the KL-divergence is utilized to measure the relevance between queries and documents. Experimental results on two LETOR datasets and one TREC dataset demonstrate that our model obtains a remarkable improvement in the ranking performance compared with the state-of-the-art retrieval models.

1. Introduction

Ranking is one of the most essential techniques in many real-world applications, such as collaborative filtering [1,2,3,4,5], document retrieval [6,7,8], online advertising [9,10,11], and sentiment analysis [12,13]. Good ranking results would positively contribute to the success of all these ranking-based applications. The main objective of ranking is to rank the candidate entities, such as documents in ad hoc retrieval and items in recommendation systems, by their relevance scores to a given query, which can be a set of keywords in ad hoc retrieval and users in recommendation systems. To deal with the ranking problems, most of the traditional approaches [14,15] are built based on some score functions that combine a series of rules according to the historical data and the characteristics of the entities to be ranked. However, such score functions rely strongly on manual design, which is not desirable in many retrieval applications with large scale and various types of data. Compared to score functions, machine learning-based ranking models [16,17,18,19,20,21] have a higher computational efficiency and perform better ranking results than those produced by the traditional score function-based approaches in many applications. Learning to rank (L2R) as one of the most important machine learning techniques to solve the ranking problems have been wildly applied in information retrieval as its ability to improve performance, e.g., accuracy, of the ranking results. Therefore, how to design L2R models for specific applications and how to optimize the models have achieved significant attention in information retrieval these years. Specifically, in this paper, we study the core problem in information retrieval, i.e., designing a L2R model for document retrieval and optimizing the model to produce a final rank list of documents in response to a given query.
Most of the L2R models for document retrieval can be divided into three categories of approaches according to the way they train the models [22]: pointwise, pairwise, and listwise L2R models. The basic idea of pointwise L2R models is to take each query–document pair in the training set as a training data and adopt classification or regression approaches to train the model to obtain a ranking, where each document is treated as a separate training data point. The objective of these ranking methods is to solve the ordinary regression or classification problem. They do not explicitly consider the relationship among relevant documents. Pairwise L2R approaches are to consider the order of two documents in each document pair in terms of their relevances to the given query during training. The learning goal is to make the number of partial errors in the result list as few as possible. Listwise approaches use the entire document lists as training instances. In these approaches, each result list of documents in response to a given query is regarded as training data. The key to the design of these algorithms is to define a loss function based on listwise and select appropriate tools for learning. Listwise L2R models can be broadly divided into two categories: (a) List-level sorting algorithms based on the probability model, such as the ListNet [19] algorithm, one of the well-known representatives that falls into this category. (b) Ranking algorithms based on direct optimization evaluation metrics, e.g., NDCG [23] and MAP [24]. However, it is difficult to select an appropriate optimization algorithm to solve it. Generally, the pairwise and listwise approaches work better than the pointwise approaches [25] because the key issue of ranking in search is to determine the orders of documents but not to judge the relevance of documents, which is exactly the goal of the pairwise and listwise approaches. Compared to listwise approaches, pairwise approaches are more widely used due to the consideration of the two documents’ order in each document pair and the low complexity.
All the aforementioned L2R models for document retrieval suffer from the following defects: (a) Most of the existing L2R models need to extract features of queries and documents. These features are usually extracted from different semantic space, which would result in the mismatch [26,27] between the input query and the documents. (b) Instead of applying language models for document retrieval, some of these L2R models apply word/document embedding techniques [28]. These embedding based L2R approaches represent each word in queries and documents by a single point in a low-dimensional continuous vector semantic space. However, simply representing words as points in the semantic space has a critical limitation: uncertainty of the representations is missing. However, uncertainty is inherent in embeddings and critical for measuring the similarity between queries and documents for document retrieval. Consider the case that we have two documents and a query: the similarity between the first document and the query (the similarity can be measured via, e.g., the cosine similarity between the average of all words’ embeddings in the documents and the average of all words’ embeddings in the input query, with higher cosine score indicating more similar.) is the same as that between the second document and the query, but the certainty (the certainty can be measured via, e.g., taking the covariances of all words’ embeddings in the documents and the input query into account.) between the first document, and the query is higher than that between the second document and the query. Then, the first document should be ranked higher than the second document.
Accordingly, to tackle the drawbacks of the existing L2R approaches, we propose a novel embedding based pairwise L2R model, Gaussian Embedding model for Ranking, abbreviated as GERank, to learn to infer the embeddings and their covariances of queries and documents such that the similarities between any given queries and documents can be effectively measured. In our GERank, queries and documents are co-embedded into the same semantic space, such that the semantic similarities between them can be effectively measured. To further enhance the retrieval performance, GERank represents each query and document as a Gaussian distribution with its mean and covariance. Specifically, given a query and a document pair, GERank enforces embedding of more relevant document in the document pair to be closer to the embedding of the input query compared to the embedding of less relevant document in the document pair. Each document pair in response to a given query in the training dataset naturally leads to our embedding learning constraints in our GERank. Taking into account the constraints of the embeddings and their covariances of queries and documents, we learn more powerful embeddings as we incorporate information about the relevance orders of the documents rather than just the relevance scores of the documents. Since GERank infers not only the embeddings but also the covariances of queries and documents, uncertainty of the embeddings can be applied to measure the similarity between queries and documents and thus contributing to better document retrieval performance. To evaluate the performance of our GERank algorithm, we conduct experiments on two LETOR datasets and one TREC dataset. In our experiments, we aim at answering these research questions: (a) Compared with traditional pairwise approaches, how does our model perform in the document ranking task? (b) Can we make the advantages of our GERank L2R model more explainable? (c) How do the embedding size and the size of hidden layer affect the retrieval performance of our model?
The main contributions of our paper can be summarized as follows:
  • We propose Gaussian Embedding model for Ranking, GERank, to co-embed queries and documents into the same semantic space so as to alleviate the mismatch problem between queries and documents.
  • To the best of our knowledge, our GERank algorithm is the first attempt to incorporate embedding techniques into L2R algorithms with constraints.
  • To further enhance the performance of document retrieval, GERank learns to infer both the embeddings and their covariances of queries and documents such that their similarities can be effectively measured.
  • We provide the experimental evidence of the effectiveness of our model. Our model can outperform the state-of-the-art L2R models on two LETOR datasets and one TREC dataset.
The remainder of the paper is organized as follows: Section 2 discusses related work. Section 3 formulates the ranking problem. Section 4 defines our embedding task and GERank algorithm. Section 5 describes experimental setup. Section 6 analyzes experimental results. Finally, Section 7 concludes the paper.

2. Related Work

There are two lines of previous studies related to our work: L2R algorithms and representation learning algorithms.

2.1. Learning to Rank

Learning to rank (L2R) [29,30] applies machine learning techniques to solve ranking problems. There are many classic and efficient L2R algorithms used in information retrieval. These algorithms can be categorised into pointwise, pairwise, and listwise L2R algorithms. Given an input query, pointwise L2R algorithms take each labeled document as a training instance, where the relevance scores of the documents are provided during the training, pairwise L2R algorithms take each pair of document as a training instance, where the ranking order of the two documents in each pair document are provided, while listwise L2R algorithms take different ranked lists of documents as training instances, where the information of which ranked list of documents performs better than another is provided during the training. Well-known pointwise L2R algorithms include subset regression [31] and Mcrank [32], and well-known listwise L2R algorithms include ListNet [19], AdaRank [33] and SVM m a p  [34]. Ranking SVM [16,17], RankBoost [18], and Frank [35] are the well-known algorithms based on the pairwise approach. Point-wise L2R algorithms ignore the order information of the documents, while generating a number of ranked lists of documents in response to a given query via different methods is challenging in listwise L2R algorithms. Of special interest to us are the pairwise L2R algorithms.
In recent years, deep learning is a hot research topic because of its powerful representation abilities. Combining deep learning to solve problems in computer vision, natural language processing, and other fields has achieved great success. In information retrieval, some researchers try to solve ranking problems with deep learning. Severyn et al.  [36] applied convolutional deep neural networks to rank short text pairs. Wang et al.  [37] proposed an attention-based deep net for listwise. ConvRankNet [38] combines a Siamese Convolutional Neural Network encoder and the RankNet ranking model which could be trained in an end-to-end fashion. Ai et al.  [39] employed a RNN to encode the top results using their feature vectors, learn a context model and use it to re-rank the top results. Zhao et al.  [40] proposed a novel joint learning-to-rank approach called Deep Latent Structural SVM (DL-SSVM). DL-SSVM can effectively model the intrinsic interaction relationships between the feature-level and ranking-level components of a ranking model. They presented an effective auxiliary variable-based alternating optimization approach with respect to deep neural network learning and structural latent SVM learning. These deep learning-based models can outperform the state-of-the-art. However, they are not parameterless and scalable. In addition, all the previous L2R algorithms do not take uncertainty of the relevances of the documents to the query into account, resulting in the fact that there is still some room to boost the performance of document retrieval via capturing and utilizing the uncertainty information of the queries and documents.

2.2. Representation Learning

Learning representations for data allows many data mining and information retrieval tasks to be solved more effectively and efficiently. For instance, DeepWalk [41] employs Skip-gram [42] to learn the representations of nodes. The model learns low-dimensional vectors for the nodes to capture the potential relationships among them. It outperforms challenging baselines which are allowed a global view of the network, especially in the presence of missing information. Shen et al.  [43] use convolutional neural networks for Web Search by learning semantic representations. Their model significantly outperforms other semantic models on a large-scale, real-world dataset.
In natural language processing, word embedding is widely used in a set of language modeling and feature learning techniques. In embedding techniques [44,45,46], entities, e.g., words, phrases, or documents, are mapped to low-dimensional continuous vectors, which are also called representations or embeddings. Generally, representation learning techniques involve a mathematical embedding from a high dimensional vector space to a continuous much lower dimensional vector space. Lai et al.  [47] provide several simple guidelines for training good word embeddings. They systematize existing neural-network-based word embedding methods and experimentally compare them using the same corpus. Zamani et al.  [48] propose two learning models with different objective functions: one learns a relevance distribution over the vocabulary set for each query, and another classifies each term as belonging to the relevant or non-relevant class for each query. Shen et al.  [49] conduct a point-by-point comparative study between Simple Word-Embedding-based Models, consisting of parameter-free pooling operations, relative to word-embedding-based RNN/CNN models. Their model exhibits comparable or even superior performance in the majority of cases considered.
Graph embedding [50,51,52,53] uses low-dimensional dense vectors to represent the points in the graph. In essence, the more adjacent the points are shared between two points, the more similar the context of two points is. The distance between two corresponding vectors is closer. The greatest advantage of graph embedding is that the vector representations can be taken as an input of any machine learning models to solve specific application problems. At the same time, it outperforms some traditional methods in a number of ways. For instance, the method based on matrix factorization (MF) requires too much computation. Constructing artificial features requires domain knowledge and a large amount of work. Graph embedding can be used in recommendation, node classification, link prediction, visualization, and other scenario. Vilnis et al.  [54] use Gaussian embeddings to represent words, which have great performance. He et al.  [55] represent knowledge graphs by Gaussian embedding. Zhou et al.  [56] propose a novel Gaussian Visual-Semantic Embedding (GVSE) model to jointly represent images and texts, which leverages the visual information to model text concepts as Gaussian distributions in semantic space. Bojchevski et al.  [57] learn versatile node embeddings on large scale graphs that show strong performance on tasks such as link prediction and node classification. However, there are few studies on L2R by Gaussian embedding.
Recently, few works begin to apply representation learning to the field of L2R. Yi et al.  [28] proposed a long short-term memory (LSTM) network with holographic composition (HD-LSTM) to model the relationship between question and answer representations. Benefitting from a rich representational learning approach without incurring huge parameter costs of holographic composition, HD-LSTM outperforms many other neural architectures on the benchmark dataset [58]. Inspired by their work and the idea of embedding nodes as Gaussian distribution, we adopt co-embedding queries and documents methods to capture the relationship between them.

3. Notations and Problem Formulation

Let C , Q and D Q be a document corpus, a set of queries, and the relevant documents to a set of queries Q , respectively. Let q, d, and D q denote a query, a document, and a set of relevant documents to the query q, respectively. Table 1 summarizes the main notations used across the whole paper.
Given a document corpus C , a set of queries Q , and their relevant documents D Q C in the corpus, we aim at training a Gaussian embedding model, GERank, such that it is able to infer a Gaussian distribution q = N ( μ q , Σ q ) for any given query q and a Gaussian distribution d = N ( μ d , Σ d ) for any given document d via a supervised way, where μ R L is the embedding (mean of the Gaussian distribution) of the query/document, and Σ R L × L is the corresponding uncertainty of the embedding (covariance of the Gaussian distribution), such that documents semantically similar to the input queries are also close to each other in the same embedding space measuring by a dissimilarity metric Δ ( q , d ) . Here, q = N ( μ q , Σ q ) and d = N ( μ d , Σ d ) are the inferred Gaussian distributions μ q and μ d for the query q and the document d and their covariances Σ q and Σ d , respectively; and L is the size of the embedding dimension. Specifically, we aim at seeking a low dimensional Gaussian distribution co-embedding query and document function h, i.e., the Gaussian embedding model, GERank that satisfies the following via a supervised way:
C , Q , D Q h q = N ( u q , Σ q ) , d = N ( u d , Σ d ) , for any given q and d , subject to : q Q , r d i q > r d j q , Δ ( q , d i ) < Δ ( q , d j ) ,
where r d i q and r d j q are the relevance scores of documents d i and d j in response to the input training query q, respectively. Once the model is optimized, given an input query q and a document d, GERank is able to infer their corresponding Gaussian embeddings, and then rank the documents according the dissimilarity metric Δ ( q , d ) where uncertainty is taken into account as q and d not only containing their means but also their corresponding covariances.

4. Learning to Co-Embed Queries and Documents

In this section, we detail our proposed model, GERank, that aims at inferring the embeddings of the queries and the documents, μ q and μ d , and their corresponding covariances, Σ q and Σ d . Specifically, in Section 4.1, we detail the way to compute the dissimilarity for each query document pair, i.e., the way to compute Δ ( q , d ) ; Section 4.2 details the constraints related to the dissimilarity between the inferred low dimensional Gaussian embeddings and their covariances of the queries q = N ( μ q , Σ q ) and those of the documents d = N ( μ d , Σ d ) ; Section 4.3 details our L2R model that aims at inferring q and d .

4.1. Dissimilarity Metric

In order to effectively infer the embeddings and their covariances of the queries and documents for document retrieval, we employ the Kullback–Leibler (KL) divergence as a metric to measure the dissimilarities between queries and documents in our model GERank, which has been widely applied in many L2R models [55,57,59,60,61]. Specifically, given the embeddings and their covariances of a query–document pair, ( q , d ) , i.e., q = N ( μ q , Σ q ) and d = N ( μ d , Σ d ) , we define the dissimilarity between q and d as follows:
Δ ( q , d ) = d e f D KL N ( μ d , Σ d ) ( N ( μ q , Σ q ) = d e f D KL M θ ( d ) M θ ( q ) = 1 2 tr ( Σ q 1 Σ d ) + ( μ q μ d ) Σ q 1 ( μ q μ d ) L log det ( Σ d ) det ( Σ q )
where tr ( · ) denotes the trace of a matrix, D KL ( · · ) is the KL divergence between two distributions, M θ ( q ) and M θ ( d ) are our learning to co-embedding model, GERank, with parameters θ that need to be tuned during training, L is the size of the embedding dimension, and det ( · ) is the determinant of a matrix. Once the parameters θ of our model M θ are tuned, i.e., the optimal parameters θ * is obtained, given an input query q (either in the training set of queries or not) and an input document d (either in the training corpus or not), we can infer their optimal embeddings and the corresponding covariances ( μ q * , Σ q * ) and ( μ d * , Σ d * ) , such that we have ( μ q * , Σ q * ) = M θ * ( q ) and ( μ d * , Σ d * ) = M θ * ( d ) . Detailed derivation of Equation (2) is shown in Appendix A.

4.2. Constraints

Given an input training query, our GERank model aims at imposing a ranking of all training documents with regard to their relevance scores to the query in the same semantic space. Specifically, GERank exploits the relevance scores of each training document to an input training query. Let q i be the i-th query in the training set of queries, d j 1 i , d j 2 i , , d j k i be a set of labeled documents with their relevance scores r d j 1 i , r d j 2 i , , r d j k i in response to the query q i having this order r d j 1 i < r d j 2 i < , , < r d j k i . GERank aims at obtaining the model’s optimal parameters θ * such that the following constraints would be satisfied as many as possible:
Δ ( q i , d j 1 i ) > Δ ( q i , d j 2 i ) , > Δ ( q i , d j k i ) , q i Q , with r d j 1 i < r d j 2 i < , , < r d j k i ,
where q i = N ( μ q i , Σ q i ) = M θ ( q i ) and d j k i = N ( μ d j k i , Σ d j k i ) = M θ ( d j k i ) are the embeddings and their corresponding covariances of the query q i and the document d j k i that need to be inferred by GERank, respectively. The motivation of defining such constraints in Equation (3) is straightforward: more relevant documents should be closer to the input query in the same semantic space. As we infer both the embeddings and covariances (uncertainty) of queries and documents by the same model M θ , they are co-embedded into the same semantic space. Of special interest to us is the setting of pairwise L2R, where a set of training triples, ( q i , d j i d j i ) T , are provided with the information of d j i should be ranked lower (less relevant) than d j i in response to query q i according to the ground truth, denoted as d j i d j i (in some cases, the relevance scores of d j i and d j i may not be provided but only their ranking order is provided; documents that are likely to be relevant to the query should be ranked higher in the final ranking). Accordingly, the constraints in Equation (3) can be transformed as the following:
Δ ( q i , d j i ) > Δ ( q i , d j i ) , ( q i , d j i d j i ) T .

4.3. Co-Embedding Queries and Documents

As it is intractable to obtain the optimal parameters θ in our GERank model, M θ , which is able to satisfy all the pairwise constraints defined in Equation (4), we instead turn to minimizing an energy based learning objective. We follow the previous energy-based objective function [62] to define our own energy-based objective function that needs to be minimized during training. The main idea is to define an objective function that satisfies this: for each document pair in response to an input training query, document in the pair ranked higher (more relevant documents) should obtain lower energy compared to another document in the pair ranked lower. Thus, the energy between an input query q and a document d can be defined as: E ( q , d ) = D KL ( M θ ( d ) M θ ( q ) ) = D KL N ( μ d , Σ d ) ( N ( μ q , Σ q ) . Accordingly, given a set of training triples, ( q i , d j i d j i ) T , we define the following energy-based objective function that aims at satisfying as many constraints as possible so as to co-embed queries and documents in the same semantic space:
L ( T ) = ( q i , d j i d j i ) T E 2 ( q i , d j i ) + exp E ( q i , d j i ) .
Once the energy-based objective function in Equation (5) is minimized, given a new query q and a new document d, we can infer their embeddings and their covariances according to M θ * ( q ) and M θ * ( d ) , and then the documents are ranked based on the similarities between M θ * ( q ) and M θ * ( d ) . In practice, M θ can be defined as a neural network with the parameters being θ . The parameters θ can be optimized using the Adam algorithm [63]. The proof that the loss score of the objective function in Equation (5) can be converged after enough number of iterations can be converged is provided in Appendix B. The training process of our GERank is shown in Algorithm 1. Framework of our GERank is provided in Figure 1. Details of how we build our neural network M θ for a query and a document can be found later in Section 5.5.
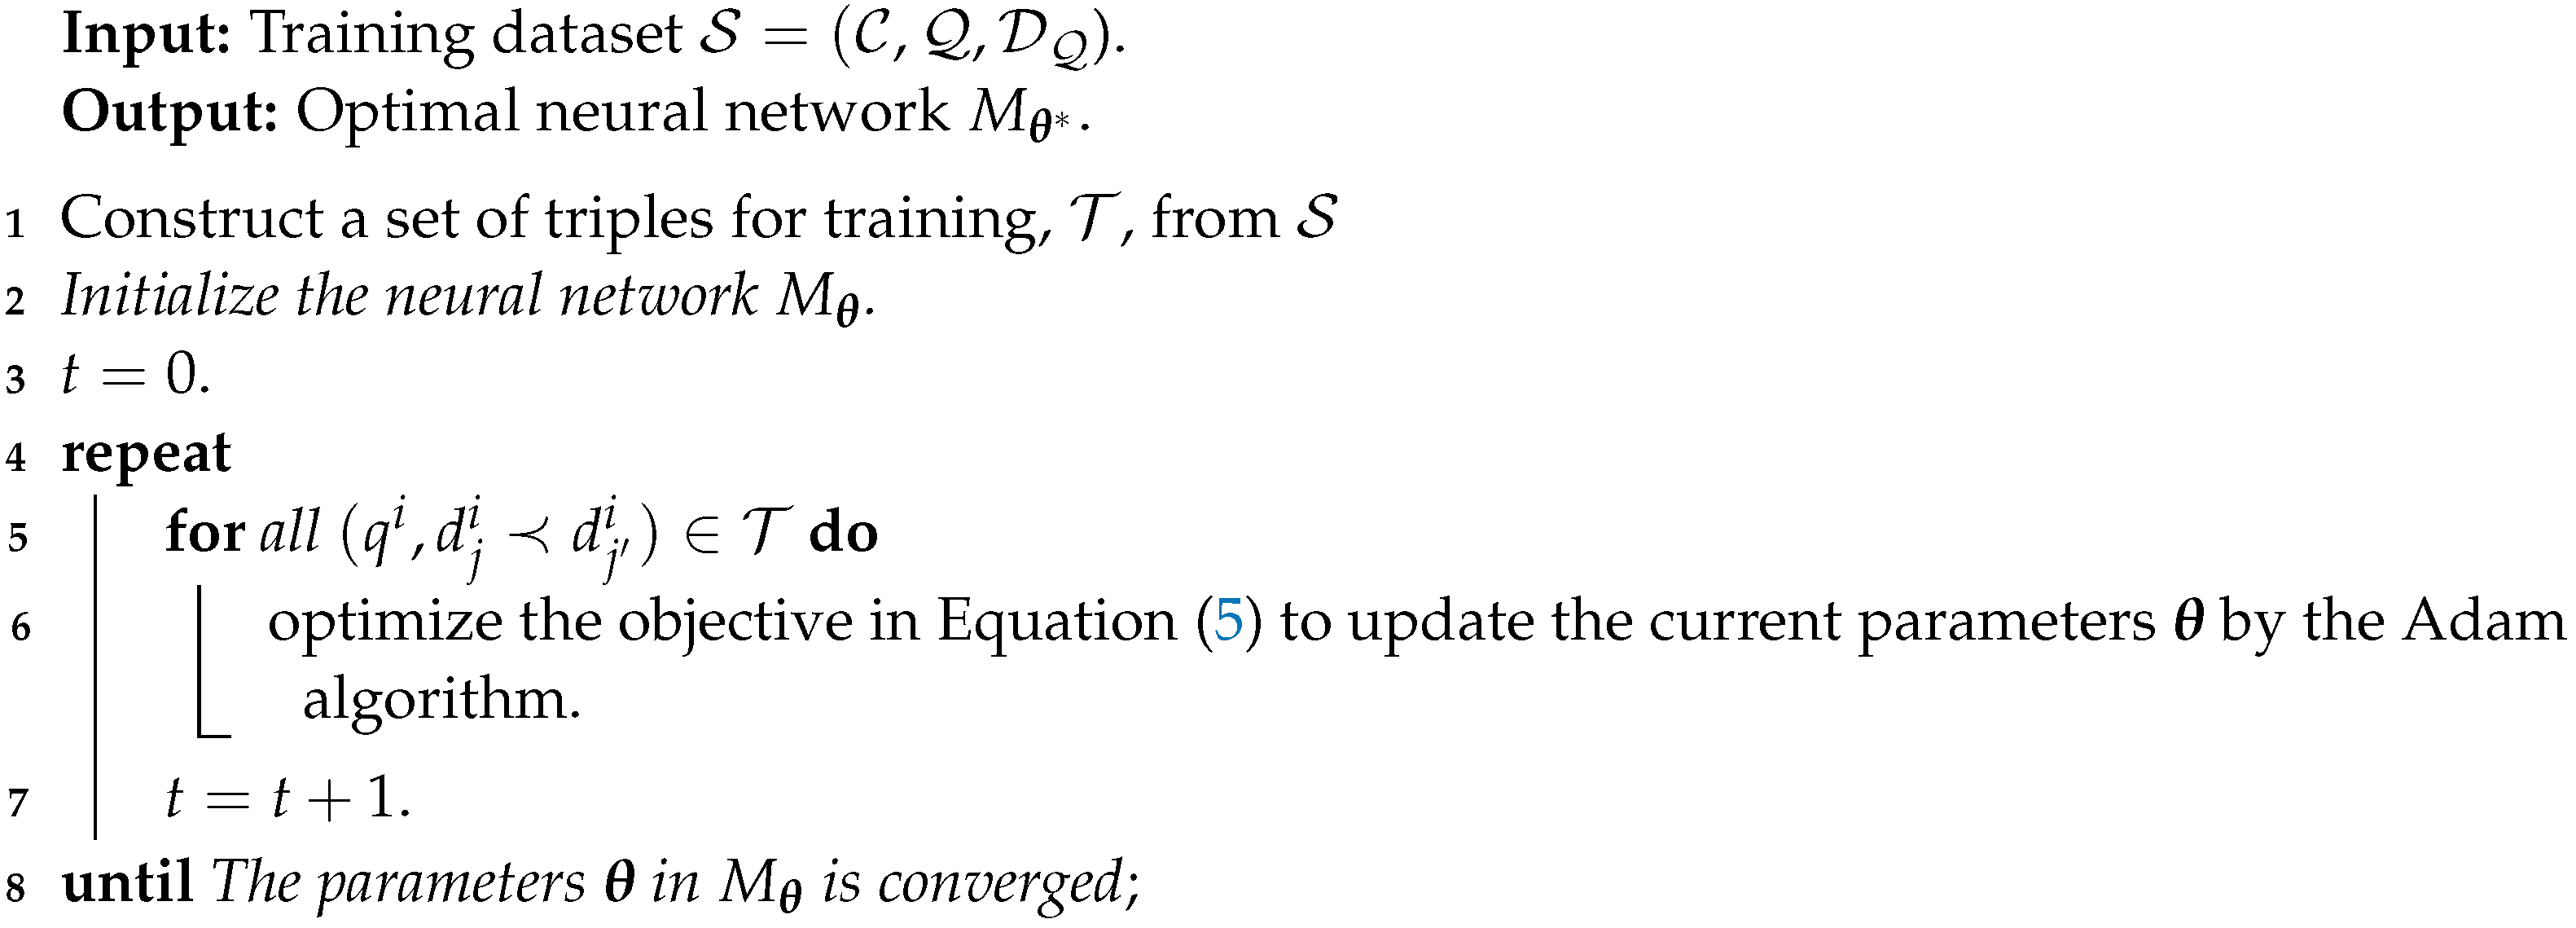
Algorithm 1: Training in GERank.
Electronics 11 03694 i001

5. Experimental Setup

In what follows, we first list our research questions in Section 5.1. Next, we describe our datasets as well as the data preprocessing procedure in Section 5.2. Section 5.3 and Section 5.4 detail the baselines and metrics for evaluation, respectively. Finally, we describe our experimental settings in Section 5.5.

5.1. Research Questions

The research questions guiding the remainder of the paper are as follows:
  • In terms of the performance of GERank:
RQ1 
How does our GERank perform in the task of document retrieval?
RQ2 
Can our GERank outperform traditional pairwise-based L2R methods?
RQ3 
Can we make the advantages of our GERank L2R model explainable?
In terms of the parameters, θ , of our GERank model:
RQ4 
How does the embedding size affect the retrieval performance of our GERank model?
RQ5 
How does the size of the hidden layer affect the retrieval performance of our GERank model?
To answer the research questions RQ1, RQ2 and RQ3, we conduct a series of experiments on the document retrieval task compared with the state-of-the-art baseline methods (Section 6.1). To answer RQ4, we fix other variables and tune the embedding dimension to analyze the impact on the document retrieval performance of our model (Section 6.2). Similarly, to understand the impact of hidden layer size in our model (RQ5), we conduct experiments based on different sizes of hidden layers of our model and analyze the result (Section 6.3).

5.2. Datasets

For our experiments, we use the LETOR package (version 3.0) (Available from https://www.microsoft.com/en-us/research/project/letor-learning-rank-information-retrieval, accessed on 10 August 2022) provided by Microsoft Asia [22]. The LETOR package consists of several benchmark datasets and baseline results including those generated by some L2R algorithms. In these datasets, information is represented as query–document pairs by means of “meta-level” features that try to capture the relevant relationships between queries and documents in an information retrieval system. We conduct experiments on all the two datasets in the LETOR 3.0 package, i.e., NP2004 and OHSUMED datasets, to examine the effectiveness of our GERank model. These two datasets have different properties which help to demonstrate the properties of our GERank model in different scenarios. We also use a widely used TREC (https://trec.nist.gov/, accessed on 10 August 2022) dataset, Robust04, which is a TREC collection with documents from the news domain that many previous and most recent works used for retrieval evaluation purposes [64,65,66,67]. In the following, we describe each of these datasets in more details:
  • NP2004: The NP2004 dataset is originally collected for the task of named-page finding in TREC2004 [68]. It contains a query set with 75 queries and 73,834 query–document pairs with ratings of 0 and 1 corresponding to “non-relevant” and “relevant” relationships between the queries and the documents, respectively. In the NP2004 dataset, each query–document pair is represented by 64 features, including the BM25 scores, Inverse Document Frequency (IDF) scores, PageRank scores, etc. These features are categorized into three classes, i.e., those depending only on the query, only on the document and on both of the query and the document, respectively. Specifically, five features in each query–document pair are only depended on query, which are constructed by the IDF of query term in body, anchor, title, URL and whole document.
  • OHSUMED: The OHSUMED dataset is obtained by Qin et al. [22] from the OHSUMED corpus [69]. It contains a query set with 106 queries and 16,140 query–document pairs with three types of ratings, i.e., 0, 1, and 2, corresponding to “non-relevant”, “partially relevant” and “definitely relevant” relationships between the queries and the documents, respectively. As for OHSUMED, each query–document pair can be represented by 45 features, including the language model features, BM25 scores, and the others. These features are categorized into two classes, i.e., those depending only on the query, and on both the query and the document. There are 9 query-depend features in each query–document pair, and the details of these features can be found in [22].
  • Robust04: This TREC dataset consists of documents from the Financial Times Limited, the Congressional Record of the 103rd Congress, the Federal Register, the Foreign Broadcast Information Service, and the Los Angeles Times, and has been widely used in a variety of TREC tasks, including TREC ad hoc collections 6–8, TRECs 8–9 question answering track, and the TREC Robust track. We apply the BERT model to extract 100-dimensional features for each document and also 100-dimensional query-depend features.
The statistics information of the two datasets is summarized in Table 2.
In order to transfer the original dataset into the desired format for our model, we apply two procedures to process the data. Figure 2 provides an example of transferring the data in NP2004 dataset into the input format of our model. The data in the OHSUMED and Robust04 datasets are processed in the same way. On top of Figure 2, each row represents a document. The first column denotes the relevant score of the document being relevant to the query. A larger score indicates a higher relevance level of the document to the input query. For instance, the relevant scores “1” and “0” in the first row denote the document is “non-relevant” and “relevant” to the query, respectively, and the second column denotes the query ID. In the figure, “qid:1” indicates that this document is retrieved for the query with its query ID being 1. The last column of the first row, i.e., “#docid=G29-66-2836593”, gives the document ID. The columns in the middle are features extracted from this query–document pair.
For data preprocessing, we adopt the Minmax normalization to normalize the scores of all the features. We apply a uniform sampling strategy to obtain the triple set T from the training set. Specifically, we randomly choose a query q i and a relevant document d j i with rating score being 0 from the dataset, then sample another document d j i whose score is larger than 0. We then obtain each triple sample ( q i , d j i d j i ) for training the model. As for the construction of the query q i , we use the same features of the query–document pair to represent it. The query-depend features of the query q i are extracted from one of the related query–document pairs and the scores of other features are 0.

5.3. Baselines

We compare our model with three types of L2R baselines, i.e., the pointwise, pairwise, and listwise L2R approaches. Specifically, one pointwise approach, i.e., the Linear regression based algorithm (LR), three pairwise approaches, i.e., Ranking SVM [16,17], RankBoost [18] and FRank [35], and four listwise approaches, i.e., ListNet [19], AdaRank-MAP [33], AdaRank-NDCG [33], and SVM m a p [34] are taken as our L2R baselines. Details of the baselines are provided as follows:
  • LR maps a feature vector to a retrieval score by a linear function. Given a training query, relevance score of each document is used to train the model. The model aims at enforcing the relevance score of more relevant documents to be greater than that of a less relevant document.
  • Ranking SVM [16,17] transforms L2R to a binary classification problem. It considers the partial ordering of the documents and solves the binary classification problem using a Support Vector Machine. SVM-light, a public tool (The SVM-light program is available from the web site http://www.cs.cornell.edu/people/tj/svm_light/svm_rank.html, accessed on 10 August 2022), is used in the experiment. The ranking function is linear.
  • RankBoost [18] adopts the Adaboost algorithm for the classification over document pairs given the queries. The distribution in RankBoost is defined over document pairs. For each iteration, RankBoost trains a weak document ranking model. These weak models are combined to obtain the final retrieval model. The weights of document pairs are changed by decreasing the weights of correctly ranked pairs. We follow Qin et al. [22] to define each weak ranker on the basis of a single feature.
  • FRank [35] is a pairwise ranking algorithm with a fidelity loss function. The fidelity was originally used in quantum physics to measure the difference between two probabilistic states of a quantum. In our experiments, as a baseline, it is used to measure the difference between the target probability and the modeled probability.
  • SciBERT [70] is a representation learning mechanism that integrates structural relations with semantic information to enrich the document embeddings for document retrieval. It involves training a document representation model that encodes the corpus structure along with the content semantics into the learned document embeddings in a metric learning setting. It makes similar documents close in the representation space while dissimilar documents separated. It accepts similar and dissimilar document pairs as input, one each for content semantics and corpus structure.
  • ListNet [19] is based on probability distribution on permutations. The main work of ListNet is to map the relevance of query–document pairs to a real-value score. For a document list, the Luce model used by definition a permutation probability distribution based on score and another based on the ground truth labels. The loss function of the model is the cross enthalpy between two distributions.
  • AdaRank-MAP and AdaRank-NDCG [33] are built based on the Adaboost algorithm. They aim to repeatedly construct weak rankers on the basis of re-weighted training queries and finally linearly combine the weak rankers to make ranking predictions. The difference is that AdaRank-MAP uses MAP to measure the effectiveness of a weak ranker, while AdaRank-NDCG utilizes NDCG to optimize the model.
  • SVM m a p [34] utilizes the framework of structured SVM to optimize the evaluation measure, i.e., MAP. The main idea of SVM m a p is to use Support Vector Machines to solve the ranking problem.

5.4. Evaluation Metrics

For model evaluation, we adopt three categories of evaluation metrics that are commonly used in existing document retrieval algorithms [24]: mean average precision (MAP), precision at position k (P@k), and normalized discounted cumulative gain at position k (NDCG@k). Note that all evaluation scores in our experiments were computed under the trec_eval public code (The trec_eval program is available from the TREC web site http://trec.nist.gov, accessed on 10 August 2022).
  • NDCG: NDCG is a measure of ranking quality that is computed based on the discounted cumulative gain. The discounted cumulative gain (DCG) [23] at a particular rank threshold k is defined as
    DCG ( S , k ) = j = 1 k 2 r ( j ) 1 log ( 1 + j ) ,
    where r ( j ) is the judgment ( 0 = Bad , 1 = Fair , 2 = Good , 3 = Excellent , etc.) at rank j in set S . The ideally ordered set R contains all documents rated for the given query sorted descending by the judgment value. Then, the normalized discounted cumulative gain (NDCG) [23] at a particular rank threshold k is defined as
    NDCG ( S , k ) = DCG ( S , k ) DCG ( R , k ) .
    NDCG discounts the contribution of a document to the overall score as its rank increases. NDCG value at rank threshold k when the set S is clear from the context is often written as NDCG @ k .
  • MAP: The mean average precision (MAP) [24] of a test query set is the mean of the average precision (AP) values of all queries in the query set. The average precision of a ranked result set in response to a given query is defined as:
    AP = j = 1 k P ( j ) Relevance ( j ) j = 1 k Relevance ( j ) ,
    where j is the position of the document (in our case, group), Relevance ( j ) denotes the relevance of the document (in our case, group) in position j, and P ( j ) = i = 1 j Relevance ( i ) / j . Typically, a binary value for Relevance ( j ) is used by setting it to 1 if the document (group) in position j has a human judgment of Fair or better and 0 otherwise.
  • Precision:Precision at k [24] only considers the total number of relevant documents ranked within the top k positions and can be simply computed as
    P @ k = # relevant documents among the top k k ,
    where “relevant documents” are those that have human judgments of Fair or better.

5.5. Experimental Settings

We use 5-fold cross validation for reporting all the experimental results in terms of the evaluation metrics, NDCG, MAP, and Precision. We use the evaluation script provided by the LETOR package to generate the evaluation scores. In our experiments, we use a 3/1/1 split for our training, validation, and test sets, respectively. We train our L2E model and the baseline models using different values of the parameters in the models. The best values of the parameters in each model are then chosen on the validation set, and evaluated on the test queries. The training/validation/testing splits are permuted until all the queries in each of the datasets were chosen once for the test set. We repeat the experiments 10 times and report the average evaluation results.
We conduct experiments for all the baselines using the codes released by the authors, and the parameters of them are tuned to be optimal. Specifically for RankBoost, the best weak ranker was selected from (255 thresholds) × (number of features) candidates in each iteration. The number of iterations is determined by the evaluation metric MAP on the validation set. To the baseline FRank, it combines several weak learners to minimize the fidelity loss function. The number of weak learners for it was determined by verifying on the validation set. As for ListNet, it is trained by minimizing the cross entropy between output score and ground truth label. ListNet maps the relevance label of query–document pair to a real-value score. The mapping is determined by utilizing the validation set. AdaRank-MAP and AdaRank-NDCG manage to optimize MAP and NDCG to measure the effectiveness of weak rankers. These two algorithms work based on AdaBoost. The number of weak rankers which are combined to the final model is determined by the validation set. SVM m a p is a structured SVM approach by optimizing a loss function concerned about MAP. The value of hyper parameter in SVM m a p is determined by using the validation set.
We define our GERank, M θ , as a two-layer feed-forward network to embed queries and documents. The first layer uses Relu as the activation function. Then, we treat queries and documents in the same way. It means that they share the same neural network. Then, queries and documents are passed through deep feed-forward nonlinear neural networks. We obtain their means μ and diagonal covariance matrices Σ (To guarantee their positive definite, we design σ ˜ = e l u ( σ ) + 1 , where σ is the output in the final layer) from the output in the final layer. We learn the neural network parameters to satisfy the pairwise constraints by minimizing the loss function L and using the Adam Optimizer to optimize the loss function for our GERank model. In order to shorten the training time, avoid the risk of over-fitting, and guarantee good performance of the model, we control the training steps based on the performance of GERank on the validation set. It should be emphasized that μ and Σ share the parameters of the neural network.
The statistical significance on differences of the performance between two models is tested using a two-tailed paired t-test. Here, we use to denote a significance difference for p < 0.01 , and Δ for p < 0.05 .

6. Results

In this section, we report and analyze our experimental results. To answer RQ1, we start by reporting the overall document retrieval performance of our model and the baseline models in Section 6.1. Then, to answer RQ2, we compare the performance of GERank with several pairwise baselines over nine evaluation metrics in Section 6.1. After that, to answer RQ3, we analyze the experimental results and try to give a reasonable explanation in Section 6.2. To further investigate the properties of the model, we also vary the embedding dimension (to answer RQ4) and the size of the hidden layer (to answer RQ5) and report the results in Section 6.3.

6.1. Overall Retrieval Performance

In order to answer research questions RQ1 and RQ2, we first compare our GERank with the baseline methods over NDCG, MAP, and Precision metrics on the NP2004 dataset. Table 3 shows the performance of all the methods on precision and MAP, while Table 4 shows the performance on NDCG@k with k being set to be 1, 3, 5, and 10. In general, we can observe that GERank always yields very high competitive performances over all the evaluation metrics. From Table 3, we can observe that LR is the worst baseline among all the other baseline models, while our GERank achieves the best performance on P@1, MAP, and NDCG@1 metrics, and the improvement is significant comparing with other baselines. As for listwise L2R approaches, ListNet performs the best on this dataset. In terms of the MAP metric, GERank still works very well, and it is the second best model among the nine baseline algorithms. In terms of the P@1 metric, GERank has a significant improvement compared to all the baseline algorithms. In terms of P@3, P@5, and P@10, it does not perform as well as the listwise approach, but it is still comparable to pairwise L2R approaches. Table 4 shows the performance in terms of NDCG@k evaluation metrics with k being set to be 1, 3, 5, and 10. It can be seen that ListNet and Ranking SVM yield the best performance on this dataset. Although ListNet and Ranking SVM outperform our GERank, they will suffer from a mismatch problem when the feature dimension used to represent the document is low. In addition, GERank still yields the best performance in terms of the NDCG@1 evaluation metric. Overall, the performance of our model, GERank, is comparable with or even better than the state-of-the-art pairwise L2R models especially in terms of NDCG@1 and P@1 that evaluate documents ranked higher in the final ranked list of documents in response to a query.
We now examine our GERank model and the baseline models on the OHSUMED dataset. Table 5 shows the performance of the algorithms on precision and MAP metrics. LR, again, has the worse performance on the OHSUMED dataset. Among the pairwise approaches, FRank has a significant improvement in terms of these two metrics. Similar to those reported on the NP2004 dataset, the listwise methods perform very well. In particular, AdaRank-NDCG performs the best. As for our GERank, it behaves as well as the other algorithms in terms of the MAP metric. In particular, GERank achieves the best performance in terms of the metrics P@1 and P@3, which indicates that GERank has an obvious advantage compared to other traditional L2R algorithms when predicting the top documents, especially those ranked within the top three positions. As for the other metrics, the performance of GERank is still comparable with that of other algorithms. Table 5 shows the performance of our GERank and the baseline algorithms on NDCG@k metrics. According to the table, AdaRank-NDCG and FRank yield the best performance among the baselines. In total, listwise approaches perform better than pairwise approaches. For our model, GERank, there is a significant improvement over the best baseline algorithm in terms of all the NDCG metrics on the OHSUMED dataset. Compared with the algorithms based on pairwise approach, the performance of GERank in terms of NDCG metrics has a significant improvement. Similar findings can be found in Table 6, Table 7 and Table 8 according to the performance evaluation of both our proposed model GERank and the baseline models on the Robust04 dataset.
According to the analysis based on Table 3, Table 4, Table 5, Table 6, Table 7 and Table 8, it can be concluded that listwise approaches perform well on these datasets. LR is the worse baseline among them. GERank outperforms the baseline algorithms on OHSUMED and has a marked improvement. On the NP2004 dataset, the performance of our GERank model is still comparable with that of other pairwise approaches. Specifically, GERank has a clear advantage in predicting the top documents as indicated by the retrieval performance on the Precision and NDCG metrics. For instance, the best result of the others pairwise approaches on P@1 on NP2004 dataset is 0.5067 for Ranking SVM, whereas our model GERank achieves 0.5734 and obtains about 13.2% improvement over Ranking SVM. On NDCG@1, the best result of the other pairwise approaches on the OHSUMED dataset is 0.5300 for FRank, whereas our method achieves 0.6008 and obtains about 13.4% improvement over the FRank model. As a pairwise L2R algorithm, GERank is able to significantly improve over the traditional pairwise approaches on all the dataset, the NP2004, the OHSUMED, and the Robust04 datasets.
In conclusion, the answers to research questions RQ1 and RQ2 are now clear: GERank outperforms state-of-the-art of traditional pairwise L2R algorithms and also has an improvement on several metrics compared with listwise L2R approaches.
In order to research question RQ3, we analyze the performance and the structure of our model. As shown in Table 3, Table 4, Table 5 and Table 6, we find that GERank can achieve a considerable performance on the datasets. In terms of NDCG and precision metrics, our model has significantly improved the performance compared to the best baseline. Such improvement can be clearly explained as follows: Firstly, our Gaussian Embedding model for Ranking, GERank, co-embed queries and documents into the same semantic space so as to alleviate the mismatch problem between queries and documents. With the constraint in Equation (4), the semantic similarities between query and documents can be effectively measured. Secondly, we employ the square-exponential loss which has an infinite margin and pushes the energy of the negative terms to infinity with exponentially decreasing force [62]. Thus, it is able to retrieve the most relevant documents and rank them within the top positions. It can be explained that the performance on dataset OHSUMED is better than that on dataset NP2004. On the NP2004 dataset, 5 of the 64 features are only dependent on query. However, there are 9 of the 45 features which are only dependent on queries on the OHSUMED dataset. In other words, query has more features on the OHSUMED dataset. For the traditional linear method, they does not use these query information, so the accuracy of prediction is not high on the OHSUMED dataset.
Therefore, the answer to research question RQ3 is now clear: we have clearly explained the mechanism of GERank for document retrieval; see the above.

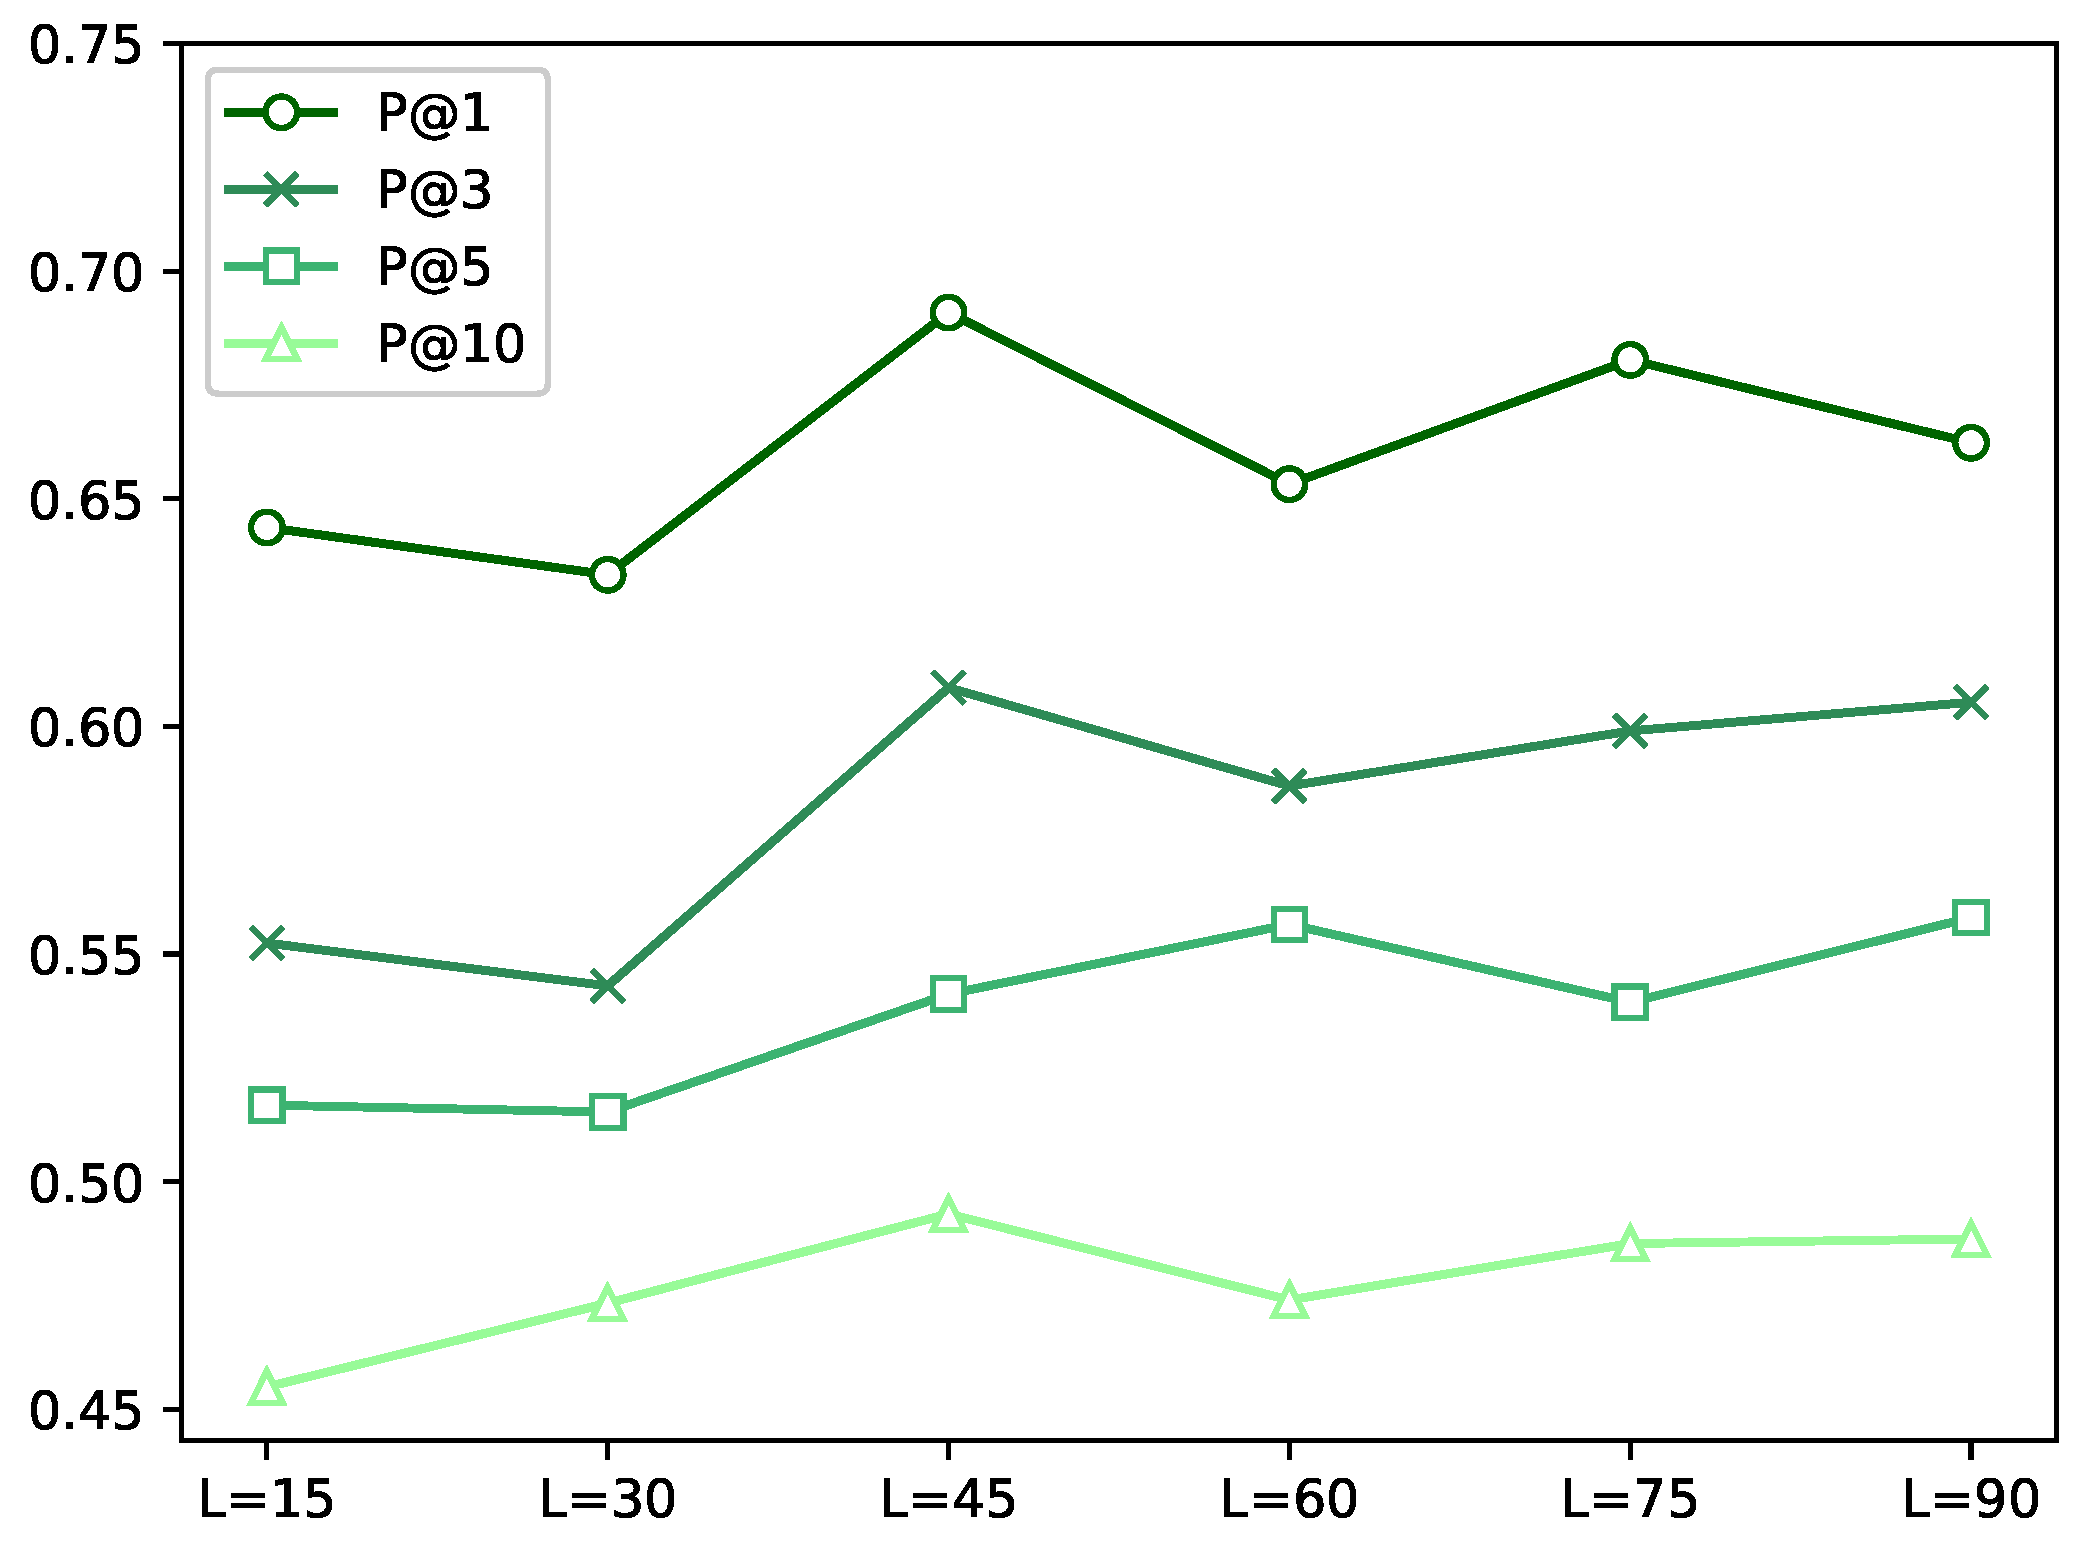
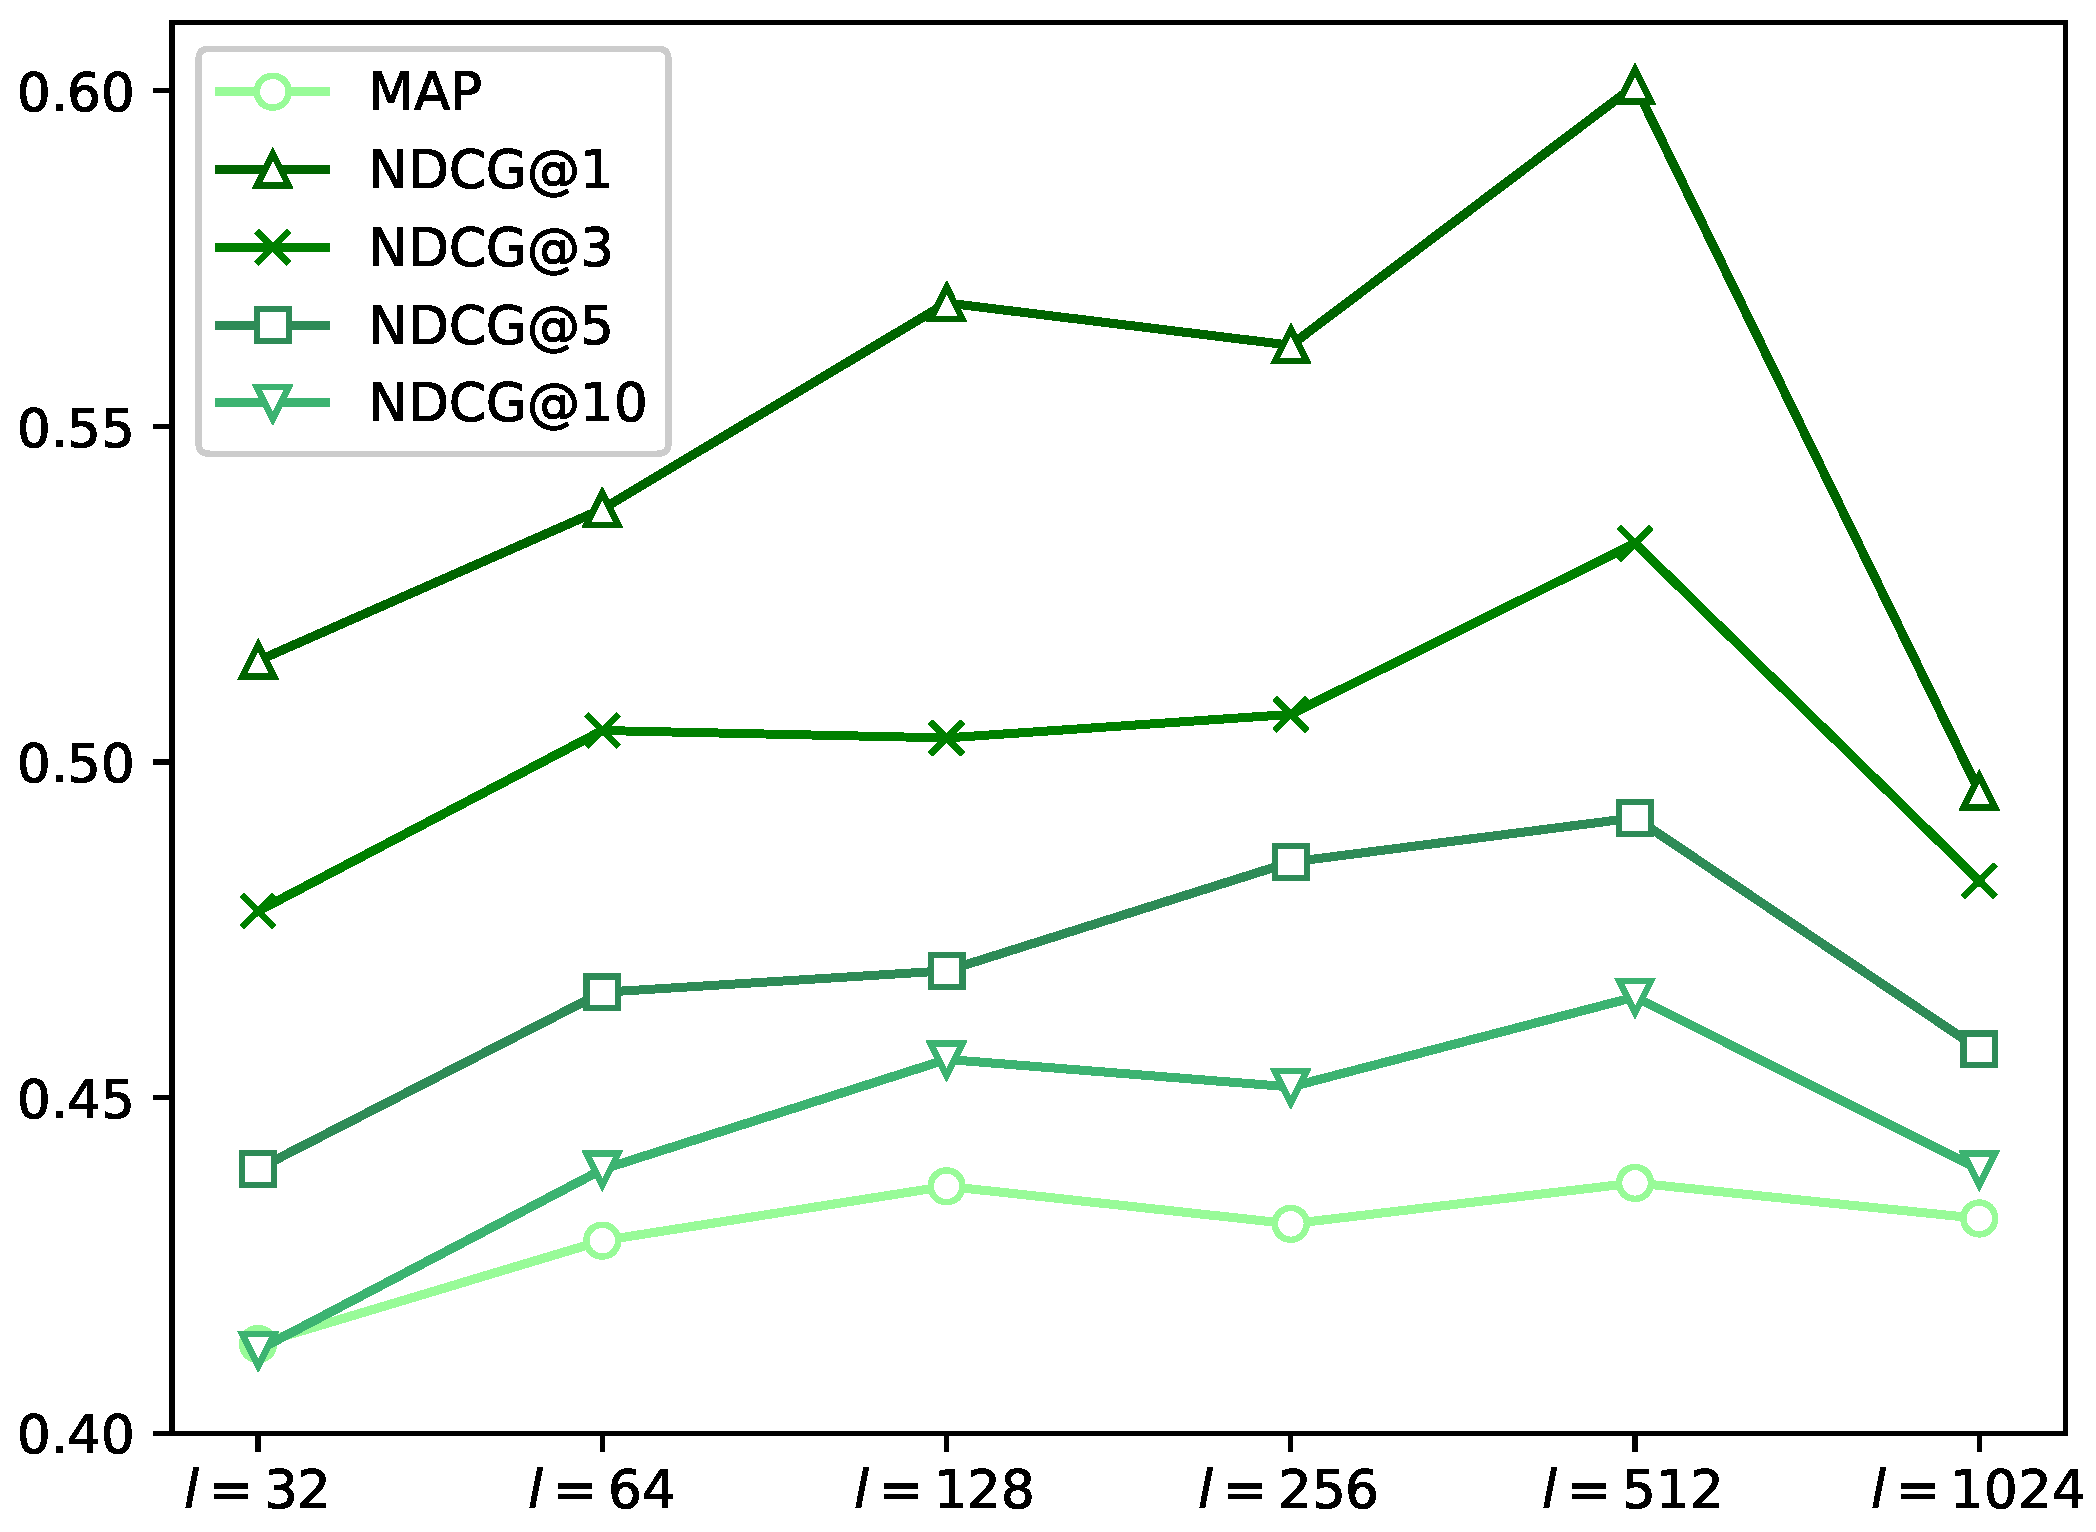
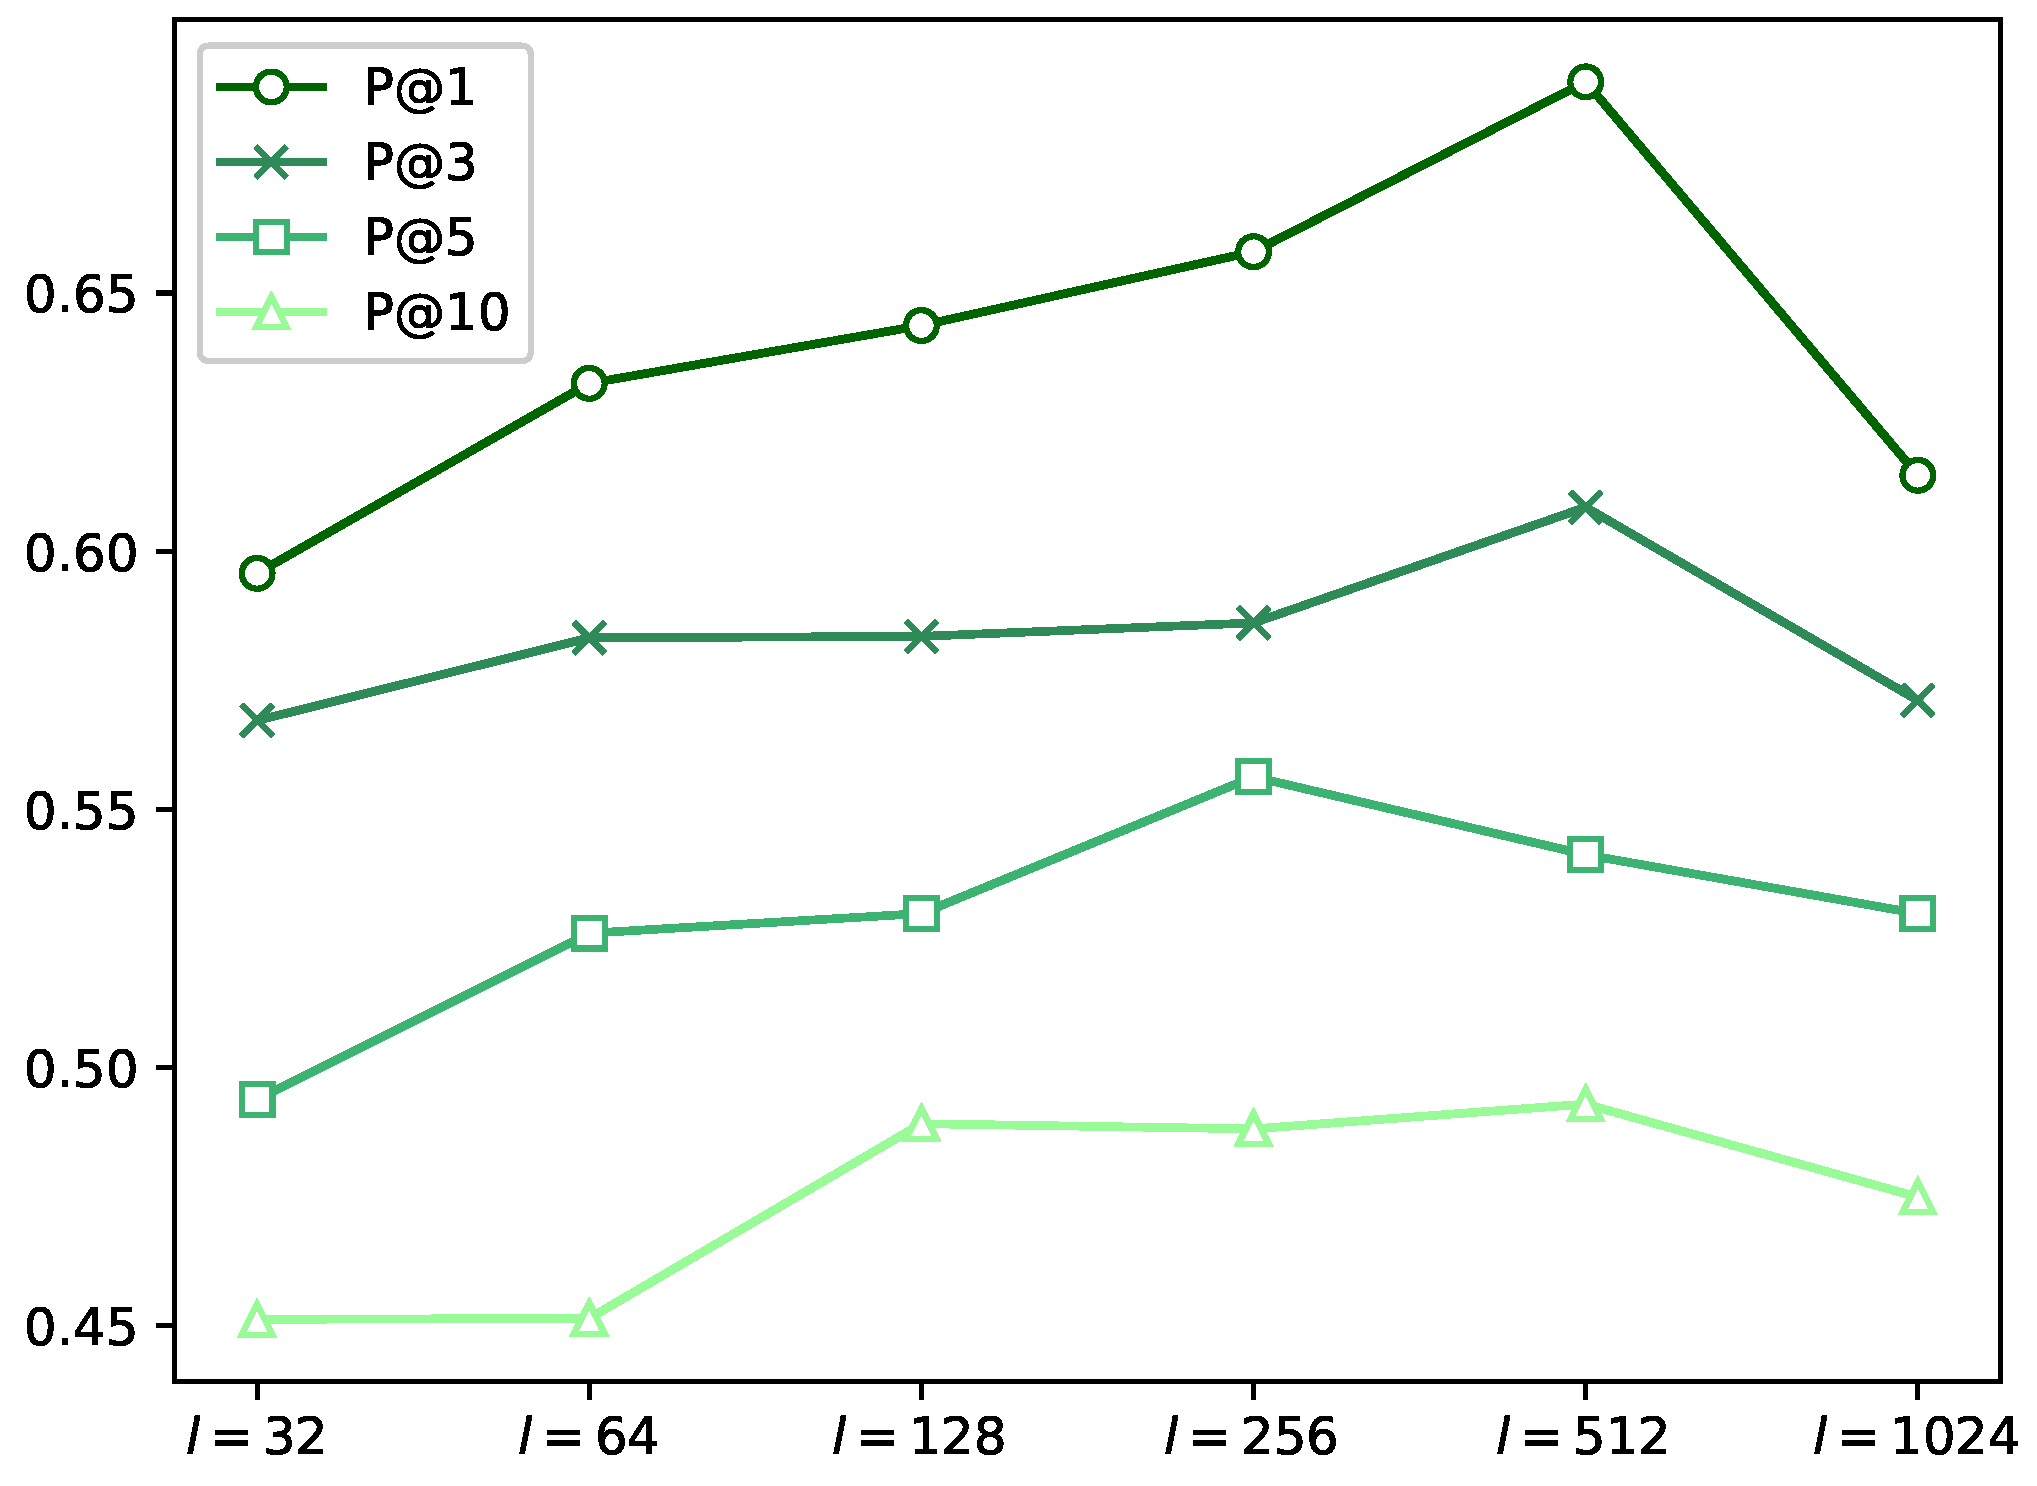
6.2. Impact of Embedding Dimension

We examine the impact of embedding dimension on the retrieval performance (RQ4). We fix the number of hidden layers I to be 512, and run our model with different embedding dimensions L. In Figure 3 and Figure 4, the horizontal axis is for evaluation metrics, and the vertical axis is for the value of evaluation metrics in detail. From these two figures, we can observe that, when L = 15, the performance of our model shows the worst performance in terms of all the evaluation metrics. It is due to the information loss of documents caused by low dimension embedding. In terms of low dimension embedding, the number of features of the document is too small to cause mismatching.
All metrics as a whole increase with the increase of embedding dimension, as it is shown in Figure 3 and Figure 4. However, the training time will be longer when the embedding dimension is higher. Therefore, increasing the embedding dimension appropriately is beneficial to improve the accuracy of our model GERank. In particular, we can achieve the best performance on OHSUMED dataset when the embedding dimension L is set to be 45. It means that equal dimensional embedding to our model is the most effective on the OHSUMED dataset.

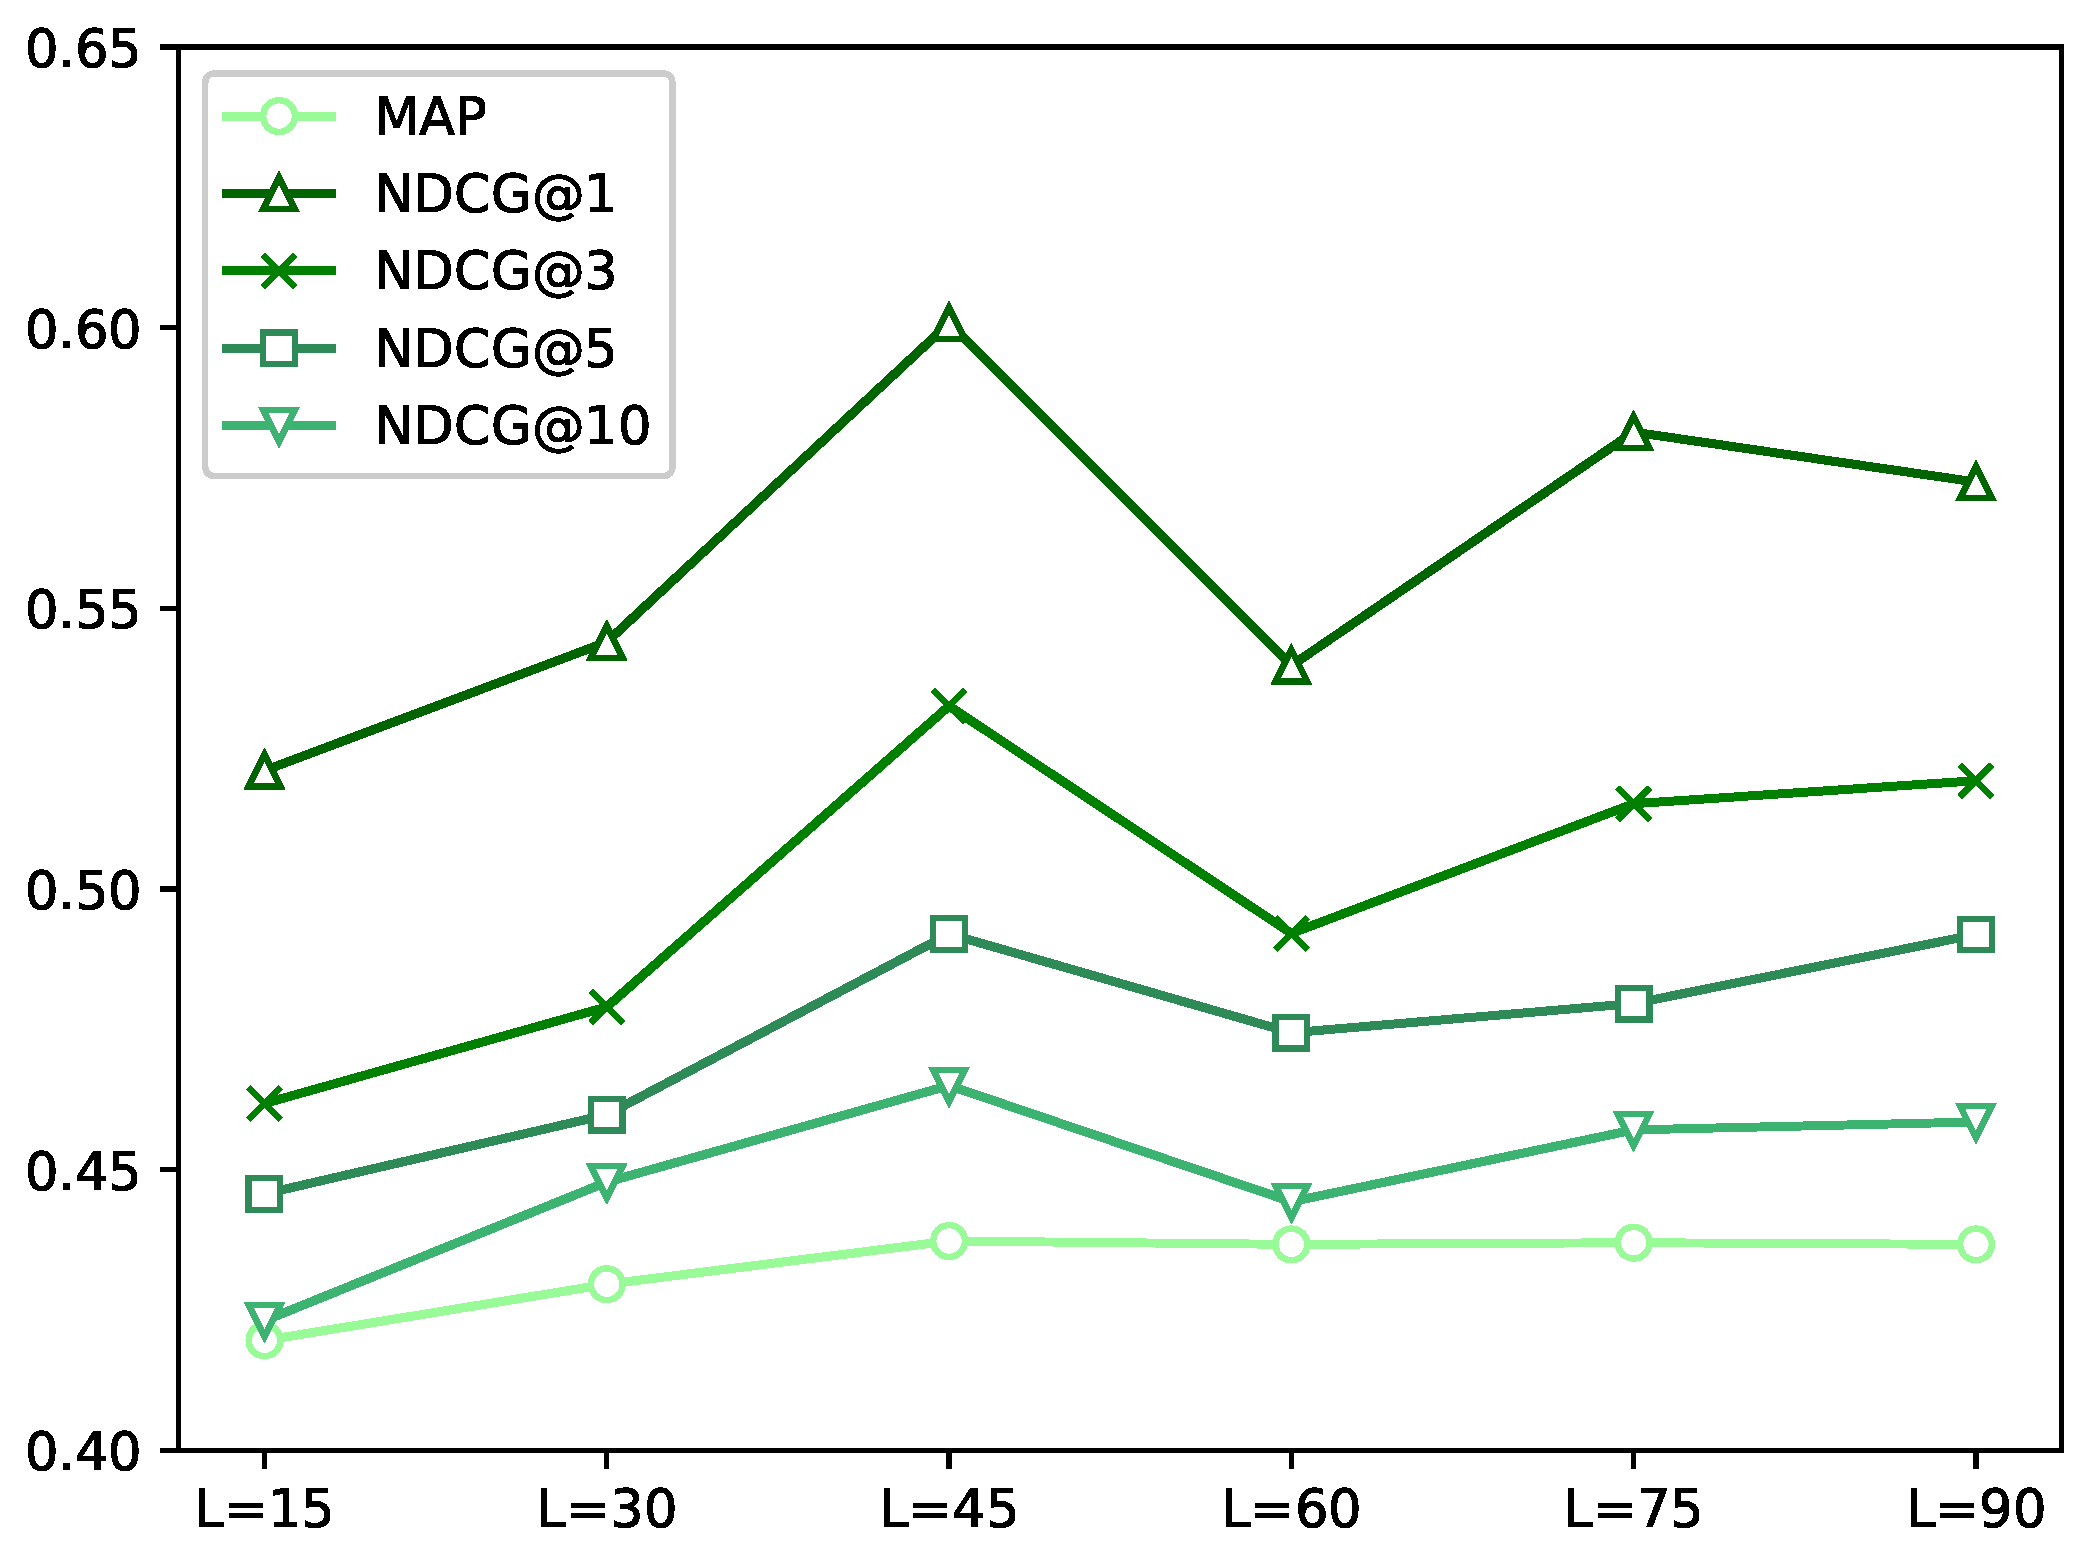
6.3. Effect of Hidden Layer

Finally, we study the influence of hidden layer (RQ5). Specifically, we fix the embedding dimension L to be 45, and run our model with different numbers of hidden layers denoted as I. The retrieval performance with different numbers of hidden layers is shown in Figure 5 and Figure 6. From these two figures, we can observe that, when I = 32 , the performance of our model shows the worst performance on all the evaluation metrics. This is due to the fact that fewer numbers of neurons results in the poor representation ability of the overall model.
According to Figure 5 and Figure 6, we can also see that the performance of our model improves as the hidden layers increase. However, increasing the number of neurons may lead to the risk of over-fitting. For instance, the performance of our model with the number of neurons being 1024 is worse than 512. We show that 512 is the best choice of the number of neurons in our model on the OHSUMED dataset.
In conclusion, the dimension embedding and the number of hidden layer neurons do effect the performance of our model. In the case of embedding dimension being 45 and hidden layer being 512, our model achieves the best performance on all the evaluation metrics on the OHSUMED dataset.

7. Conclusions

In this paper, we have studied the core problem in information retrieval, i.e., designing a L2R model for document retrieval and optimizing the model to produce a final rank list of documents in response to a given query. To obtain better document retrieval performance, we have proposed a novel Gaussian embedding based pairwise L2R model, GERank, to learn to infer the embeddings and their covariances of queries and documents such that the similarities between a query and a document can be effectively measured for ranking documents in response to a given query. Specifically, our GERank model is able to co-embed queries and documents into the same semantic space such that the mismatch between queries and documents can be alleviated. GERank is the first model to incorporate embedding techniques into pairwise L2R algorithms with constraints. For example, in Gaussian embedding space, we transform the ranking problem into pairwise constraints. To yield better performance, GERank not only infers the embeddings of queries and documents, but also their covariances (uncertainty is captured by GERank) such that the similarities between queries and documents can be effectively measured, via an energy-based loss function being defined for learning the embeddings and covariances of queries and documents.
We have conducted experiments on two LETOR datasets. Experimental results show our model has a significant improvement over the datasets. Our evaluation results have also shown that GERank outperforms state-of-the-art traditional pairwise algorithms and even some state-of-the-art listwise algorithms on the OHSUMED dataset. Specifically, our model is able to yield better retrieval performance within the top-k document. We also systematically study the influence of embedding dimension and size of hidden layers in the model and provide a reasonable explanation.
As for future work, we aim to improve the proposed model, GERank, in the following ways:
(a)
We plan to infer embeddings and the covariances of queries and documents via other embedding techniques such as variational auto-encoders [71].
(b)
We plan to apply GERank to other information retrieval applications such as: given a question, rank answers that are relevant to the question in question-answering communities, where users’ interaction historical information in the communities can be utilized to boost the retrieval performance.
(c)
We intend to integrate our GERank into listwise L2R approaches, as listwise approaches have shown their better performance compared to that produced by the pairwise L2R approaches on the testing datasets.
(d)
We also intend to improve big data law for a number of information retrieval applications such as document retrieval.

Author Contributions

Experiments, B.L., L.T., and Y.W.; supervision, S.L.; writing—original draft, Y.W., B.L., L.T., and S.L. All authors have read and agreed to the published version of the manuscript.

Funding

This paper is a phased result of the general project of Humanities and Social Sciences Research of Ministry of Education “Research on the Evaluation Mechanism of Judicial Reform Effectiveness in the Era of Big Data” (Grant No. 19YJC820058). This work is partly supported by the National Natural Science Foundation of China (Grant No. 61906219) and the start-up project and the MBZUAI-WIS project at the Mohamed bin Zayed University of Artificial Intelligence. All content represents the opinion of the authors, which is not necessarily shared or endorsed by their respective employers and/or sponsors.

Data Availability Statement

The codes and data used in the experiments are provided by URLs in the main body of the paper.

Conflicts of Interest

The authors declare no conflict of interest.

Appendix A. KL Divergence between Two Multivariate Gaussian Distributions

Definition A1.
For discrete probability distributions P and Q defined in the same probability space X, the KL divergence between P and Q is defined to be:
D KL ( P Q ) = x X P ( x ) [ l o g P ( x ) l o g Q ( x ) ] .
For distributions P and Q of a continuous random variable, the KL divergence is defined via the following integral:
D KL ( P Q ) = P ( x ) [ l o g P ( x ) l o g Q ( x ) ]
Given P ( x ) N ( μ 1 , Σ 1 ) and Q ( x ) N ( μ 2 , Σ 2 ) , the PDF (Probability Distribution Function) of multivariate Gaussian distribution is that
P ( x ) = ( 2 π ) k 2 | Σ 1 | 1 2 e x p [ 1 2 ( x μ 1 ) T Σ 1 1 ( x μ 1 ) ] Q ( x ) = ( 2 π ) k 2 | Σ 2 | 1 2 e x p [ 1 2 ( x μ 2 ) T Σ 2 1 ( x μ 2 ) ]
log P ( x ) = k 2 log 2 π 1 2 log | Σ 1 | 1 2 ( x μ 1 ) T Σ 1 1 ( x μ 1 ) log Q ( x ) = k 2 log 2 π 1 2 log | Σ 2 | 1 2 ( x μ 2 ) T Σ 2 1 ( x μ 2 )
According to the KL definition, we have
D K L ( P Q ) = 1 2 log | Σ 2 | | Σ 1 | 1 2 ( x μ 1 ) T Σ 1 1 ( x μ 1 ) + 1 2 ( x μ 2 ) T Σ 2 1 ( x μ 2 ) P ( x ) d x = 1 2 log | Σ 2 | | Σ 1 | 1 2 t r { E [ ( x μ 1 ) ( x μ 1 ) T ] Σ 1 1 } + 1 2 E [ ( x μ 2 ) T Σ 2 1 ( x μ 2 ) ] = 1 2 log | Σ 2 | | Σ 1 | 1 2 t r { I L } + 1 2 ( μ 1 μ 2 ) T Σ 2 1 ( μ 1 μ 2 ) + 1 2 t r { Σ 2 1 Σ 1 } = 1 2 t r ( Σ 2 1 Σ 1 ) + ( μ 2 μ 1 ) T Σ 2 1 ( μ 2 μ 1 ) L log | Σ 1 | | Σ 2 |
We derive 1 2 ( x μ 1 ) T Σ 1 1 ( x μ 1 ) P ( x ) d x and 1 2 ( x μ 2 ) T Σ 2 1 ( x μ 2 ) P ( x ) d x in the following details.
Given a scalar value, we have E x T A x = E t r ( x T A x ) = E t r ( A x x T ) = t r E ( A x x T ) such that we have:
1 2 ( x μ 1 ) T Σ 1 1 ( x μ 1 ) P ( x ) d x = E p 1 2 ( x μ 1 ) T Σ 1 1 ( x μ 1 ) = E p t r ( 1 2 ( x μ 1 ) T Σ 1 1 ( x μ 1 ) ) = E p t r ( 1 2 ( x μ 1 ) ( x μ 1 ) T Σ 1 1 ) = t r E p ( 1 2 ( x μ 1 ) ( x μ 1 ) T Σ 1 1 ) = t r E p [ ( x μ 1 ) ( x μ 1 ) T ] 1 2 Σ 1 1 = t r ( Σ 1 1 2 Σ 1 1 ) = t r ( I L ) = L
As for the second integral, we have:
1 2 ( x μ 2 ) T Σ 2 1 ( x μ 2 ) P ( x ) d x = 1 2 ( x μ 1 ) + ( μ 1 μ 2 ) T Σ 2 1 ( x μ 1 ) + ( μ 1 μ 2 ) P ( x ) d x = 1 2 { ( x μ 1 ) T Σ 2 1 ( x μ 1 ) + 2 ( x μ 1 ) T Σ 2 1 ( μ 1 μ 2 ) + ( μ 1 μ 2 ) T Σ 2 1 ( μ 1 μ 2 ) } P ( x ) d x = t r ( Σ 2 1 Σ 1 ) + 0 + ( μ 1 μ 2 ) T Σ 2 1 ( μ 1 μ 2 )

Appendix B. Proof of Algorithm Convergence

Property A1.
KL divergence is always non-negative.
Proof. 
Discrete probability distributions P and Q defined on the same probability space
D K L ( P Q ) = x X P ( x ) [ l o g P ( x ) Q ( x ) ] = x X P ( x ) [ l o g Q ( x ) P ( x ) ] ( 1 ) l o g x X P ( x ) Q ( x ) P ( x ) = l o g x X Q ( x ) = 0
Step (1) can be deduced by Jensen Inequality.
Let w be a parameter vector to learn and w be the parameter updated by an iteration. The loss function L is minimized by the Adam Optimizer based on the gradient descent algorithm. The parameter updated for each iteration is as follows:
δ w = w w = η A L w
where A is a symmetric positive semi-definite matrix, and η is the learning rate that is positive and small. For the convenience of expression, the energy function is equivalent to the following form:
E ( d j d j w ) = D K L ( N j N d j )
and the loss function can be expressed as:
L w = ( q i , d j i d j i ) T E ( q i , d j i w ) 2 + exp ( E ( q i , d j i w ) )
For the square term E ( q i , d j i w ) 2 ,
δ w = w w = η A E ( q i , d j i w ) 2 w = η A E ( q i , d j i w ) E ( q i , d j i w ) w
and then
E ( q i , d j i w ) w T δ w = η E ( q i , d j i w ) E ( q i , d j i w ) w T A E ( q i , d j i w ) w < 0
because E ( q i , d j i w ) = D K L ( N d j i N d j i ) > 0 . Therefore,
E ( q i , d j i w ) < E ( q i , d j i w )
The same derivation for the natural exponential term e x p ( E ( q i , d j i w ) ) , is
δ w = w w = η A exp ( E ( q i , d j i w ) ) w = η A exp ( E ( q i , d j i w ) ) E ( q i , d j i w ) w
Then,
E ( q i , d j i w ) w T δ w = η exp ( E ( q i , d j i w ) ) E ( q i , d j i w ) w T A E ( q i , d j i w ) w < 0
Therefore,
E ( q i , d j i w ) > E ( q i , d j i w )
By Equations (A3) and (A4), we have
0 < exp ( E ( q i , d j i w ) ) + E ( q i , d j i w ) 2 < exp ( E ( q i , d j i w ) ) + E ( q i , d j i w ) 2 0 < L w < L w
Therefore, L converges. □

Appendix C. Supplement to the Measure and Loss Function

In addition to KL divergence can be used as a measure, there are other measures to choose in our model. The symmetric dissimilarity measure such as the Jensen–Shannon divergence or the expected likelihood can be also integrated in our model.
We follow the energy-based framework. In addition, we employ the square-exponential which has an infinite margin and pushes the energy of the negative terms to infinity with exponentially decreasing force. There are also other loss functions that can be chosen. LeCun et al. [62] proposed several loss functions, and we can take them into our case. Again, let d j i be the document that should be ranked higher than the document d j i in response to a query q i .
Hinge Loss:
L h i n g e = m a x ( 0 , m + E ( d j i , q i ) E ( d j i , q i ) )
where m is the positive margin.
Log Loss:
L l o g = l o g ( 1 + exp ( E ( d j i , q i ) E ( d j i , q i ) )
MCE Loss:
L m c e = σ ( E ( d j i , q i ) E ( d j i , q i ) )
where σ is the logistic function.
Square–Square Loss:
L s q s q = E ( d j i , q i ) 2 + ( m a x ( 0 , m E ( d j i , q i ) ) ) 2
where m is the positive margin.

References

  1. Yue, S.; Larson, M.; Hanjalic, A. Listwise learning to rank with matrix factorization for collaborative filtering. In Proceedings of the ACM Conference on Recommender Systems, Barcelona, Spain, 26–30 September 2010. [Google Scholar]
  2. Yue, S.; Karatzoglou, A.; Baltrunas, L.; Larson, M.; Oliver, N.; Hanjalic, A. CLiMF: Learning to maximize reciprocal rank with collaborative less-is-more filtering. In Proceedings of the ACM Recommender Systems, Dublin, Ireland, 9–13 September 2012. [Google Scholar]
  3. Koren, Y.; Rendle, S.; Bell, R. Advances in collaborative filtering. Recommender Systems Handbook; Springer: Berlin/Heidelberg, Germany, 2022; pp. 91–142. [Google Scholar]
  4. Rendle, S.; Krichene, W.; Zhang, L.; Anderson, J. Neural collaborative filtering vs. matrix factorization revisited. In Proceedings of the Fourteenth ACM Conference on Recommender Systems, Virtual, 22–26 September 2020; pp. 240–248. [Google Scholar]
  5. Xu, D.; Ruan, C.; Korpeoglu, E.; Kumar, S.; Achan, K. Rethinking neural vs. matrix-factorization collaborative filtering: The theoretical perspectives. In Proceedings of the International Conference on Machine Learning (PMLR), Virtual, 18–24 July 2021; pp. 11514–11524. [Google Scholar]
  6. Cao, Y.; Xu, J.; Liu, T.Y.; Li, H.; Huang, Y.; Hon, H.W. Adapting Ranking SVM to Document Retrieval. In Proceedings of the 29th Annual International ACM SIGIR Conference on Research and Development in Information Retrieval, Seattle, WA, USA, 6–11 August 2006; pp. 186–193. [Google Scholar]
  7. Hofstätter, S.; Zamani, H.; Mitra, B.; Craswell, N.; Hanbury, A. Local self-attention over long text for efficient document retrieval. In Proceedings of the 43rd International ACM SIGIR Conference on Research and Development in Information Retrieval, Virtual, 30–25 July 2020; pp. 2021–2024. [Google Scholar]
  8. Abolghasemi, A.; Verberne, S.; Azzopardi, L. Improving BERT-based query-by-document retrieval with multi-task optimization. In Proceedings of the European Conference on Information Retrieval, Stavanger, Norway, 10–14 April 2022; Springer: Berlin/Heidelberg, Germany, 2022; pp. 3–12. [Google Scholar]
  9. Tagami, Y.; Ono, S.; Yamamoto, K.; Tsukamoto, K.; Tajima, A. CTR Prediction for Contextual Advertising: Learning-to-rank Approach. In Proceedings of the Seventh International Workshop on Data Mining for Online Advertising, Chicago, IL, USA, 11 August 2013; pp. 4:1–4:8. [Google Scholar]
  10. Ciaramita, M.; Murdock, V.; Plachouras, V. Online Learning from Click Data for Sponsored Search. In Proceedings of the 17th International Conference on World Wide Web, Beijing, China, 21–25 April 2008; pp. 227–236. [Google Scholar]
  11. Gharibshah, Z.; Zhu, X. User response prediction in online advertising. ACM Comput. Surv. CSUR 2021, 54, 1–43. [Google Scholar] [CrossRef]
  12. Pang, B.; Lee, L. Seeing Stars: Exploiting Class Relationships for Sentiment Categorization with Respect to Rating Scales. In Proceedings of the 43rd Annual Meeting on Association for Computational Linguistics (ACL ’05), Ann Arbor, MI, USA, 25–30 June 2005; pp. 115–124. [Google Scholar]
  13. Birjali, M.; Kasri, M.; Beni-Hssane, A. A comprehensive survey on sentiment analysis: Approaches, challenges and trends. Knowl.-Based Syst. 2021, 226, 107134. [Google Scholar] [CrossRef]
  14. Page, L.; Brin, S.; Motwani, R.; Winograd, T. The PageRank Citation Ranking: Bringing Order to the Web; Technical Report; Stanford InfoLab: Stanford, CA, USA, 1999. [Google Scholar]
  15. Robertson, S.; Zaragoza, H.; Taylor, M. Simple BM25 extension to multiple weighted fields. In Proceedings of the Thirteenth ACM International Conference on Information and Knowledge Management, Washington, DC, USA, 8–13 November 2004; pp. 42–49. [Google Scholar]
  16. Herbrich, R.; Graepel, T.; Obermayer, K. Support Vector Learning for Ordinal Regression; IET: London, UK, 1999. [Google Scholar]
  17. Joachims, T. Optimizing search engines using clickthrough data. In Proceedings of the Eighth ACM SIGKDD International Conference on Knowledge Discovery and Data Mining, Edmonton, AB, Canada, 23–26 July 2002; pp. 133–142. [Google Scholar]
  18. Freund, Y.; Iyer, R.; Schapire, R.E.; Singer, Y. An efficient boosting algorithm for combining preferences. J. Mach. Learn. Res. 2003, 4, 933–969. [Google Scholar]
  19. Cao, Z.; Qin, T.; Liu, T.Y.; Tsai, M.F.; Li, H. Learning to rank: From pairwise approach to listwise approach. In Proceedings of the 24th International Conference on Machine Learning, Corvalis, OR, USA, 20–24 June 2007; pp. 129–136. [Google Scholar]
  20. Trabelsi, M.; Chen, Z.; Davison, B.D.; Heflin, J. Neural ranking models for document retrieval. Inf. Retr. J. 2021, 24, 400–444. [Google Scholar] [CrossRef]
  21. Datta, S.; Ganguly, D.; Greene, D.; Mitra, M. Deep-qpp: A pairwise interaction-based deep learning model for supervised query performance prediction. In Proceedings of the Fifteenth ACM International Conference on Web Search and Data Mining, Virtual, 21–25 February 2022; pp. 201–209. [Google Scholar]
  22. Qin, T.; Liu, T.Y.; Xu, J.; Li, H. LETOR: A benchmark collection for research on learning to rank for information retrieval. Inf. Retr. 2010, 13, 346–374. [Google Scholar] [CrossRef]
  23. Clarke, C.L.; Kolla, M.; Cormack, G.V.; Vechtomova, O.; Ashkan, A.; Büttcher, S.; MacKinnon, I. Novelty and diversity in information retrieval evaluation. In Proceedings of the 31st Annual International ACM SIGIR Conference on Research and Development in Information Retrieval, Singapore, 20–24 July 2008; pp. 659–666. [Google Scholar]
  24. Manning, C.; Raghavan, P.; Schütze, H. Introduction to information retrieval. Nat. Lang. Eng. 2010, 16, 100–103. [Google Scholar]
  25. Li, H. Learning to rank for information retrieval and natural language processing. In Synthesis Lectures on Human Language Technologies; Morgan & Claypool Publishers: San Rafael, CA, USA, 2014; Volume 7, pp. 1–121. [Google Scholar]
  26. Liang, S. Unsupervised Semantic Generative Adversarial Networks for Expert Retrieval. In Proceedings of the The World Wide Web Conference, San Francisco, CA, USA, 13–14 May 2019; pp. 1039–1050. [Google Scholar]
  27. Van Gysel, C.; de Rijke, M.; Worring, M. Unsupervised, efficient and semantic expertise retrieval. In Proceedings of the 25th International Conference on World Wide Web, Montreal, QC, Canada, 11–15 April 2016; International World Wide Web Conferences Steering Committee: Geneva, Switzerland, 2016; pp. 1069–1079. [Google Scholar]
  28. Tay, Y.; Phan, M.C.; Tuan, L.A.; Hui, S.C. Learning to rank question answer pairs with holographic dual LSTM architecture. In Proceedings of the 40th International ACM SIGIR Conference on Research and Development in Information Retrieval, Tokyo, Japan, 7–11 August 2017; pp. 695–704. [Google Scholar]
  29. Zehlike, M.; Yang, K.; Stoyanovich, J. Fairness in Ranking, Part II: Learning-to-Rank and Recommender Systems. ACM Comput. Surv. CSUR 2022. [Google Scholar] [CrossRef]
  30. Kveton, B.; Meshi, O.; Zoghi, M.; Qin, Z. On the Value of Prior in Online Learning to Rank. In Proceedings of the International Conference on Artificial Intelligence and Statistics (PMLR), Virtual, 28–30 March 2022; pp. 6880–6892. [Google Scholar]
  31. Cossock, D.; Zhang, T. Statistical analysis of Bayes optimal subset ranking. IEEE Trans. Inf. Theory 2008, 54, 5140–5154. [Google Scholar] [CrossRef]
  32. Li, P.; Wu, Q.; Burges, C.J. Mcrank: Learning to rank using multiple classification and gradient boosting. In Proceedings of the Advances in Neural Information Processing Systems, Whistler, BC, Canada, 12 December 2008; pp. 897–904. [Google Scholar]
  33. Xu, J.; Li, H. Adarank: A boosting algorithm for information retrieval. In Proceedings of the 30th Annual International ACM SIGIR Conference on Research and Development in Information Retrieval, Amsterdam, The Netherlands, 23–27 July 2007; pp. 391–398. [Google Scholar]
  34. Yue, Y.; Finley, T.; Radlinski, F.; Joachims, T. A support vector method for optimizing average precision. In Proceedings of the 30th Annual International ACM SIGIR Conference on Research and Development in Information Retrieval, Amsterdam, The Netherlands, 23–27 July 2007; pp. 271–278. [Google Scholar]
  35. Tsai, M.F.; Liu, T.Y.; Qin, T.; Chen, H.H.; Ma, W.Y. FRank: A ranking method with fidelity loss. In Proceedings of the 30th Annual International ACM SIGIR Conference on Research and Development in Information Retrieval, Amsterdam, The Netherlands, 23–27 July 2007; pp. 383–390. [Google Scholar]
  36. Severyn, A.; Moschitti, A. Learning to rank short text pairs with convolutional deep neural networks. In Proceedings of the 38th International ACM SIGIR Conference on Research and Development in Information Retrieval, Santiago, Chile, 9–13 August 2015; pp. 373–382. [Google Scholar]
  37. Wang, B.; Klabjan, D. An attention-based deep net for learning to rank. arXiv 2017, arXiv:1702.06106. [Google Scholar]
  38. Song, B. Deep Neural Network for Learning to Rank Query-Text Pairs. arXiv 2018, arXiv:1802.08988. [Google Scholar]
  39. Ai, Q.; Bi, K.; Guo, J.; Croft, W.B. Learning a deep listwise context model for ranking refinement. In Proceedings of the 41st International ACM SIGIR Conference on Research & Development in Information Retrieval, Ann Arbor, MI, USA, 8–12 July 2018; pp. 135–144. [Google Scholar]
  40. Zhao, X.; Li, X.; Zhang, Z. Multimedia retrieval via deep learning to rank. IEEE Signal Process. Lett. 2015, 22, 1487–1491. [Google Scholar] [CrossRef]
  41. Perozzi, B.; Al-Rfou, R.; Skiena, S. Deepwalk: Online learning of social representations. In Proceedings of the 20th ACM SIGKDD International Conference on Knowledge Discovery and Data Mining, New York, NY, USA, 24–27 August 2014; pp. 701–710. [Google Scholar]
  42. Mikolov, T.; Chen, K.; Corrado, G.; Dean, J. Efficient estimation of word representations in vector space. arXiv 2013, arXiv:1301.3781. [Google Scholar]
  43. Shen, Y.; He, X.; Gao, J.; Deng, L.; Mesnil, G. Learning semantic representations using convolutional neural networks for web search. In Proceedings of the 23rd International Conference on World Wide Web, Seoul, Korea, 7–11 April 2014; pp. 373–374. [Google Scholar]
  44. Tang, S.; Meng, Z.; Liang, S. Dynamic Co-Embedding Model for Temporal Attributed Networks. IEEE Trans. Neural Netw. Learn. Syst. 2022, 1–15. [Google Scholar] [CrossRef]
  45. Fang, J.; Liang, S.; Meng, Z.; Zhang, Q. Gaussian process with graph convolutional kernel for relational learning. In Proceedings of the 27th ACM SIGKDD Conference on Knowledge Discovery & Data Mining, Virtual, 14–18 August 2021; pp. 353–363. [Google Scholar]
  46. Liang, S.; Zhang, X.; Ren, Z.; Kanoulas, E. Dynamic embeddings for user profiling in twitter. In Proceedings of the 24th ACM SIGKDD International Conference on Knowledge Discovery & Data Mining, London, UK, 19–23 August 2018; pp. 1764–1773. [Google Scholar]
  47. Lai, S.; Liu, K.; He, S.; Zhao, J. How to generate a good word embedding. IEEE Intell. Syst. 2016, 31, 5–14. [Google Scholar] [CrossRef]
  48. Zamani, H.; Croft, W.B. Relevance-based word embedding. In Proceedings of the 40th International ACM SIGIR Conference on Research and Development in Information Retrieval, Tokyo, Japan, 7–11 August 2017; pp. 505–514. [Google Scholar]
  49. Shen, D.; Wang, G.; Wang, W.; Min, M.R.; Su, Q.; Zhang, Y.; Li, C.; Henao, R.; Carin, L. Baseline needs more love: On simple word-embedding-based models and associated pooling mechanisms. arXiv 2018, arXiv:1805.09843. [Google Scholar]
  50. Chen, G.; Fang, J.; Meng, Z.; Zhang, Q.; Liang, S. Multi-Relational Graph Representation Learning with Bayesian Gaussian Process Network. In Proceedings of the AAAI Conference on Artificial Intelligence, Virtual, 22 February–1 March 2022; Volume 36, pp. 5530–5538. [Google Scholar]
  51. Fang, J.; Liang, S.; Meng, Z.; De Rijke, M. Hyperspherical Variational Co-embedding for Attributed Networks. ACM Trans. Inf. Syst. TOIS 2021, 40, 1–36. [Google Scholar] [CrossRef]
  52. Fang, J.; Zhang, Q.; Meng, Z.; Liang, S. Structure-Aware Random Fourier Kernel for Graphs. Adv. Neural Inf. Process. Syst. 2021, 34, 17681–17694. [Google Scholar]
  53. Liao, S.; Liang, S.; Meng, Z.; Zhang, Q. Learning dynamic embeddings for temporal knowledge graphs. In Proceedings of the 14th ACM International Conference on Web Search and Data Mining, Virtual, 8–12 March 2021; pp. 535–543. [Google Scholar]
  54. Vilnis, L.; McCallum, A. Word representations via gaussian embedding. arXiv 2014, arXiv:1412.6623. [Google Scholar]
  55. He, S.; Liu, K.; Ji, G.; Zhao, J. Learning to represent knowledge graphs with gaussian embedding. In Proceedings of the 24th ACM International on Conference on Information and Knowledge Management, Melbourne, Australia, 18–23 October 2015; pp. 623–632. [Google Scholar]
  56. Ren, Z.; Jin, H.; Lin, Z.; Fang, C.; Yuille, A. Joint image-text representation by gaussian visual-semantic embedding. In Proceedings of the 24th ACM International Conference on Multimedia, Amsterdam, The Netherlands, 15–19 October 2016; pp. 207–211. [Google Scholar]
  57. Bojchevski, A.; Günnemann, S. Deep gaussian embedding of graphs: Unsupervised inductive learning via ranking. arXiv 2017, arXiv:1707.03815. [Google Scholar]
  58. Wang, M.; Smith, N.A.; Mitamura, T. What is the Jeopardy model? A quasi-synchronous grammar for QA. In Proceedings of the 2007 Joint Conference on Empirical Methods in Natural Language Processing and Computational Natural Language Learning (EMNLP-CoNLL), Prague, Czech Republic, 23–30 June 2007; pp. 22–32. [Google Scholar]
  59. Dos Santos, L.; Piwowarski, B.; Gallinari, P. Multilabel classification on heterogeneous graphs with gaussian embeddings. In Proceedings of the Joint European Conference on Machine Learning and Knowledge Discovery in Databases, Riva del Garda, Italy, 19–23 September 2016; Springer: Berlin/Heidelberg, Germany, 2016; pp. 606–622. [Google Scholar]
  60. Pan, Y.; Liang, S.; Ren, J.; Meng, Z.; Zhang, Q. Personalized, sequential, attentive, metric-aware product search. ACM Trans. Inf. Syst. TOIS 2021, 40, 1–29. [Google Scholar] [CrossRef]
  61. Liang, S.; Luo, Y.; Meng, Z. Profiling users for question answering communities via flow-based constrained co-embedding model. ACM Trans. Inf. Syst. TOIS 2021, 40, 1–38. [Google Scholar] [CrossRef]
  62. LeCun, Y.; Chopra, S.; Hadsell, R.; Ranzato, M.; Huang, F. A tutorial on energy-based learning. In Predicting Structured Data; MIT Press: Cambridge, MA, USA, 2006; Volume 1. [Google Scholar]
  63. Kingma, D.P.; Ba, J. Adam: A method for stochastic optimization. arXiv 2014, arXiv:1412.6980. [Google Scholar]
  64. Chen, X.; He, B.; Sun, L. Groupwise query performance prediction with bert. In Proceedings of the European Conference on Information Retrieval, Stavanger, Norway, 10–14 April 2022; Springer: Berlin/Heidelberg, Germany, 2022; pp. 64–74. [Google Scholar]
  65. Fröbe, M.; Akiki, C.; Potthast, M.; Hagen, M. How Train-Test Leakage Affects Zero-shot Retrieval. arXiv 2022, arXiv:2206.14759. [Google Scholar]
  66. Jung, E.; Choi, J.; Rhee, W. Semi-Siamese Bi-encoder Neural Ranking Model Using Lightweight Fine-Tuning. In Proceedings of the ACM Web Conference 2022, Lyon, France, 25–29 April 2022; pp. 502–511. [Google Scholar]
  67. Dai, Z.; Callan, J. Deeper text understanding for IR with contextual neural language modeling. In Proceedings of the 42nd International ACM SIGIR Conference on Research and Development in Information Retrieval, Paris, France, 21–25 July 2019; pp. 985–988. [Google Scholar]
  68. Craswell, N.; Hawking, D. Overview of the TREC 2004 Web Track; NIST Special Publications (SP): Gaithersburg, MD, USA, 2004. [Google Scholar]
  69. Hersh, W.; Buckley, C.; Leone, T.; Hickam, D. OHSUMED: An interactive retrieval evaluation and new large test collection for research. In Proceedings of the SIGIR’94, Dublin, Ireland, 3–6 July 1994; Springer: London, UK, 1994; pp. 192–201. [Google Scholar]
  70. Raman, N.; Shah, S.; Veloso, M. Structure and Semantics Preserving Document Representations. In Proceedings of the 45th International ACM SIGIR Conference on Research and Development in Information Retrieval, Madrid, Spain, 11–15 July 2022; pp. 780–790. [Google Scholar]
  71. Kingma, D.P.; Welling, M. Auto-encoding variational bayes. arXiv 2013, arXiv:1312.6114. [Google Scholar]
Figure 1. Framework of our proposed model, GERank, consists of four main components. GERank trains itself by using a dataset. It constructs triples of documents in response to a query, trains its parameters with the constructed triples, and then is able to retrieve documents by its final trained model.
Electronics 11 03694 g001
Figure 2. Data processing for the datasets consists of two steps: Step 1: Extract documents under the same query to construct a document pair; Step 2: Extract the query-depend feature and construct the triple ( Q u e r y , D o c 1 D o c 2 ) .
Electronics 11 03694 g002
Figure 3. GERank’s MAP and NDCG performance on the OHSUMED dataset with different embedding dimensions, L = 15 , 30 , , 90 .
Electronics 11 03694 g003
Figure 4. GERank’s precision performance on the OHSUMED dataset with different embedding dimensions, L = 15 , 30 , , 90 .
Electronics 11 03694 g004
Figure 5. GERank’s MAP and NDCG performance on the OHSUMED dataset with different numbers of hidden layers, I = 32 , 64 , , 1024 .
Electronics 11 03694 g005
Figure 6. GERank’s precision performance on the OHSUMED dataset with different numbers of hidden layers, I = 32 , 64 , , 1024 .
Electronics 11 03694 g006
Table 1. Main notations used across the whole paper.
SymbolGloss
C Document corpus
Q Set of queries
D Q Relevant documents to the queries
D q Set of relevant documents to the query q
MNumber of queries
LDimension of embedding space
K i Number of relevant document for a given ith query
r j i Relevance degree of d j i for a given query q i
T Triplet set of query and two relevant documents
q i ith query in Q , i M
d j i jth document for a given ith query, j K i
N q i , q i Gaussian distribution of ith query
N d j i , d j i Gaussian distribution of document d j i , j K i
μ q i Mean of query q i in Gaussian distribution
μ d j i Mean of document d j i in Gaussian distribution
Σ q i Covariance of ith query in Gaussian distribution
Σ d j i Covariance of document d j i in Gaussian distribution
Δ ( q i , d j i ) Dissimilarity measure between query q i and document d j i
D K L ( N d j i N q i ) KL divergence between N d j i and N q i
d j i d j i Document pair in which d j i is ranked lower than d j i to query q i
Table 2. Statistics information of the NP2004 and OHSUMED datasets.
Datasets#Queries#Documents#Features#Query-Depend Features#Relevances
NP20047573,8346452
OHSUMED10616,1404593
Robust04249556,0771001002
Table 3. Performance of our GERank and the baseline models in terms of Precision and MAP on the NP2004 dataset. The best performance per metric among the pairwise L2R algorithms is in boldface. Statistically significant improvement of the performance of our GERank model per metric compared to the best pairwise L2R baseline algorithm is marked in the upper right-hand corner of GERank performance score.
ApproachModelP@1P@3P@5P@10MAP
PointwiseLR0.37330.20000.14400.08200.5142
ListwiseListNet0.53330.26670.17870.09400.6720
AdaRank-MAP0.48000.24440.16270.08800.6220
AdaRank-NDCG0.50670.24890.16530.09000.6269
SVM m a p 0.52000.26670.17870.09600.6620
PairwiseRanking SVM0.50670.26220.17870.09300.6588
RankBoost0.42670.23110.15200.08800.5640
SciBERT0.43260.23240.15540.08920.5721
FRank0.48000.23560.16000.09300.6008
GERank 0 . 5734 0.24890.16530.0893 0 . 6657
Table 4. NDCG on NP2004 dataset. The best performance per metric among the pairwise L2R algorithms is in boldface. Statistically significant improvement of the performance of our GERank model per metric compared to the best pairwise L2R baseline algorithm is marked in the upper right hand corner of GERank performance score.
ApproachModelNDCG@1NDCG@3NDCG@5NDCG@10
PointwiseLR0.37330.55540.61350.6530
ListwiseListNet0.53330.75870.79650.8120
AdaRank-MAP0.48000.69790.73100.7490
AdaRank-NDCG0.50670.67220.71220.7380
SVM m a p 0.52000.74890.78690.8079
PairwiseRanking SVM0.50670.75030.79570.8060
RankBoost0.42670.62740.65120.6914
SciBERT0.43740.63520.66780.7021
FRank0.48000.64310.68700.7290
GERank 0 . 5734 0.66200.69140.7095
Table 5. Precision and MAP on the OHSUMED dataset. The best performance per metric among the pairwise L2R algorithms is in boldface. Statistically significant improvement of the performance of our GERank model per metric compared to the best pairwise L2R baseline algorithm is marked in the upper right-hand corner of GERank performance score.
ApproachModelP@1P@3P@5P@10MAP
PointwiseLR0.59650.57680.53370.46600.4220
ListwiseListNet0.65240.60160.55020.49700.4457
AdaRank-MAP0.63380.58950.56740.49700.4487
AdaRank-NDCG0.67190.59840.57670.50800.4498
SVM m a p 0.64330.58020.55230.49100.4453
PairwiseRanking SVM0.59740.54270.53190.48600.4334
RankBoost0.55760.56090.54470.49660.4411
SciBERT0.56820.54780.53050.48720.4331
FRank0.64290.59250.56380.50100.4439
GERank 0 . 6909 0 . 6085 0.54120.49290.4373
Table 6. NDCG on the OHSUMED dataset. The best performance per metric among the pairwise L2R algorithms is in boldface. Statistically significant improvement of the performance of our model per metric compared to the best pairwise L2R baseline algorithm is marked in the upper right-hand corner of performance score.
ApproachModelNDCG@1NDCG@3NDCG@5NDCG@10
PointwiseLR0.44560.44260.42780.4110
ListwiseListNet0.53260.47320.44320.4410
AdaRank-MAP0.53880.46820.46130.4420
AdaRank-NDCG0.53300.47900.46730.4490
SVM m a p 0.52290.46630.45160.4319
PairwiseRanking SVM0.49580.42070.41640.4140
RankBoost0.46320.45550.44940.4302
SciBERT0.45890.44720.42100.4243
FRank0.53000.48120.45880.4430
GERank 0 . 6008 0 . 5326 0 . 4920 0 . 4650
Table 7. Precision and MAP on the Robust04 dataset. The best performance per metric among the pairwise L2R algorithms is in boldface. Statistically significant improvement of the performance of our GERank model per metric compared to the best pairwise L2R baseline algorithm is marked in the upper right-hand corner of GERank performance score.
ApproachModelP@1P@3P@5P@10MAP
PointwiseLR0.52120.48140.42420.43170.3415
ListwiseListNet0.53560.52380.49130.43200.3421
AdaRank-MAP0.54400.52150.48710.43130.3433
AdaRank-NDCG0.54550.52320.47510.42370.3413
SVM m a p 0.53450.51730.48280.43320.3421
PairwiseRanking SVM0.58700.57210.52350.48560.3761
RankBoost0.57420.56270.50430.47220.3755
SciBERT0.55480.54740.49250.46560.3722
FRank0.59320.58710.55250.49260.3814
GERank 0 . 6123 0 . 6052 0 . 5725 0.4901 0 . 4018
Table 8. NDCG on the Robust04 dataset. The best performance per metric among the pairwise L2R algorithms is in boldface. Statistically significant improvement of the performance of our GERank model per metric compared to the best pairwise L2R baseline algorithm is marked in the upper right-hand corner of GERank performance score.
ApproachModelNDCG@1NDCG@3NDCG@5NDCG@10
PointwiseLR0.52120.55210.62200.7322
ListwiseListNet0.53560.55440.62130.7251
AdaRank-MAP0.54400.56470.63210.7421
AdaRank-NDCG0.54550.56780.64020.7452
SVM m a p 0.53450.54270.63980.7423
PairwiseRanking SVM0.58700.63270.68720.7824
RankBoost0.57420.62470.67450.7743
SciBERT0.55480.61220.65540.7532
FRank0.59320.64720.69230.7951
GERank 0 . 6133 0 . 6645 0 . 7142 0.7887
Publisher’s Note: MDPI stays neutral with regard to jurisdictional claims in published maps and institutional affiliations.

