
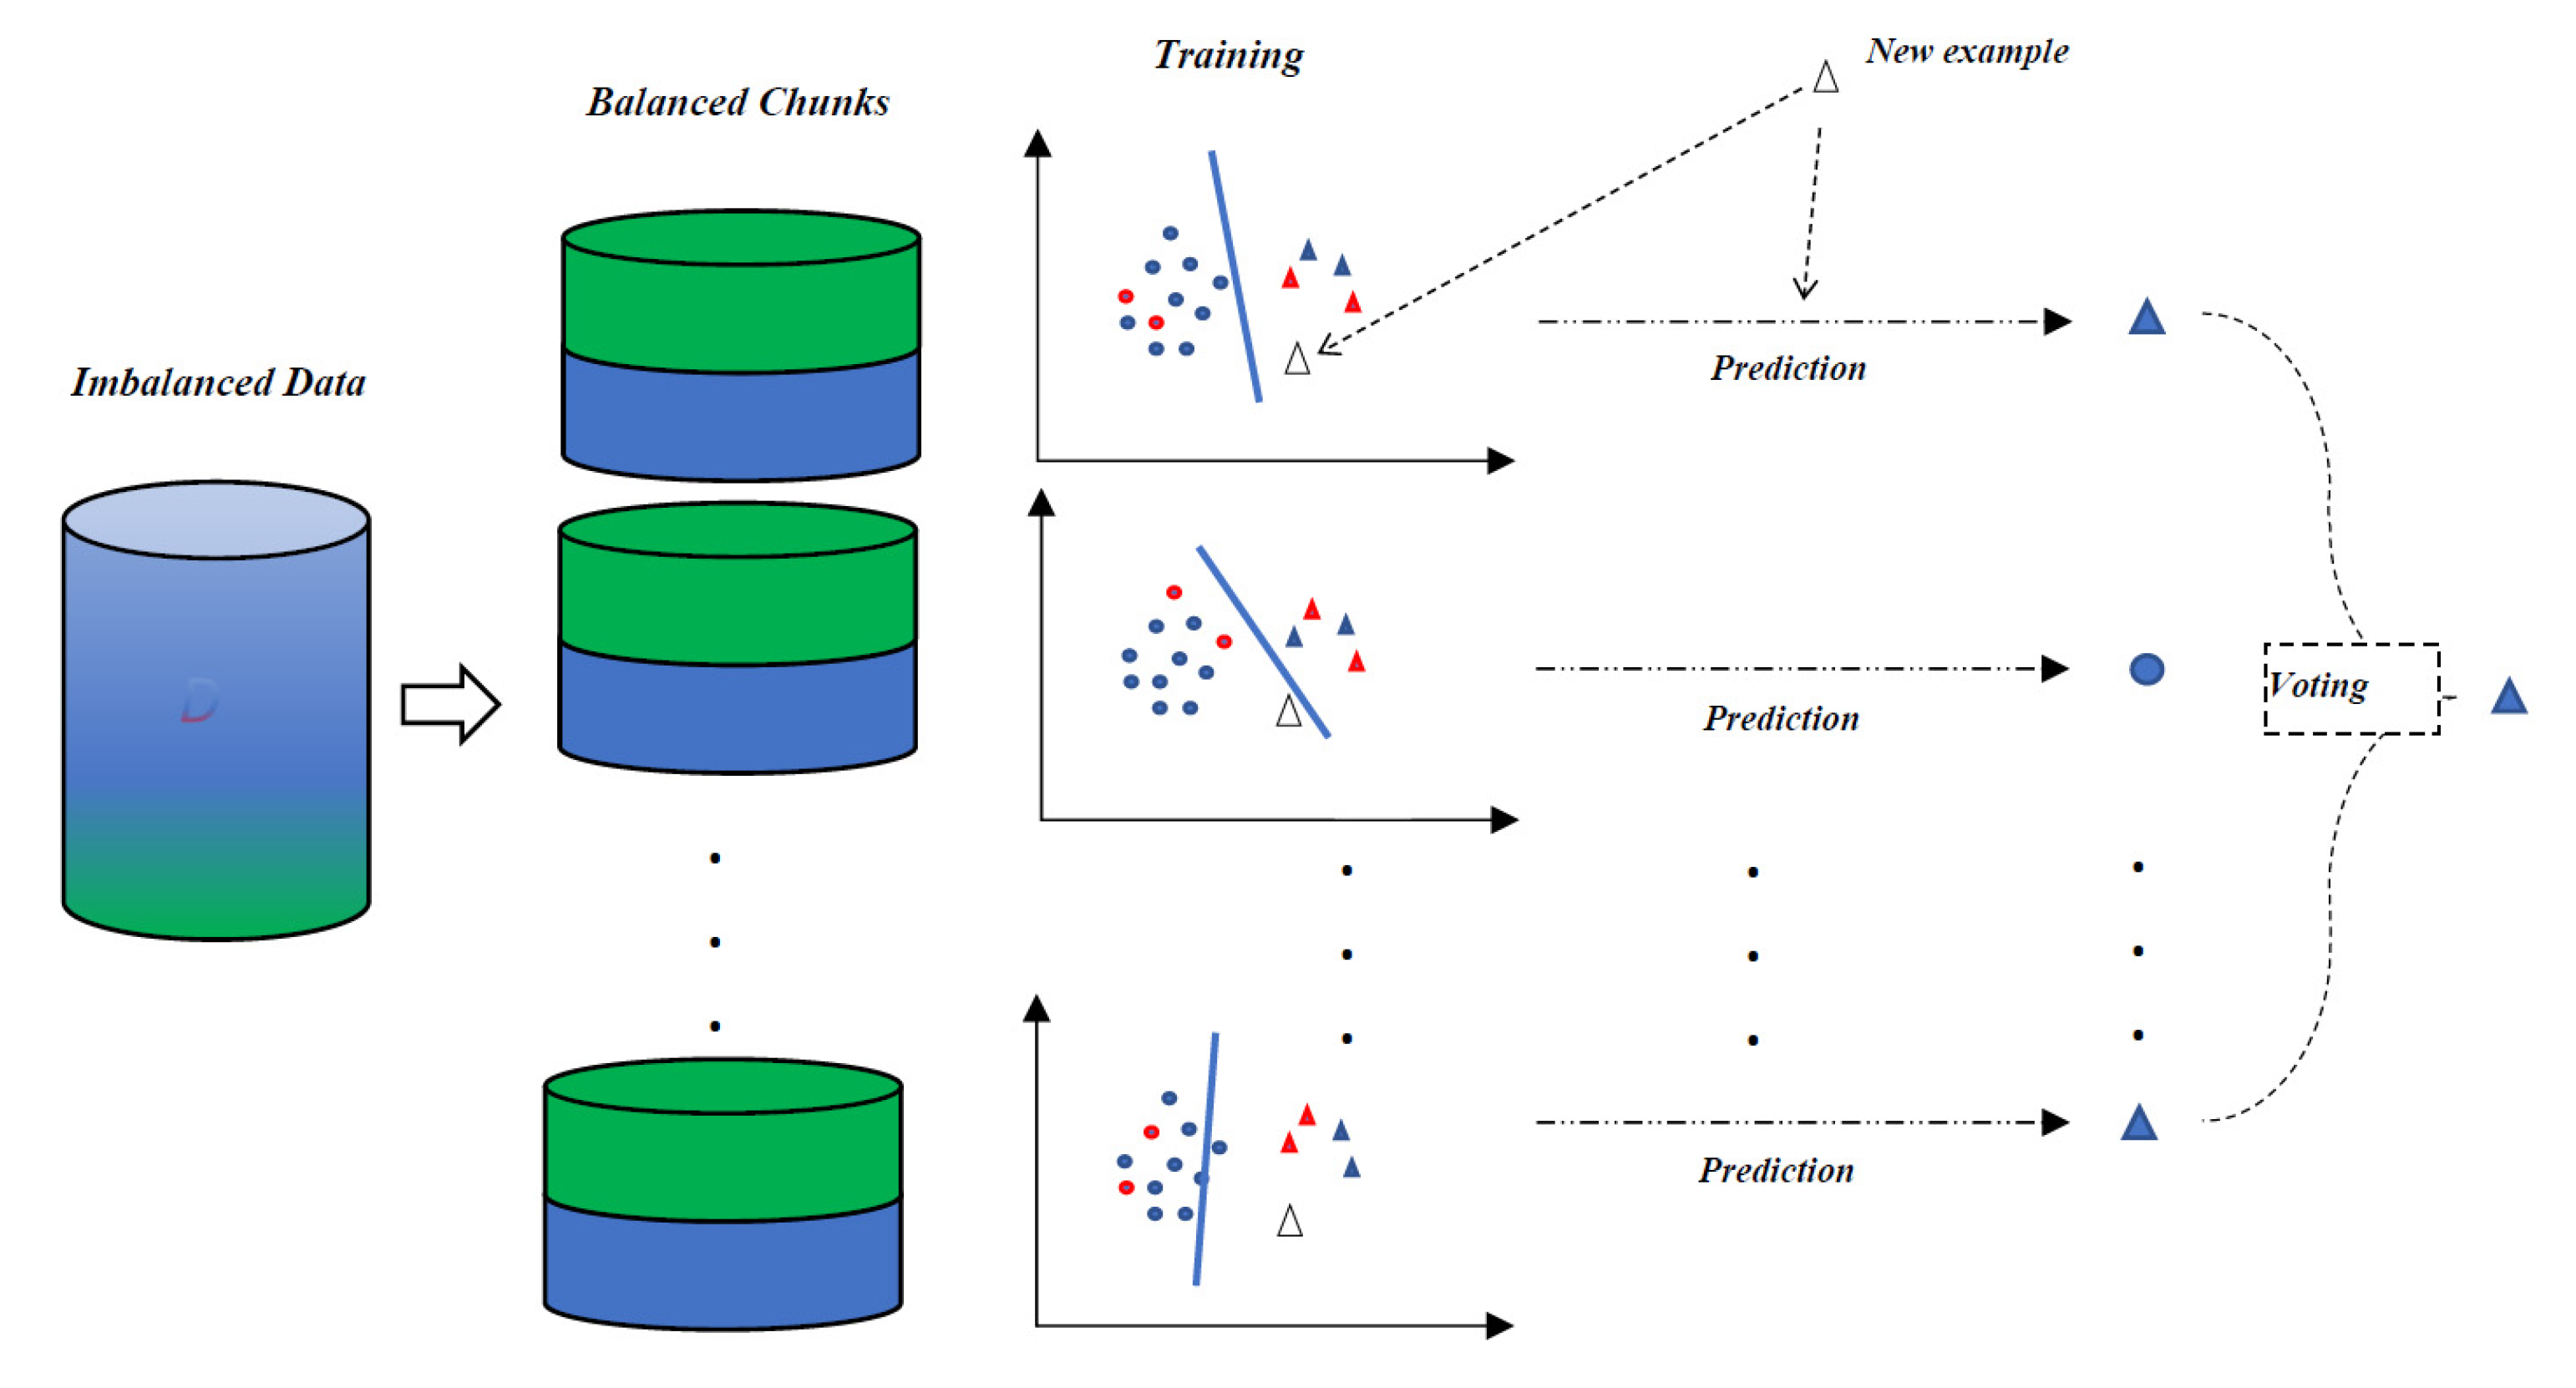
RDPVR: Random Data Partitioning with Voting Rule for Machine Learning from Class-Imbalanced Datasets

 ,
, 
 ,
, 
 and
and
Abstract
1. Introduction
- More samples from the minority class(es) should be acquired from the discourse domain.
- Changing the loss function to give the failing minority class a higher cost [67].
- Oversampling of minority class examples.
- Undersampling of majority class examples.
- Any combination of the preceding methods.
2. Related Work
2.1. Oversampling
2.2. Undersampling
3. The Proposed Method
4. Data
5. Experiments and Results
6. Conclusions
Author Contributions
Funding
Data Availability Statement
Conflicts of Interest
References
- Galar, M.; Fernandez, A.; Barrenechea, E.; Bustince, H.; Herrera, F. A Review on Ensembles for the Class Imbalance Problem: Bagging-, Boosting-, and Hybrid-Based Approaches. IEEE Trans. Syst. Man Cybern. Part C Appl. Rev. 2012, 42, 463–484. [Google Scholar] [CrossRef]
- He, H.; Ma, Y. Imbalanced Learning: Foundations, Algorithms, and Applications; Wiley-IEEE Press: Hoboken, NJ, USA, 2013. [Google Scholar]
- Wu, J.; Zhao, Z.; Sun, C.; Yan, R.; Chen, X. Learning from Class-imbalanced Data with a Model-Agnostic Framework for Machine Intelligent Diagnosis. Reliab. Eng. Syst. Saf. 2021, 216, 107934. [Google Scholar] [CrossRef]
- Peng, M. Trainable undersampling for class-imbalance learning. In Proceedings of the 33rd AAAI Conference on Artificial Intelligence, Palo Alto, CA, USA, 1 July 2019. [Google Scholar]
- Tarawneh, A.S.; Hassanat, A.B.A.; Almohammadi, K.; Chetverikov, D.; Bellinger, C. SMOTEFUNA: Synthetic Minority Over-Sampling Technique Based on Furthest Neighbour Algorithm. IEEE Access 2020, 8, 59069–59082. [Google Scholar] [CrossRef]
- Hassanat, A.; Jassim, S. Visual Words for Lip-Reading. In Mobile Multimedia/Image Processing, Security, and Applications 2010; SPIE Press: Orlando, FL, USA, 2010. [Google Scholar]
- Hassanat, A.B.A. Visual Speech Recognition. In Speech and Language Technologies; InTech: London, UK, 2011; pp. 279–304. [Google Scholar]
- Hassanat, A.; Btoush, E.; Abbadi, M.; Al-Mahadeen, B.; Al-Awadi, M.; Mseidein, K.; Almseden, A.; Tarawneh, A.; Alhasanat, M.; Prasath, V.; et al. Victory sign biometrie for terrorists identification: Preliminary results. In Proceedings of the 2017 8th International Conference on Information and Communication Systems, ICICS 2017, Irbid, Jordan, 4–6 April 2017. [Google Scholar]
- Hassanat, A. On Identifying Terrorists Using Their Victory Signs. Data Sci. J. 2018, 17, 27. [Google Scholar] [CrossRef]
- Tarawneh, A.S.; Chetverikov, D.; Verma, C.; Hassanat, A.B. Stability and reduction of statistical features for image classification and retrieval: Preliminary results. In Proceedings of the 2018 9th International Conference on Information and Communication Systems (ICICS), Irbid, Jordan, 3–5 April 2018. [Google Scholar]
- Al-Shamaileh, M.Z.; Hassanat, A.B.; Tarawneh, A.S.; Rahman, M.S.; Celik, C.; Jawthari, M. New Online/Offline text-dependent Arabic Handwriting dataset for Writer Authentication and Identification. In Proceedings of the 2019 10th International Conference on Information and Communication Systems (ICICS), Irbid, Jordan, 11–13 June 2019. [Google Scholar]
- Hassanat, A.; Al-Awadi, M.; Btoush, E.; Btoush, A.A.; Alhasanat, E.; Altarawneh, G. New Mobile Phone and Webcam Hand Images Databases for Personal Authentication and Identification. Procedia Manuf. 2015, 3, 4060–4067. [Google Scholar] [CrossRef]
- Al-Btoush, A.I.; Abbadi, M.A.; Hassanat, A.B.; Tarawneh, A.S.; Hasanat, A.; Prasath, V.B.S. New Features for Eye-Tracking Systems: Preliminary Results. In Proceedings of the 2019 10th International Conference on Information and Communication Systems (ICICS), Irbid, Jordan, 11–13 June 2019. [Google Scholar]
- Alhasanat, S.M.M.; Prasath, V.S.; Al Mahadeen, B.M.; Hassanat, A. Classification and gender recognition from veiled-faces. Int. J. Biom. 2017, 9, 347. [Google Scholar] [CrossRef]
- Hammad, M.; Alkinani, M.H.; Gupta, B.B.; El-Latif, A.A.A. Myocardial infarction detection based on deep neural network on imbalanced data. Multimed. Syst. 2021, 1–13. [Google Scholar] [CrossRef]
- Fatima, M.; Pasha, M. Survey of Machine Learning Algorithms for Disease Diagnostic. J. Intell. Learn. Syst. Appl. 2017, 9, 1–16. [Google Scholar] [CrossRef]
- Alqatawneh, A.; Alhalaseh, R.; Hassanat, A.; Abbadi, M. Statistical-Hypothesis-Aided Tests for Epilepsy Classification. Computers 2019, 8, 84. [Google Scholar] [CrossRef]
- Aseeri, M.; Hassanat, A.B.; Mnasri, S.; Tarawneh, A.S.; Alhazmi, K.; Altarawneh, G.; Alrashidi, M.; Alharbi, H.; Almohammadi, K.; Chetverikov, D.; et al. Modelling-based Simulator for Forecasting the Spread of COVID-19: A Case Study of Saudi Arabia. IJCSNS Int. J. Comput. Sci. Netw. Secur. 2020, 20, 114. [Google Scholar]
- Hassanat, A.B.; Mnasri, S.; Aseeri, M.; Alhazmi, K.; Cheikhrouhou, O.; Altarawneh, G.; Alrashidi, M.; Tarawneh, A.S.; Almohammadi, K.; Almoamari, H. A simulation model for forecasting covid-19 pandemic spread: Analytical results based on the current saudi covid-19 data. Sustainability 2021, 13, 4888. [Google Scholar] [CrossRef]
- Fiore, U.; De Santis, A.; Perla, F.; Zanetti, P.; Palmieri, F. Using generative adversarial networks for improving classification effectiveness in credit card fraud detection. Inf. Sci. 2019, 479, 448–455. [Google Scholar] [CrossRef]
- Ghatasheh, N.; Faris, H.; Abukhurma, R.; Castillo, P.A.; Al-Madi, N.; Mora, A.M.; Al-Zoubi, A.M.; Hassanat, A. Cost-sensitive ensemble methods for bankruptcy prediction in a highly imbalanced data distribution: A real case from the Spanish market. Prog. Artif. Intell. 2020, 9, 361–375. [Google Scholar] [CrossRef]
- Xu, H.; Zhang, C.; Hong, G.S.; Zhou, J.; Hong, J.; Woon, K.S. Gated Recurrent Units Based Neural Network for Tool Condition Monitoring. In Proceedings of the 2018 International Joint Conference on Neural Networks (IJCNN), Rio de Janeiro, Brazil, 8–13 July 2018. [Google Scholar]
- Mnasri, S.; Bossche, A.V.D.; Nasri, N.; Val, T. The 3D Redeployment of Nodes in Wireless Sensor Networks with Real Testbed Prototyping. In Proceedings of the International Conference on Ad-Hoc Networks and Wireless, Messina, Italy, 17–18 September 2017; pp. 18–24. [Google Scholar]
- Mnasri, S.; Nasri, N.; Val, T. The 3D indoor deployment in DL-IoT with experimental validation using a particle swarm algorithm based on the dialects of songs. In Proceedings of the 2018 14th International Wireless Communications and Mobile Computing Conference, IWCMC 2018, Limassol, Cyprus, 25–29 June 2018. [Google Scholar]
- Mnasri, S.; van den Bossche, A.; Narsi, N.; Val, T. The 3D Deployment Multi-objective Problem in Mobile WSN: Optimizing Coverage and Localization. Int. Res. J. Innov. Eng.-IRJIE 2015, 1, 1–14. [Google Scholar]
- Mnasri, S.; Nasri, N.; AlRashidi, M.; Bossche, A.V.D.; Val, T. IoT networks 3D deployment using hybrid many-objective optimization algorithms. J. Heuristics 2020, 26, 663–709. [Google Scholar] [CrossRef]
- Abdallah, W.; Mnasri, S.; Val, T. Genetic-Voronoi algorithm for coverage of IoT data collection networks. In Proceedings of the 30th International Conference on Computer Theory and Applications, ICCTA 2020-Proceedings, Alexandria, Egypt, 12–14 December 2020. [Google Scholar]
- Abdallah, W.; Mnasri, S.; Nasri, N.; Val, T. Emergent IoT Wireless Technologies beyond the year 2020: A Comprehensive Comparative Analysis. In Proceedings of the 2020 International Conference on Computing and Information Technology (ICCIT-1441), Tabuk, Saudi Arabia, 9–10 September 2020. [Google Scholar]
- Mnasri, S.; Nasri, N.; Bossche, A.V.D.; Val, T. A new multi-agent particle swarm algorithm based on birds accents for the 3D indoor deployment problem. ISA Trans. 2019, 91, 262–280. [Google Scholar] [CrossRef]
- Mnasri, S.; Abbes, F.; Zidi, K.; Ghedira, K. A multi-objective hybrid BCRC-NSGAII algorithm to solve the VRPTW. In Proceedings of the 13th International Conference on Hybrid Intelligent Systems, HIS 2013, Gammarth, Tunisia, 4–6 December 2013. [Google Scholar]
- Tlili, S.; Mnasri, S.; Val, T. A multi-objective Gray Wolf algorithm for routing in IoT Collection Networks with real experiments. In Proceedings of the 2021 IEEE 4th National Computing Colleges Conference, NCCC 2021, Taif, Saudi Arabia, 27–28 March 2021. [Google Scholar]
- Mnasri, S.; Nasri, N.; van den Bossche, A.; Val, T. A Hybrid Ant-Genetic Algorithm to Solve a Real Deployment Problem: A Case Study with Experimental Validation. In Proceedings of the International Conference on Ad-Hoc Networks and Wireless, Messina, Italy, 20–22 September 2017; pp. 367–381. [Google Scholar]
- Mnasri, S.; Nasri, N.; van den Bossche, A.; Val, T. A comparative analysis with validation of NSGA-III and MOEA/D in resolving the 3D indoor redeployment problem in DL-IoT. In Proceedings of the 2017 International Conference on Internet of Things, Embedded Systems and Communications, IINTEC 2017-Proceedings, Gafsa, Tunisia, 20–22 October 2017. [Google Scholar]
- Alghamdi, M.; Teahan, W. Experimental evaluation of Arabic OCR systems. PSU Res. Rev. 2017, 1, 229–241. [Google Scholar] [CrossRef]
- Hassanat, A.B.; Altarawneh, G. Rule-and Dictionary-based Solution for Variations in Written Arabic Names in Social Networks, Big Data, Accounting Systems and Large Databases. Res. J. Appl. Sci. Eng. Technol. 2014, 8, 1630–1638. [Google Scholar] [CrossRef]
- Al-Kasassbeh, M.; Khairallah, T. Winning tactics with DNS tunnelling. Netw. Secur. 2019, 2019, 12–19. [Google Scholar] [CrossRef]
- Al-Naymat, G.; Al-Kasassbeh, M.; Al-Hawari, E. Using machine learning methods for detecting network anomalies within SNMP-MIB dataset. Int. J. Wirel. Mob. Comput. 2018, 15, 67–76. [Google Scholar] [CrossRef]
- Zuraiq, A.A.; Alkasassbeh, M. Review: Phishing Detection Approaches. In Proceedings of the 2019 2nd International Conference on New Trends in Computing Sciences, ICTCS 2019-Proceedings, Amman, Jordan, 9–11 October 2019. [Google Scholar]
- Almseidin, M.; Abu Zuraiq, A.; Al-Kasassbeh, M.; Alnidami, N. Phishing Detection Based on Machine Learning and Feature Selection Methods. Int. J. Interact. Mob. Technol. (iJIM) 2019, 13, 171–183. [Google Scholar] [CrossRef]
- Abuzuraiq, A.; Alkasassbeh, M.; Almseidin, M. Intelligent Methods for Accurately Detecting Phishing Websites. In Proceedings of the 2020 11th International Conference on Information and Communication Systems, ICICS 2020, Irbid, Jordan, 7–9 April 2020. [Google Scholar]
- Almseidin, M.; Piller, I.; Alkasassbeh, M.; Kovacs, S. Fuzzy Automaton as a Detection Mechanism for the Multi-Step Attack. Int. J. Adv. Sci. Eng. Inf. Technol. 2019, 9, 575–586. [Google Scholar] [CrossRef]
- Al-Kasassbeh, M.; Mohammed, S.; Alauthman, M.; Almomani, A. Feature selection using a machine learning to classify a malware. In Handbook of Computer Networks and Cyber Security; Springer: Berlin/Heidelberg, Germany, 2019; pp. 889–904. [Google Scholar]
- Almseidin, M.; Al-Kasassbeh, M.; Kovacs, S. Detecting Slow Port Scan Using Fuzzy Rule Interpolation. In Proceedings of the 2019 2nd International Conference on New Trends in Computing Sciences, ICTCS 2019-Proceedings, Amman, Jordan, 9–11 October 2019. [Google Scholar]
- Alothman, Z.; Alkasassbeh, M.; Baddar, S.A.-H. An efficient approach to detect IoT botnet attacks using machine learning. J. High Speed Netw. 2020, 26, 241–254. [Google Scholar] [CrossRef]
- Al Hawawreh, M.; Rawashdeh, A.; Alkasassbeh, M. An anomaly-based approach for DDoS attack detection in cloud environment. Int. J. Comput. Appl. Technol. 2018, 57, 312. [Google Scholar] [CrossRef]
- Alkasassbeh, M. A Novel Hybrid Method for Network Anomaly Detection Based on Traffic Prediction and Change Point Detection. J. Comput. Sci. 2018, 14, 153–162. [Google Scholar] [CrossRef][Green Version]
- Hamadaqa, E.; Abadleh, A.; Mars, A.; Adi, W. Highly Secured Implantable Medical Devices. In Proceedings of the 2018 International Conference on Innovations in Information Technology (IIT), Al Ain, United Arab Emirates, 18–19 November 2018. [Google Scholar]
- Mulhem, S.; Abadleh, A.; Adi, W. Accelerometer-Based Joint User-Device Clone-Resistant Identity. In Proceedings of the 2018 Second World Conference on Smart Trends in Systems, Security and Sustainability (WorldS4), London, UK, 30–31 October 2018; pp. 230–237. [Google Scholar]
- Mars, A.; Abadleh, A.; Adi, W. Operator and Manufacturer Independent D2D Private Link for Future 5G Networks. In Proceedings of the INFOCOM 2019-IEEE Conference on Computer Communications Workshops, INFOCOM WKSHPS 2019, Paris, France, 29 April–2 May 2019. [Google Scholar]
- Alabadleh, A.; Alja’Afreh, S.; Aljaafreh, A.; Alawasa, K. A RSS-based localization method using HMM-based error correction. J. Locat. Based Serv. 2018, 12, 273–285. [Google Scholar] [CrossRef]
- Aljaafreh, A.; Alawasa, K.; Alja’afreh, S.; Abadleh, A. Fuzzy inference system for speed bumps detection using smart phone accelerometer sensor. J. Telecommun. Electron. Comput. Eng. 2017, 9, 133–136. [Google Scholar]
- Abadleh, A.; Al-Hawari, E.; Alkafaween, E.; Al-Sawalqah, H. Step Detection Algorithm for Accurate Distance Estimation Using Dynamic Step Length. In Proceedings of the 2017 18th IEEE International Conference on Mobile Data Management (MDM), Daejeon, Korea, 29 May–1 June 2017. [Google Scholar]
- Abadleh, A.; Han, S.; Hyun, S.J.; Lee, B.; Kim, M. Construction of indoor floor plan and localization. Wirel. Netw. 2016, 22, 175–191. [Google Scholar] [CrossRef]
- Hassanat, A.; Prasath, V.; Mseidein, K.; Al-Awadi, M.; Hammouri, A. A hybridwavelet-shearlet approach to robust digital imagewatermarking. Informatica 2017, 41, 3–24. [Google Scholar]
- Hassanat, A.; Jassim, S. Color-based lip localization method. In Proceedings of the SPIE-The International Society for Optical Engineering, Orlando, FL, USA, 28 April 2010. [Google Scholar]
- Hassanat, A.B.; Alkasassbeh, M.; Al-Awadi, M.; Alhasanat, E.A. Color-based object segmentation method using artificial neural network. Simul. Model. Pract. Theory 2016, 64, 3–17. [Google Scholar] [CrossRef]
- Narloch, P.; Hassanat, A.; Altarawneh, A.S.A.; Anysz, H.; Kotowski, J.; Almohammadi, K. Predicting Compressive Strength of Cement-Stabilized Rammed Earth Based on SEM Images Using Computer Vision and Deep Learning. Appl. Sci. 2019, 9, 5131. [Google Scholar] [CrossRef]
- Hassanat, A.; Prasath, V.B.S.; Alkasassbeh, M.; Altarawneh, A.S.A.; Al-Shamailh, A.J. Magnetic energy-based feature extraction for low-quality fingerprint images. Signal Image Video Process. 2018, 12, 1471–1478. [Google Scholar] [CrossRef]
- Hassanat, A.B.; Alkasassbeh, M.; Al-Awadi, M.; Alhasanat, E.A. Colour-based lips segmentation method using artificial neural networks. In Proceedings of the 2015 6th International Conference on Information and Communication Systems, ICICS 2015, Irbid, Jordan, 7–9 April 2015. [Google Scholar]
- Mansour, R.F.; Abdel-Khalek, S.; Hilali-Jaghdam, I.; Nebhen, J.; Cho, W.; Joshi, G.P. An intelligent outlier detection with machine learning empowered big data analytics for mobile edge computing. Clust. Comput. 2021, 1–13. [Google Scholar] [CrossRef]
- Aljehane, N.O.; Mansour, R.F. Optimal allocation of renewable energy source and charging station for PHEVs. Sustain. Energy Technol. Assess. 2021, 49, 101669. [Google Scholar] [CrossRef]
- Mansour, R.F.; Escorcia-Gutierrez, J.; Gamarra, M.; Díaz, V.G.; Gupta, D.; Kumar, S. Artificial intelligence with big data analytics-based brain intracranial hemorrhage e-diagnosis using CT images. Neural Comput. Appl. 2021, 1–13. [Google Scholar] [CrossRef]
- Hassanat, A.B. Two-point-based binary search trees for accelerating big data classification using KNN. PLoS ONE 2018, 13, e0207772. [Google Scholar] [CrossRef]
- Hassanat, A.B. Norm-Based Binary Search Trees for Speeding Up KNN Big Data Classification. Computers 2018, 7, 54. [Google Scholar] [CrossRef]
- Hassanat, A.B. Furthest-Pair-Based Decision Trees: Experimental Results on Big Data Classification. Information 2018, 9, 284. [Google Scholar] [CrossRef]
- Hassanat, A.B. Furthest-Pair-Based Binary Search Tree for Speeding Big Data Classification Using K-Nearest Neighbors. Big Data 2018, 6, 225–235. [Google Scholar] [CrossRef]
- Wang, S.; Jiang, W.; Tsui, K.L. Adjusted support vector machines based on a new loss function. Ann. Oper. Res. 2008, 174, 83–101. [Google Scholar] [CrossRef]
- Fernández, A.; García, S.; Galar, M.; Prati, R.; Krawczyk, B.; Herrera, F. Learning from Imbalanced Data Sets, 1st ed.; Springer: Berlin/Heidelberg, Germany, 2018; p. 83. [Google Scholar]
- Branco, P.; Torgo, L.; Ribeiro, R.P. A survey of predictive modeling on imbalanced domains. ACM Comput. Surv. 2016, 49, 1–50. [Google Scholar] [CrossRef]
- Haixiang, G.; Yijing, L.; Shang, J.; Mingyun, G.; Yuanyue, H.; Bing, G. Learning from class-imbalanced data: Review of methods and applications. Expert Syst. Appl. 2017, 73, 220–239. [Google Scholar] [CrossRef]
- Sun, Y.; Wong, A.K.; Kamel, M.S. Classification of imbalanced data: A review. Int. J. Pattern Recognit. Artif. Intell. 2009, 23, 687–719. [Google Scholar] [CrossRef]
- Tanha, J.; Abdi, Y.; Samadi, N.; Razzaghi, N.; Asadpour, M. Boosting methods for multi-class imbalanced data classification: An experimental review. J. Big Data 2020, 7, 1–47. [Google Scholar] [CrossRef]
- Chawla, N.V.; Bowye, K.W.; Hall, L.O.; Kegelmeyer, W.P. SMOTE: Synthetic minority over-sampling technique. J. Artif. Intell. Res. 2002, 16, 321–357. [Google Scholar] [CrossRef]
- Drummond, C.; Holte, R.C. C4.5, Class Imbalance, and Cost Sensitivity: Why Under-Sampling Beats Over-Sampling. In Proceedings of the International Conference on Machine Learning (ICML 2003) Workshop on Learning from Imbalanced Datasets II, Washington, DC, USA, 1 July 2003. [Google Scholar]
- Han, H.; Wang, W.Y.; Mao, B.H. Borderline-SMOTE: A New Over-Sampling Method in Imbalanced Data Sets Learning; Springer: Berlin/Heidelberg, Germany, 2005; pp. 878–887. [Google Scholar]
- Tang, Y.; Zhang, Y.Q.; Chawla, N.V. SVMs modeling for highly imbalanced classification. IEEE Trans. Syst. Man Cybern. Part B Cybern. 2009, 39, 281–288. [Google Scholar] [CrossRef]
- Das, R. An Oversampling Technique by Integrating Reverse Nearest Neighbor in SMOTE: Reverse-SMOTE. In Proceedings of the International Conference on Smart Electronics and Communication, ICOSEC 2020, Trichy, India, 10–12 September 2020; pp. 1239–1244. [Google Scholar]
- Liu, C. Constrained Oversampling: An Oversampling Approach to Reduce Noise Generation in Imbalanced Datasets with Class Overlapping. IEEE Access 2020. [Google Scholar] [CrossRef]
- Barua, S.; Islam, M.M.; Yao, X.; Murase, K. MWMOTE-Majority weighted minority oversampling technique for imbalanced data set learning. IEEE Trans. Knowl. Data Eng. 2014, 26, 405–425. [Google Scholar] [CrossRef]
- He, H.; Bai, Y.; Garcia, E.A.; Li, S. ADASYN: Adaptive synthetic sampling approach for imbalanced learning. In Proceedings of the International Joint Conference on Neural Networks, Hong Kong, China, 1–8 June 2008. [Google Scholar]
- Bellinger, C. Framework for extreme imbalance classification: SWIM—sampling with the majority class. Knowl. Inf. Syst. 2019, 62, 841–866. [Google Scholar] [CrossRef]
- Tian, C. A New Majority Weighted Minority Oversampling Technique for Classification of Imbalanced Datasets. In Proceedings of the 2020 International Conference on Big Data, Artificial Intelligence and Internet of Things Engineering, ICBAIE 2020, Fuzhou, China, 12–14 June 2020; pp. 154–157. [Google Scholar]
- Domingos, P. MetaCost: A General Method for Making Classifiers Cost-Sensitive. In Proceedings of the Fifth ACM SIGKDD International Conference on Knowledge Discovery and Data Mining, Lisboa, Portugal, 1 August 1999; Volume 55, pp. 155–164. [Google Scholar]
- Kurniawati, Y.E. Adaptive Synthetic–Nominal (ADASYN–N) and Adaptive Synthetic–KNN (ADASYN- KNN) for Multiclass Imbalance Learning on Laboratory Test Data. In Proceedings of the 2018 4th International Conference on Science and Technology (ICST), Yogyakarta, Indonesian, 7–8 August 2018; pp. 1–6. [Google Scholar]
- Zhang, W.; Ramezani, R.; Naeim, A. WOTBoost: Weighted Oversampling Technique in Boosting for imbalanced learning. In Proceedings of the 2019 IEEE International Conference on Big Data, Big Data 2019, Los Angeles, CA, USA, 9–12 December 2019. [Google Scholar]
- Kovács, G. Smote-variants: A python implementation of 85 minority oversampling techniques. Neurocomputing 2019, 366, 352–354. [Google Scholar] [CrossRef]
- Raghuwanshi, B.S.; Shukla, S. SMOTE based class-specific extreme learning machine for imbalanced learning. Knowl.-Based Syst. 2020, 187, 104814. [Google Scholar] [CrossRef]
- Douzas, G.; Bacao, F. Self-Organizing Map Oversampling (SOMO) for imbalanced data set learning. Expert Syst. Appl. 2017, 82, 40–52. [Google Scholar] [CrossRef]
- Pradipta, G.A.; Wardoyo, R.; Musdholifah, A.; Sanjaya, I.N.H. Radius-SMOTE: A New Oversampling Technique of Minority Samples Based on Radius Distance for Learning from Imbalanced Data. IEEE Access 2021, 9, 74763–74777. [Google Scholar] [CrossRef]
- Krawczyk, B.; Koziarski, M.; Wozniak, M. Radial-based oversampling for multiclass imbalanced data classification. IEEE Trans. Neural Netw. Learn. Syst. 2020, 31, 2818–2831. [Google Scholar] [CrossRef]
- Hong, J.; Kang, H.; Hong, T. Oversampling-based prediction of environmental complaints related to construction projects with imbalanced empirical-data learning. Renew. Sustain. Energy Rev. 2020, 134, 110402. [Google Scholar] [CrossRef]
- Ibrahim, M.H. ODBOT: Outlier detection-based oversampling technique for imbalanced datasets learning. Neural Comput. Appl. 2021, 33, 15781–15806. [Google Scholar] [CrossRef]
- Wang, L.; Wang, H.; Fu, G. Multiple Kernel Learning with Minority Oversampling for Classifying Imbalanced Data. IEEE Access 2020, 9, 565–580. [Google Scholar] [CrossRef]
- Bej, S.; Davtyan, N.; Wolfien, M.; Nassar, M.; Wolkenhauer, O. LoRAS: An oversampling approach for imbalanced datasets. Mach. Learn. 2021, 110, 279–301. [Google Scholar] [CrossRef]
- Zhu, T.; Lin, Y.; Liu, Y. Improving interpolation-based oversampling for imbalanced data learning. Knowl.-Based Syst. 2020, 187, 104826. [Google Scholar] [CrossRef]
- Douzas, G.; Bacao, F.; Last, F. Improving imbalanced learning through a heuristic oversampling method based on k-means and SMOTE. Inf. Sci. 2018, 465, 1–20. [Google Scholar] [CrossRef]
- Faris, H.; Abukhurma, R.; Almanaseer, W.; Saadeh, M.; Mora, A.M.; Castillo, P.A.; Aljarah, I. Improving financial bankruptcy prediction in a highly imbalanced class distribution using oversampling and ensemble learning: A case from the Spanish market. Prog. Artif. Intell. 2020, 9, 31–53. [Google Scholar] [CrossRef]
- Jiang, Z.; Yang, J.; Liu, Y. Imbalanced Learning with Oversampling based on Classification Contribution Degree. Adv. Theory Simul. 2021, 4, 2100031. [Google Scholar] [CrossRef]
- Douzas, G.; Bacao, F.; Fonseca, J.; Khudinyan, M. Imbalanced learning in land cover classification: Improving minority classes’ prediction accuracy using the geometric SMOTE algorithm. Remote Sens. 2019, 11, 3040. [Google Scholar] [CrossRef]
- Zhang, Y.; Li, X.; Gao, L.; Wang, L.; Wen, L. Imbalanced data fault diagnosis of rotating machinery using synthetic oversampling and feature learning. J. Manuf. Syst. 2018, 48, 34–50. [Google Scholar] [CrossRef]
- Wang, Z.; Wang, H. Global Data Distribution Weighted Synthetic Oversampling Technique for Imbalanced Learning. IEEE Access 2021, 9, 44770–44783. [Google Scholar] [CrossRef]
- Liu, G.; Yang, Y.; Li, B. Fuzzy rule-based oversampling technique for imbalanced and incomplete data learning. Knowl.-Based Syst. 2018, 158, 154–174. [Google Scholar] [CrossRef]
- Wu, X.; Yang, Y.; Ren, L. Entropy difference and kernel-based oversampling technique for imbalanced data learning. Intell. Data Anal. 2020, 24, 1239–1255. [Google Scholar] [CrossRef]
- Engelmann, J.; Lessmann, S. Conditional Wasserstein GAN-based oversampling of tabular data for imbalanced learning. Expert Syst. Appl. 2021, 174, 114582. [Google Scholar] [CrossRef]
- Li, Q.; Li, G.; Niu, W.; Cao, Y.; Chang, L.; Tan, J.; Guo, L. Boosting imbalanced data learning with Wiener process oversampling. Front. Comput. Sci. 2016, 11, 836–851. [Google Scholar] [CrossRef]
- Wang, C.R.; Shao, X.H. An Improving Majority Weighted Minority Oversampling Technique for Imbalanced Classification Problem. IEEE Access 2021, 9, 5069–5082. [Google Scholar] [CrossRef]
- Malhotra, R.; Kamal, S. An empirical study to investigate oversampling methods for improving software defect prediction using imbalanced data. Neurocomputing 2019, 343, 120–140. [Google Scholar] [CrossRef]
- Kovács, G. An empirical comparison and evaluation of minority oversampling techniques on a large number of imbalanced datasets. Appl. Soft Comput. 2019, 83. [Google Scholar] [CrossRef]
- Dhurjad, R.K.; Banait, P.S.S. A survey on Oversampling Techniques for Imbalanced Learning. Int. J. Appl. Innov. Eng. Manag. 2014, 3, 279–284. [Google Scholar]
- Li, J.; Zhu, Q.; Wu, Q.; Fan, Z. A novel oversampling technique for class-imbalanced learning based on SMOTE and natural neighbors. Inf. Sci. 2021, 565, 438–455. [Google Scholar] [CrossRef]
- Jiang, Z.; Pan, T.; Zhang, C.; Yang, J. A new oversampling method based on the classification contribution degree. Symmetry 2021, 13, 194. [Google Scholar] [CrossRef]
- Yao, B. An Improved Under-sampling Imbalanced Classification Algorithm. In Proceedings of the 2021 13th International Conference on Measuring Technology and Mechatronics Automation, ICMTMA 2021, Beihai, China, 16–17 January 2021; pp. 775–779. [Google Scholar]
- Guzmán-Ponce, A.; Valdovinos, R.M.; Sánchez, J.S.; Marcial-Romero, J.R. A new under-sampling method to face class overlap and imbalance. Appl. Sci. 2020, 10, 5164. [Google Scholar] [CrossRef]
- Ester, M.; Kriegel, H.-P.; Sander, J.; Xu, X. A Density-Based Algorithm for Discovering Clusters in Large Spatial Databases with Noise. In Proceedings of the 2nd International Conference on Knowledge Discovery and Data Mining, Portland, OR, USA, 2–4 August 1996; pp. 226–231. [Google Scholar]
- Liu, X.-Y.; Wu, J.; Zhou, Z.-H. Exploratory under-sampling for class-imbalance learning. IEEE Trans. Syst. Man Cybern. Part B Cybern. 2008, 39, 539–550. [Google Scholar]
- Chennuru, V.K.; Timmappareddy, S.R. Simulated annealing based undersampling (SAUS): A hybrid multi-objective optimization method to tackle class imbalance. Appl. Intell. 2021, 1–19. [Google Scholar] [CrossRef]
- Devi, D.; Biswas, S.k.; Purkayastha, B. Redundancy-driven modified Tomek-link based undersampling: A solution to class imbalance. Pattern Recognit. Lett. 2017, 93, 3–12. [Google Scholar] [CrossRef]
- Koziarski, M. Radial-Based Undersampling for imbalanced data classification. Pattern Recognit. 2020, 102, 107262. [Google Scholar] [CrossRef]
- Vuttipittayamongkol, P.; Elyan, E. Overlap-Based Undersampling Method for Classification of Imbalanced Medical Datasets. In IFIP Advances in Information and Communication Technology; Springer: Berlin/Heidelberg, Germany, 2020; Volume 584. [Google Scholar]
- Fan, Q.; Wang, Z.; Gao, D. One-sided Dynamic Undersampling No-Propagation Neural Networks for imbalance problem. Eng. Appl. Artif. Intell. 2016, 53, 62–73. [Google Scholar] [CrossRef]
- Arefeen, M.A.; Nimi, S.T.; Rahman, M.S. Neural Network-Based Undersampling Techniques. IEEE Trans. Syst. Man Cybern. Syst. 2020, 1–10. [Google Scholar] [CrossRef]
- Vuttipittayamongkol, P.; Elyan, E. Neighbourhood-based undersampling approach for handling imbalanced and overlapped data. Inf. Sci. 2020, 509, 47–70. [Google Scholar] [CrossRef]
- Devi, D.; Biswas, S.K.; Purkayastha, B. Learning in presence of class imbalance and class overlapping by using one-class SVM and undersampling technique. Connect. Sci. 2018, 31, 105–142. [Google Scholar] [CrossRef]
- Guo, H.; Diao, X.; Liu, H. Improving undersampling-based ensemble with rotation forest for imbalanced problem. Turk. J. Electr. Eng. Comput. Sci. 2019, 27, 1371–1386. [Google Scholar] [CrossRef]
- Vuttipittayamongkol, P.; Elyan, E. Improved Overlap-based Undersampling for Imbalanced Dataset Classification with Application to Epilepsy and Parkinson’s Disease. Int. J. Neural Syst. 2020, 30. [Google Scholar] [CrossRef]
- Ofek, N.; Rokach, L.; Stern, R.; Shabtai, A. Fast-CBUS: A fast clustering-based undersampling method for addressing the class imbalance problem. Neurocomputing 2017, 243, 88–102. [Google Scholar] [CrossRef]
- García, S.; Herrera, F. Evolutionary undersampling for classification with imbalanced datasets: Proposals and taxonomy. Evol. Comput. 2009, 17, 275–306. [Google Scholar] [CrossRef] [PubMed]
- Guo, H.; Zhou, J.; Wu, C.A. Ensemble learning via constraint projection and undersampling technique for class-imbalance problem. Soft Comput. 2020, 24, 4711–4727. [Google Scholar] [CrossRef]
- Trisanto, D.; Rismawati, N.; Mulya, M.F.; Kurniadi, F.I. Effectiveness undersampling method and feature reduction in credit card fraud detection. Int. J. Intell. Eng. Syst. 2020, 13, 173–181. [Google Scholar] [CrossRef]
- Liu, B.; Tsoumakas, G. Dealing with class imbalance in classifier chains via random undersampling. Knowl.-Based Syst. 2020, 192, 105292. [Google Scholar] [CrossRef]
- Onan, A. Consensus Clustering-Based Undersampling Approach to Imbalanced Learning. Sci. Program. 2019, 2019, 1–14. [Google Scholar] [CrossRef]
- Kaur, P.; Gosain, A. Comparing the behavior of oversampling and undersampling approach of class imbalance learning by combining class imbalance problem with noise. Adv. Intell. Syst. Comput. 2018, 653, 23–30. [Google Scholar]
- Komamizu, T. Combining Multi-ratio Undersampling and Metric Learning for Imbalanced Classification. J. Data Intell. 2021, 2, 462–475. [Google Scholar] [CrossRef]
- Lin, W.C.; Tsai, C.F.; Hu, Y.H.; Jhang, J.S. Clustering-based undersampling in class-imbalanced data. Inf. Sci. 2017, 409–410, 17–26. [Google Scholar] [CrossRef]
- Nugraha, W.; Maulana, M.S.; Sasongko, A. Clustering Based Undersampling for Handling Class Imbalance in C4.5 Classification Algorithm. J. Phys. Conf. Ser. 2020, 1641, 012014. [Google Scholar] [CrossRef]
- Akkasi, A.; Varoğlu, E.; Dimililer, N. Balanced undersampling: A novel sentence-based undersampling method to improve recognition of named entities in chemical and biomedical text. Appl. Intell. 2018, 48, 1965–1978. [Google Scholar] [CrossRef]
- Sarkar, S.; Khatedi, N.; Pramanik, A.; Maiti, J. An Ensemble Learning-Based Undersampling Technique for Handling Class-Imbalance Problem; Springer: Berlin/Heidelberg, Germany, 2020; Volume 605. [Google Scholar]
- Rekha, G.; Reddy, V.K.; Tyagi, A.K. An Earth mover’s distance-based undersampling approach for handling class-imbalanced data. Int. J. Intell. Inf. Database Syst. 2020, 13, 376–392. [Google Scholar]
- Lingden, P.; Alsadoon, A.; Prasad, P.W.; Alsadoon, O.H.; Ali, R.S.; Nguyen, V.T.Q. A novel modified undersampling (MUS) technique for software defect prediction. Comput. Intell. 2019, 35, 1003–1020. [Google Scholar] [CrossRef]
- Devi, D.; Biswas, S.K.; Purkayastha, B. A Review on Solution to Class Imbalance Problem: Undersampling Approaches. In Proceedings of the 2020 International Conference on Computational Performance Evaluation, ComPE 2020, Shillong, India, 2–4 July 2020. [Google Scholar]
- Kang, Q.; Shi, L.; Zhou, M.C.; Wang, X.S.; Wu, Q.D.; Wei, Z. A Distance-Based Weighted Undersampling Scheme for Support Vector Machines and its Application to Imbalanced Classification. IEEE Trans. Neural Netw. Learn. Syst. 2018, 29, 4152–4165. [Google Scholar] [CrossRef]
- Devi, D.; Namasudra, S.; Kadry, S. A boosting-aided adaptive cluster- based undersampling approach for treatment of class imbalance problem. Int. J. Data Warehous. Min. 2020, 16, 60–86. [Google Scholar] [CrossRef]
- Research Group. What Is Colaboratory? Google Inc., 1 October 2021. [Online]. Available online: https://colab.research.google.com/notebooks/intro.ipynb#scrollTo=GJBs_flRovLc (accessed on 5 November 2021).
- Tarawneh, A.S.; Hassanat, A.B.; Celik, C.; Chetverikov, D.; Rahman, M.S.; Verma, C. Deep Face Image Retrieval: A Comparative Study with Dictionary Learning. In Proceedings of the 2019 10th International Conference on Information and Communication Systems (ICICS), Irbid, Jordan, 11–13 June 2019. [Google Scholar]
- Hassanat, A.; Tarawneh, A. Fusion of color and statistic features for enhancing content-based image retrieval systems. J. Theor. Appl. Inf. Technol. 2016, 88, 1–12. [Google Scholar]
- Tarawneh, A.S.; Celik, C.; Hassanat, A.B.; Chetverikov, D. Detailed investigation of deep features with sparse representation and dimensionality reduction in CBIR: A comparative study. Intell. Data Anal. 2020, 24, 47–68. [Google Scholar] [CrossRef]


| ID | Name | No. of Instances | No. of Features | No. of Classes | Imbalance Ratio |
|---|---|---|---|---|---|
| DS1 | Ar1 | 121 | 30 | 2 | 13.4 |
| DS2 | Ar3 | 63 | 30 | 2 | 7.875 |
| DS3 | Ar4 | 107 | 30 | 2 | 5.45 |
| DS4 | Ar5 | 36 | 30 | 2 | 4.5 |
| DS5 | Ar6 | 101 | 30 | 2 | 6.7 |
| DS6 | Kc1 | 2109 | 22 | 2 | 60.5 |
| DS7 | Kc2 | 522 | 22 | 2 | 4.9 |
| DS8 | Pc1 | 1109 | 22 | 2 | 14.4 |
| DS9 | Pc3 | 1563 | 38 | 2 | 9.8 |
| DS10 | Pc4 | 1458 | 38 | 2 | 8.2 |
| DS11 | Australian | 690 | 42 | 2 | 1.25 |
| DS12 | Bank | 1372 | 4 | 2 | 1.25 |
| DS13 | Heart | 270 | 25 | 2 | 1.25 |
| DS14 | Oil-Spill | 937 | 49 | 2 | 21.85 |
| DS15 | Phoneme | 5404 | 5 | 2 | 2.41 |
| DS16 | Apalone19 | 4174 | 8 | 2 | 129.44 |
| DS17 | Apalone9-18 | 731 | 8 | 2 | 16.4 |
| DS18 | Page-blocks0 | 5472 | 11 | 2 | 8.79 |
| DS19 | Pima | 768 | 9 | 2 | 1.87 |
| DS20 | Segment0 | 2308 | 20 | 2 | 6.2 |
| DS21 | Shuttle-c0 | 1829 | 10 | 2 | 13.87 |
| DS22 | Vehicle0 | 846 | 19 | 2 | 3.25 |
| DS23 | Vehicle1 | 846 | 19 | 2 | 2.9 |
| DS24 | Vehicle2 | 846 | 19 | 2 | 2.88 |
| DS25 | Vehicle3 | 846 | 19 | 2 | 2.99 |
| DS26 | Vowe10 | 988 | 14 | 2 | 9.98 |
| DS27 | Wisconsin | 683 | 10 | 2 | 1.86 |
| DS28 | Yeast-1-2-8-9 | 947 | 9 | 2 | 30.57 |
| DS29 | Yeast-1-4-5-8 | 693 | 9 | 2 | 22.1 |
| DS30 | Yeast1 | 1484 | 9 | 2 | 2.46 |
| DS31 | Yeast3 | 1484 | 9 | 2 | 8.1 |
| DS32 | Yeast4 | 1484 | 9 | 2 | 28.1 |
| DS33 | Yeast5 | 1484 | 9 | 2 | 32.73 |
| Property | Value |
|---|---|
| CPU Model Name | Intel (R) Xeon (R) |
| CPU Freq. | 2.30 GHz |
| No. CPU Cores | 2 |
| CPU Family | Haswell |
| Available RAM | 12 GB (upgradable to 26.75 GB) |
| Disk Space | 25 GB |
| #Subsets | Avg. F-Score | #Subsets | Avg. F-Score | Improvement |
|---|---|---|---|---|
| 10 | 0.778 | 100 | 0.798 | 2.0% |
| 20 | 0.785 | 200 | 0.806 | 2.1% |
| 30 | 0.780 | 300 | 0.803 | 2.3% |
| 40 | 0.780 | 400 | 0.802 | 2.2% |
| 50 | 0.781 | 500 | 0.799 | 1.8% |
| 60 | 0.783 | 600 | 0.808 | 2.5% |
| 70 | 0.786 | 700 | 0.809 | 2.3% |
| 80 | 0.782 | 800 | 0.815 | 3.3% |
| 90 | 0.788 | 900 | 0.810 | 2.1% |
| 100 | 0.787 | 1000 | 0.804 | 1.7% |
| Dataset ID | Proposed | EE | SMOTE | ADASYN | SVMSMOTE | Borderline-SMOTE | SMOTEFUNA | |||||||
|---|---|---|---|---|---|---|---|---|---|---|---|---|---|---|
| AVG | ±STD | AVG | ±STD | AVG | ±STD | AVG | ±STD | AVG | ±STD | AVG | ±STD | AVG | ±STD | |
| DS1 | 0.51 | 0.08 | 0.52 | 0.09 | 0.58 | 0.10 | 0.53 | 0.08 | 0.53 | 0.07 | 0.56 | 0.09 | 0.95 | 0.03 |
| DS2 | 0.63 | 0.17 | 0.55 | 0.10 | 0.66 | 0.13 | 0.63 | 0.10 | 0.69 | 0.13 | 0.72 | 0.11 | 0.95 | 0.04 |
| DS3 | 0.69 | 0.05 | 0.59 | 0.07 | 0.56 | 0.08 | 0.58 | 0.05 | 0.65 | 0.06 | 0.59 | 0.07 | 0.90 | 0.04 |
| DS4 | 0.79 | 0.13 | 0.83 | 0.14 | 0.81 | 0.14 | 0.80 | 0.15 | 0.79 | 0.12 | 0.78 | 0.15 | 0.90 | 0.06 |
| DS5 | 0.55 | 0.10 | 0.52 | 0.10 | 0.59 | 0.12 | 0.58 | 0.12 | 0.57 | 0.11 | 0.57 | 0.10 | 0.93 | 0.02 |
| DS6 | 0.75 | 0.02 | 0.99 | 0.00 | 0.92 | 0.02 | 0.92 | 0.02 | 0.91 | 0.02 | 0.92 | 0.02 | 0.99 | 0.00 |
| DS7 | 0.85 | 0.04 | 0.98 | 0.02 | 0.91 | 0.03 | 0.93 | 0.03 | 0.90 | 0.03 | 0.94 | 0.01 | 0.98 | 0.01 |
| DS8 | 0.70 | 0.05 | 0.97 | 0.02 | 0.82 | 0.03 | 0.82 | 0.03 | 0.83 | 0.03 | 0.83 | 0.03 | 0.97 | 0.01 |
| DS9 | 0.63 | 0.02 | 0.58 | 0.03 | 0.63 | 0.02 | 0.62 | 0.02 | 0.66 | 0.02 | 0.65 | 0.03 | 0.94 | 0.01 |
| DS10 | 0.65 | 0.02 | 0.74 | 0.02 | 0.71 | 0.01 | 0.70 | 0.02 | 0.72 | 0.02 | 0.70 | 0.02 | 0.91 | 0.03 |
| DS11 | 0.84 | 0.02 | 0.84 | 0.02 | 0.86 | 0.02 | 0.86 | 0.02 | 0.86 | 0.03 | 0.85 | 0.02 | 0.98 | 0.01 |
| DS12 | 0.95 | 0.01 | 1.00 | 0.00 | 1.00 | 0.00 | 1.00 | 0.00 | 1.00 | 0.00 | 1.00 | 0.00 | 0.87 | 0.01 |
| DS13 | 0.79 | 0.02 | 0.79 | 0.04 | 0.79 | 0.04 | 0.79 | 0.04 | 0.79 | 0.03 | 0.78 | 0.04 | 0.98 | 0.01 |
| DS14 | 0.74 | 0.04 | 0.64 | 0.03 | 0.71 | 0.04 | 0.70 | 0.03 | 0.75 | 0.07 | 0.74 | 0.06 | 0.79 | 0.02 |
| DS15 | 0.75 | 0.01 | 0.78 | 0.01 | 0.79 | 0.01 | 0.77 | 0.01 | 0.78 | 0.01 | 0.77 | 0.01 | 0.98 | 0.00 |
| DS16 | 0.47 | 0.01 | 0.43 | 0.01 | 0.50 | 0.01 | 0.50 | 0.01 | 0.52 | 0.02 | 0.52 | 0.03 | 0.97 | 0.01 |
| DS17 | 0.65 | 0.04 | 0.64 | 0.04 | 0.68 | 0.05 | 0.66 | 0.04 | 0.72 | 0.04 | 0.71 | 0.04 | 0.91 | 0.01 |
| DS18 | 0.84 | 0.01 | 0.86 | 0.01 | 0.87 | 0.01 | 0.83 | 0.01 | 0.85 | 0.01 | 0.85 | 0.02 | 1.00 | 0.00 |
| DS19 | 0.70 | 0.03 | 0.71 | 0.03 | 0.71 | 0.02 | 0.71 | 0.02 | 0.72 | 0.03 | 0.71 | 0.02 | 0.80 | 0.02 |
| DS20 | 0.88 | 0.03 | 0.98 | 0.01 | 0.99 | 0.00 | 0.98 | 0.01 | 0.98 | 0.01 | 0.98 | 0.01 | 0.84 | 0.02 |
| DS21 | 0.99 | 0.01 | 1.00 | 0.01 | 0.99 | 0.01 | 0.99 | 0.00 | 0.99 | 0.00 | 0.99 | 0.00 | 0.97 | 0.01 |
| DS22 | 0.74 | 0.05 | 0.94 | 0.02 | 0.95 | 0.01 | 0.95 | 0.02 | 0.94 | 0.02 | 0.94 | 0.02 | 0.90 | 0.01 |
| DS23 | 0.65 | 0.03 | 0.73 | 0.03 | 0.76 | 0.03 | 0.76 | 0.03 | 0.75 | 0.03 | 0.76 | 0.03 | 1.00 | 0.00 |
| DS24 | 0.80 | 0.02 | 0.95 | 0.01 | 0.97 | 0.01 | 0.96 | 0.01 | 0.96 | 0.01 | 0.96 | 0.01 | 0.99 | 0.00 |
| DS25 | 0.62 | 0.03 | 0.71 | 0.02 | 0.74 | 0.02 | 0.75 | 0.02 | 0.74 | 0.02 | 0.74 | 0.02 | 0.84 | 0.02 |
| DS26 | 0.81 | 0.03 | 0.90 | 0.03 | 1.00 | 0.00 | 1.00 | 0.00 | 1.00 | 0.00 | 1.00 | 0.00 | 0.86 | 0.02 |
| DS27 | 0.96 | 0.01 | 0.97 | 0.01 | 0.97 | 0.01 | 0.97 | 0.01 | 0.97 | 0.01 | 0.97 | 0.01 | 1.00 | 0.00 |
| DS28 | 0.67 | 0.05 | 0.90 | 0.05 | 0.77 | 0.05 | 0.77 | 0.05 | 0.77 | 0.07 | 0.77 | 0.06 | 0.84 | 0.01 |
| DS29 | 0.72 | 0.05 | 0.93 | 0.05 | 0.83 | 0.06 | 0.82 | 0.06 | 0.84 | 0.05 | 0.84 | 0.05 | 0.94 | 0.01 |
| DS30 | 0.65 | 0.03 | 0.72 | 0.02 | 0.69 | 0.02 | 0.67 | 0.02 | 0.69 | 0.02 | 0.67 | 0.02 | 0.96 | 0.01 |
| DS31 | 0.88 | 0.03 | 0.83 | 0.01 | 0.86 | 0.03 | 0.83 | 0.02 | 0.87 | 0.03 | 0.85 | 0.02 | 0.98 | 0.01 |
| DS32 | 0.65 | 0.04 | 0.57 | 0.03 | 0.61 | 0.04 | 0.61 | 0.04 | 0.65 | 0.06 | 0.63 | 0.05 | 1.00 | 0.00 |
| DS33 | 0.74 | 0.03 | 0.73 | 0.02 | 0.82 | 0.03 | 0.82 | 0.03 | 0.80 | 0.04 | 0.82 | 0.04 | 0.98 | 0.01 |
| Average | 0.74 | 0.04 | 0.78 | 0.03 | 0.79 | 0.04 | 0.78 | 0.03 | 0.79 | 0.04 | 0.79 | 0.04 | 0.94 | 0.04 |
| Dataset ID | Proposed | EE | SMOTE | ADASYN | SVMSMOTE | Borderline-SMOTE | SMOTEFUNA | |||||||
|---|---|---|---|---|---|---|---|---|---|---|---|---|---|---|
| AVG | ±STD | AVG | ±STD | AVG | ±STD | AVG | ±STD | AVG | ±STD | AVG | ±STD | AVG | ±STD | |
| DS1 | 0.45 | 0.05 | 0.51 | 0.08 | 0.41 | 0.07 | 0.41 | 0.07 | 0.43 | 0.08 | 0.42 | 0.07 | 0.89 | 0.04 |
| DS2 | 0.77 | 0.13 | 0.57 | 0.11 | 0.77 | 0.12 | 0.72 | 0.14 | 0.79 | 0.13 | 0.78 | 0.12 | 0.94 | 0.07 |
| DS3 | 0.68 | 0.09 | 0.64 | 0.04 | 0.67 | 0.09 | 0.68 | 0.06 | 0.68 | 0.08 | 0.66 | 0.07 | 0.90 | 0.04 |
| DS4 | 0.67 | 0.15 | 0.69 | 0.17 | 0.66 | 0.14 | 0.67 | 0.16 | 0.67 | 0.16 | 0.67 | 0.16 | 0.90 | 0.06 |
| DS5 | 0.55 | 0.09 | 0.49 | 0.07 | 0.61 | 0.13 | 0.63 | 0.12 | 0.59 | 0.12 | 0.61 | 0.11 | 0.88 | 0.03 |
| DS6 | 0.89 | 0.04 | 1.00 | 0.00 | 0.75 | 0.02 | 0.73 | 0.02 | 0.72 | 0.02 | 0.74 | 0.02 | 0.92 | 0.01 |
| DS7 | 0.83 | 0.03 | 0.98 | 0.01 | 0.73 | 0.03 | 0.73 | 0.05 | 0.71 | 0.04 | 0.73 | 0.04 | 0.90 | 0.02 |
| DS8 | 0.88 | 0.06 | 0.96 | 0.02 | 0.70 | 0.04 | 0.70 | 0.04 | 0.70 | 0.04 | 0.70 | 0.04 | 0.97 | 0.01 |
| DS9 | 0.62 | 0.03 | 0.60 | 0.02 | 0.37 | 0.13 | 0.32 | 0.11 | 0.57 | 0.06 | 0.46 | 0.12 | 0.93 | 0.01 |
| DS10 | 0.68 | 0.02 | 0.74 | 0.02 | 0.68 | 0.04 | 0.68 | 0.03 | 0.65 | 0.05 | 0.68 | 0.04 | 0.90 | 0.01 |
| DS11 | 0.85 | 0.01 | 0.83 | 0.02 | 0.74 | 0.07 | 0.72 | 0.07 | 0.72 | 0.07 | 0.73 | 0.07 | 0.97 | 0.01 |
| DS12 | 0.89 | 0.03 | 1.00 | 0.00 | 0.85 | 0.02 | 0.85 | 0.02 | 0.84 | 0.02 | 0.84 | 0.02 | 0.79 | 0.01 |
| DS13 | 0.80 | 0.04 | 0.79 | 0.02 | 0.81 | 0.06 | 0.82 | 0.07 | 0.80 | 0.06 | 0.80 | 0.06 | 0.94 | 0.01 |
| DS14 | 0.65 | 0.03 | 0.64 | 0.04 | 0.22 | 0.08 | 0.21 | 0.08 | 0.37 | 0.10 | 0.31 | 0.12 | 0.42 | 0.01 |
| DS15 | 0.76 | 0.01 | 0.78 | 0.01 | 0.69 | 0.01 | 0.67 | 0.01 | 0.68 | 0.01 | 0.67 | 0.01 | 0.95 | 0.00 |
| DS16 | 0.47 | 0.03 | 0.43 | 0.01 | 0.36 | 0.01 | 0.37 | 0.01 | 0.41 | 0.04 | 0.40 | 0.05 | 0.98 | 0.01 |
| DS17 | 0.58 | 0.03 | 0.64 | 0.05 | 0.49 | 0.03 | 0.48 | 0.03 | 0.53 | 0.03 | 0.50 | 0.03 | 0.73 | 0.01 |
| DS18 | 0.84 | 0.01 | 0.87 | 0.01 | 0.73 | 0.02 | 0.77 | 0.01 | 0.71 | 0.02 | 0.76 | 0.02 | 0.94 | 0.01 |
| DS19 | 0.69 | 0.03 | 0.74 | 0.03 | 0.73 | 0.03 | 0.73 | 0.02 | 0.73 | 0.03 | 0.74 | 0.03 | 0.79 | 0.02 |
| DS20 | 0.91 | 0.02 | 0.98 | 0.01 | 0.75 | 0.03 | 0.71 | 0.02 | 0.71 | 0.03 | 0.73 | 0.04 | 0.79 | 0.10 |
| DS21 | 0.99 | 0.01 | 1.00 | 0.00 | 0.99 | 0.01 | 0.99 | 0.01 | 0.99 | 0.01 | 0.99 | 0.01 | 0.80 | 0.02 |
| DS22 | 0.73 | 0.04 | 0.92 | 0.01 | 0.64 | 0.03 | 0.60 | 0.03 | 0.62 | 0.03 | 0.61 | 0.03 | 0.79 | 0.01 |
| DS23 | 0.67 | 0.03 | 0.71 | 0.02 | 0.63 | 0.03 | 0.60 | 0.03 | 0.62 | 0.03 | 0.59 | 0.03 | 1.00 | 0.00 |
| DS24 | 0.90 | 0.04 | 0.95 | 0.01 | 0.73 | 0.04 | 0.71 | 0.03 | 0.73 | 0.06 | 0.78 | 0.05 | 0.94 | 0.01 |
| DS25 | 0.64 | 0.04 | 0.70 | 0.03 | 0.62 | 0.03 | 0.62 | 0.03 | 0.61 | 0.03 | 0.61 | 0.04 | 0.69 | 0.02 |
| DS26 | 0.85 | 0.03 | 0.91 | 0.02 | 0.76 | 0.03 | 0.77 | 0.06 | 0.77 | 0.03 | 0.77 | 0.04 | 0.72 | 0.04 |
| DS27 | 0.96 | 0.01 | 0.96 | 0.01 | 0.96 | 0.01 | 0.95 | 0.02 | 0.95 | 0.01 | 0.95 | 0.02 | 0.84 | 0.02 |
| DS28 | 0.91 | 0.06 | 0.90 | 0.03 | 0.88 | 0.06 | 0.88 | 0.06 | 0.89 | 0.05 | 0.88 | 0.05 | 0.70 | 0.02 |
| DS29 | 0.94 | 0.05 | 0.94 | 0.04 | 0.85 | 0.06 | 0.85 | 0.07 | 0.88 | 0.08 | 0.86 | 0.07 | 0.69 | 0.01 |
| DS30 | 0.65 | 0.03 | 0.71 | 0.02 | 0.27 | 0.01 | 0.26 | 0.01 | 0.26 | 0.01 | 0.27 | 0.01 | 0.71 | 0.02 |
| DS31 | 0.88 | 0.02 | 0.82 | 0.03 | 0.27 | 0.09 | 0.21 | 0.07 | 0.23 | 0.08 | 0.21 | 0.07 | 0.99 | 0.00 |
| DS32 | 0.64 | 0.04 | 0.58 | 0.03 | 0.15 | 0.05 | 0.14 | 0.06 | 0.23 | 0.09 | 0.18 | 0.08 | 0.95 | 0.00 |
| DS33 | 0.80 | 0.04 | 0.71 | 0.02 | 0.50 | 0.03 | 0.49 | 0.03 | 0.42 | 0.06 | 0.49 | 0.03 | 0.79 | 0.02 |
| Average | 0.76 | 0.04 | 0.78 | 0.03 | 0.63 | 0.05 | 0.63 | 0.05 | 0.64 | 0.05 | 0.64 | 0.05 | 0.85 | 0.05 |
| Dataset ID | Proposed | EE | SMOTE | ADASYN | SVMSMOTE | Borderline-SMOTE | SMOTEFUNA | |||||||
|---|---|---|---|---|---|---|---|---|---|---|---|---|---|---|
| AVG | ±STD | AVG | ±STD | AVG | ±STD | AVG | ±STD | AVG | ±STD | AVG | ±STD | AVG | ±STD | |
| DS1 | 0.58 | 0.08 | 0.50 | 0.08 | 0.52 | 0.09 | 0.56 | 0.15 | 0.56 | 0.10 | 0.54 | 0.10 | 0.93 | 0.04 |
| DS2 | 0.74 | 0.08 | 0.56 | 0.11 | 0.70 | 0.14 | 0.66 | 0.10 | 0.70 | 0.15 | 0.67 | 0.14 | 0.89 | 0.05 |
| DS3 | 0.68 | 0.11 | 0.64 | 0.06 | 0.62 | 0.08 | 0.61 | 0.06 | 0.63 | 0.07 | 0.63 | 0.09 | 0.87 | 0.04 |
| DS4 | 0.68 | 0.17 | 0.76 | 0.20 | 0.69 | 0.21 | 0.63 | 0.16 | 0.63 | 0.25 | 0.58 | 0.17 | 0.88 | 0.04 |
| DS5 | 0.54 | 0.12 | 0.53 | 0.10 | 0.54 | 0.07 | 0.53 | 0.08 | 0.53 | 0.06 | 0.55 | 0.08 | 0.87 | 0.02 |
| DS6 | 0.99 | 0.01 | 1.00 | 0.00 | 1.00 | 0.00 | 1.00 | 0.00 | 0.99 | 0.01 | 1.00 | 0.00 | 1.00 | 0.00 |
| DS7 | 0.97 | 0.01 | 0.98 | 0.01 | 0.97 | 0.01 | 0.96 | 0.02 | 0.95 | 0.02 | 0.97 | 0.02 | 0.99 | 0.01 |
| DS8 | 0.98 | 0.01 | 0.97 | 0.01 | 0.99 | 0.01 | 0.99 | 0.01 | 0.98 | 0.01 | 0.99 | 0.01 | 1.00 | 0.00 |
| DS9 | 0.63 | 0.03 | 0.58 | 0.02 | 0.61 | 0.02 | 0.62 | 0.03 | 0.63 | 0.02 | 0.62 | 0.02 | 0.91 | 0.01 |
| DS10 | 0.64 | 0.02 | 0.74 | 0.02 | 0.73 | 0.03 | 0.72 | 0.05 | 0.73 | 0.02 | 0.71 | 0.03 | 0.93 | 0.02 |
| DS11 | 0.86 | 0.02 | 0.84 | 0.02 | 0.81 | 0.03 | 0.81 | 0.02 | 0.82 | 0.02 | 0.81 | 0.02 | 0.96 | 0.01 |
| DS12 | 0.92 | 0.01 | 1.00 | 0.00 | 0.98 | 0.01 | 0.98 | 0.01 | 0.98 | 0.01 | 0.98 | 0.01 | 0.89 | 0.01 |
| DS13 | 0.77 | 0.06 | 0.81 | 0.05 | 0.74 | 0.05 | 0.76 | 0.04 | 0.74 | 0.04 | 0.73 | 0.03 | 0.96 | 0.01 |
| DS14 | 0.65 | 0.04 | 0.60 | 0.04 | 0.64 | 0.05 | 0.63 | 0.06 | 0.64 | 0.05 | 0.63 | 0.04 | 0.74 | 0.01 |
| DS15 | 0.72 | 0.01 | 0.78 | 0.01 | 0.83 | 0.01 | 0.83 | 0.01 | 0.84 | 0.01 | 0.83 | 0.02 | 0.98 | 0.00 |
| DS16 | 0.49 | 0.01 | 0.43 | 0.01 | 0.51 | 0.02 | 0.51 | 0.02 | 0.50 | 0.01 | 0.50 | 0.01 | 1.00 | 0.00 |
| DS17 | 0.61 | 0.06 | 0.63 | 0.04 | 0.63 | 0.04 | 0.61 | 0.08 | 0.62 | 0.06 | 0.62 | 0.04 | 0.92 | 0.00 |
| DS18 | 0.80 | 0.03 | 0.88 | 0.01 | 0.91 | 0.01 | 0.90 | 0.01 | 0.91 | 0.01 | 0.90 | 0.01 | 0.99 | 0.00 |
| DS19 | 0.70 | 0.04 | 0.71 | 0.02 | 0.67 | 0.02 | 0.64 | 0.03 | 0.66 | 0.04 | 0.65 | 0.02 | 0.74 | 0.01 |
| DS20 | 0.93 | 0.03 | 0.98 | 0.01 | 0.98 | 0.00 | 0.99 | 0.01 | 0.98 | 0.01 | 0.99 | 0.01 | 0.77 | 0.05 |
| DS21 | 1.00 | 0.00 | 1.00 | 0.00 | 1.00 | 0.00 | 1.00 | 0.00 | 1.00 | 0.00 | 1.00 | 0.00 | 0.94 | 0.01 |
| DS22 | 0.76 | 0.04 | 0.93 | 0.02 | 0.90 | 0.03 | 0.89 | 0.03 | 0.90 | 0.03 | 0.89 | 0.03 | 0.91 | 0.01 |
| DS23 | 0.61 | 0.02 | 0.70 | 0.03 | 0.69 | 0.02 | 0.67 | 0.02 | 0.66 | 0.04 | 0.65 | 0.01 | 1.00 | 0.00 |
| DS24 | 0.86 | 0.03 | 0.95 | 0.02 | 0.93 | 0.02 | 0.94 | 0.02 | 0.94 | 0.02 | 0.93 | 0.02 | 0.98 | 0.01 |
| DS25 | 0.62 | 0.01 | 0.71 | 0.04 | 0.68 | 0.03 | 0.69 | 0.04 | 0.66 | 0.04 | 0.67 | 0.03 | 0.81 | 0.02 |
| DS26 | 0.85 | 0.02 | 0.91 | 0.03 | 0.94 | 0.03 | 0.94 | 0.02 | 0.92 | 0.02 | 0.92 | 0.02 | 0.85 | 0.02 |
| DS27 | 0.94 | 0.02 | 0.95 | 0.01 | 0.94 | 0.02 | 0.94 | 0.02 | 0.93 | 0.02 | 0.94 | 0.02 | 0.98 | 0.01 |
| DS28 | 0.97 | 0.04 | 0.92 | 0.05 | 1.00 | 0.01 | 1.00 | 0.01 | 1.00 | 0.01 | 1.00 | 0.01 | 0.80 | 0.02 |
| DS29 | 0.98 | 0.03 | 0.92 | 0.06 | 0.99 | 0.01 | 0.99 | 0.01 | 0.99 | 0.02 | 0.99 | 0.01 | 0.94 | 0.01 |
| DS30 | 0.65 | 0.02 | 0.72 | 0.02 | 0.66 | 0.03 | 0.66 | 0.03 | 0.66 | 0.02 | 0.66 | 0.02 | 0.95 | 0.01 |
| DS31 | 0.80 | 0.02 | 0.82 | 0.04 | 0.84 | 0.02 | 0.83 | 0.01 | 0.84 | 0.02 | 0.83 | 0.02 | 1.00 | 0.00 |
| DS32 | 0.65 | 0.03 | 0.56 | 0.03 | 0.62 | 0.06 | 0.63 | 0.04 | 0.60 | 0.04 | 0.62 | 0.03 | 0.99 | 0.00 |
| DS33 | 0.73 | 0.05 | 0.73 | 0.05 | 0.81 | 0.07 | 0.82 | 0.05 | 0.79 | 0.05 | 0.82 | 0.03 | 0.96 | 0.02 |
| Average | 0.77 | 0.04 | 0.78 | 0.04 | 0.79 | 0.04 | 0.79 | 0.04 | 0.79 | 0.04 | 0.78 | 0.03 | 0.92 | 0.04 |
| Dataset ID | Proposed | EE | SMOTE | ADASYN | SVMSMOTE | Borderline-SMOTE | SMOTEFUNA | |||||||
|---|---|---|---|---|---|---|---|---|---|---|---|---|---|---|
| AVG | ±STD | AVG | ±STD | AVG | ±STD | AVG | ±STD | AVG | ±STD | AVG | ±STD | AVG | ±STD | |
| DS1 | 0.47 | 0.07 | 0.50 | 0.09 | 0.52 | 0.09 | 0.52 | 0.09 | 0.57 | 0.11 | 0.54 | 0.10 | 0.95 | 0.03 |
| DS2 | 0.75 | 0.15 | 0.62 | 0.10 | 0.65 | 0.08 | 0.62 | 0.10 | 0.72 | 0.13 | 0.73 | 0.11 | 0.93 | 0.05 |
| DS3 | 0.69 | 0.07 | 0.68 | 0.06 | 0.59 | 0.08 | 0.60 | 0.05 | 0.66 | 0.07 | 0.62 | 0.07 | 0.90 | 0.04 |
| DS4 | 0.78 | 0.15 | 0.78 | 0.15 | 0.76 | 0.14 | 0.76 | 0.14 | 0.81 | 0.17 | 0.77 | 0.15 | 0.88 | 0.05 |
| DS5 | 0.61 | 0.15 | 0.56 | 0.05 | 0.65 | 0.09 | 0.65 | 0.10 | 0.65 | 0.10 | 0.64 | 0.09 | 0.91 | 0.02 |
| DS6 | 0.77 | 0.02 | 0.99 | 0.01 | 0.90 | 0.01 | 0.90 | 0.01 | 0.89 | 0.01 | 0.89 | 0.01 | 0.97 | 0.01 |
| DS7 | 0.86 | 0.04 | 0.99 | 0.01 | 0.92 | 0.03 | 0.92 | 0.02 | 0.92 | 0.03 | 0.92 | 0.02 | 0.98 | 0.01 |
| DS8 | 0.72 | 0.03 | 0.97 | 0.02 | 0.79 | 0.04 | 0.78 | 0.03 | 0.79 | 0.04 | 0.79 | 0.04 | 0.98 | 0.01 |
| DS9 | 0.62 | 0.02 | 0.59 | 0.02 | 0.62 | 0.02 | 0.61 | 0.02 | 0.64 | 0.03 | 0.63 | 0.03 | 0.93 | 0.01 |
| DS10 | 0.60 | 0.03 | 0.74 | 0.03 | 0.69 | 0.03 | 0.68 | 0.03 | 0.69 | 0.03 | 0.69 | 0.03 | 0.90 | 0.02 |
| DS11 | 0.86 | 0.02 | 0.85 | 0.02 | 0.82 | 0.02 | 0.80 | 0.02 | 0.81 | 0.02 | 0.81 | 0.01 | 0.98 | 0.01 |
| DS12 | 0.94 | 0.02 | 1.00 | 0.00 | 1.00 | 0.00 | 1.00 | 0.00 | 1.00 | 0.00 | 1.00 | 0.00 | 0.91 | 0.01 |
| DS13 | 0.80 | 0.03 | 0.79 | 0.05 | 0.77 | 0.04 | 0.75 | 0.03 | 0.76 | 0.02 | 0.76 | 0.02 | 0.98 | 0.00 |
| DS14 | 0.68 | 0.04 | 0.61 | 0.02 | 0.68 | 0.05 | 0.69 | 0.04 | 0.71 | 0.06 | 0.71 | 0.05 | 0.76 | 0.01 |
| DS15 | 0.75 | 0.01 | 0.78 | 0.01 | 0.85 | 0.01 | 0.84 | 0.01 | 0.85 | 0.01 | 0.84 | 0.01 | 0.98 | 0.00 |
| DS16 | 0.46 | 0.01 | 0.44 | 0.02 | 0.52 | 0.02 | 0.52 | 0.02 | 0.51 | 0.02 | 0.51 | 0.02 | 0.94 | 0.01 |
| DS17 | 0.61 | 0.04 | 0.62 | 0.03 | 0.64 | 0.04 | 0.64 | 0.03 | 0.66 | 0.04 | 0.66 | 0.04 | 0.92 | 0.01 |
| DS18 | 0.78 | 0.01 | 0.88 | 0.01 | 0.92 | 0.01 | 0.90 | 0.01 | 0.92 | 0.01 | 0.92 | 0.01 | 1.00 | 0.00 |
| DS19 | 0.72 | 0.03 | 0.74 | 0.03 | 0.66 | 0.03 | 0.66 | 0.03 | 0.67 | 0.04 | 0.67 | 0.03 | 0.78 | 0.02 |
| DS20 | 0.60 | 0.03 | 0.99 | 0.00 | 0.97 | 0.01 | 0.97 | 0.01 | 0.96 | 0.01 | 0.98 | 0.00 | 0.82 | 0.03 |
| DS21 | 1.00 | 0.01 | 1.00 | 0.00 | 1.00 | 0.00 | 1.00 | 0.00 | 1.00 | 0.00 | 1.00 | 0.00 | 0.93 | 0.01 |
| DS22 | 0.68 | 0.02 | 0.93 | 0.01 | 0.88 | 0.02 | 0.88 | 0.02 | 0.88 | 0.02 | 0.88 | 0.02 | 0.91 | 0.01 |
| DS23 | 0.59 | 0.02 | 0.71 | 0.02 | 0.67 | 0.02 | 0.67 | 0.02 | 0.67 | 0.02 | 0.67 | 0.02 | 1.00 | 0.00 |
| DS24 | 0.69 | 0.05 | 0.96 | 0.01 | 0.92 | 0.01 | 0.92 | 0.01 | 0.91 | 0.01 | 0.92 | 0.01 | 0.98 | 0.00 |
| DS25 | 0.61 | 0.02 | 0.71 | 0.03 | 0.66 | 0.01 | 0.67 | 0.02 | 0.67 | 0.02 | 0.66 | 0.02 | 0.77 | 0.02 |
| DS26 | 0.80 | 0.02 | 0.90 | 0.03 | 1.00 | 0.00 | 1.00 | 0.00 | 1.00 | 0.00 | 1.00 | 0.00 | 0.83 | 0.02 |
| DS27 | 0.97 | 0.01 | 0.96 | 0.01 | 0.97 | 0.01 | 0.96 | 0.01 | 0.96 | 0.01 | 0.96 | 0.01 | 1.00 | 0.00 |
| DS28 | 0.66 | 0.05 | 0.91 | 0.05 | 0.72 | 0.05 | 0.71 | 0.04 | 0.73 | 0.05 | 0.74 | 0.06 | 0.77 | 0.03 |
| DS29 | 0.65 | 0.03 | 0.93 | 0.04 | 0.75 | 0.05 | 0.74 | 0.04 | 0.80 | 0.05 | 0.80 | 0.03 | 0.93 | 0.01 |
| DS30 | 0.60 | 0.03 | 0.71 | 0.02 | 0.66 | 0.03 | 0.64 | 0.03 | 0.66 | 0.03 | 0.65 | 0.03 | 0.95 | 0.00 |
| DS31 | 0.84 | 0.03 | 0.81 | 0.02 | 0.83 | 0.01 | 0.83 | 0.02 | 0.83 | 0.02 | 0.83 | 0.02 | 0.95 | 0.01 |
| DS32 | 0.64 | 0.03 | 0.56 | 0.02 | 0.61 | 0.03 | 0.61 | 0.03 | 0.61 | 0.04 | 0.61 | 0.05 | 0.99 | 0.00 |
| DS33 | 0.72 | 0.05 | 0.70 | 0.04 | 0.77 | 0.05 | 0.77 | 0.05 | 0.77 | 0.05 | 0.77 | 0.05 | 0.96 | 0.01 |
| Average | 0.71 | 0.04 | 0.79 | 0.03 | 0.77 | 0.03 | 0.76 | 0.03 | 0.78 | 0.04 | 0.77 | 0.04 | 0.92 | 0.04 |
Publisher’s Note: MDPI stays neutral with regard to jurisdictional claims in published maps and institutional affiliations. |
© 2022 by the authors. Licensee MDPI, Basel, Switzerland. This article is an open access article distributed under the terms and conditions of the Creative Commons Attribution (CC BY) license (https://creativecommons.org/licenses/by/4.0/).
Share and Cite
Hassanat, A.B.; Tarawneh, A.S.; Abed, S.S.; Altarawneh, G.A.; Alrashidi, M.; Alghamdi, M. RDPVR: Random Data Partitioning with Voting Rule for Machine Learning from Class-Imbalanced Datasets. Electronics 2022, 11, 228. https://doi.org/10.3390/electronics11020228
Hassanat AB, Tarawneh AS, Abed SS, Altarawneh GA, Alrashidi M, Alghamdi M. RDPVR: Random Data Partitioning with Voting Rule for Machine Learning from Class-Imbalanced Datasets. Electronics. 2022; 11(2):228. https://doi.org/10.3390/electronics11020228
Chicago/Turabian StyleHassanat, Ahmad B., Ahmad S. Tarawneh, Samer Subhi Abed, Ghada Awad Altarawneh, Malek Alrashidi, and Mansoor Alghamdi. 2022. "RDPVR: Random Data Partitioning with Voting Rule for Machine Learning from Class-Imbalanced Datasets" Electronics 11, no. 2: 228. https://doi.org/10.3390/electronics11020228
APA StyleHassanat, A. B., Tarawneh, A. S., Abed, S. S., Altarawneh, G. A., Alrashidi, M., & Alghamdi, M. (2022). RDPVR: Random Data Partitioning with Voting Rule for Machine Learning from Class-Imbalanced Datasets. Electronics, 11(2), 228. https://doi.org/10.3390/electronics11020228