Article

Techno-Economic Evaluation of 5G Technology for Automated Guided Vehicles in Production

1
WZL|RWTH Aachen University, Campus-Boulevard 30, 52074 Aachen, Germany
2
Fraunhofer Institute for Production Technology IPT, 52074 Aachen, Germany
3
Institute for Industrial Management FIR|RWTH Aachen University, Campus-Boulevard 55, 52074 Aachen, Germany
*
Author to whom correspondence should be addressed.
Electronics 2022, 11(2), 192; https://doi.org/10.3390/electronics11020192
Submission received: 9 December 2021 / Revised: 7 January 2022 / Accepted: 7 January 2022 / Published: 9 January 2022
(This article belongs to the Special Issue 5G Technology in Smart Manufacturing)

Abstract

:
The fifth generation of mobile communication (5G) is expected to bring immense benefits to automated guided vehicles by improving existing respectively enabling 5G-distinctive network control systems, leading to higher productivity and safety. However, only 1% of production companies have fully deployed 5G yet. Most companies currently lack an understanding of return on investment and of technical use-case benefits. Therefore, this paper analyses the influence of 5G on an automated guided vehicle use case based on a five-step evaluation model. The analysis is conducted with a use case in the Digital Experience Factory in Aachen. It shows a difference of net present value between 4G and 5G of 1.3 M€ after 10 years and a difference of return of investment of 66%. Furthermore, analysis shows an increase of mobility (13%), productivity (20%) and safety (136%). This indicates a noticeable improvement of a 5G-controlled automated guided vehicle compared to a 4G-controlled automated guided vehicle.

1. Introduction & Motivation

Human labor is increasingly being replaced by machines and robots. Future production systems demand efficient and dynamic transportation of goods on the shop-floor level to increase flexibility [1]. Therefore, automated guided vehicles (AGVs) are considered as one of the key enablers for various use cases in the intralogistics on the shopfloor [2]. Despite the expected improvements and cost reductions promised by AGVs, there are still open research gaps that need to be addressed to achieve the promised productivity gains by replacing logistic solutions such as forklifts in the areas of safety or time-critical processes.
The fifth generation of mobile communication (5G, 5G technology) is expected to have immense benefits for AGVs by improving existing respectively enabling 5G-distinctive network control systems (NCS). Depending on the use case, enabling centralized-controlled AGVs without predefined routes, the productivity of AGV is expected to increase as higher speeds are enabled. Furthermore, due to lower latencies of the NCS and thus faster reaction times, safety is expected to increase as well. However, despite the expected benefits of 5G technology, the current deployment state of 5G in production companies is relatively low. A joint study of MHP and Ludwig Maximilian University shows that only 1% of companies have fully deployed 5G yet, 13% are using 5G partially [3] and 39% of companies are not planning to deploy 5G at all.
The biggest barriers of 5G deployment in production according to the Digital Catapult UK manufacturing survey [4] are a lack of understanding of the return on investment (RoI), mentioned by 72%, and a lack of technical use case understanding, mentioned by 44%. To tackle this barrier, the paper conducts both a technical and economic analysis of the influence of 5G technology on AGVs in production. Section 2 introduces relevant fundamentals. Section 3 presents the evaluation model being used for the techno-economic analysis. Section 4 applies the model to an AGV use case at the Digital Experience Factory in Aachen. Section 5 discusses the results of Section 4. Finally, Section 6 summarizes the results and gives an outlook of the next steps. The Appendix A provides an overview of abbreviations and formula symbols (Table A1 and Table A2).

2. Fundamentals

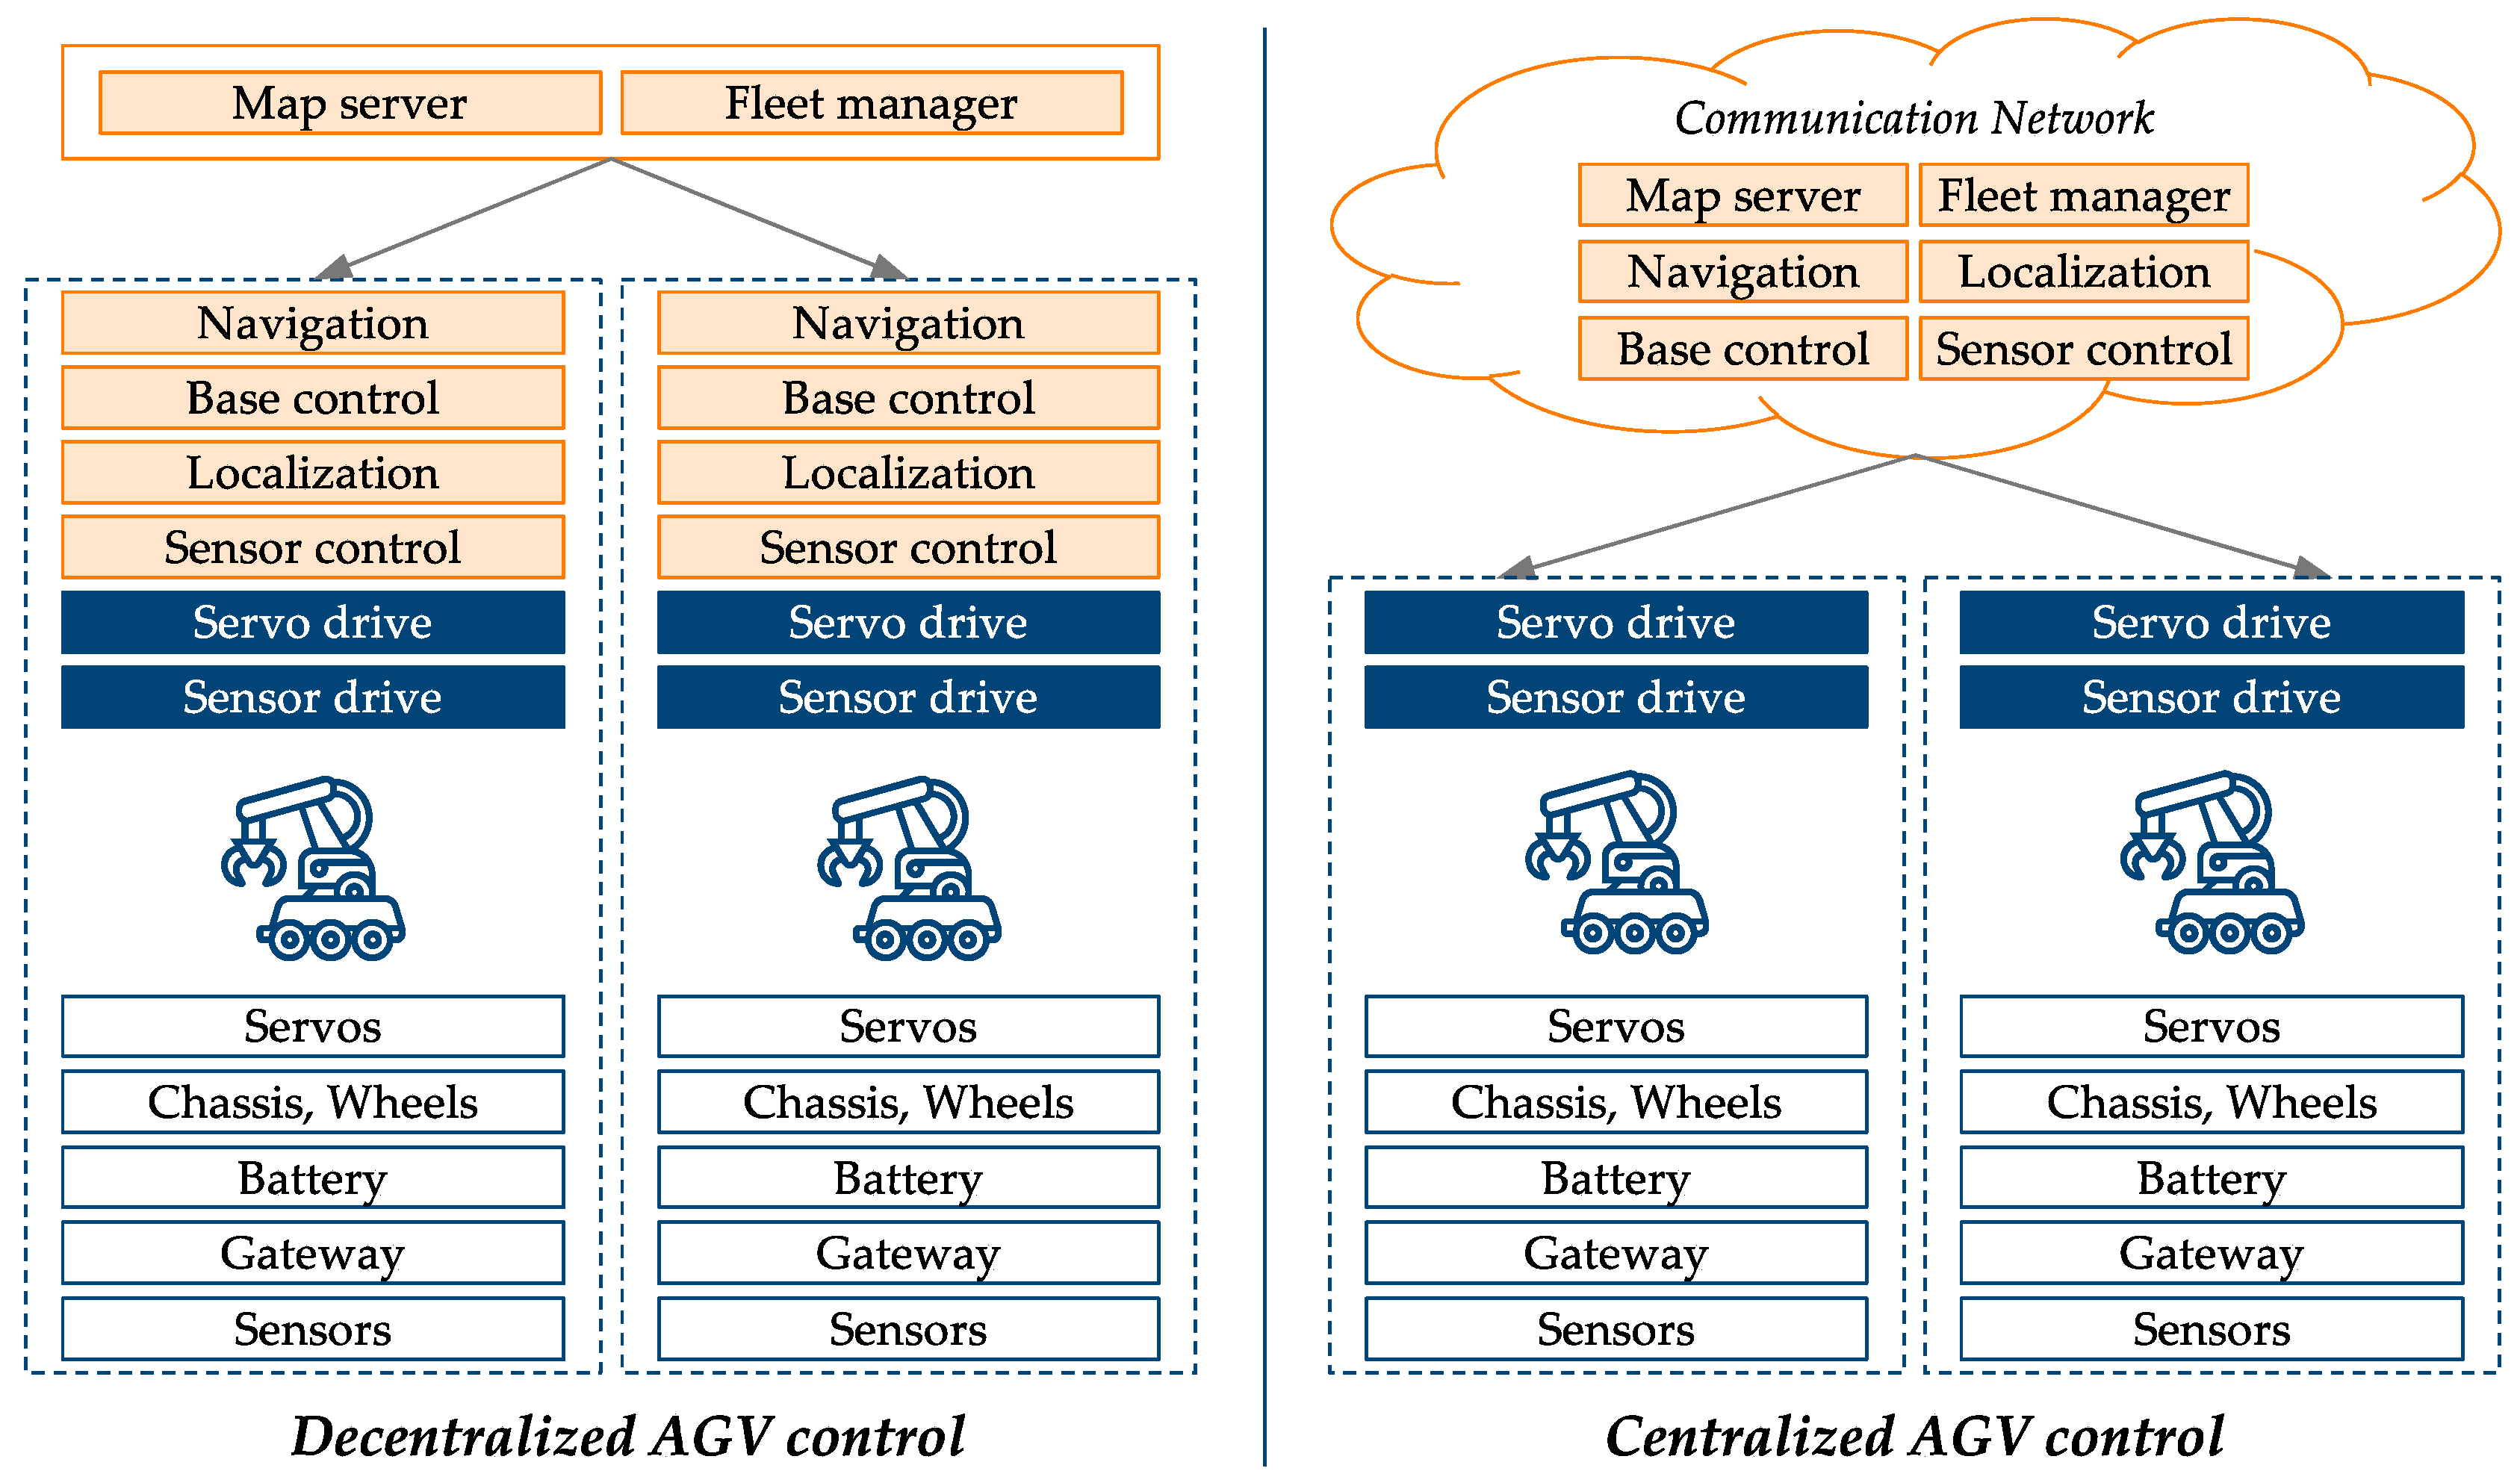
2.1. Automated Guided Vehicles (AGVs) in Production

In the last few years, logistic and intralogistics tasks have increasingly been replaced by either drones or AGVs, promising a high potential for logistic tasks [5,6]. AGVs are unmanned transport vehicles substituting manned transport system like trucks or conveyors [7]. Their task is to pick up and deliver objects inside the factory [8]. In order to work in an integrated manner with the factory environment, a reliable and fast communication between AGVs, machines and operators is very important so as to control the AGV and secure a safe and error-free factory environment [9].
Depending on the application, a distinction is made between a centralized or decentralized architecture, as shown in Figure 1. A centralized architecture is characterized by AGVs equipped with onboard slave controllers collecting information from the sensors and physical inputs. These slave controllers are connected to the actuators and a virtual master controller, which is running a server as well as processing all information [7]. The master controller takes the control decisions and sends them back to the slave controller, whereas a decentralized architecture consists of AGVs each equipped with internal controllers making decisions and processing all data [10]. These internal controllers are used to command the actuators by leveraging the AGV sensor information [7]. Which architecture is considered appropriate depends on both the use case and the existing infrastructure in the factory [11]. Currently, most AGVs are equipped with internal controllers (decentralized architecture), to minimize the latency in decision making [9].
However, since many logistic processes are becoming more modular, flexible and interoperable rather than static and predictable the challenge of coordinating multiple AGVs arises [12]. With a decentralized architecture, there are significant drawbacks when controlling multiple AGVs simultaneously, as scalability and communication between the individual AGVs proves to be significantly more difficult. Centralized approaches support the design of more sophisticated control algorithms by reducing the complexity of coding as well as flexible and reconfigurable factories—as a result redundancy is reduced, costs are saved, scalability is increased, and energy consumption is reduced [7].
To realize advantages of centralized AGV control, the networked control system (Section 2.2) and, especially, the communication technology must fulfill higher requirements than for decentralized AGV control [13]. To meet the requirements of typical applications on the shop-floor level a permanent availability of the communication between slave and master controller is key. Furthermore, a network must ensure low latencies to enable fast reactions of the AGV, as further explained in Section 2.3 [7]. This also requires a high network reliability and handover speed. While using the AGV, safety is the key issue to ensure, and by doing so limited data transmission during handover between cells must be avoided. The reliability and handover speed requirements for using many AGVs preclude Wi-Fi solutions as not feasible, since the communication security is insufficient, and the handover speed (500 ms) is not seamless and thus not viable. Existing feasible communications technologies to control AGVs are 4G and 5G, which are further considered in Section 2.4 [14].

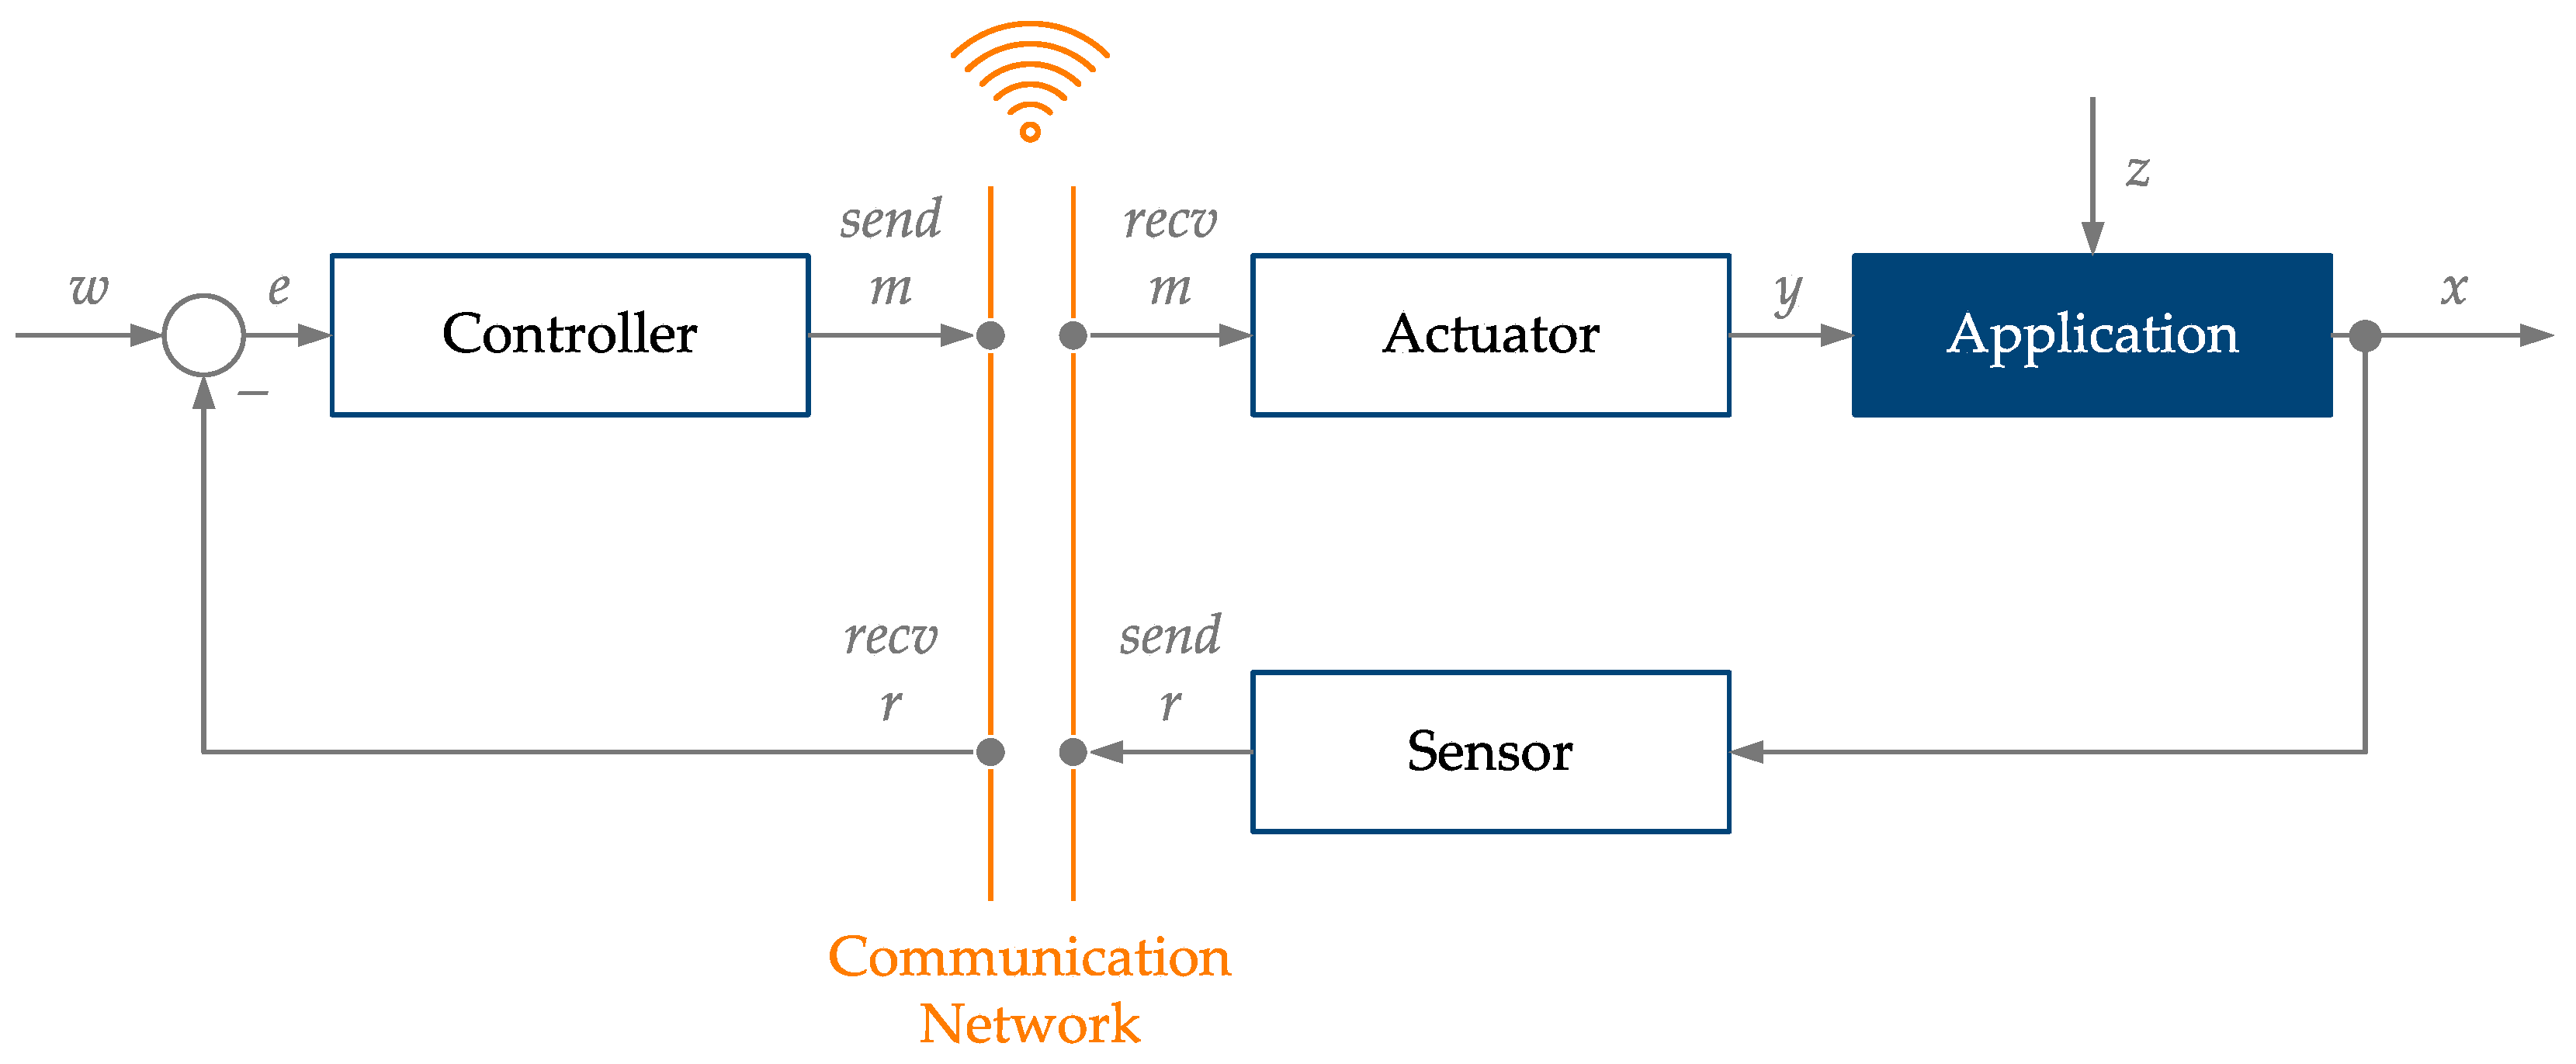
2.2. Networked Control System

To realize AGVs on the shopfloor, wireless communication is required. Wireless communication has several technical advantages. It enables higher flexibility, allowing for on-demand plant reconfigurability while mitigating cable breakage and faulty connections [15,16]. For large control systems in particular, the effort for cabling is reduced. Wireless communication further allows larger distances to be covered [17]. Therefore, wireless closed-loop control systems, so called networked control systems (NCS), have been and still are the main research focus in academia as well as in industry [17,18]. The general working principle and components of NCS are the same as for closed-loop control systems. However, the controller, actuators and sensors are interconnected by a communication network. This network can also be shared with other control loops, as is the case for the centralized AGV control. Different architectures of NCS exist [19,20]. Figure 2 shows the architecture as it is referred to in this paper.
In this architecture, the controller is physically separated from both actuator and sensor. The controller is stationary. Actuator and sensor are both mobile and attached to the AGV [21]. Sensor, controller and actuator can either be time-driven or event-driven components. In a time-driven component, input reception or output transmission is controlled by a sampling time, which is e.g., represented by a clock signal. An event-driven component starts to process immediately at the arrival time of a component input.
Communication between the components only takes place when the control difference variable e exceeds a pre-defined limit. In one NCS, all components can be time-driven, event-driven or a mixture of both. This depends on the control techniques used. In the further course of this paper, NCS are assumed a mixture of time- and event-driven components [17,20].

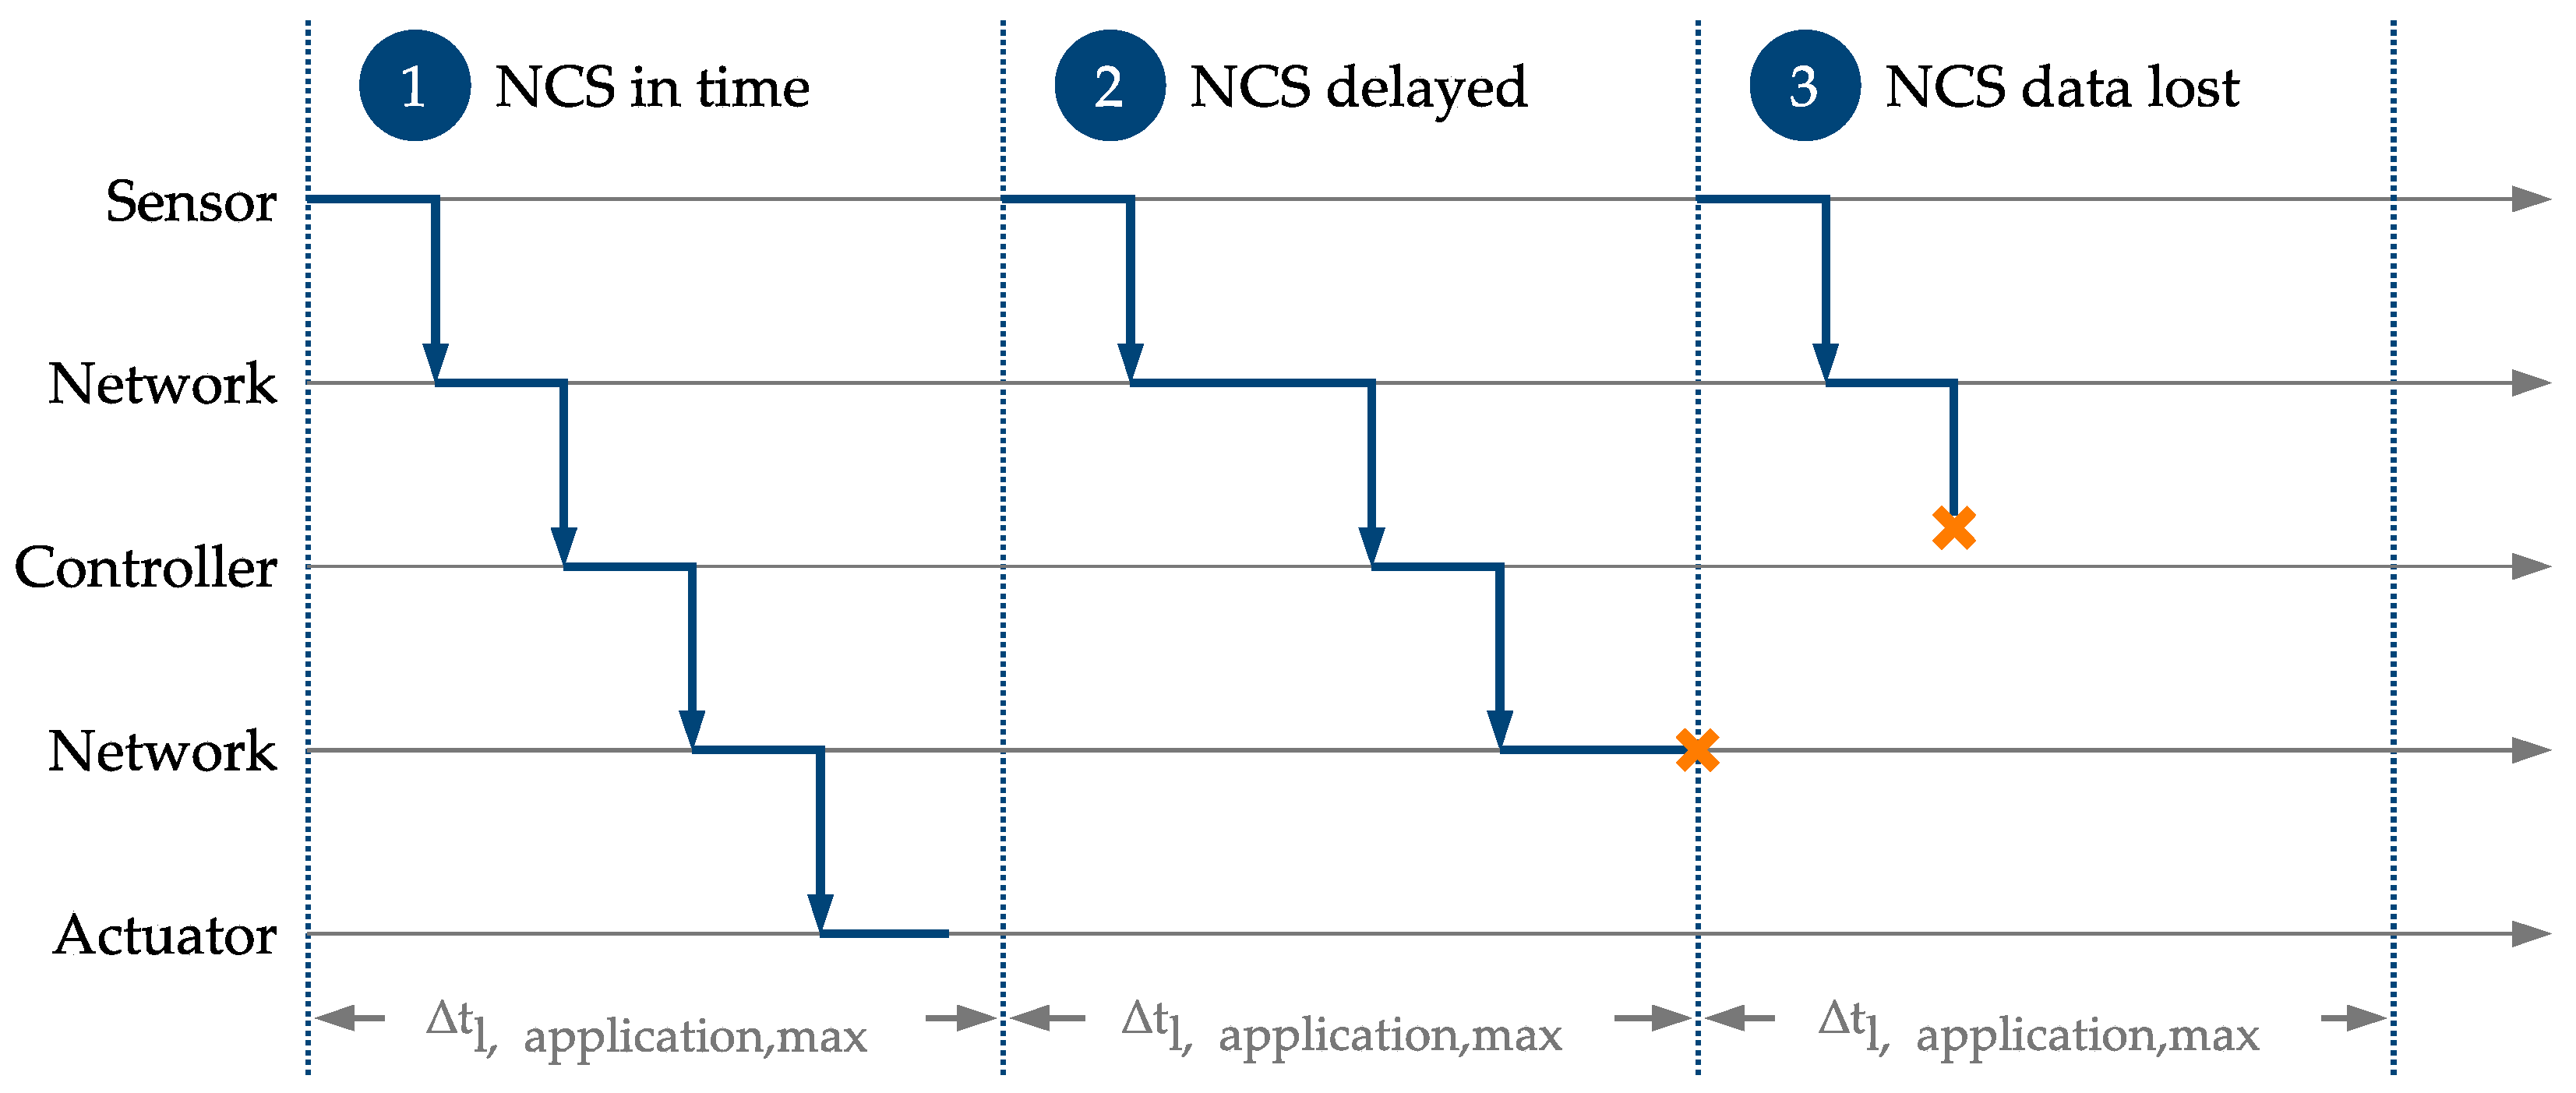
2.3. Latency, Reliability and Availability Networked Control System

As described in Section 2.1, centralized AGVs have several advantages. However, these advantages are only applicable given that the wireless network of choice of the NCS can meet the strict requirements of process control applications. They require i.e., high reliability, constant availability and range [22,23]. AGVs in particular require networks with a low latency to execute the control action within the maximum application-perceived latency Δ t l , application , max . The application-perceived latency in an NCS consists of its components’ latencies [24].
Sensor latency τ s e n s o r describes the time in between an event that is sensed and recorded. Controller latency τ c o n t r o l l e r expresses the time the controller requires to analyze data from the sensor and decide on a control action, which is fed back to the actuator. Actuator latency τ a c t u a t o r describes the time in-between the reception of the feedback variable and the start of the physical execution of the action. Network latency τ n e t w o r k describes the time the network requires to transmit the data from the sensor to the controller and from the controller to the actuator. Network latency, therefore, occurs twice in an NCS. Equation (1) shows the composition of the application-perceived latency in an NCS:
Δ t l , application = τ sensor + τ controller + τ actuator + 2 · τ network
As sensor, controller and actuator have the same impact latency-wise for both centralized and decentralized AGV control, network latency is decisive when it comes to the decision as to whether a communication technology is suitable for the use case. Equation (2) defines the maximum network latency:
τ network , max Δ t l , application , max τ sensor τ controller τ actuator 2
Thereby, latency goes hand in hand with reliability. Reliability refers to the probability to guarantee successful message transmissions within a defined latency bound. For example, if the latency of 1 ms must be provided with a reliability of 1–10−3 only one message in 103 data transfers may be lost or delayed by more than 1 ms [25]. The unit of reliability is percent.
Furthermore, network availability is of high importance. Availability (A) measures the ability to fulfil a required functionality during a specified time interval. In other words, it expresses the readiness for correct operations. Applied to the function of a wireless industrial communication system, availability is the ratio of the time interval of error free transmission t ef to an observation time t o  (Equation (3)) [26].
A = t ef t o
The service is unavailable if the messages received at the target are impaired and/or untimely. Availability is measured in percent.
To clearly understand the consequence of sufficient respectively insufficient latency, reliability, and availability, Figure 3 shows three cases. In case 1, it is assumed that latency, reliability, and availability fulfill the requirements of the application. Thus, the signal arrives in time and the NCS works correctly. In case 2, reliability is not adhered to, thus the control signal does not reach the destination in time. In case 3, data are lost due to insufficient availability. Both cases 2 and 3 would result in unplanned stoppages or even accidents of the AGV. Thus, the choice of the right communication network is crucial and will be further analyzed in Section 2.4.

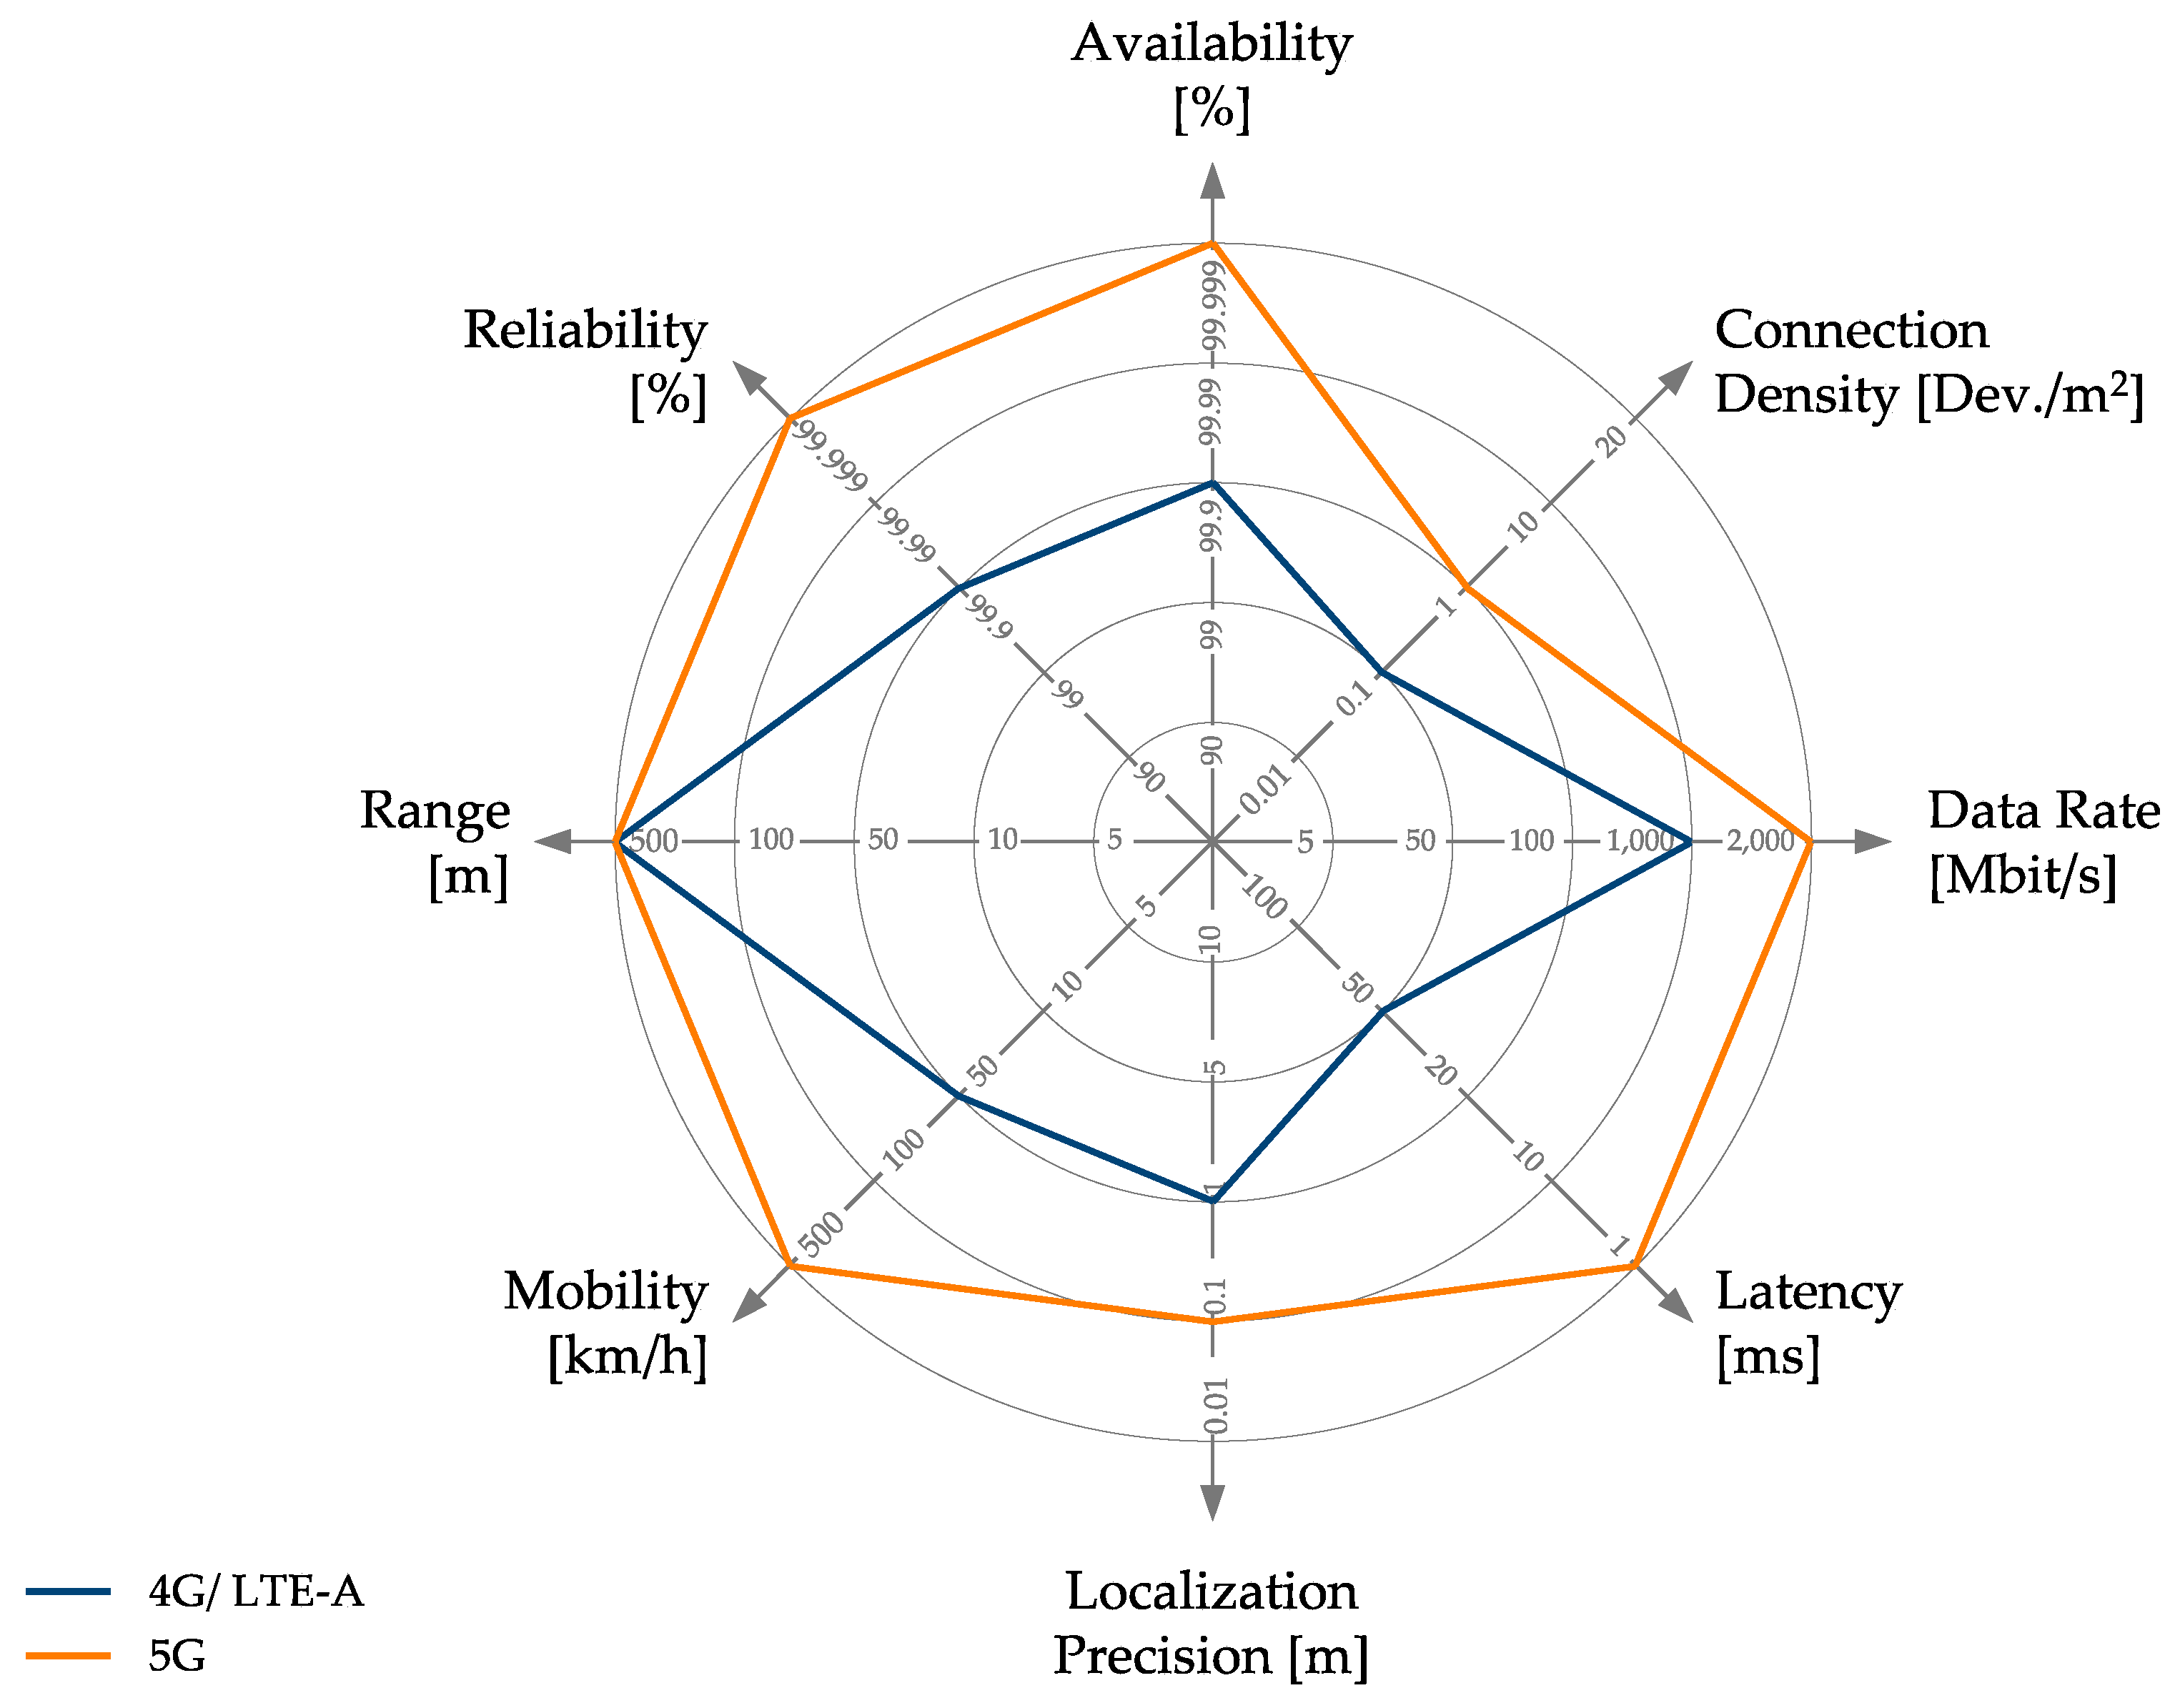
2.4. Communication Technologies for Network Control Systems (NCS)

To realize an NCS and take advantage of wireless networks, the third evolution phase of industrial communication dealt with wireless networks. Hence, basic wireless communication technologies, being originally designed for computer networks, were adopted for industrial communication—mainly from the IEEE 802 protocol family of the Institute of Electrical and Electronics Engineers [27]. Most of these standards are working in the license-free industrial scientific medical frequency bands, usually the 2.4 GHz spectrum, where neither resource planning nor bandwidth allocation can be guaranteed [28]. This led and still leads to increasingly crowded networks, resulting in a lower quality of service (QoS) (due to, e.g., lower reliability, lower availability, higher latency) of the communication standards, and thus skepticism about their suitability for industrial applications by production industry [29]. Therefore, both industrial-specific and licensed communication technology standards were and are currently further developed to meet the requirements of industrial applications.
Mobile communications in particular have undergone considerable changes and experienced massive growth. On average every 10 years, a new mobile wireless generation was introduced. Since 4G and 5G are the only relevant communication technologies for the AGV, they will be further considered in this paper. Long-term evolution-advanced (LTE-A) was introduced as 4G technology in 2009. LTE-A allows data rates up to 1 Gbp/s and latencies of around 50 ms. Reliability and availability can be up to 99.9%. However, characteristics of LTE-A, in particular reliability and availability, depend a lot on the utilization of the radio cell and the distance to it. Thus, while 4G plays a crucial role in internet access for consumers, its use in the industrial sector needs development [30,31,32,33,34,35].
The fifth generation of mobile communication, which is also referred to as 5G technology, is predicted to have a significant impact on the implementation of wireless communication in the industrial connectivity landscape [36,37]. The first public 5G networks were released in 2020, however, the development and standardization process to be widely applicable for industrial applications is still ongoing [38]. The 5G technology is expected to improve existing cases and enable a range of new use cases for production applications, especially for latency-critical applications [14,39,40].
The availability of 5G network is 99.999% or higher [41]. Furthermore, 5G is expected to support a connection density of up to 1,000,000 devices/km2, which is equivalent to 1 device/m2. Peak data are expected to reach 10,000 Mbit/s, and even up to 20,000 Mbit/s under certain conditions. The 5G can provide over-the-air latency of 1 ms and is thus capable of supporting low-latency-applications [42]. The localization accuracy of connected user equipment is at least 20 cm [43]. Mobility of up to 500 km/h can be supported while realizing an acceptable QoS [42]. A 5G system supports long-range coverage of up to 100 km [43]. The reliability of the network is 99.999% or higher [41].
Figure 4 compares 4G and 5G according to the performance characteristics of communication technologies for production defined by [24]. In theory, 5G outperforms 4G. The question, however, is whether this has an impact on the performance of the AGV on the shopfloor. This will be further analyzed in the next Sections of the paper.

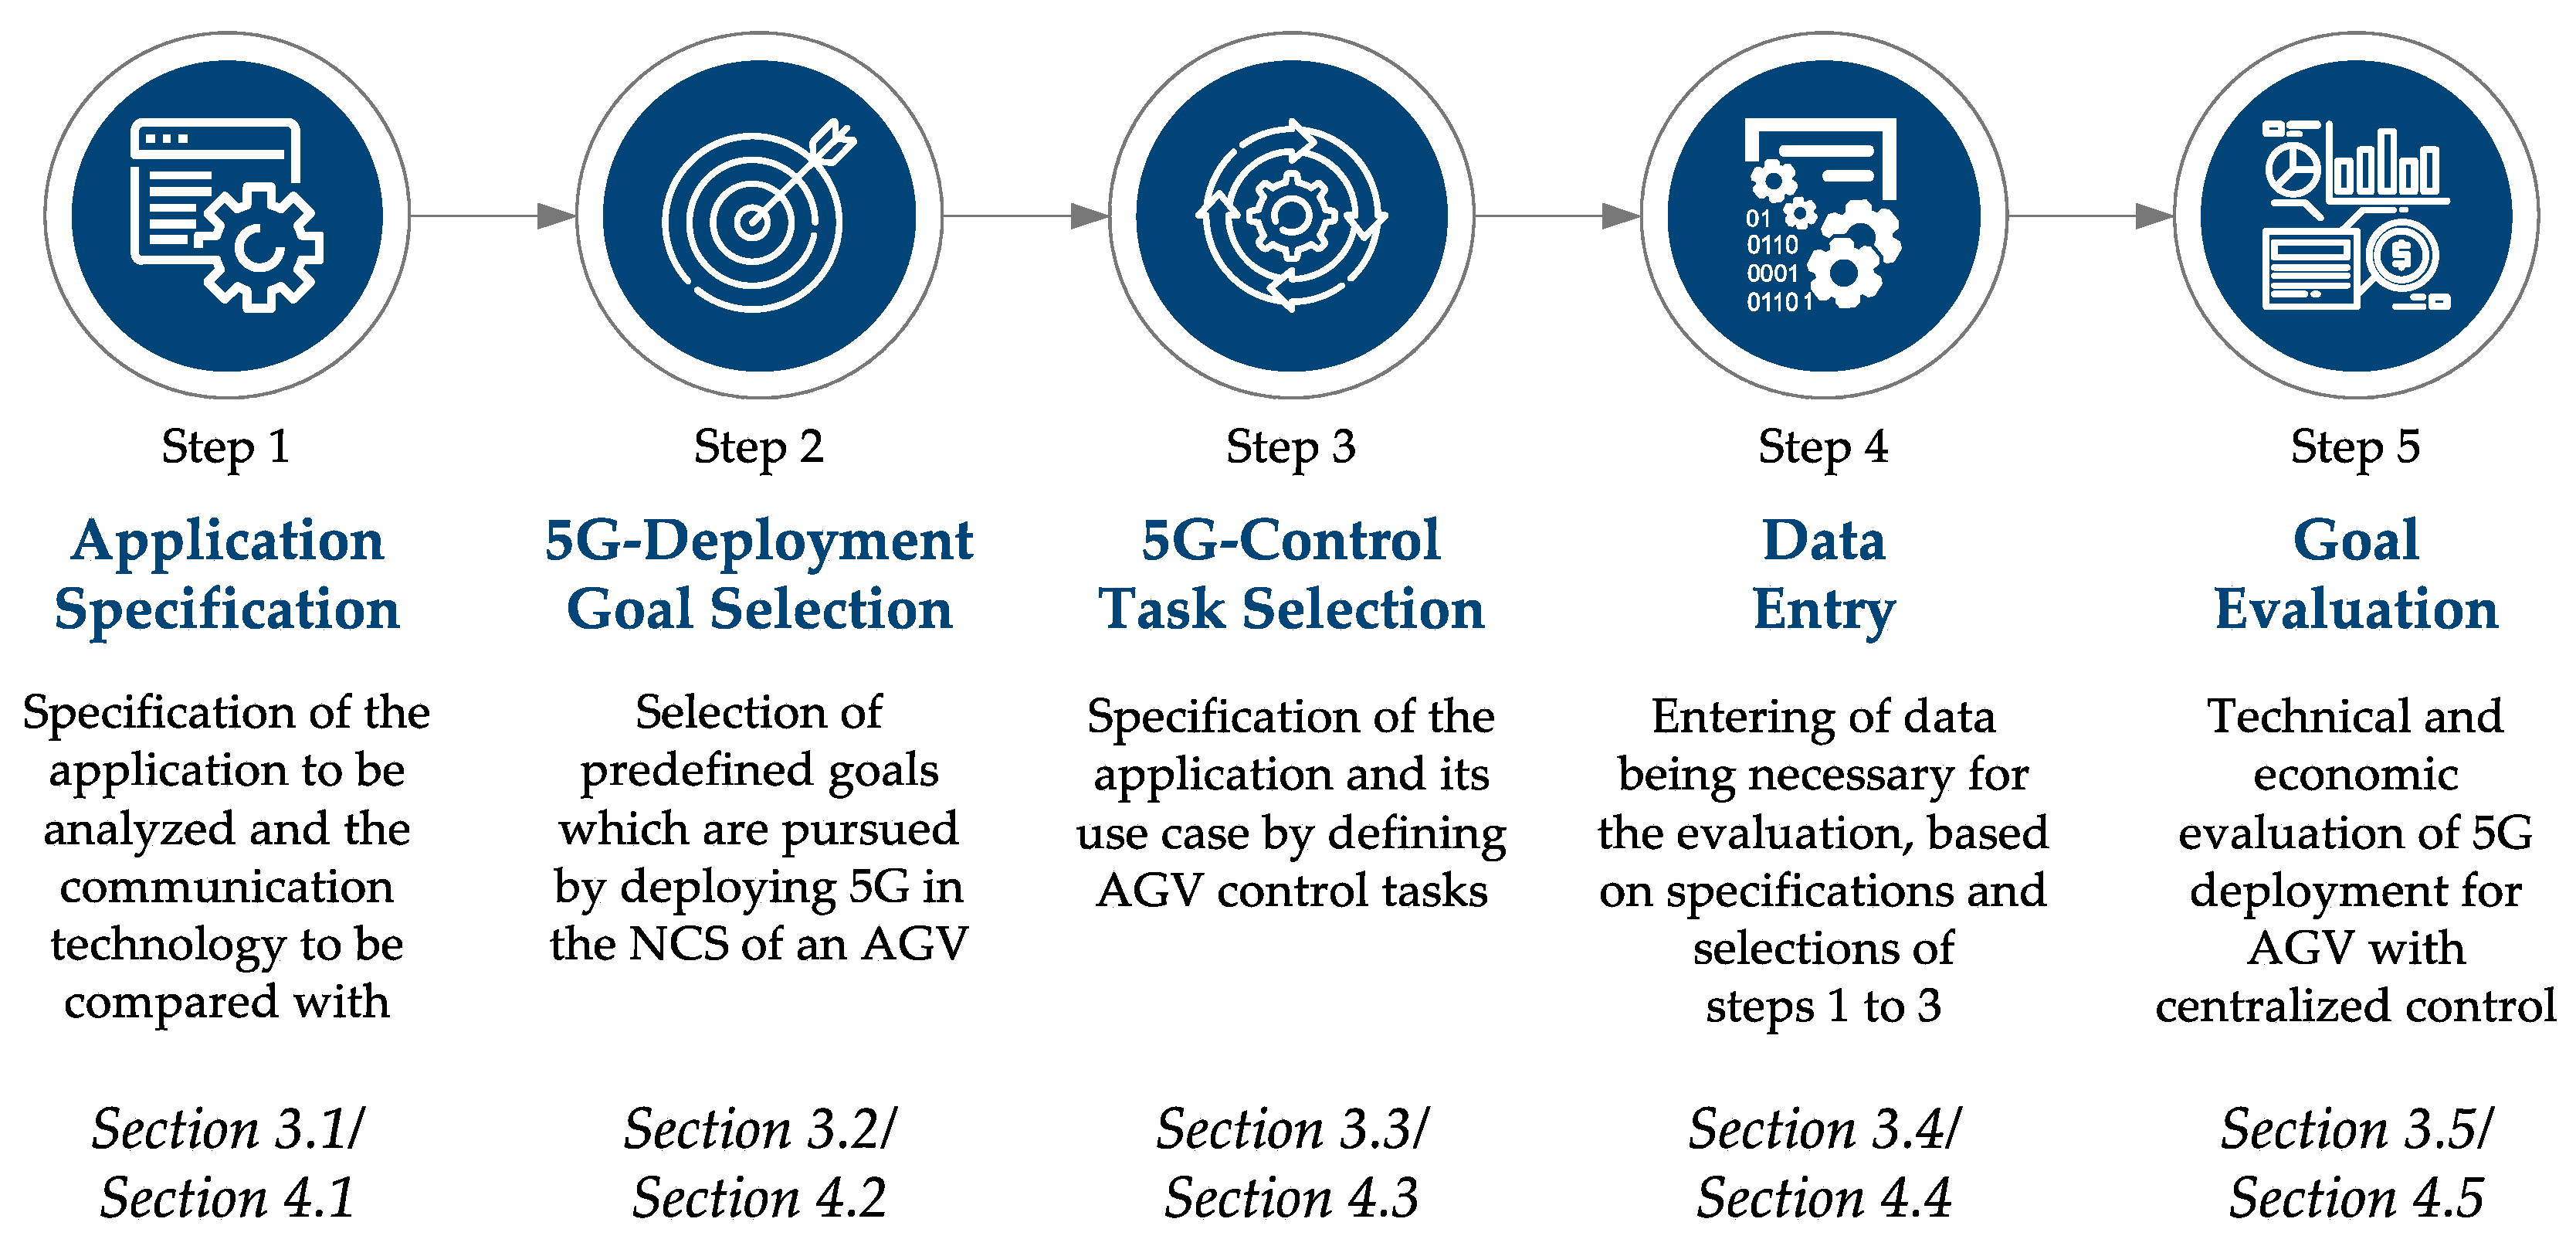
3. Model for Techno-Economic Evaluation of Fifth-Generation (5G) Technology for AGVs

To evaluate, whether the theoretical superiority of 5G has an influence on the AGV’s performance, the evaluation model developed in [44] sets the basis for assessment. This evaluation model is not specifically developed for AGVs, but to evaluate the potential of 5G for latency-critical applications in production. Thus, the model is further specified for the AGV use case in the course of this paper. Figure 5 shows the main elements of the evaluation model, which define the structure of the paper and are further described in Section 3.1, Section 3.2, Section 3.3, Section 3.4 and Section 3.5.
Thereby, the research was conducted according to Ulrich [45]. The core of our research is step 3. Until now, no research has evaluated the use-case benefits based on improvements on the control-loop level. Section 4.3 of this paper is thus a core element. Steps 1, 2 and 5 were adapted based on [44,46,47], Step 4 is a result of the previous three steps. Furthermore, our paper is the first to show the evaluation for a single application. Existing approaches from research and industry analyze 5G benefits either on a factory level, or qualitatively, as [44] describes. The research is thereby conducted based on a literature study as well as based on experiments in the Digital Experience Factory Aachen.

3.1. Application Specification

First, to define the application and the current state that the 5G-deployment should be compared to, the application must be specified. This specification includes the choice of the application itself (e.g., AGV, machine tool, drone, assembly robot) and the choice of the use case that should be considered for the application (e.g., motion control, mobile control panel, mobility automation). Then, the status of the application must be defined, thus whether an application is already existing or whether a new application must be procured. This distinction is important in case the application, which shall be controlled via 5G, might be different to that controlled via any other communication network and thus might require an additional investment. Also, if 5G technology is compared to a wired solution, this distinction is necessary as cable costs would be reduced.
Besides the specification of the application itself, the communication technology to which 5G should be compared to, e.g., 4G/LTE-A, or cable, must be chosen in this step of the evaluation model.

3.2. 5G-Deployment Goal Selection

In the second step, the goals the user wants to achieve when implementing 5G must be chosen. The evaluation model thereby distinguishes between economic and technical goals. The goals are defined in such a way that they all have the same optimization direction, i.e., the higher the value of the goal the better for the application.
For the economic analysis, two goals are considered, the net present values (NPV, Equation (4)) and the return on investment (RoI, Equation (5)).
NPV t = R t ( 1 + i ) t
with: i = Annual interest rate in %, R t = Cashflow in year t in €, t = Year.
RoI   [ % ] = Return   [ ] Expense   [ ] Expenses   [ ]
For the technical analysis, the evaluation model considers seven distinctive goals as shown in Table 1, which are defined and operationalized in [47]. The goals were determined based on prospected benefits by implementing wireless communication technologies, especially 5G technology, in production. To operationalize the goals and make them measurable, two to four KPIs are chosen for each goal. Ref. [47] in detail describes the KPIs and their equations, being used for the evaluation of the AGV later in this paper.

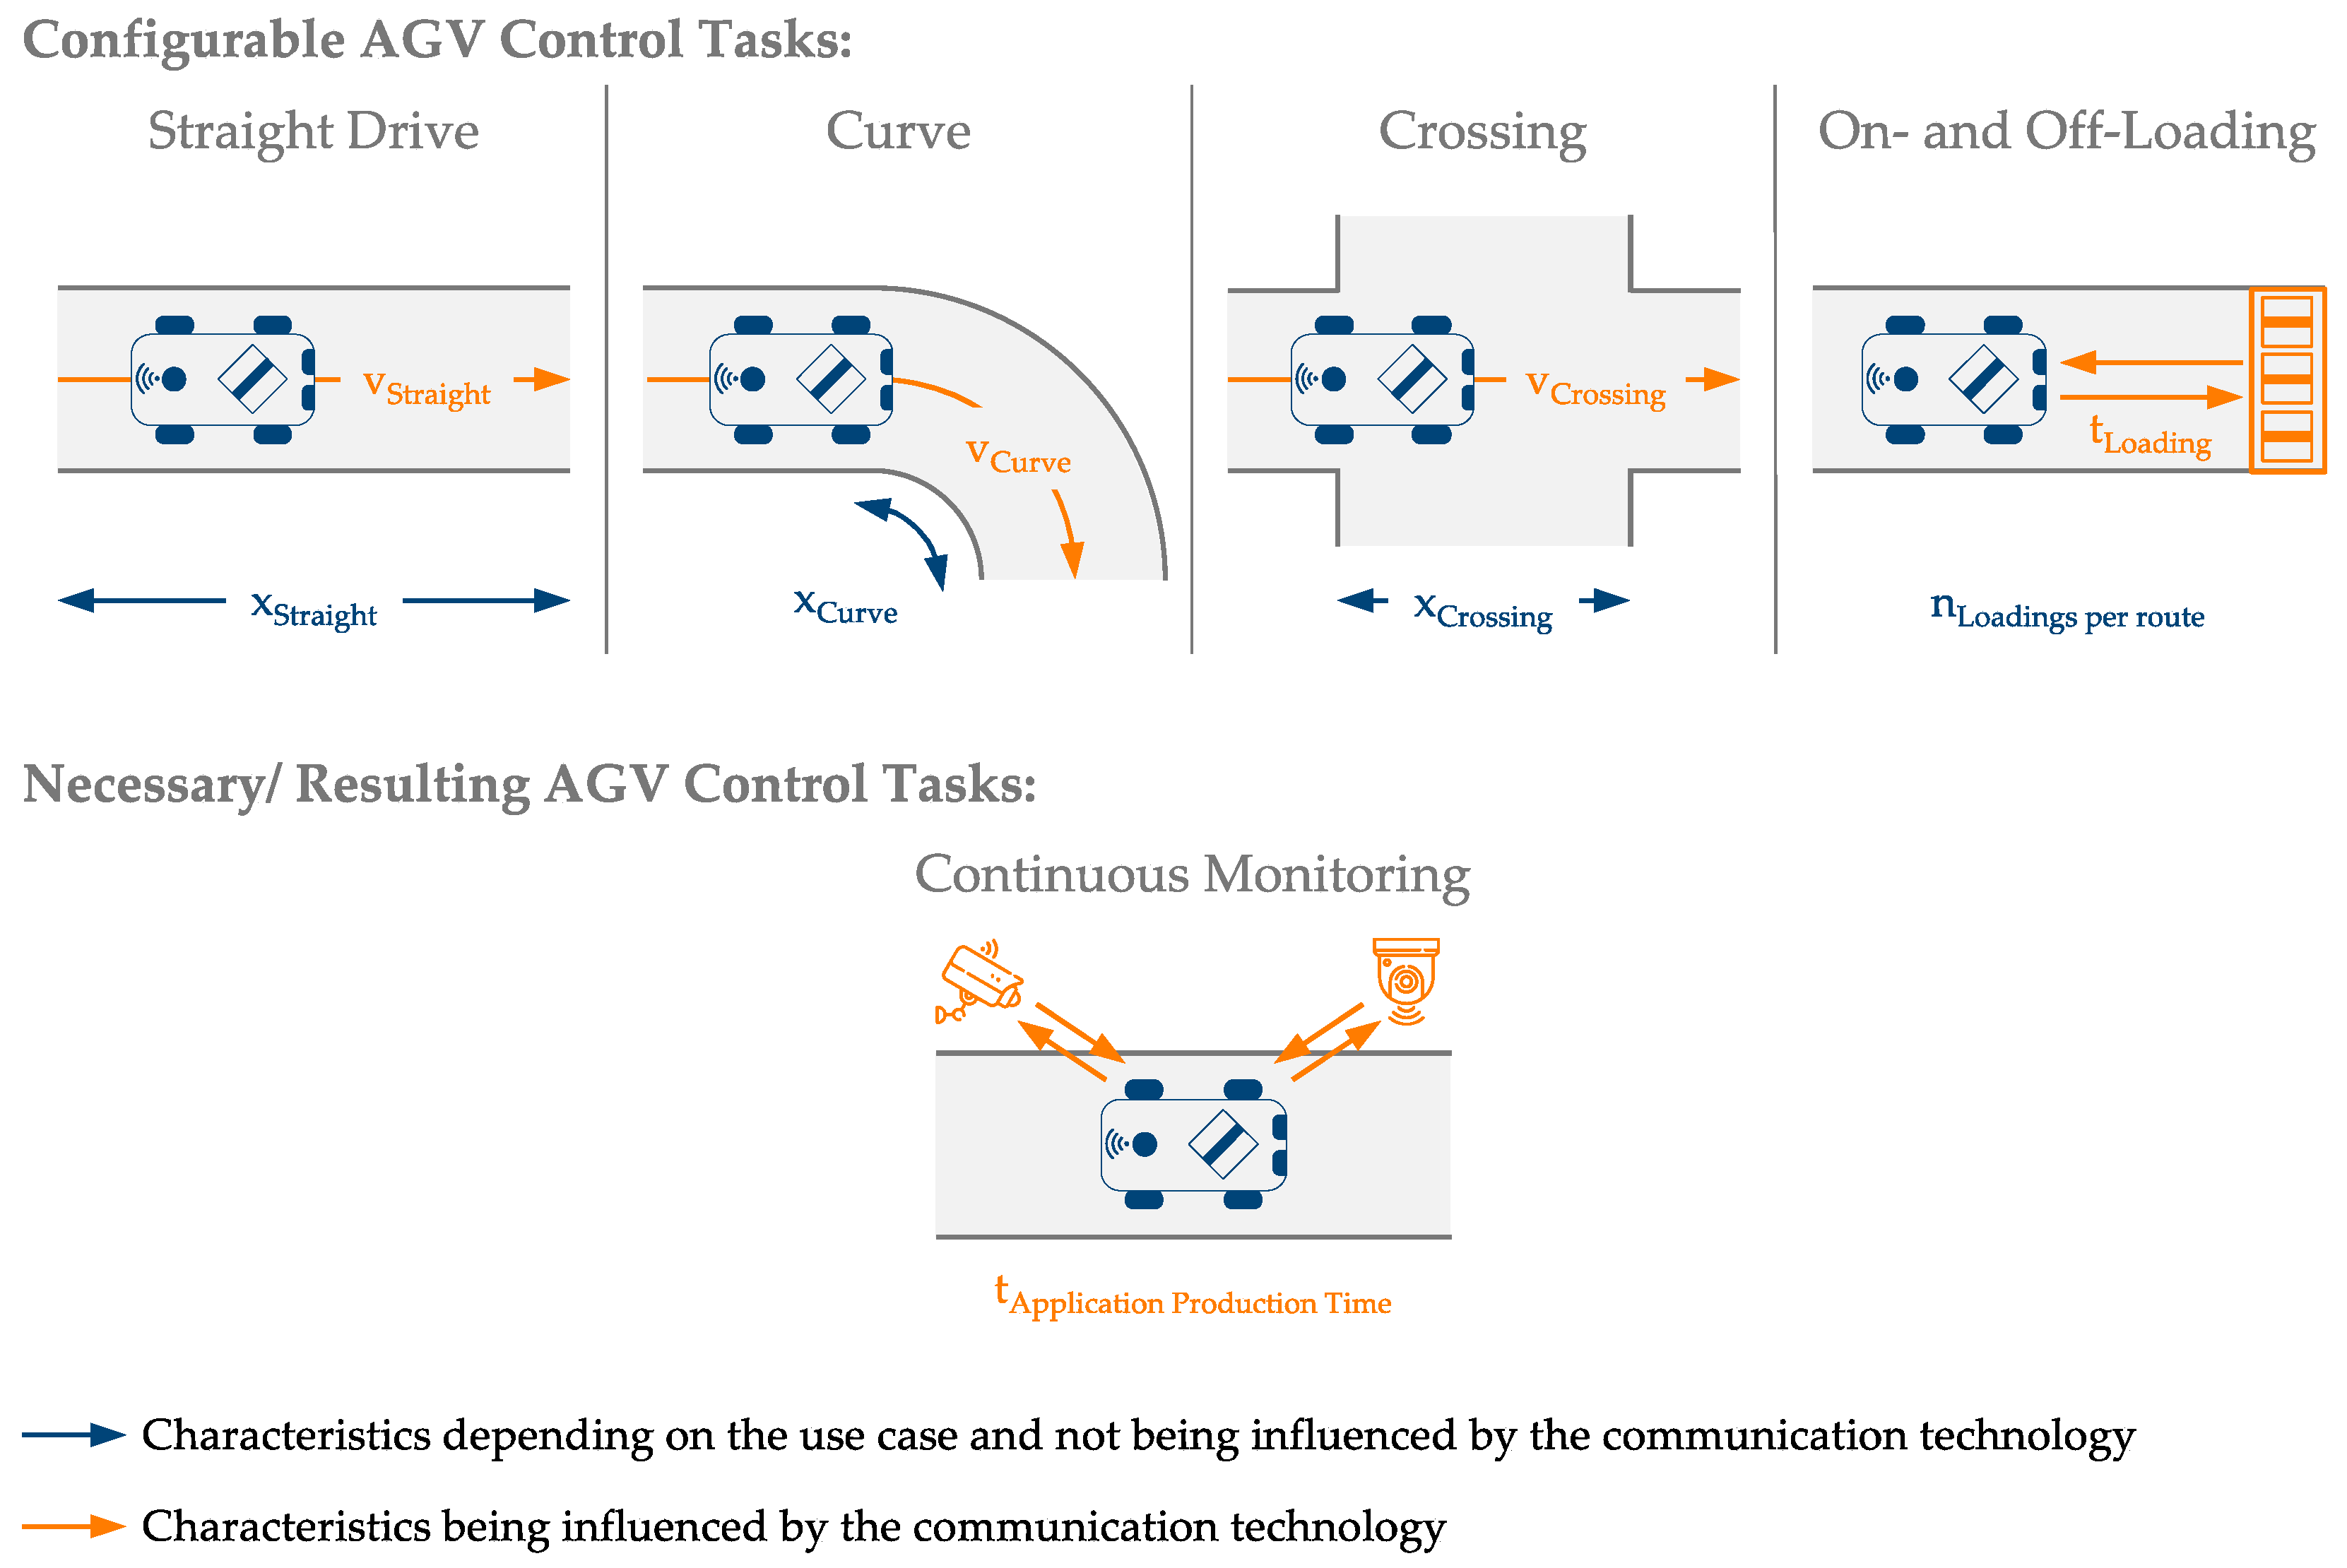
3.3. 5G-Improved and Enabled Control Task Selection

As described in Section 2.2, the benefit of 5G technology for latency-critical applications mainly emerges by allowing a networked control system. Thereby, two main effects of 5G technology are analyzed in the model. On the one hand, the effect of being a wireless technology is analyzed. This enables completely new applications (e.g., drones). On the other hand, possible process improvements by e.g., higher availability, higher reliability, and lower latencies of 5G compared to 4G must be identified. The latter depend mainly on the application. Thus, the task selection will be presented in detail in Section 4.4.

3.4. Data Entry

Based on the chosen goals, necessary data are defined by the evaluation model. Thereby, data are distinguished into five categories, which are application data, product data, process data, failure data and facility data and further categorized between technical data and economic data to facilitate the data entry. By connecting the evaluation data with the chosen goals, the user does not enter “unnecessary” data but only relevant data.

3.5. Goal Evaluation

Finally, to evaluate the goals and thus the benefits of 5G technology deployment, the delta between the 5G-value and the value of the communication technology to be compared with is calculated. For the economic goals, Equation (6) shows the calculation exemplar for the NPV.
Δ NPV = NPV 5 G   NPV 4 G  
The goal evaluation is calculated by averaging the delta of KPI. Since the goals are all defined with a positive optimization direction (the higher, the better), delta of KPI with a positive trend are added whereas delta of KPI with a negative trend are subtracted. Equation (7) shows an example for the goal “Safety”. The other goals are calculated based on the same scheme.
Δ Safety = ( MTBF 5 G MTBF 4 G ) ( ACCR 5 G ACCR 4 G ) ( MTTR 5 G MTTR 4 G ) 3

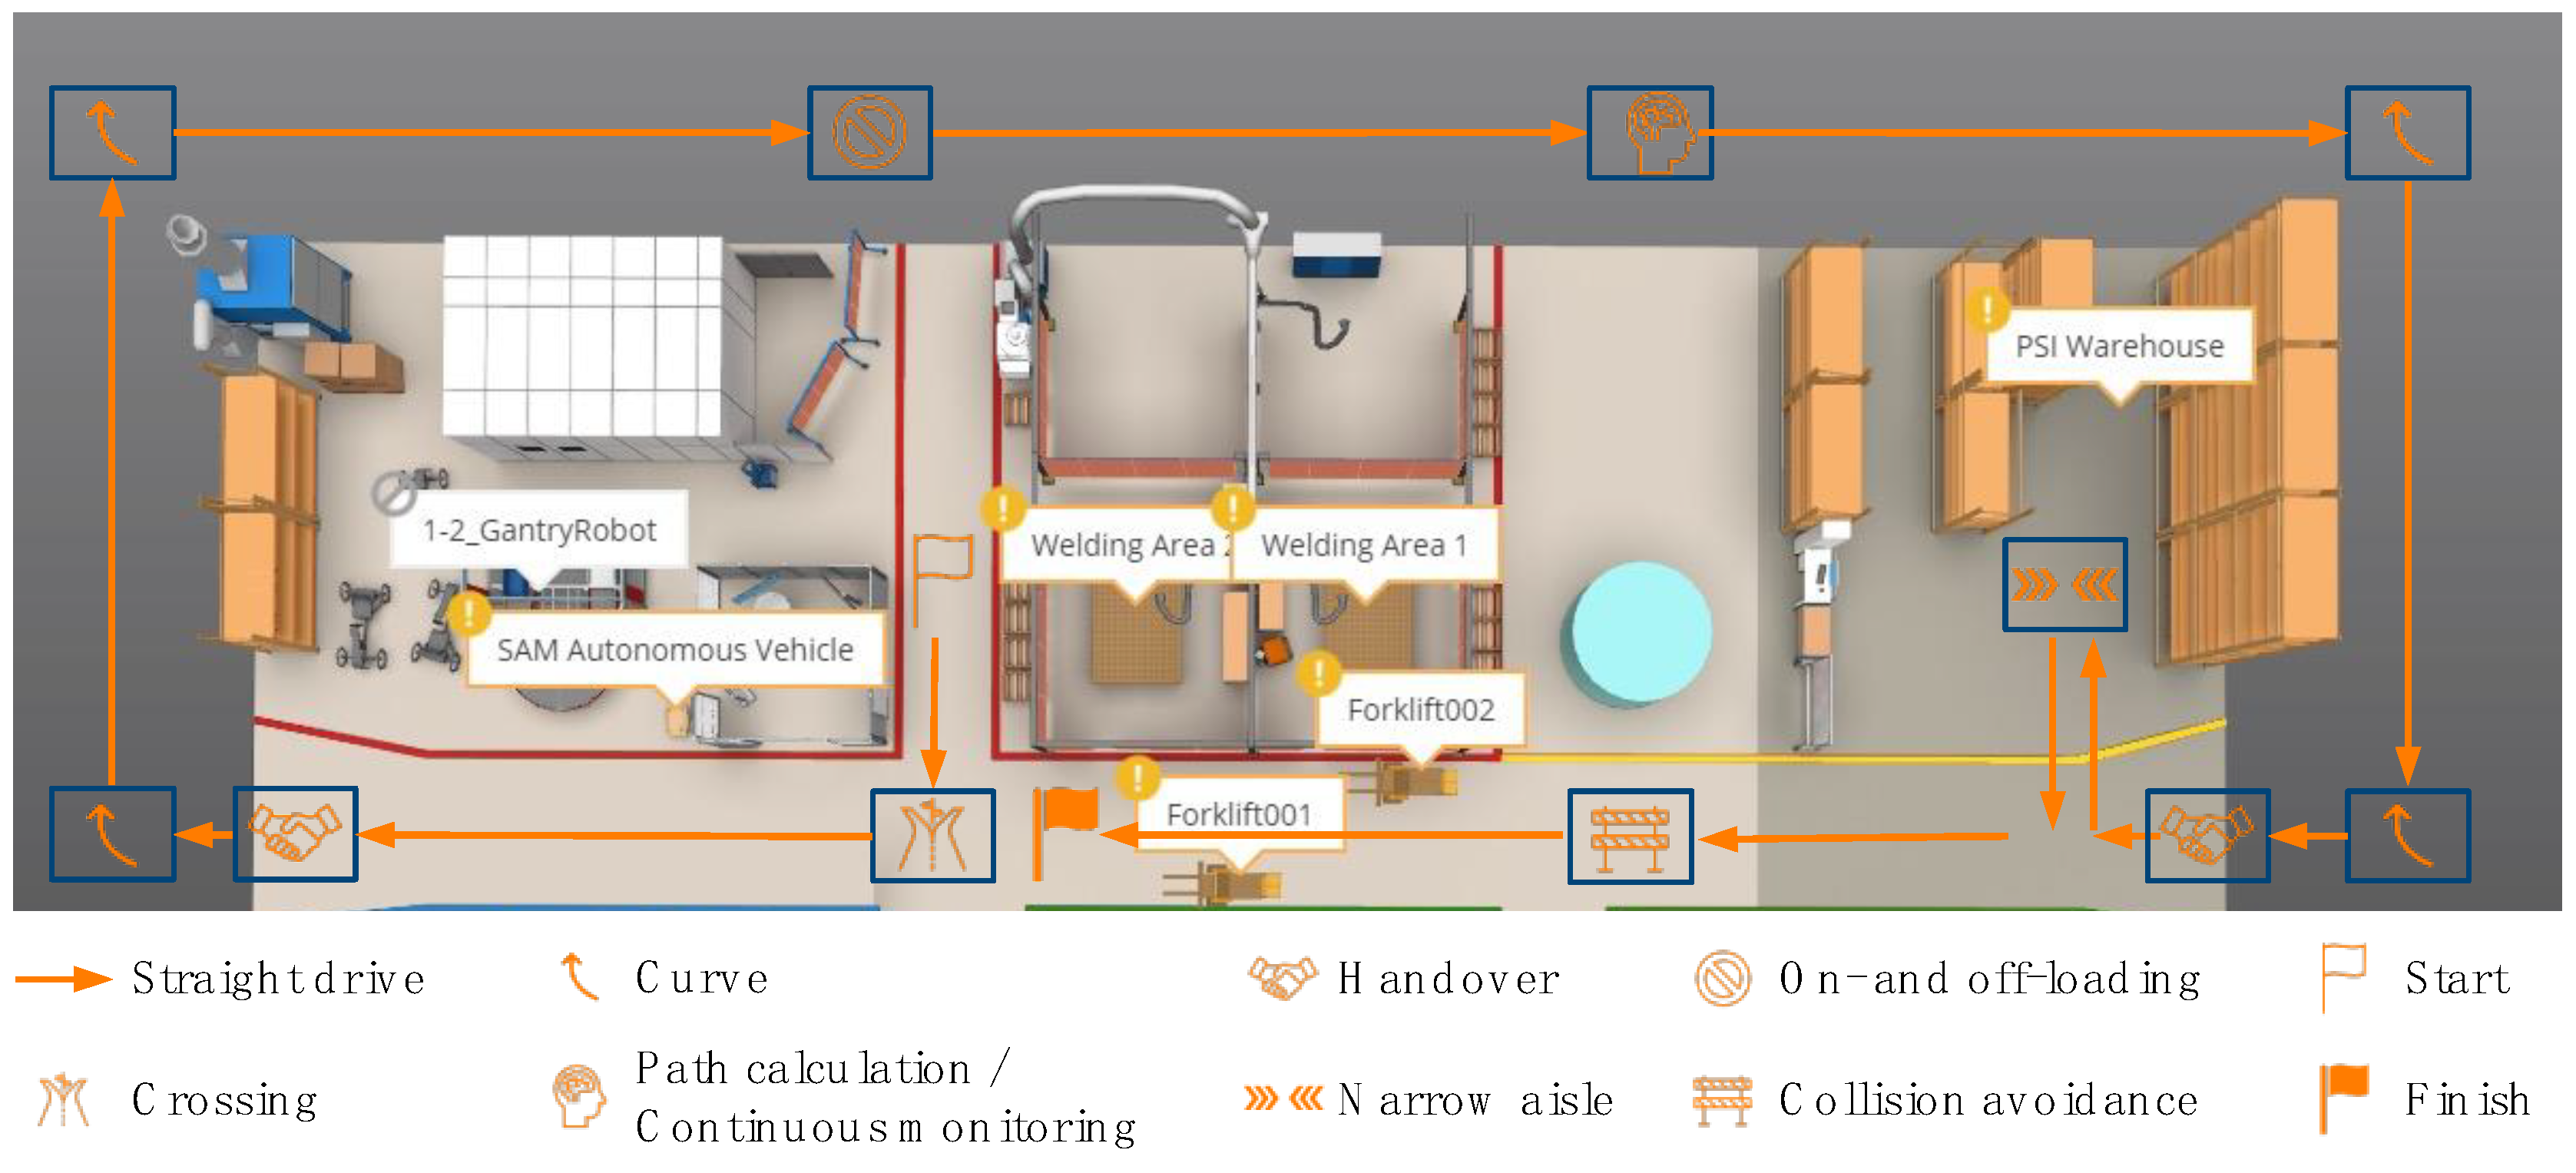
4. Application of the Model to an AGV Use Case

The evaluation and layout of the model is based on the Digital Experience Factory, as shown in Figure 6. This offers the opportunity to link physical implementation and theoretical evaluation in further research. Numerous control tasks are implemented as one use case within the framework of simulation and mathematical calculation, being further explained in Section 4.3. Besides the AGV track itself, which includes a stoppage at the warehouse of the company PSI, other production processes are executed, e.g., welding in the areas 1 and 2 or 3D printing via a gantry robot, which require transportation of material via forklifts (Forklift 001, Forklift 002). They are illustrated in Figure 6 to show that other applications and their staff might cross the path of an AGV, which will be relevant in Section 4.3. Section 4.1, Section 4.2, Section 4.3, Section 4.4 and Section 4.5 apply the evaluation model to the use case in Figure 6 to analyze whether 5G has a positive impact on the application.

4.1. Application Specification of AGV Use Case

The first step of the analysis is the specification of the AGV, as well as of the communication technology to be compared to. To simplify the evaluation in terms of this paper and put the focus on the pure evaluation of the 5G-influence, investment in a new AGV is not considered.
The communication technology to be compared to is 4G, since Wi-Fi would not allow handover of centralized AGV, as Section 2.1 explains. Furthermore, a 4G network is already deployed at the Digital Experience Factory in Aachen, thus physical testing of the theoretic evaluation can be executed in further research.

4.2. 5G-Deployment Goals for AGV Use Case

When deploying 5G for the AGV use case, the goals are mainly:
  • Increase in Mobility;
  • Increase in Productivity;
  • Increase in Safety.
Mobility is expected to be increased as 5G-controlled AGVs can be steered more precisely and therefore enter more narrow paths which are unable to be reached with 4G. Productivity is expected to be increased, as lower latencies and therefore faster reaction times allow a higher AGV speed. Furthermore, on- and off-loadings are expected to be faster and thus increase productivity. Safety is expected to be increased as availability and reliability of the network increase. In the case of lower availability, the control signal is interrupted and the AGV must stop for safety reasons, or in worst case might crash. In the case of low reliability, the control signal would not be in time and might also lead to a crash if the safety function of the AGV itself is not fast enough (see also timing diagram in Figure 3).
For economic analysis, both NPV and RoI shall be considered.

4.3. 5G-Improved and Enabled Control Tasks of AGV Use Case

The impact of 5G on the use case is initially achieved by an improvement of control tasks. In the case of the AGV, there are four control tasks that are configurable and that respectively depend on the use case itself, as illustrated in Figure 7. As mentioned in the introduction of Section 3, the influence of 5G on these control tasks is the main contribution of this paper.
In the case of straight drives, curves, and crossings, configurable means that the distances ( x Straight ,   x Curve   and   x Crossing ) can be entered by the user depending on the use case. The maximum speed is assumed to be set by the AGV as well as the minimum latency of the network, because lower latencies enable a lower Δ t l , application , max according to Equation (1) and thus higher speeds, as the deceleration in case of a stoppage is allowed to be longer without causing a crash. It is the same for the on- and off-loading time t Loading , which is shorter with 5G, as the AGV can approach faster than with 4G. Besides configurable control tasks, a necessary control task results from the configuration, which is continuous monitoring. Since a centralized control is assumed, the AGV must be constantly monitored via NCS. Here, network availability has a high influence. If the signal does not reach the controller for availability reasons, a stoppage of the AGV is assumed, as explained in Section 2.3 and Figure 3. This is declared as a “short-term failure event”, as the AGV continues driving once the signal is available again. Short term failure events do not result in error costs, but in an increased runtime per part due to short stoppages. Furthermore, it is assumed that unexpected obstacles might appear on the track, e.g., wrongly placed material, workers, forklifts or other AGVs (see Figure 6). In the model, it is assumed that one obstacle appears every kilometer. It is further assumed that the AGV bypasses the obstacle without any loss of time with the nominal reliability of communication technology. If the obstacle cannot be bypassed, a “long-term failure event” is assumed, resulting in failure cost.
Table 2 shows the 4G and 5G values for the defined control loops. As already mentioned, these values depend on the capabilities of the AGV, and could be both higher and lower. In the Excel-based model, which is attached to this paper, the values can be varied.
The increased speed and loading times and the short-term and long-term failure events have an influence on the performance of the AGV. To understand this influence, the most important parts of the mathematical model are presented. The full model is presented in the attached Excel sheet.
The main assumption the model relies on, to better measure the influence, is that a delivered part is equal to a produced and thus sold part and that the demand for products is infinite. Therefore, actual produced number of parts per day is a key figure for the model and given in Equation (8).
Actual   Produced   Number   of   Parts   per   Day   [   ] = Actual   Application   Production   Time   [ s ] Planned   Runtime   per   Part   [ s ]
The planned runtime per part of the AGV is given in Equation (9).
Planned   Runtime   per   Part   [ s ] = Transport   Time   per   Route   [ s ] Batch   Size   [   ]
The increased speed of the control tasks due to 5G-implementation, thereby, has an influence of the transport time per route (TTPR), as Equation (10) shows.
TTPR   [ s ] = v Straight   [ m / s ] x Straight   [ m ] + v Curve   [ m / s ] x Curve   [ m ] + v Crossing   [ m / s ] x Crossing   [ m ] + t Loading   [ s ]     n Loadings   per   route   [   ]
The reduction of short-term and long-term failure events has an influence on the unplanned downtime and thus in turn on the actual application production time (AAPT). Equation (11) shows the composition of AAPT.
AAPT   [ s ] = Actual   Application   Busy   Time   ( AABT )   [ s ]     Application   Setup   Time   [ s ] with   AABT   [ s ] = Planned   ABT     Actual   Application   Dowtime   ( AADT )   [ s ] with   AADT   [ s ] = Planned   Downtime   [ s ] + Unplanned   Downtime   ( UPDT )   [ s ]
For the AGV use case, planned downtime only consists of battery charging. Unplanned downtime (UPDT) consists of the short-term and long-term failure events (FE), as Equation (12) shows.
UPDT   [ s ] = FE Short-Term     t Repair , Short-Term   [ s ] + FE Long-Term       t Repair , Long-Term   [ s ]  
with: t Repair , Short-Term = Time to repair short-term FE, t Repair , Long-Term = Time to repair long-term FE.
Time to repair is, thereby, independent of the technology. Short-term FE depends on the availability, as Equation (13) shows, and long-term FE depend on the reliability, as Equation (14) shows.
FE Short-Term   [   ] = Planned   Application   Production   Time   [ s ] Time   interval   between   monitoring   signals   [ s ]     ( 1 - Availability   [ % ] )  
with: Availability 4 G = 99.9%, Availability 5 G = 99.999%.
FE Long-Term   [   ] = x Route   [ m ] Obstacles   per   Distance   [ ]     Planned   Runs   per   Day   [   ]     ( 1 - Reliability   [ % ] )  
with: Reliability 4 G = 99.9%, Reliability 5 G = 99.999%, x Route = x Straight   + x Curve + x Crossing .
As mentioned previously, the formulas shown are those being directly influenced by the control tasks. The complete mathematical relations are presented in the Excel file.

4.4. Data Entry for AGV Use Case

After choosing both technical and economic goals and deriving the control tasks, the necessary data to be entered are shown in Table 3, presenting the data type as well as the connected goal and the data source. Hereby, AGV means the data are from the AGV handbook respectively depending on the AGV of the company Husky that is used, and UC means the data are from the use case shown in Figure 6. Data can be changed in the provided excel file.

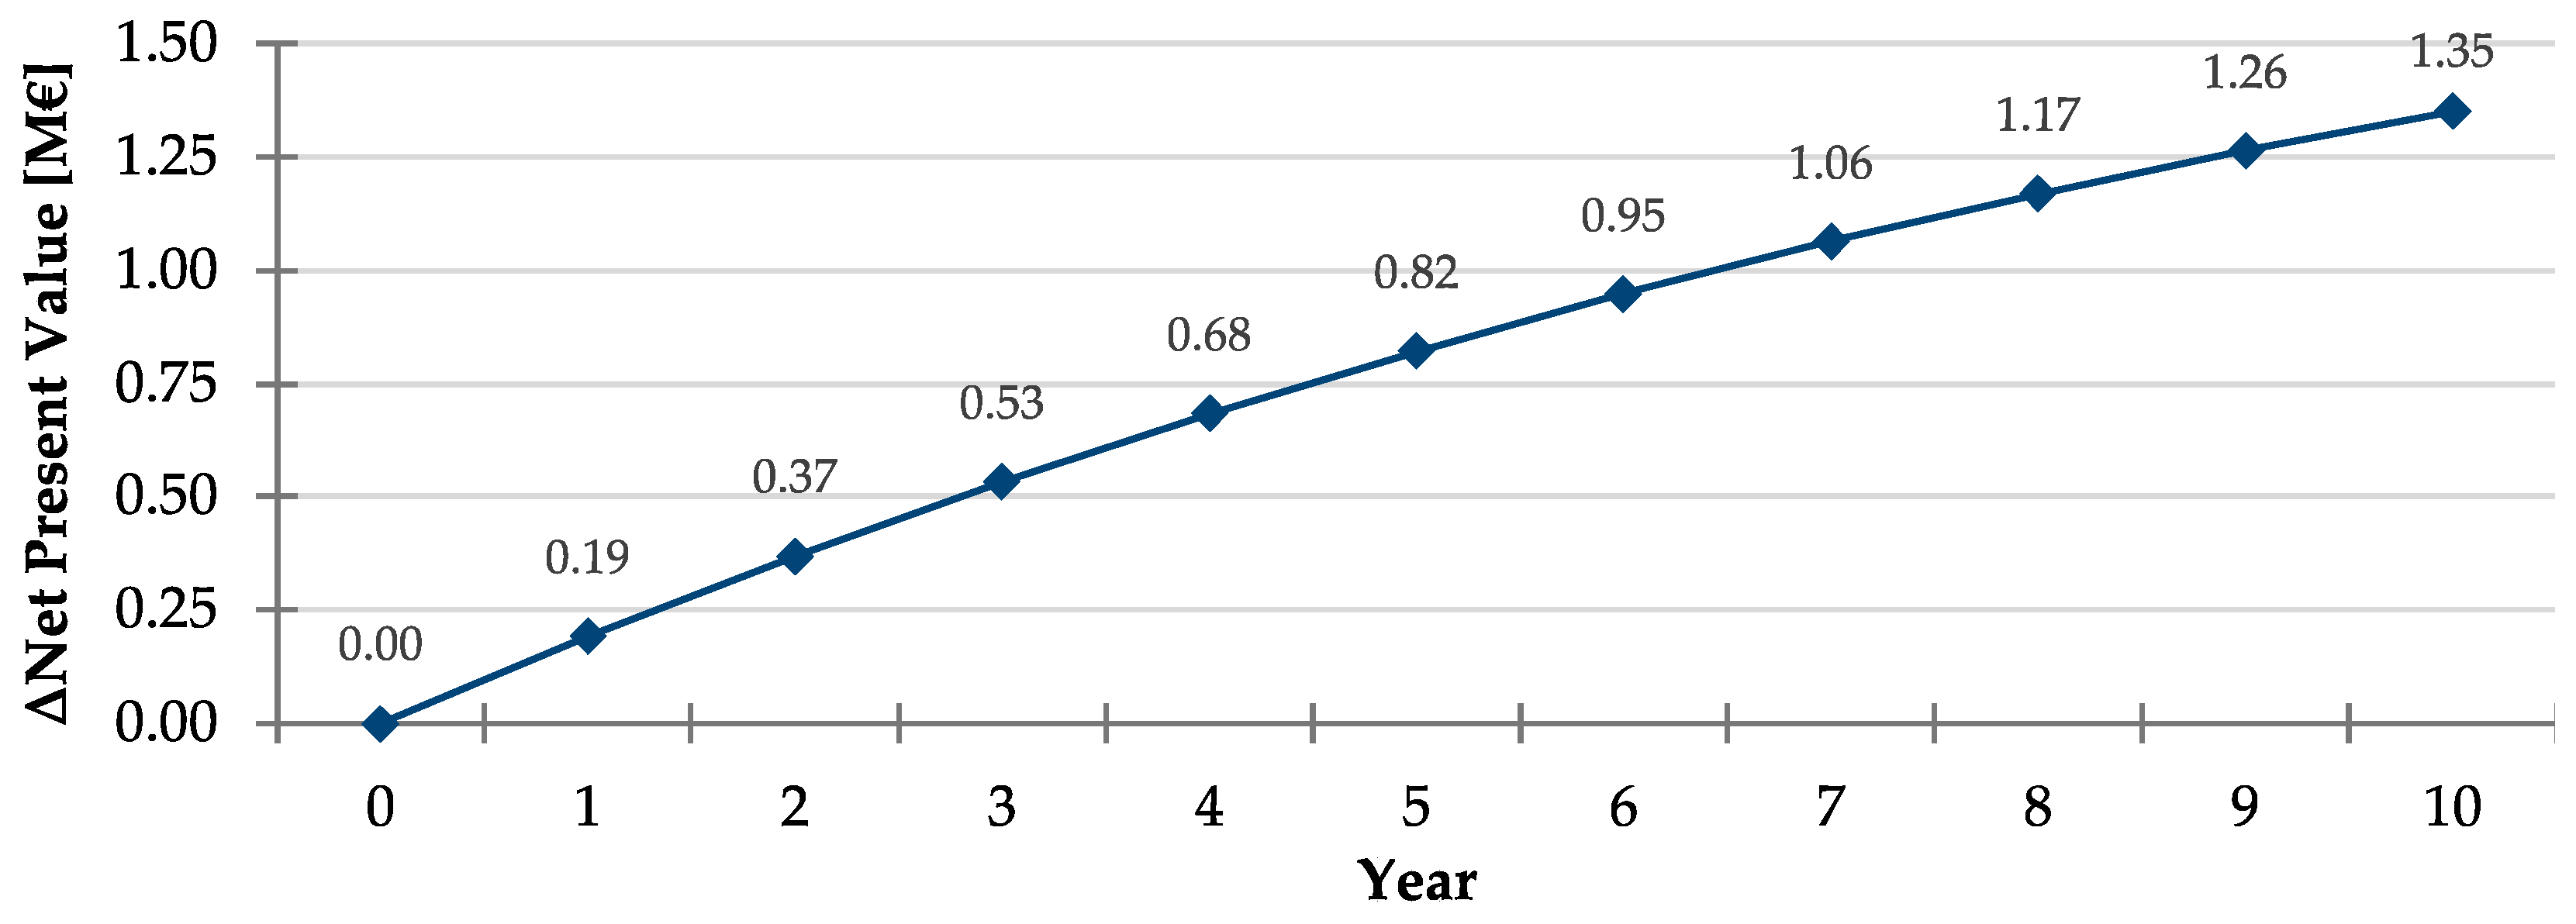
4.5. Goal Evaluation for AGV Use Case

Based on the data shown in Section 4.4 and the influence of the control tasks shown in Section 4.3, and according to the formula presented in Section 3.5, technical and economic goals are analyzed. Figure 8 presents the delta of technical goals of 5G technology compared to 4G technology. The goals are thereby evaluated based on the reference frame of 1 year. As portrayed in Figure 8a, all goals have a positive delta, meaning 5G leads to an improvement compared to 4G. Figure 8b shows the delta of the corresponding KPI as well as their optimization trend. As for the overall goals, each KPI shows an improvement. Safety in particular is improved drastically.
Figure 9 shows the difference between the NPV of a 5G-controlled AGV compared to a 4G-controlled AGV. Thereby, a private, stand-alone 5G network was assumed. This means, the network is owned by the manufacturer and no service costs are incurred by the mobile network operator. Furthermore, as investment costs for 5G hardware and 5G-AGVs are currently still uncertain, they were not considered in the delta shown. The cash flow is assumed constant over the 10 years.
This means, that the delta NPV is the maximum value the company can invest into 5G hardware, 5G deployment cost, additional operational costs and AGV hardware to stay beneficial. If no 4G network is deployed and no AGV available yet, NPV shows maximum delta between 4G and 5G investments.
Equation (15) shows the economic benefit of 5G with another key figure, which is Δ RoI , again for the operational costs of the application only.
Δ RoI = Δ Return Δ Expenses Δ Expenses = 500 , 000   300 , 000   300 , 000   = 66.67 %
To better understand the influence of 5G compared to 4G, Equation (16) shows the difference of OPEX per product. Here, it becomes clear that due to the higher productivity and higher safety at the same time, the operational costs per product are reduced.
  Δ OPEX Product = OPEX 5 G Produced   Quantity 5 G   OPEX 4 G Produced   Quantity 4 G   = 5.88  

5. Discussion

After evaluating the 5G influence on technical as well as economic goals, Section 5 discusses the results shown of both technical and economic evaluation. Thereby, key factors and assumptions and their effects on the evaluation are shown.
In the technical evaluation, the high improvement of the goal Safety is especially noticeable. To understand this, the definition of the KPIs—especially mean time between failure (MTBF)—plays an important role. The KPI MTBF has no limit, this means the higher MTBF the better. As the KPI does not distinguish between short-term and long-term failures, the high availability of the 5G network and thus the reduction of short-term-stoppages due to connection loss has a high influence on safety, although they do not lead to an accident, only a failure. Assuming the network availability between 4G and 5G would not change, the difference of 5G safety compared to 4G safety would bisect. ΔMTBF would even slightly worsen by 0.1%, as the higher actual production time would lead to a few more connection errors. Also, the influence of the constant availability on the economic goals is not big, as summarized in Table 4—Case 1.
Besides the influence on MTBF of the high safety, the accident ratio (ACCR) also has a relatively high influence. However, taking a deeper look at the ACCR for 4G, one can observe that the total accidents per year for 4G is six, for 5G it is less than one. To analyze the influence on the ACCR, we assume that the safety function of the AGV itself is preventing all accidents, meaning ACCR for both 4G and 5G is zero, and so is the delta. However, in this case, the economic influence would be much higher as for the availability case, since unplanned downtime as well as penalty of 4G would reduce, meaning that the savings by 5G would decrease. Nevertheless, due to higher productivity, economics would still be beneficial, as shown in Table 4—Case 2.
A possible additional benefit of 5G technology for the AGV use case, which is not addressed in the evaluation yet, is the improved handover of 5G compared to 4G. As described in Section 2.1, the handover ability of both 4G and 5G is necessary to run the AGV in general in environments that require multiple access nodes to cover the necessary area. With a handover latency close to zero ms—a significant reduction on today’s 30–60 ms handover in 4G systems emphasizes the benefits of 5G. With the dual active protocol stack (DAPS) handover the 3GPP (Third Generation Partnership Project), which are responsible for the standardization of mobile networks, is facing the challenge of short handovers. DAPS offers continuous transmission and reception after receiving the handover request. The user data is simultaneously transmitted within the source and target cell. This adds up to the lowest possible latency during the handover. An improved handover ability would probably both increase productivity and safety due to decreased short-term failures. This would both increase the number of produced parts and thus improve economics at the same time.
Furthermore, this paper considers in particular the techno-economic evaluation of the 5G application in the context of centralized control architectures of AGVs. As described in Section 2.1, the selection of the right control architecture depends on infrastructure and use case, and more advanced decentralized approaches could be feasible in certain applications to improve flexibility, robustness, and scalability. A techno-economic evaluation for such use cases is, therefore, useful in the future.

6. Summary and Outlook

The paper analyzed the technical and economic effects of 5G technology compared to 4G technology on a centralized controlled automated guided vehicles. Therefore, the evaluation model developed in [44] set the basis for the analysis. The analysis showed positive effects of 5G compared to 4G for both technical as well as economic goals. The case analysis confirmed the positive influence.
However, the analysis did not include any capital expenditures or additional operational expenditures of 5G infrastructure and thus shows, in terms of the economic analysis, how much money companies could invest in 5G. Once reliable data for 5G capital expenditures and operational expenditures, as well as for 5G automated guided vehicles, are available, the analysis might be improved.
Furthermore, this approach is an ex-ante approach, thus the evaluation is theoretical and not validated with a long-term test of automated guided vehicles at the Digital Experience Factory Aachen. This validation should be conducted to prove the theoretical values presented in this paper. Currently, an automated guided vehicle is installed and prepared at Digital Experience Factory. Control tasks over 5G are already implemented as well as the mapping of the Digital Experience Factory. The autonomous driving, centralization of the automated guided vehicle and finalization of the frontend are in progress. Thus, it is planned to test the difference in practice in the second half of 2022 and to publish these results.
Last, to make the analysis more user friendly, the Excel sheet should be implemented in a software tool that guides the user through the analysis and simplifies the data entry and case analysis.

Author Contributions

Conceptualization, R.K., L.H., A.M. and F.R.; methodology, R.K.; validation, R.K., L.H., A.M. and F.R.; formal analysis, R.K. and A.M.; writing—original draft preparation, R.K.; writing—review and editing, L.H., A.M. and F.R.; visualization, R.K. and F.R.; supervision, R.H.S. and V.S. All authors have read and agreed to the published version of the manuscript.

Funding

This work has been performed in the framework of the H2020 project “5G-SMART” co-funded by the EU and the project “5G-Industry Campus Europe”, which is funded by the BMVI with the funding code VB5GICEIPT. The authors would like to acknowledge the contributions of their colleagues. This information reflects the consortium’s view, but the consortium is not liable for any use that may be made of the information contained therein.

Conflicts of Interest

The authors declare no conflict of interest.

Appendix A. Abbreviations and Formula Symbols

Table A1. List of abbreviations.
AbbreviationDescription
4G4th Generation of Mobile Communication
AGVAutomated Guided Vehicle
5G5th Generation of Mobile Communication
LTE-ALong-Term Evolution-Advanced
NCSNetworked Control System
QoSQuality of Service
Table A2. List of formula symbols.
Formula SymbolUnitDescription
A%Availability
AABTsActual Application Busy Time
AADTsActual Application Down Time
AAPTsActual Application Production Time
ABTsApplication Busy Time
ACCR%Accident Ratio
CAPEXCapital Expenditures
E%Effectiveness
FE Long-Term   -Long-Term Failure Events
FE Short-Term -Short-Term Failure Events
i%Annual Interest Rate
MHM%Material Handling Mobility
MTBF%Mean Time Between Failures
MTTR%Mean Time To Repair
n Loadings   per   route -Number of Loadings per Route
NPVNet Present Value
OPEXOperational Expenditures
R t Cashflow in year t
RoI%Return on Invest
SP%Space Productivity
Δ t l , application , max msMaximum Application-Perceived Latency
τ a c t u a t o r msActuator Latency
τ c o n t r o l l e r msController Latency
τ n e t w o r k msNetwork Latency
τ s e n s o r msSensor Latency
t ef sError Free Transmission Time
t Loading sTime per Loading
t o sObservation Time
t Repair , Long-Term sTime to Repair Long-Term FE
t Repair , Short-Term sTime to Repair Short-Term FE
TR%Throughput Ratio
UPDTsUnplanned Downtime
v Straight m/sStraight Drive Speed
v Crossing m/sCrossing Speed
v Curve m/sCurve Speed
WE%Worker Efficiency
x Crossing mCrossing Distance
x Curve mCurve Distance
x Straight mStraight Drive Distance

References

  1. Kirchheim, A.; Dibbern, P. Flurförderzeuge. In Innerbetriebliche Logistik; Schmidt, T., Ed.; Springer: Berlin/Heidelberg, Germany, 2019; pp. 41–61. [Google Scholar]
  2. Meissner, H.; Ilsen, R.; Aurich, J.C. Analysis of Control Architectures in the Context of Industry 4.0. Procedia CIRP 2017, 62, 165–169. [Google Scholar] [CrossRef]
  3. MHP Management und IT-Beratung. Industrie 4.0 Barometer 2020; Munich, Germany. 2021. Available online: https://www.mhp.com/de/unternehmen/studien/industrie-40-barometer-2020 (accessed on 6 January 2022).
  4. Digital Catapult. Made in 5G—5G for the UK Manufacturing Sector; London, UK. 2019. Available online: https://www.digicatapult.org.uk/news-and-insights/press-releases/post/made-in-5g-exploring-the-future-of-connectivity-and-5g-in-uk-manufacturing/ (accessed on 6 January 2022).
  5. Deng, P.; Amirjamshidi, G.; Roorda, M. A vehicle routing problem with movement synchronization of drones, sidewalk robots, or foot-walkers. Transp. Res. Procedia 2020, 46, 29–36. [Google Scholar] [CrossRef]
  6. Lemardelé, C.; Estrada, M.; Pagès, L.; Bachofner, M. Potentialities of drones and ground autonomous delivery devices for last-mile logistics. Transp. Res. Part E Logist. Transp. Rev. 2021, 149, 102325. [Google Scholar] [CrossRef]
  7. Nakimuli, W.; Garcia-Reinoso, J.; Sierra-Garcia, J.E.; Serrano, P.; Fernández, I.Q. Deployment and Evaluation of an Industry 4.0 Use Case over 5G. IEEE Commun. Mag. 2021, 59, 14–20. [Google Scholar] [CrossRef]
  8. Fransen, K.; Van Eekelen, J.; Pogromsky, A.; Boon, M.A.; Adan, I.J. A Dynamic Path Planning Approach for Dense, Large, Grid-Based Automated Guided Vehicle Systems. Comput. Oper. Res. 2020, 123, 105046. [Google Scholar] [CrossRef]
  9. Hompel, M.T.; Bauernhansl, T.; Vogel-Heuser, B. Handbuch Industrie 4.0; Springer: Berlin/Heidelberg, Germany, 2020. [Google Scholar]
  10. Schaffer, J.; Weidenbach, M. Agentenbasierte Steuerung Fahrerloser Transportsysteme im Umfeld von Industrie 4.0. In Handbuch Industrie 4.0; Hompel, M.T., Bauernhansl, T., Vogel-Heuser, B., Eds.; Springer: Berlin/Heidelberg, Germany, 2020; pp. 143–169. [Google Scholar]
  11. De Ryck, M.; Versteyhe, M.; Debrouwere, F. Automated Guided Vehicle Systems, State-of-the-Art Control Algorithms and Techniques. J. Manuf. Syst. 2020, 54, 152–173. [Google Scholar] [CrossRef]
  12. Fragapane, G.; de Koster, R.; Sgarbossa, F.; Strandhagen, J.O. Planning and control of autonomous mobile robots for intralogistics: Literature review and research agenda. Eur. J. Oper. Res. 2021, 294, 405–426. [Google Scholar] [CrossRef]
  13. Cheong, H.-W.; Lee, H. Requirements of AGV (Automated Guided Vehicle) for SMEs (Small and Medium-sized Enterprises). Procedia Comput. Sci. 2018, 139, 91–94. [Google Scholar] [CrossRef]
  14. Mennig, J.; Hajek, L.; Münder, P. 5G in Production; Umlaut GmbH: Aachen, Germany, 2019. [Google Scholar]
  15. Åkerberg, J.; Gidlund, M.; Björkman, M. Future Research Challenges in Wireless Sensor and Actuator Networks Targeting Industrial Automation. In Proceedings of the 2011 9th IEEE International Conference on Industrial Informatics, Lisbon, Portugal, 26–29 July 2011; pp. 410–415. [Google Scholar]
  16. Baumann, D.; Mager, F.; Wetzker, U.; Thiele, L.; Zimmerling, M.; Trimpe, S. Wireless Control for Smart Manufacturing: Recent Approaches and Open Challenges. Proc. IEEE 2020, 109, 441–467. [Google Scholar] [CrossRef]
  17. Siegl, S. Networked Control Systems: Ein Überblick; Universität der Bundeswehr München: München, Germany, 2017. [Google Scholar]
  18. Gupta, R.A.; Chow, M.-Y. Networked Control System: Overview and Research Trends. IEEE Trans. Ind. Electron. 2010, 57, 2527–2535. [Google Scholar] [CrossRef]
  19. Xia, F.; Tian, Y.-C.; Li, Y.; Sung, Y. Wireless Sensor/Actuator Network Design for Mobile Control Applications. Sensors 2007, 7, 2157–2173. [Google Scholar] [CrossRef] [PubMed]
  20. Chow, M.-Y.; Tipsuwan, Y. Network-based control systems: A tutorial. In Proceedings of the IECON’01. 27th Annual Conference of the IEEE Industrial Electronics Society (Cat. No. 37243), Denever, CO, USA, 29 November–2 December 2001; pp. 1593–1602. [Google Scholar]
  21. Ploplys, N.J.; Kawka, P.A.; Alleyne, A.G. Closed-Loop Control over Wireless Networks. IEEE Control. Syst. Mag. 2004, 24, 58–71. [Google Scholar]
  22. Varghese, A.; Tandur, D. Wireless Requirements and Challenges in Industry 4.0. In Proceedings of the 2014 International Conference on Contemporary Computing and Informatics (IC3I), Mysuru, India, 27–29 November 2014; pp. 634–638. [Google Scholar]
  23. Ikram, W.; Jansson, N.; Harvei, T.; Aakvaag, N.; Halvorsen, I.; Petersen, S.; Carlsen, S.; Thornhill, N.F. Wireless Communication in Process Control Loop: Requirements Analysis, Industry Practices and Experimental Evaluation. In Proceedings of the 2014 IEEE Emerging Technology and Factory Automation (ETFA), Barcelona, Spain, 16–19 September 2014; pp. 1–8. [Google Scholar]
  24. Kiesel, R.; Jakob, F.; Vollmer, T.; Schmitt, R.H. Evaluation of ICT for Networked Control Systems of Latency-Critical Applications in Production. In Proceedings of the 15th CIRP Conference on Intelligent Computation in Manufacturing Engineering, Gulf of Naples, Italy, 14–16 July 2021. [Google Scholar]
  25. Yilmaz, O.N.; Wang, Y.-P.E.; Johansson, N.A.; Brahmi, N.; Ashraf, S.A.; Sachs, J. Analysis of ultra-reliable and low-latency 5G communication for a factory automation use case. In Proceedings of the 2015 IEEE International Conference on Communication Workshop (ICCW) 2015, London, UK, 8–12 June 2015; pp. 1190–1195. [Google Scholar]
  26. Rauchhaupt, L.; Meier, U. Performance Classes for Industrial Wireless Application Profiles and its Determination. In Proceedings of the 2013 IEEE 18th Conference on Emerging Technologies & Factory Automation (ETFA), Cagliari, Italy, 10–13 September 2013; pp. 1–8. [Google Scholar]
  27. Wollschlaeger, M.; Sauter, T.; Jasperneite, J. The future of Industrial Communication: Automation Networks in the Era of the Internet of Things and Industry 4.0. IEEE Ind. Electron. Mag. 2017, 11, 17–27. [Google Scholar] [CrossRef]
  28. Sikora, A.; Groza, V.F. Coexistence of IEEE802. 15.4 with other Systems in the 2.4 GHz-ISM-Band. In Proceedings of the 2005 IEEE Instrumentationand Measurement Technology Conference Proceedings, Ottawa, ON, Canada, 16–19 May 2005; pp. 1786–1791. [Google Scholar]
  29. Aijaz, A.; Sooriyabandara, M. The Tactile Internet for Industries: A Review. Proc. IEEE 2019, 107, 414–435. [Google Scholar] [CrossRef]
  30. Ancans, G.; Stafecka, A.; Bobrovs, V.; Ancans, A.; Caiko, J. Analysis of Characteristics and Requirements for 5G Mobile Communication Systems. Latv. J. Phys. Tech. Sci. 2017, 54, 69–78. [Google Scholar] [CrossRef] [Green Version]
  31. Chen, H.; Abbas, R.; Cheng, P.; Shirvanimoghaddam, M.; Hardjawana, W.; Bao, W.; Li, Y.; Vucetic, B. Ultra-Reliable Low Latency Cellular Networks: Use Cases, Challenges and Approaches. IEEE Commun. Mag. 2018, 56, 119–125. [Google Scholar] [CrossRef] [Green Version]
  32. Del Peral-Rosado, J.A.; Raulefs, R.; López-Salcedo, J.A.; Seco-Granados, G. Survey of cellular mobile radio localization methods: From 1G to 5G. IEEE Commun. Surv. Tutor. 2017, 20, 1124–1148. [Google Scholar] [CrossRef]
  33. Peng, X.; Zhang, X.; Luo, Z. Pythagorean fuzzy MCDM Method based on CoCoSo and CRITIC with Score Function for 5G Industry Evaluation. Artif. Intell. Rev. 2019, 35, 1–35. [Google Scholar] [CrossRef]
  34. Radnosrati, K.; Fritsche, C.; Gunnarsson, F.; Gustafsson, F.; Hendeby, G. Localization in 3GPP LTE based on one RTT and one TDOA Observation. IEEE Trans. Veh. Technol. 2020, 69, 3399–3411. [Google Scholar] [CrossRef]
  35. Verband der Elektrotechnik e.V. Funktechnologien für Industrie 4.0. Positionspapier; Frankfurt am Main, Germany. 2017. Available online: https://www.vde.com/resource/blob/1635512/acf5521beb328d25fffda9fc6a723501/positionspapier-funktechnologien-data.pdf (accessed on 6 January 2022).
  36. Aijaz, A. Private 5G: The Future of Industrial Wireless. IEEE Ind. Electron. Mag. 2020, 14, 136–145. [Google Scholar] [CrossRef]
  37. Caruso, G.; Nucci, F.; Gordo, O.P.; Rizou, S.; Magen, J.; Agapiou, G.; Trakadas, P. Embedding 5G solutions enabling new business scenarios in Media and Entertainment Industry. In Proceedings of the 2019 IEEE 2nd 5G World Forum (5GWF), Dresden, Germany, 30 September 2019; pp. 460–464. [Google Scholar]
  38. Pelsa, J.; Persson, P.; Parkvall, S.; Dahlman, E.; Grovlen, A.; Hoymann, C.; Gerstenberger, D. 5G Evolution: 3GPP Releases 16 & 17 Overview. Ericsson Technol. Rev. 2020, 6, 2–13. [Google Scholar]
  39. McKinsey & Company. The 5G Era—New Horizons for Advanced Electronics and Industrial Companies; McKinsey & Company: Munich, Germany, 2020. [Google Scholar]
  40. Schulz, P.; Matthe, M.; Klessig, H.; Simsek, M.; Fettweis, G.; Ansari, J.; Ashraf, S.A.; Almeroth, B.; Voigt, J.; Riedel, I. Latency critical IoT applications in 5G: Perspective on the design of radio interface and network architecture. IEEE Commun. Mag. 2017, 55, 70–78. [Google Scholar] [CrossRef]
  41. Doukoglou, T.; Gezerlis, V.; Trichias, K.; Kostopoulos, N.; Legouable, R.; Vrakas, N.; Bougioukos, M. Vertical Industries Requirements Analysis & Targeted KPIs for Advanced 5G Trials. In Proceedings of the European Conference on Networks and Communications (EuCNC), Valencia, Spain, 18–21 June 2019. [Google Scholar]
  42. International Telecommunication Union. Recommendation ITU-R M.2083-0: IMT Vision—Framework and Overall Objectives of the Future Development of IMT for 2020 and Beyond; Geneva, Switzerland. 2015. Available online: https://mioa.gov.mk/sites/default/files/pbl_files/documents/strategies/recommendation_itu-r_m.2083-0.pdf (accessed on 6 January 2022).
  43. 3rd Generation Partnership Project. TS 22.261—Technical Specification Group Services and System Aspects: Service Requirements for the 5G System. Release 17; Valbonne, France. 2019. Available online: https://portal.3gpp.org/desktopmodules/Specifications/SpecificationDetails.aspx?specificationId=3107 (accessed on 6 January 2022).
  44. Kiesel, R.; Böhm, F.; Pennekamp, J.; Schmitt, R.H. Development of a Model to Evaluate the Potential of 5G Technology for Latency-Critical Applications in Production. In Proceedings of the IEEE International Conference on Industrial Engineering and Engineering Management (IEEM) 2021, Singapore, 13–16 December 2021. [Google Scholar]
  45. Ulrich, P.; Hill, W. Wissenschaftstheoretische Grundlagen der Betriebswirtschaftslehre. Wirtschaftswissenschaftliches Studium: Zeitschrift für Ausbildung und Hochschulkontakt 1976, 5, 304–309. [Google Scholar]
  46. Kiesel, R.; van Roessel, J.; Schmitt, R.H. Quantification of Economic Potential of 5G for Latency Critical Applications in Production. Procedia Manuf. 2020, 52, 113–120. [Google Scholar] [CrossRef]
  47. Kiesel, R.; Stichling, K.; Hemmers, P.; Vollmer, T.; Schmitt, R.H. Quantification of Influence of 5G Technology Implementation on Process Performance in Production. In Proceedings of the 54th CIRP Conference on Manufacturing Systems, Athen, Greece, 22–24 September 2021; pp. 104–109. [Google Scholar]
  48. Selmar, M.; Hauers, S.; Gustafsson-Ende, L. Scheduling charging operations of autonomous AGVs in automotive in-house logistics. In Proceedings of the Simulation in Production and Logistics, Chemnitz, Germany, 18–20 September 2019. [Google Scholar]
  49. Oughton, E.J.; Frias, Z.; van der Gaast, S.; van der Berg, R. Assessing the capacity, coverage and cost of 5G infrastructure strategies: Analysis of the Netherlands. Telemat. Inform. 2019, 37, 50–69. [Google Scholar] [CrossRef]
  50. Vergleich.de. Strompreise Dezember 2021: Das Kostet Strom Aktuell in Deutschland. Available online: https://www.vergleich.de/strompreise.html (accessed on 2 January 2022).
  51. Statista. Inflationsrate in Deutschland von November 2020 bis November 2021. Available online: https://de.statista.com/statistik/daten/studie/1045/umfrage/inflationsrate-in-deutschland-veraenderung-des-verbraucherpreisindexes-zum-vorjahresmonat/ (accessed on 2 January 2022).
Figure 1. Difference between decentralized and centralized AGV control.
Electronics 11 00192 g001
Figure 2. Architecture of a networked control system.
Electronics 11 00192 g002
Figure 3. Timing diagram of a networked control system.
Electronics 11 00192 g003
Figure 4. Maximum performance characteristics of fourth- and fifth-generation (4G and 5G) technology.
Electronics 11 00192 g004
Figure 5. Chapter structure and evaluation approach for techno-economic evaluation of 5G technology for AGV according to [44].
Electronics 11 00192 g005
Figure 6. Layout of the AGV use case in the Digital Experience Factory Aachen.
Electronics 11 00192 g006
Figure 7. 5G-improved and enabled control tasks.
Electronics 11 00192 g007
Figure 8. Influence on technical goals of 5G compared to 4G.
Electronics 11 00192 g008
Figure 9. Influence on net present values (NPV) of 5G compared to 4G (only operational costs and benefits).
Electronics 11 00192 g009
Table 1. Technical goals when implementing 5G technology in production [47].
GoalDescriptionKey Performance IndicatorTrend
FlexibilityAbility to process diff. parts in one manufacturing systemMachine Flexibility (MF)Max
Setup Ratio (SUR)Min
MobilityAbility of moving and replacing
objects on the shopfloor
Material Handling Mobility (MHM)Max
Space Productivity (SP)Max
ProductivityOutput per unit of input over a specific period; also: production efficiencyEffectiveness (E)Max
Throughput Ratio (TR)Max
Worker Efficiency (WE)Max
QualityDegree to which the output
of the production process
meets the requirements
First Pass Yield (FPY)Max
Quality Ratio (QR)Max
Rework Ratio (RR)Min
Scrap Ratio (SR)Min
SafetyAbility of a system to protect itself and the operator from
harm or accidents
Accident Ratio (ACCR)Min
Mean Time Between Failures (MTBF)Max
Mean Time To Repair (MTTR)Min
SustainabilityLevel to which the creation of manufactured products is fulfilled by processes that are nonpollutingCompressed Air Consumption Ratio (ACR)Min
Electric Power Consumption Ratio (ECR)Min
Gas Consumption Ratio (GCR)Min
Water Consumption Ratio (WCR)Min
UtilizationRatio of actual used machining time compared to the theoretically available timeAllocation Efficiency (AE)Max
Availability (A)Max
Technical Efficiency (TE)Max
Utilization Efficiency (UE)Max
Table 2. Technical goals when implementing 5G technology in production.
Control Task [Unit]Formula Symbol4G-Value5G-Value
Straight Drive Speed [m/s] v Straight 1.001.10
Curve Speed [m/s] v Curve 0.500.55
Crossing Speed [m/s] v Crossing 0.750.80
On- and Off-Loading Time [s] t Loading 300280
Table 3. Evaluation data for the AGV use case.
Data [Unit]ValueData TypeData SourceGoal
MobilityProductivitySafetyNPV and RoI
Battery—Capacity [Ah]5000ApplicationAGV xxx
Battery—Duration per charge [h]0.500ApplicationAGV xxx
Battery—Operation time per charge [h]4.0Application[48] xxx
Battery—Voltage [V]230ApplicationAGV xxx
Area—Rework area [sqm]10,000FacilityUCx
Area—Storage area [sqm]5000FacilityUCx
Area—Total plant area [sqm]30,000FacilityUCx
Electric power—Consump. of 4G/5G p. sec. [kWh]0.01Facility[49] x
Electric power—Cost [€/kWh]0.30Facility[50] x
Paths with width over 5 m []7FacilityUCx
Paths with width between 3.5 m and 5 m []1FacilityUCx
Paths—Total []8FacilityUCx
FE-Long-Term—Time to Repair per Failure [s]5400FailureUC xxx
FE-Short Term—Time to Repair per Failure [s]5.00FailureUC xxx
FE—Hourly Wage of Repair Staff [€]20.00FailureUC x
Accidents—Average Compensation Cost [€]5000FailureUC x
Accidents—Material Cost to Repair Application [€]1000FailureUC x
Application Downtime (Unplanned)—Cost [€/h]9000ProcessUC xxx
Application Maintenance—Time per Operations [s]3600ProcessUC xxx
Application Operation Time—Planned [s]57,600ProcessUC xxx
Application Setup—Hourly Wage of Setup Staff [€]15.00ProcessUC x
Application Setup—Number per Day []1.00ProcessUC xxx
Application Setup—Time per Setup [s]8280ProcessUC xxx
Batch Size []4ProcessUC xxx
Human Operation—Hourly Wage of Staff [€]15.00ProcessUC x
Human Operation—Operator per Shift []1ProcessUC x
Human Operation—Planned Break Time p. Shift [h]0.50ProcessUC xxx
Human Operation—Planned Work Time p. Shift [h]8.00ProcessUC xxx
Human Operation—Shifts per Day []2.00ProcessUC xxx
Production—Days per Year []220ProcessASS xxx
Transport—Distance of Straight Drives [m]800.00ProcessUC xxx
Transport—Distance of Curves [m]20.00ProcessUC xxx
Transport—Distance of Crossings [m]10.00ProcessUC xxx
On- and Off-Loadings—Amounts per Route []1ProcessUC xxx
Quality Control-Inspection Percentage [%]100ProductUC xxx
Material—Cost per Part [€]120ProductUC x
Quality Control—Cost per Part [€]25ProductUC x
Products—Selling Price per Part [€]165ProductUC x
Annual Interest Rate [%] (Average Germany 2021)4.0Economic[51] x
Application Lifetime [Y]10EconomicAGV x
Table 4. Case analysis for the techno-economic 5G analysis for AGV.
Goal/Key Performance Indicator [Unit]—
Trend
Base CaseCase 1
Identical Availability
Case 2
Accidents Prevented by AGV
Technical∆Mobility [%]—max 12.8812.8812.88
 ∆MHM [%]—max 14.2914.2914.29
 ∆SP [%]—max11.4711.4711.47
∆Productivity [%]—max19.6819.3819.68
 ∆E [%]—max 0.330.31−0.05
 ∆TR [%]—max 9.149.1490.08
 ∆WE [%]—max 50.0450.0450.00
∆Safety [%]—max 136.2363.92103.01
 ∆ACCR [%]—min −98.81−98.810.00
 ∆MTBF [%]—max 213.18−0.09212.15
 ∆MTTR [%]—min −96.60−92.93−96.87
Economic∆NPV (10Y) [M€]—max 1.351.300.32
∆RoI [%]—max 66.6762.8510.92
∆OPEX/Product [€]—min −5.88−5.68−1.31
Publisher’s Note: MDPI stays neutral with regard to jurisdictional claims in published maps and institutional affiliations.

