
Framework for Predicting and Modeling Stock Market Prices Based on Deep Learning Algorithms


Abstract
:1. Introduction
2. Background of the Study
3. Materials and Methods
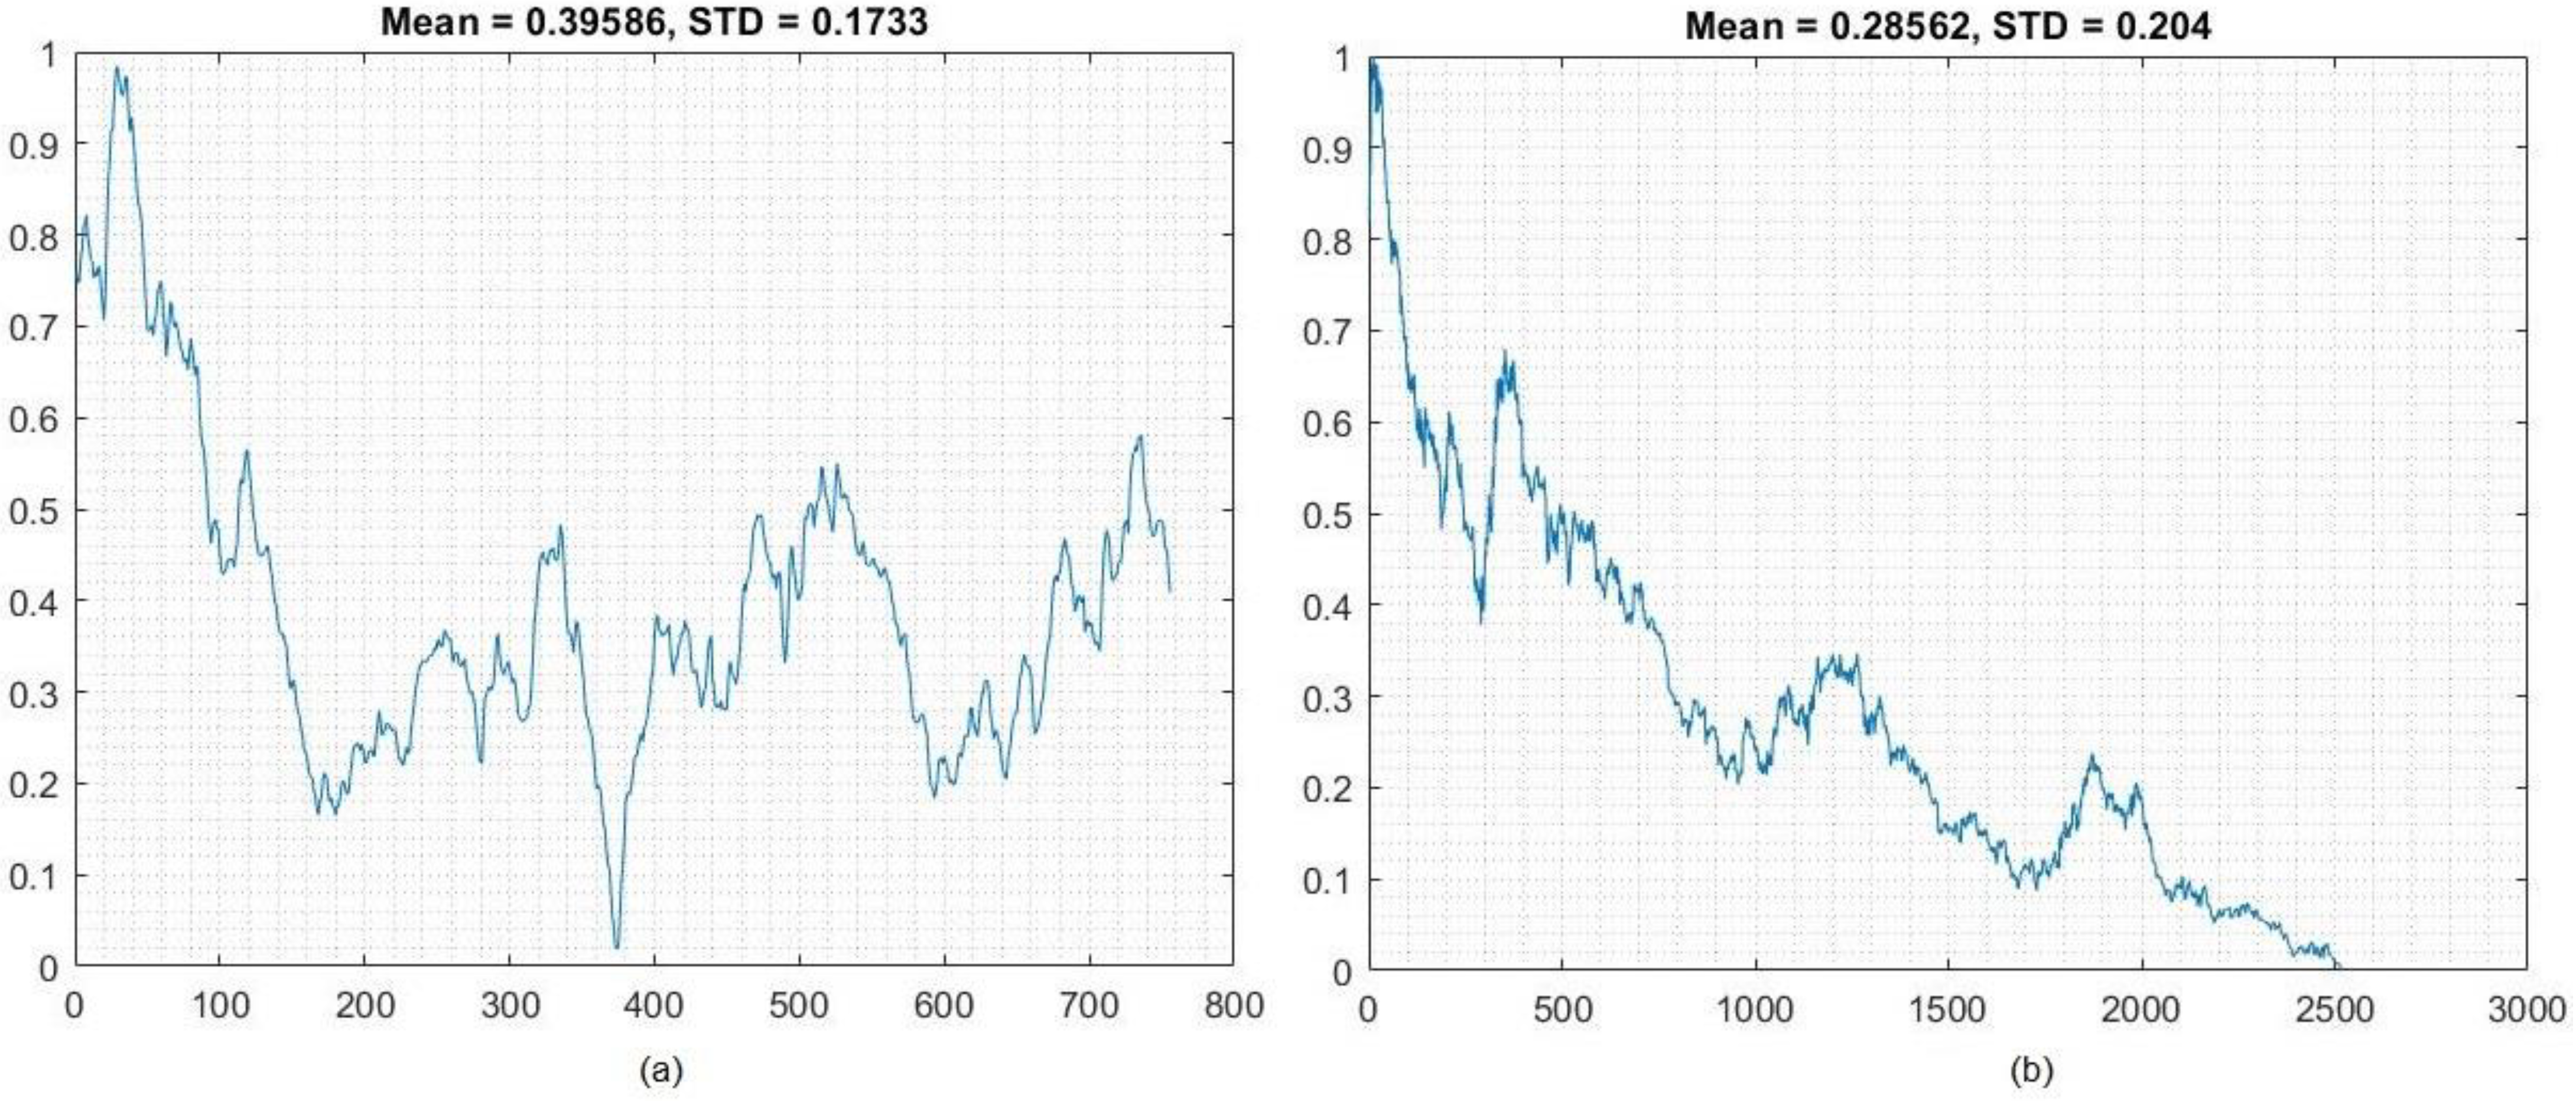
3.1. Dataset
3.1.1. Tesla, Inc. Data
3.1.2. Apple, Inc. Data
3.2. Normalization of Data
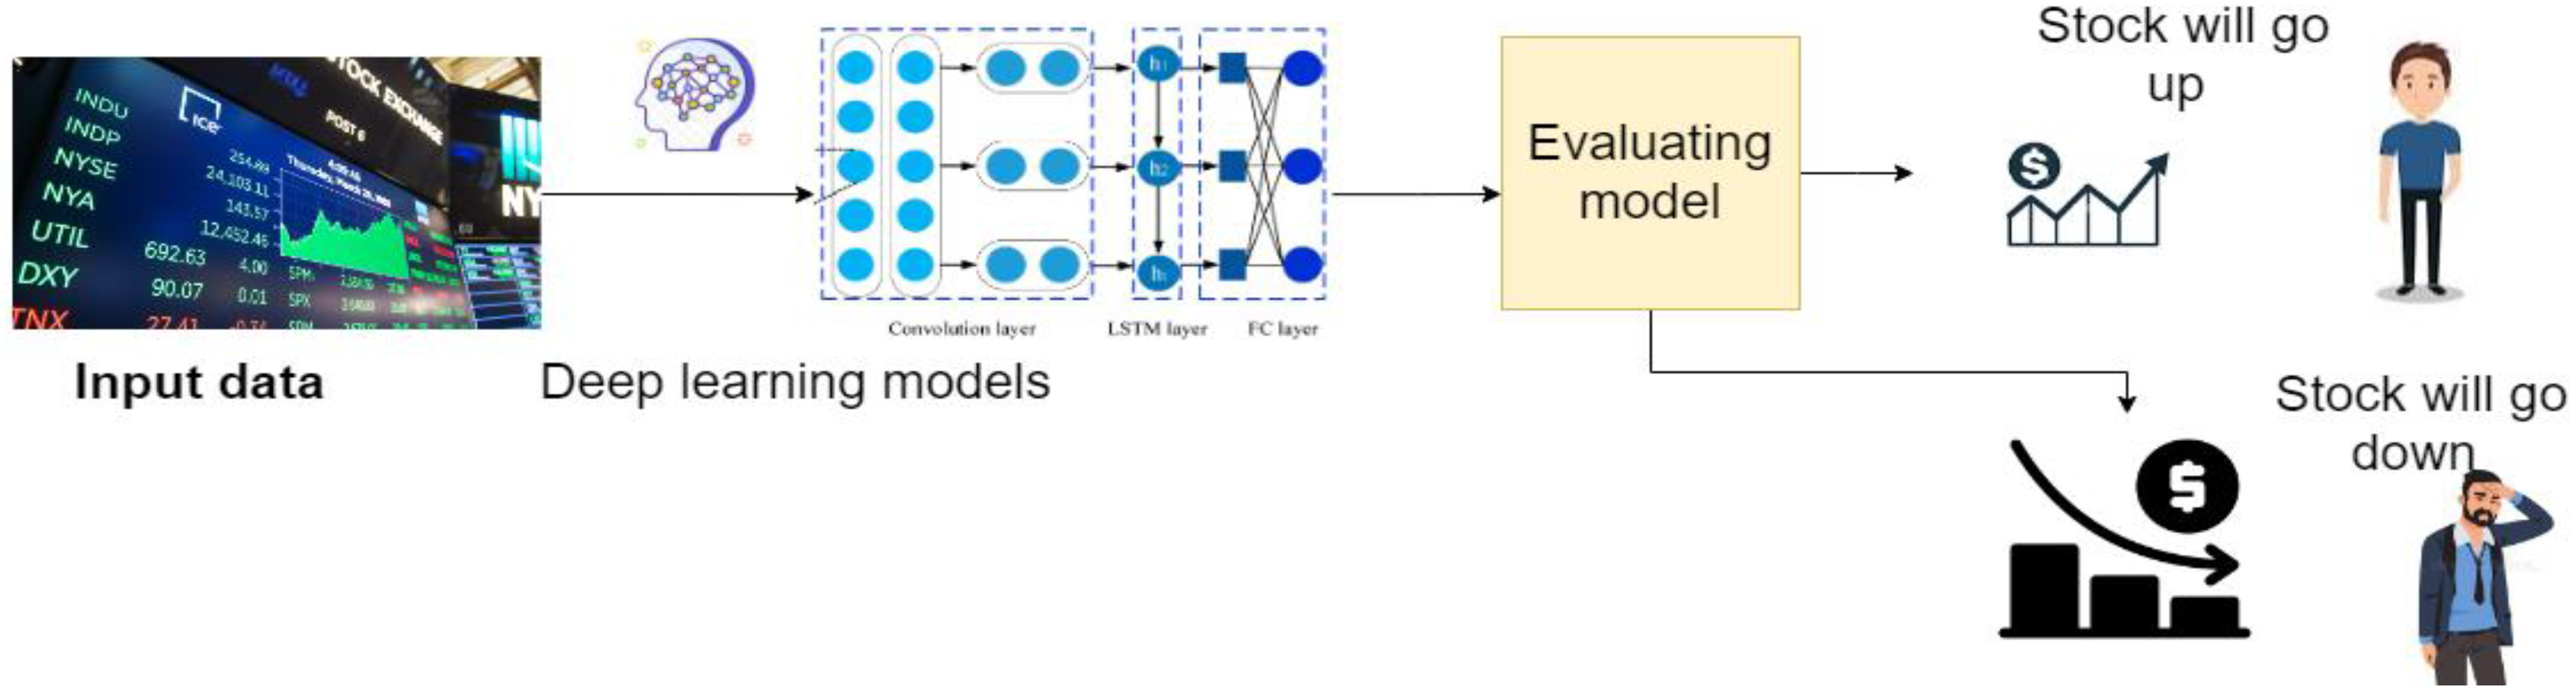
3.3. Prediction Models
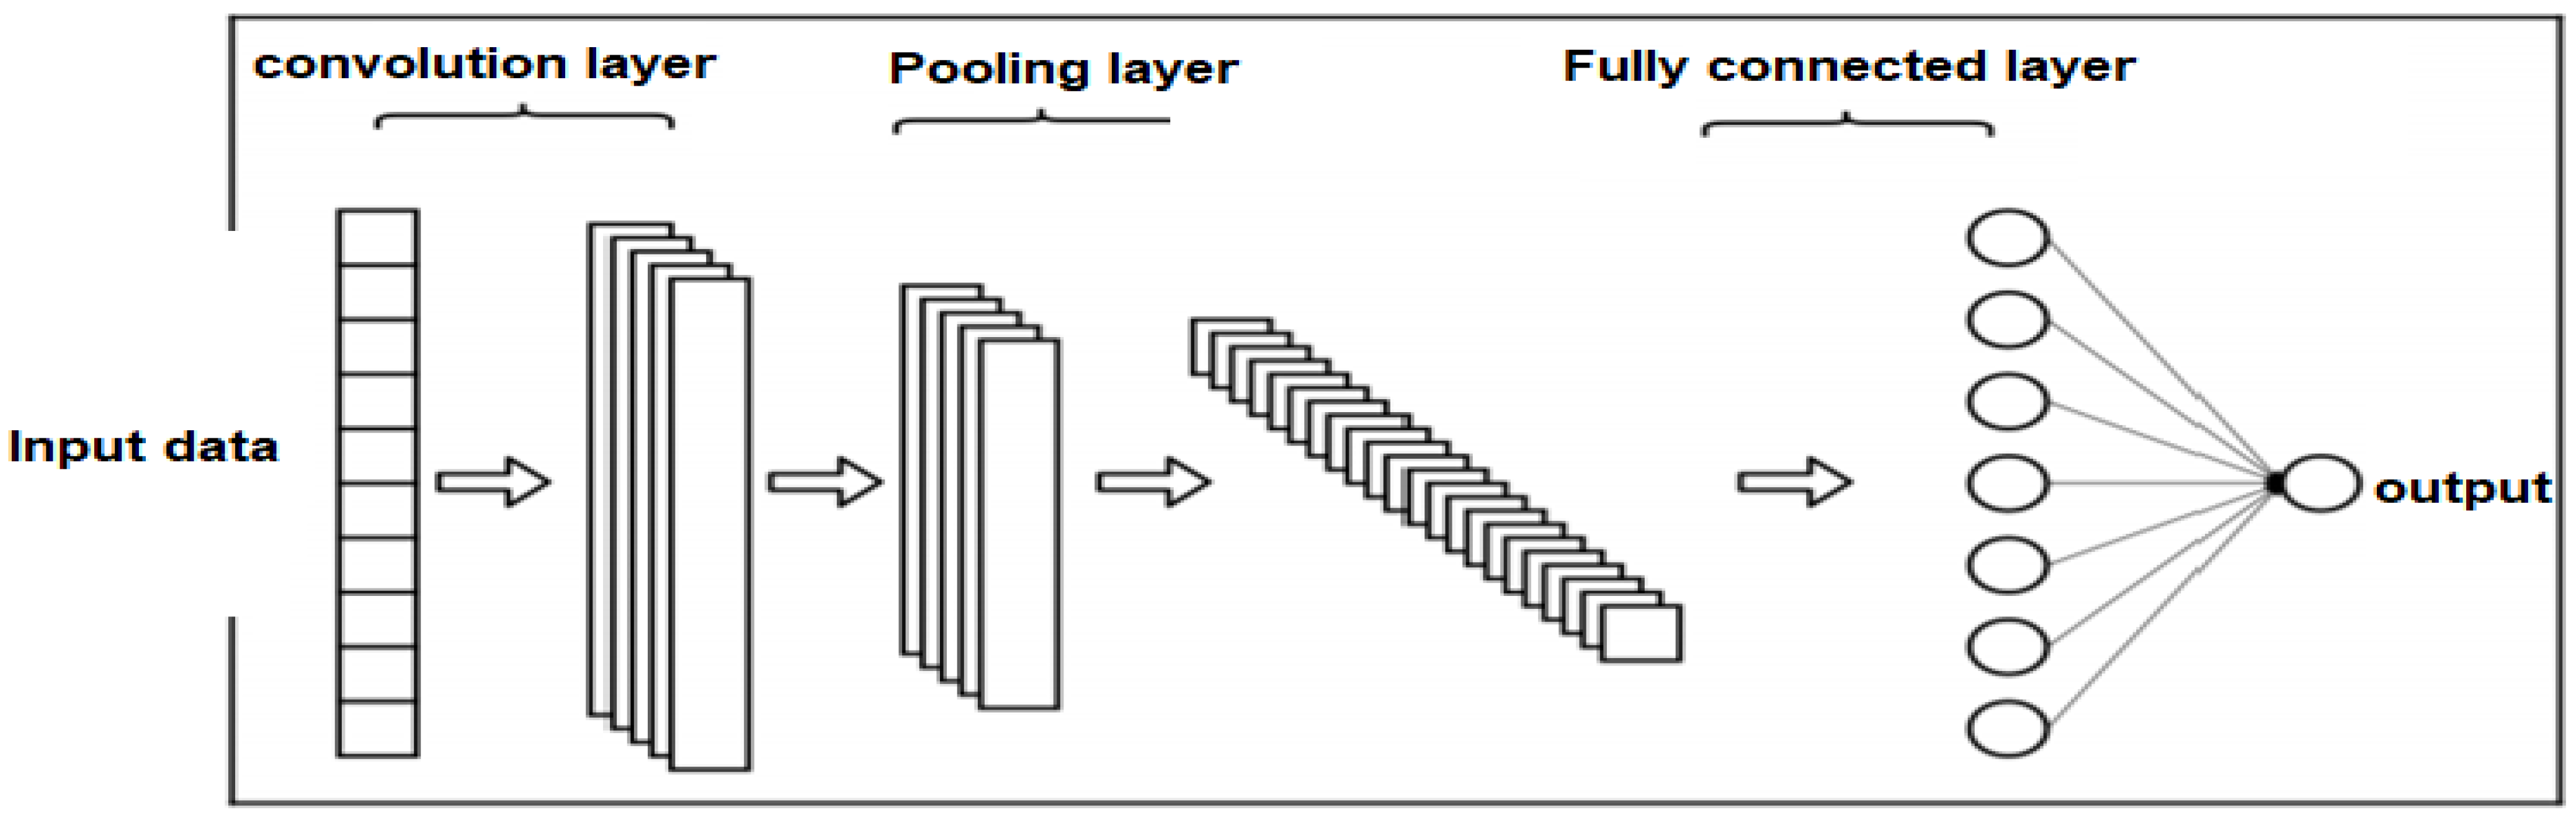
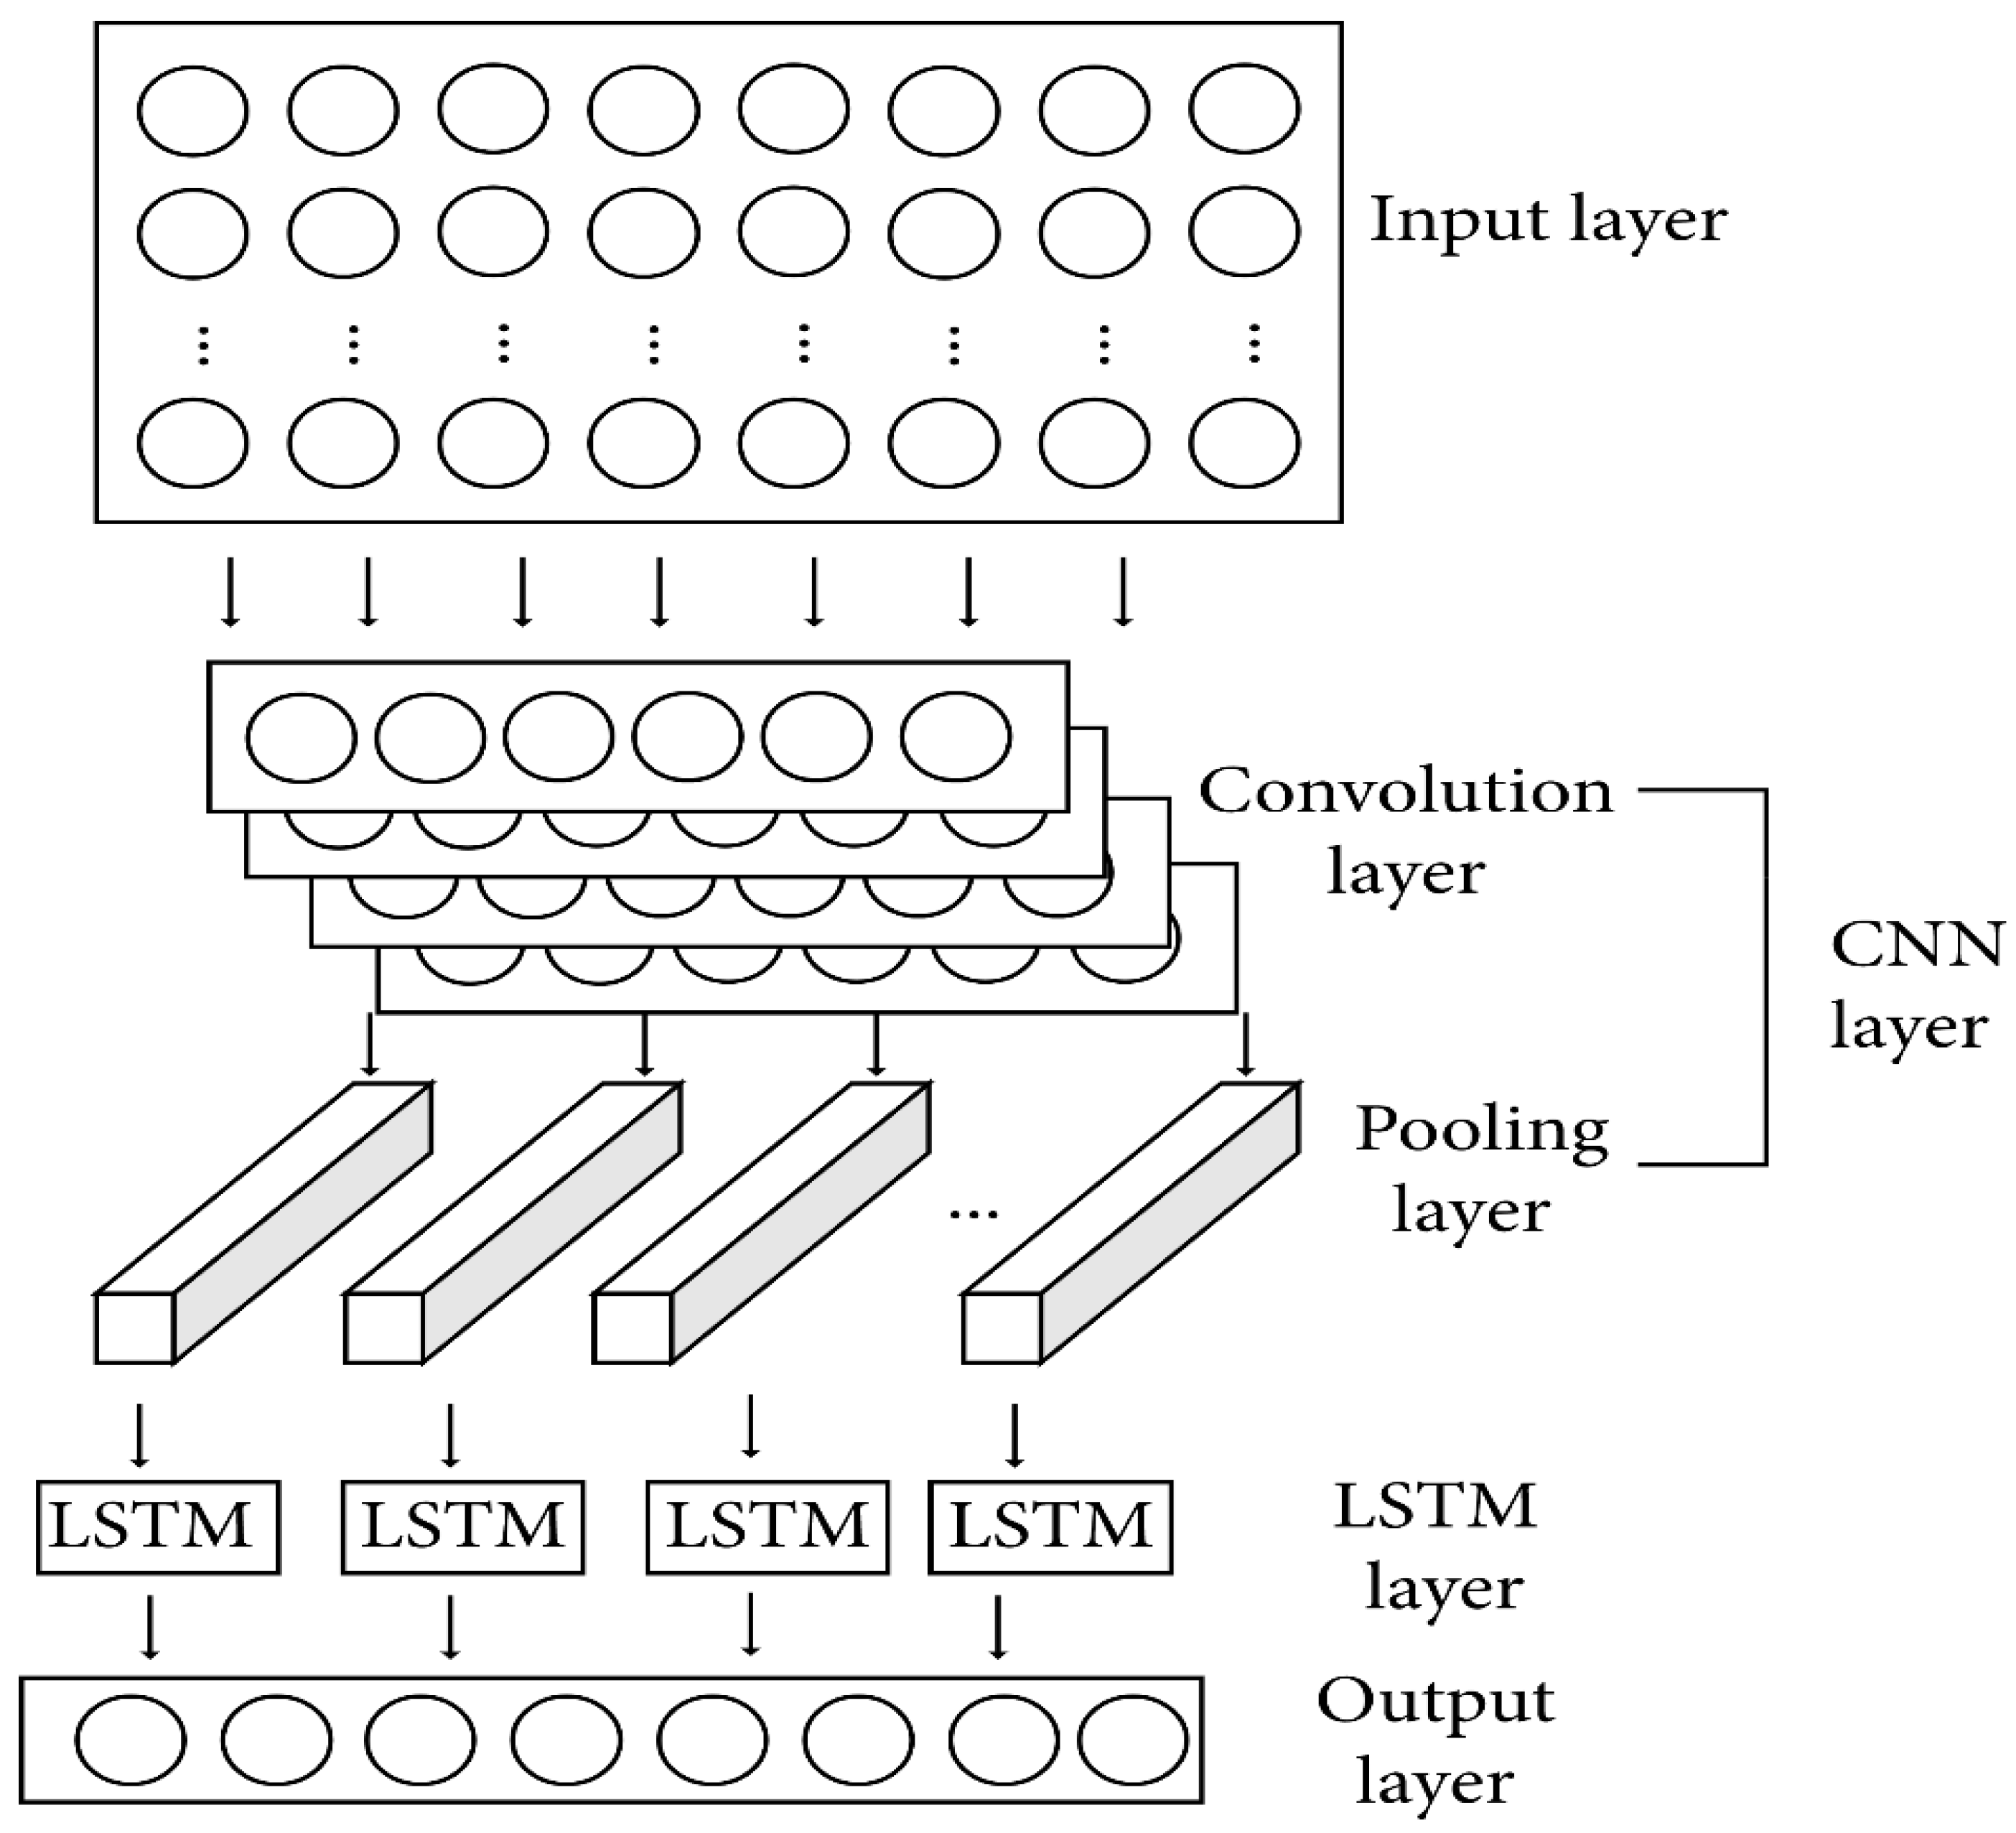
3.3.1. Convolutional Neural Networks (CNNs)
- (a)
- Convolution layer
- (b)
- Pooling layer
- (c)
- Fully Connected Layer (FC)
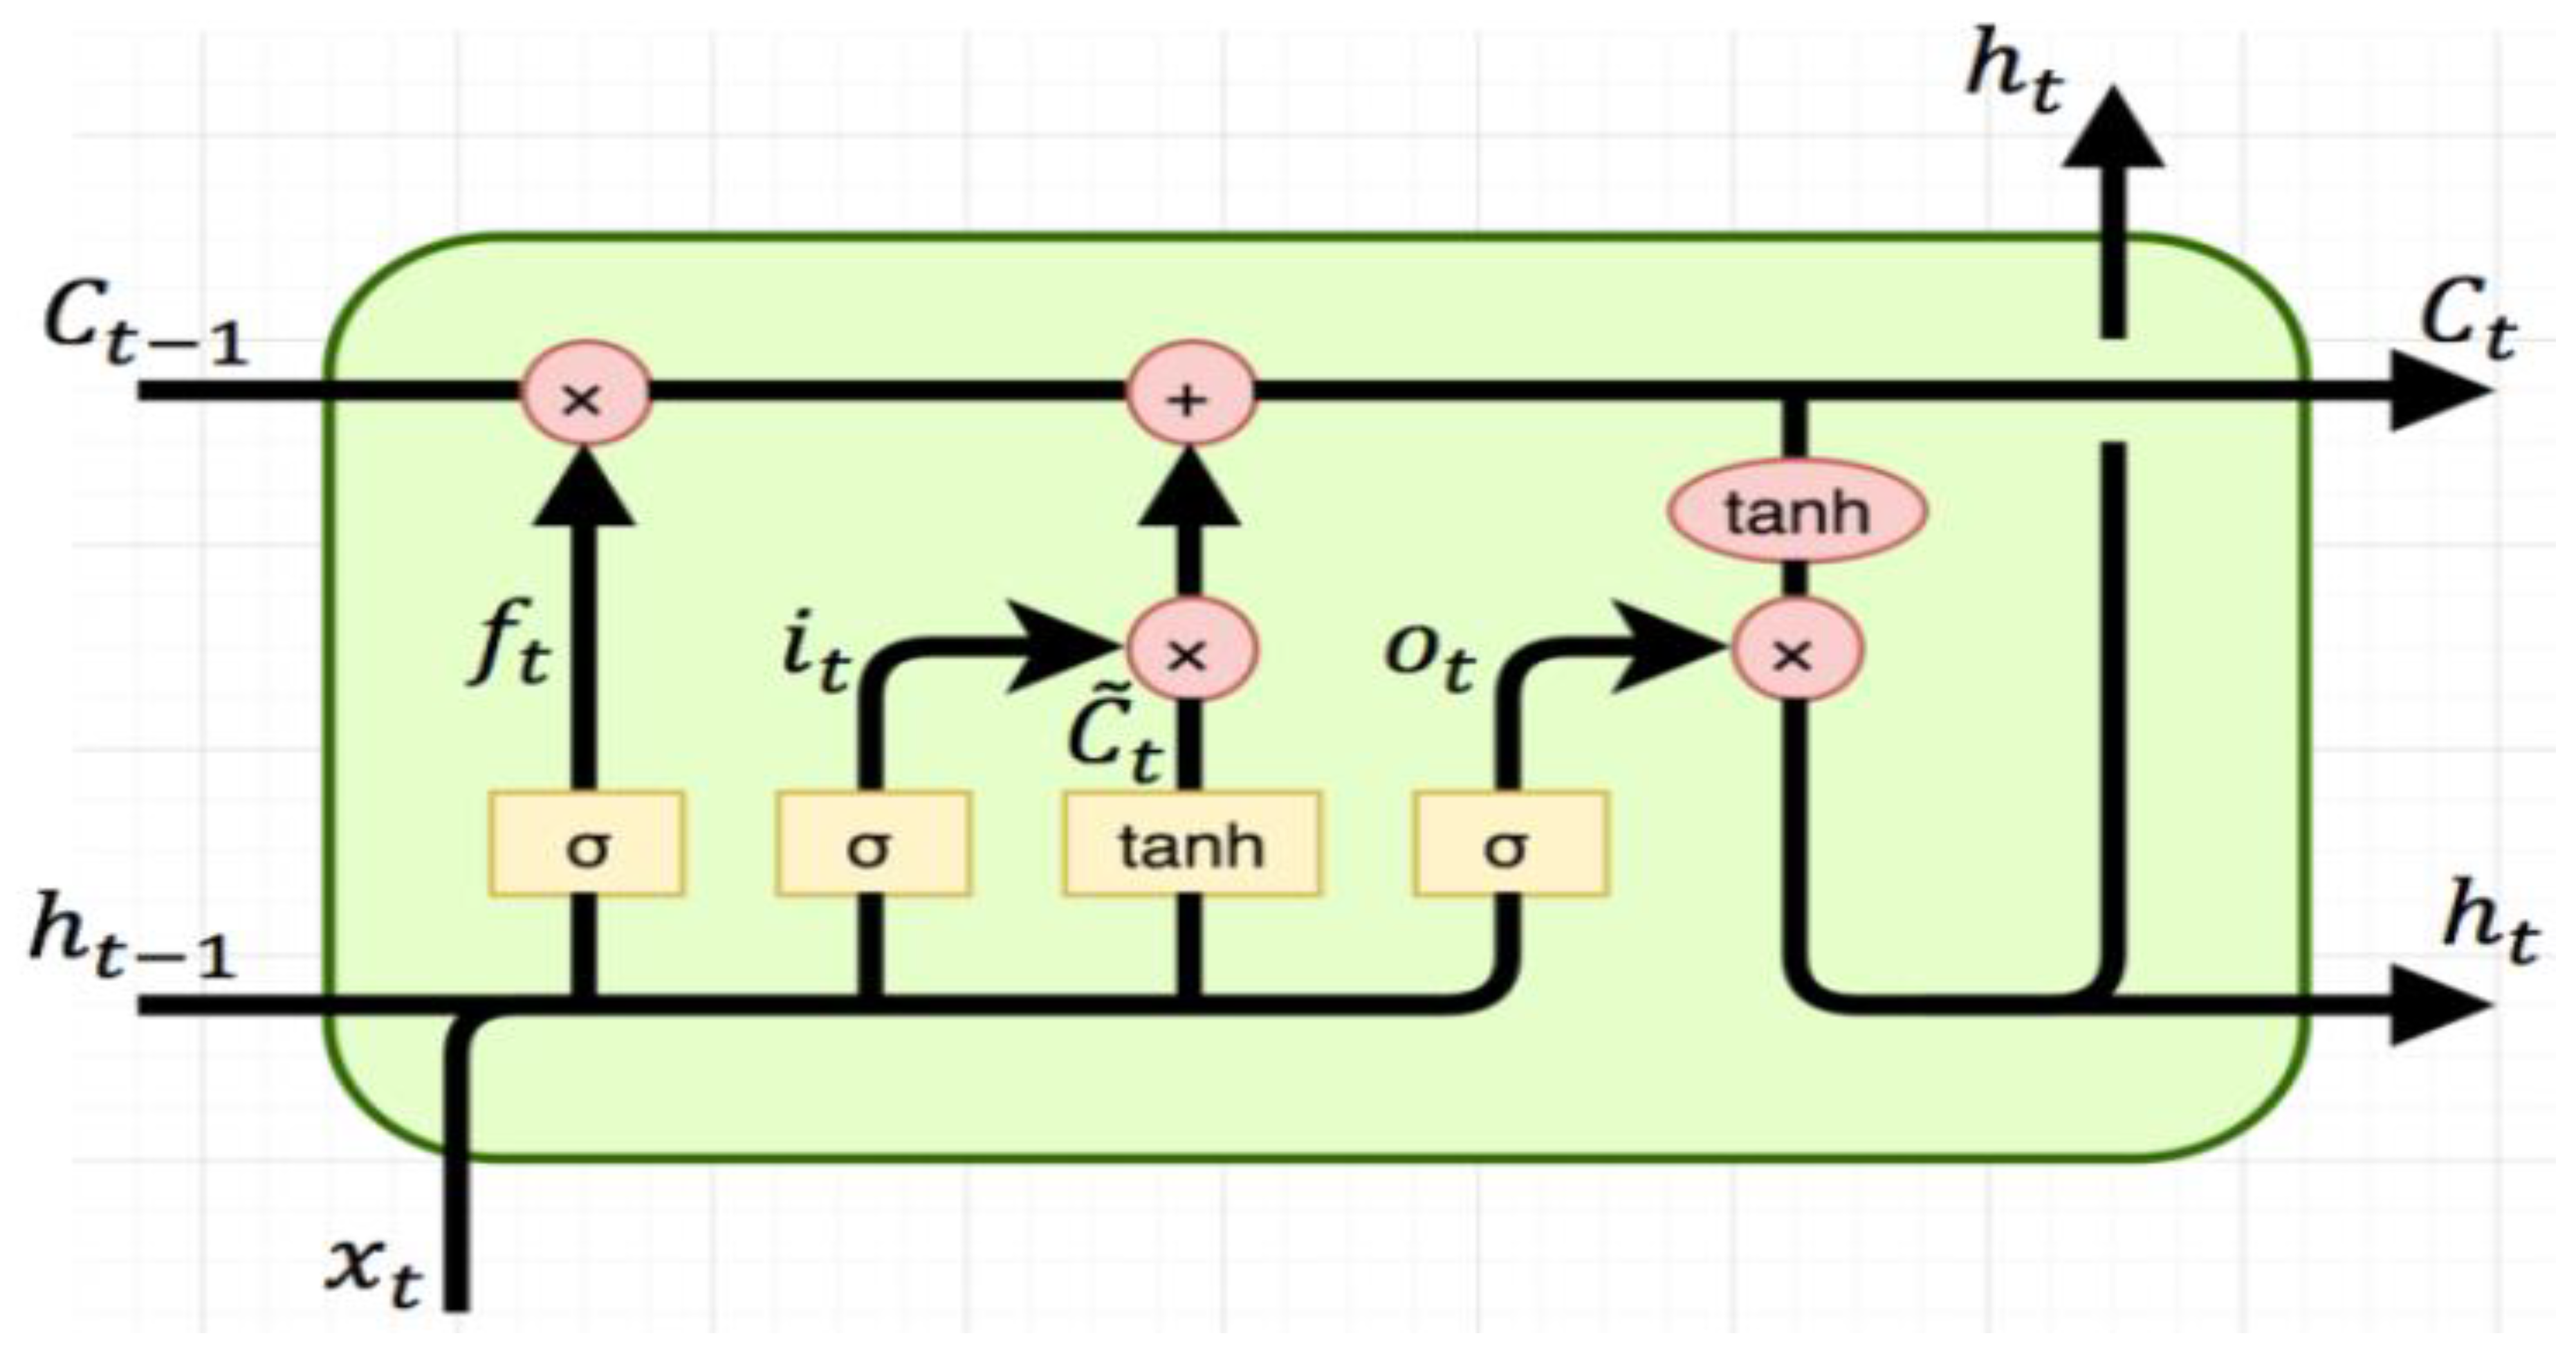
3.3.2. LSTM
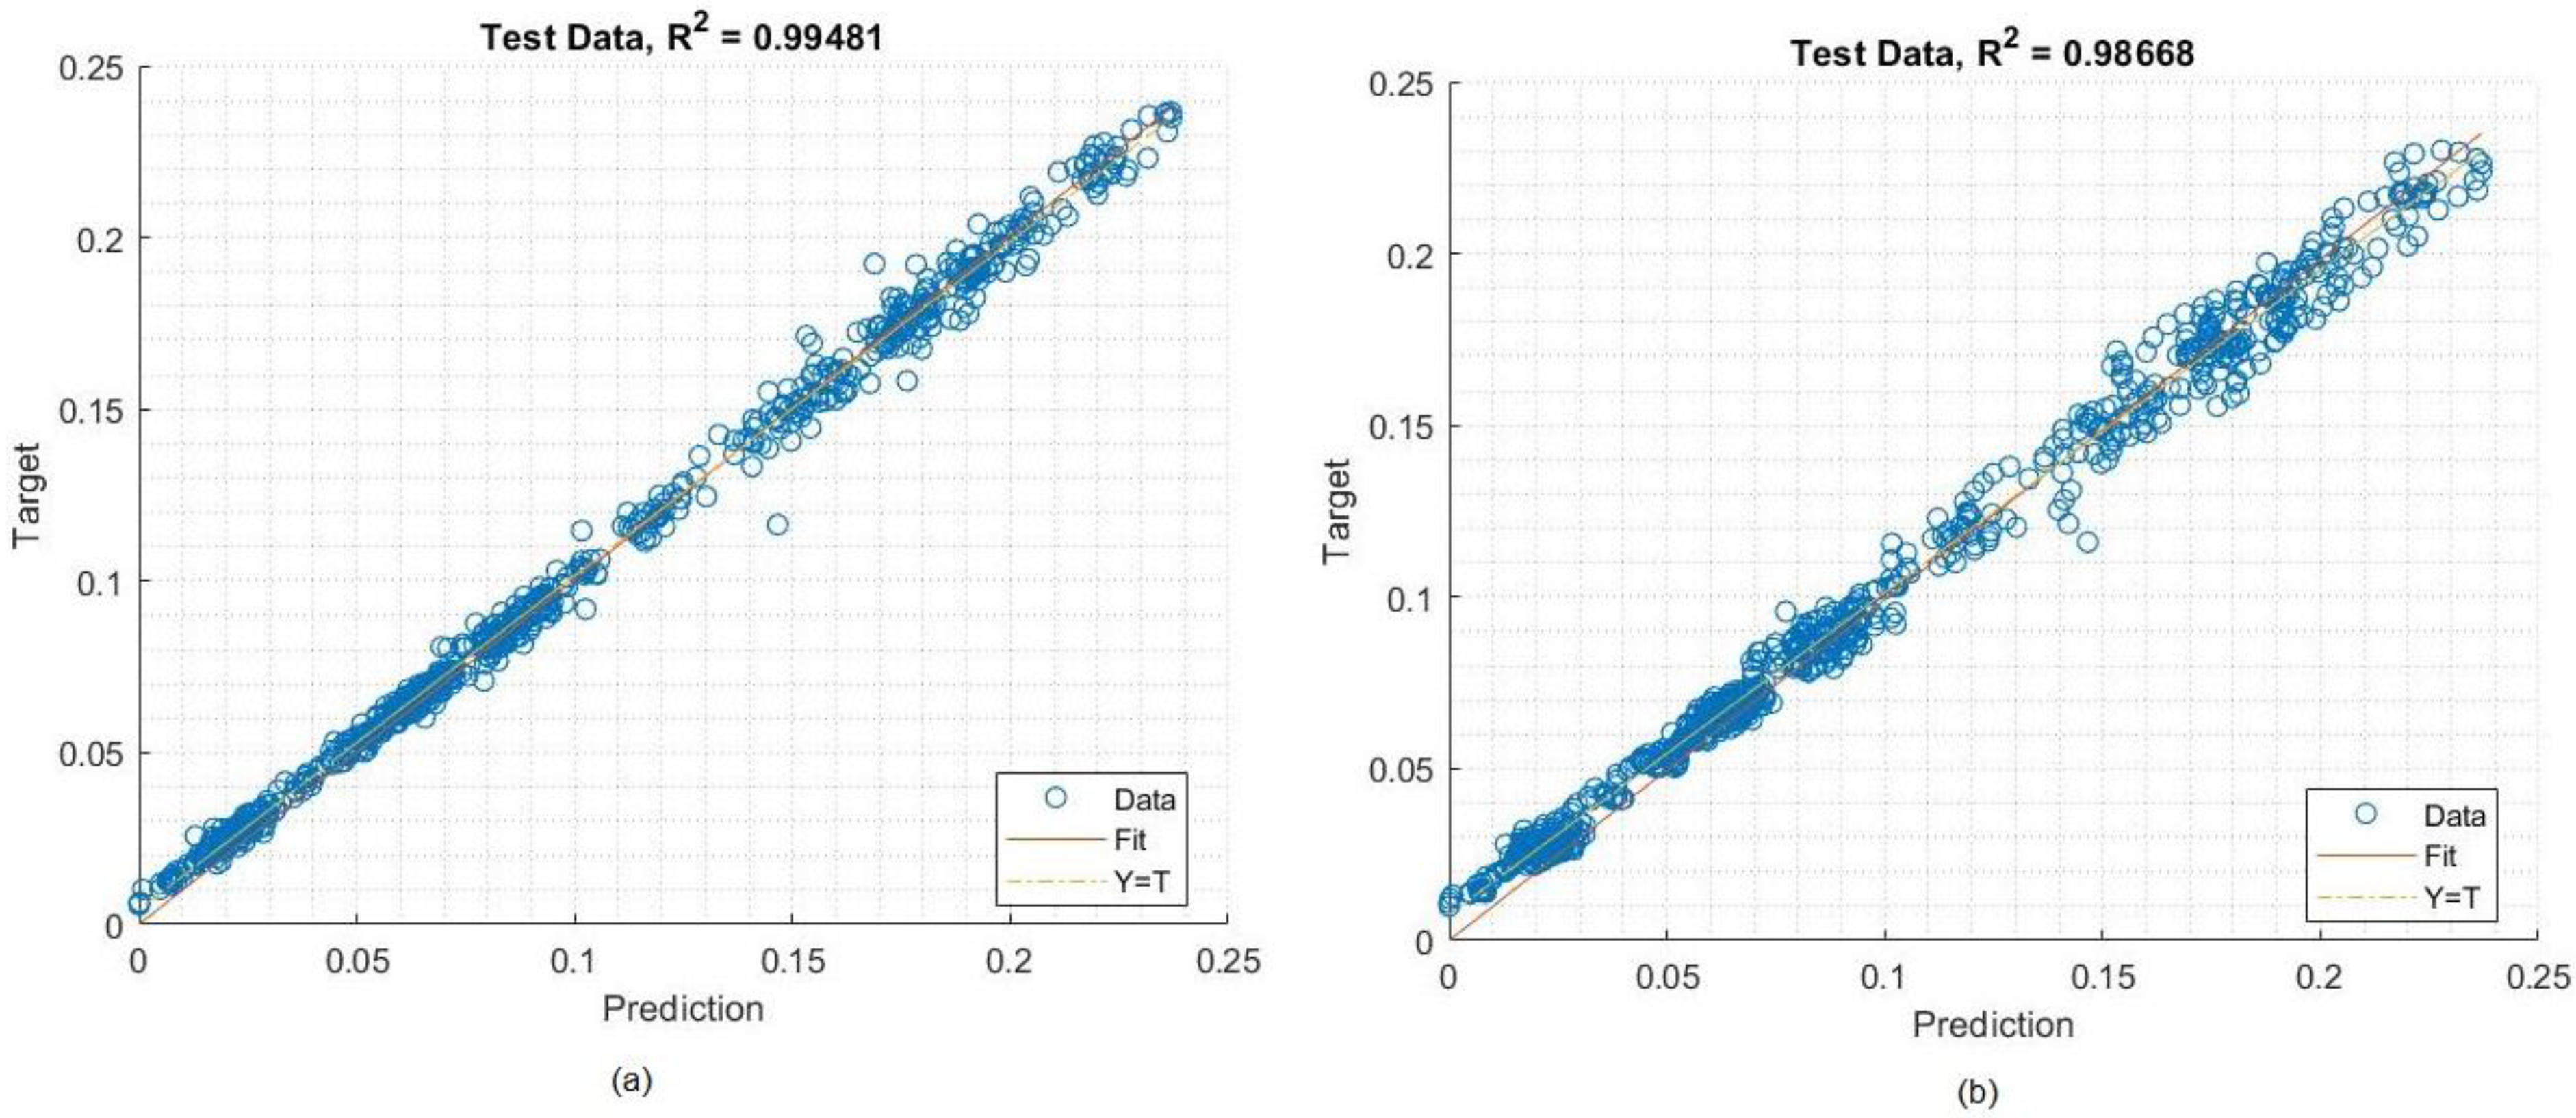
3.4. Evaluation Metrics
4. Experiments
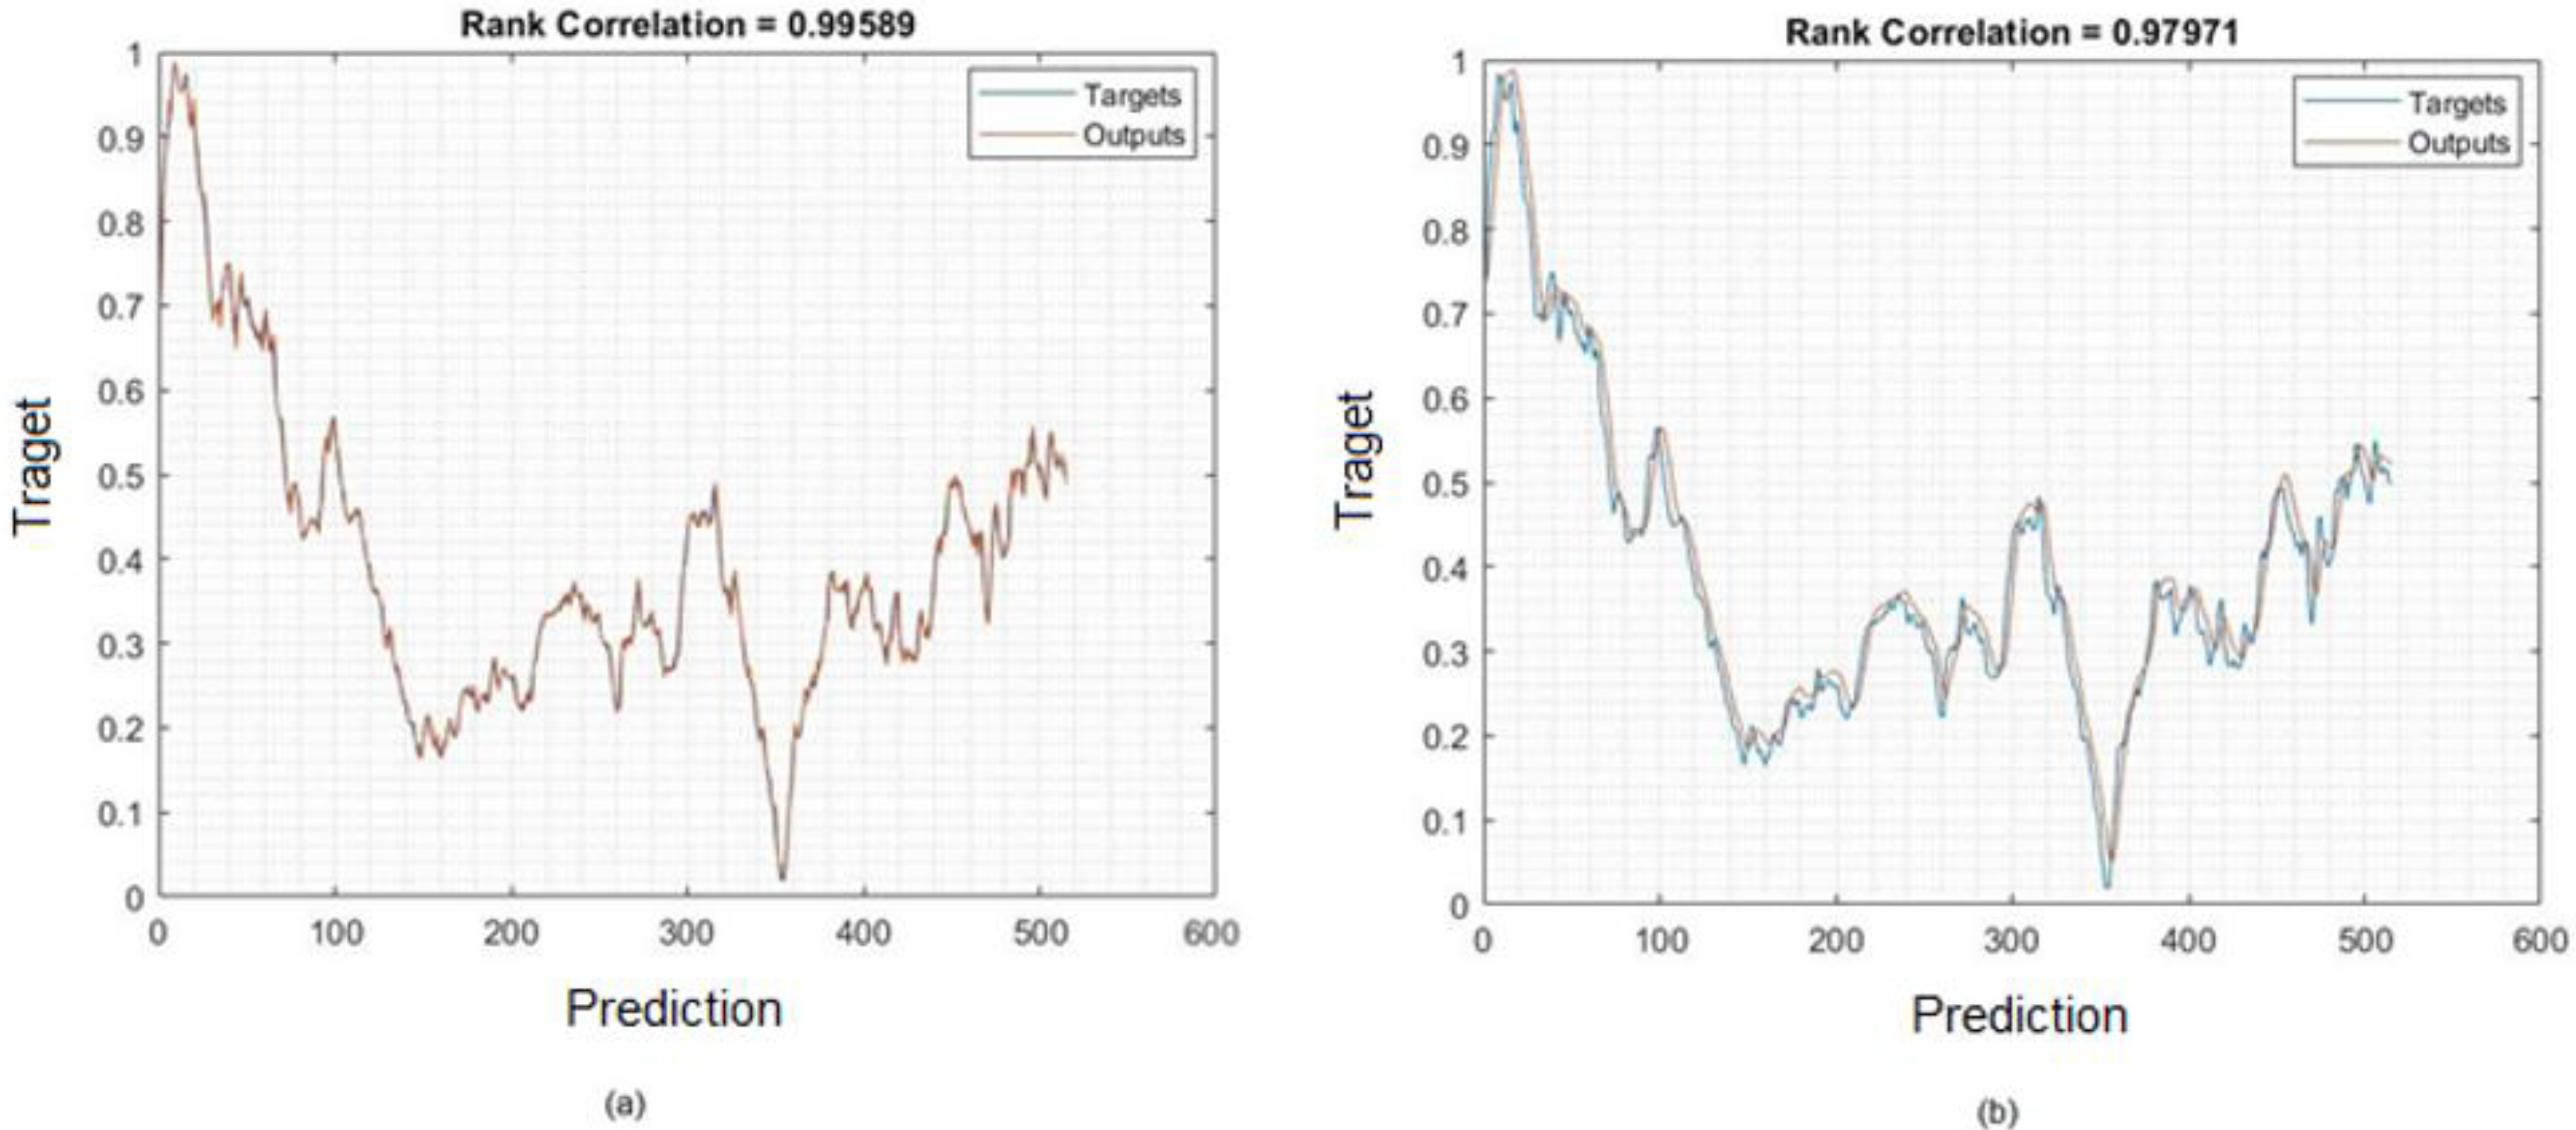
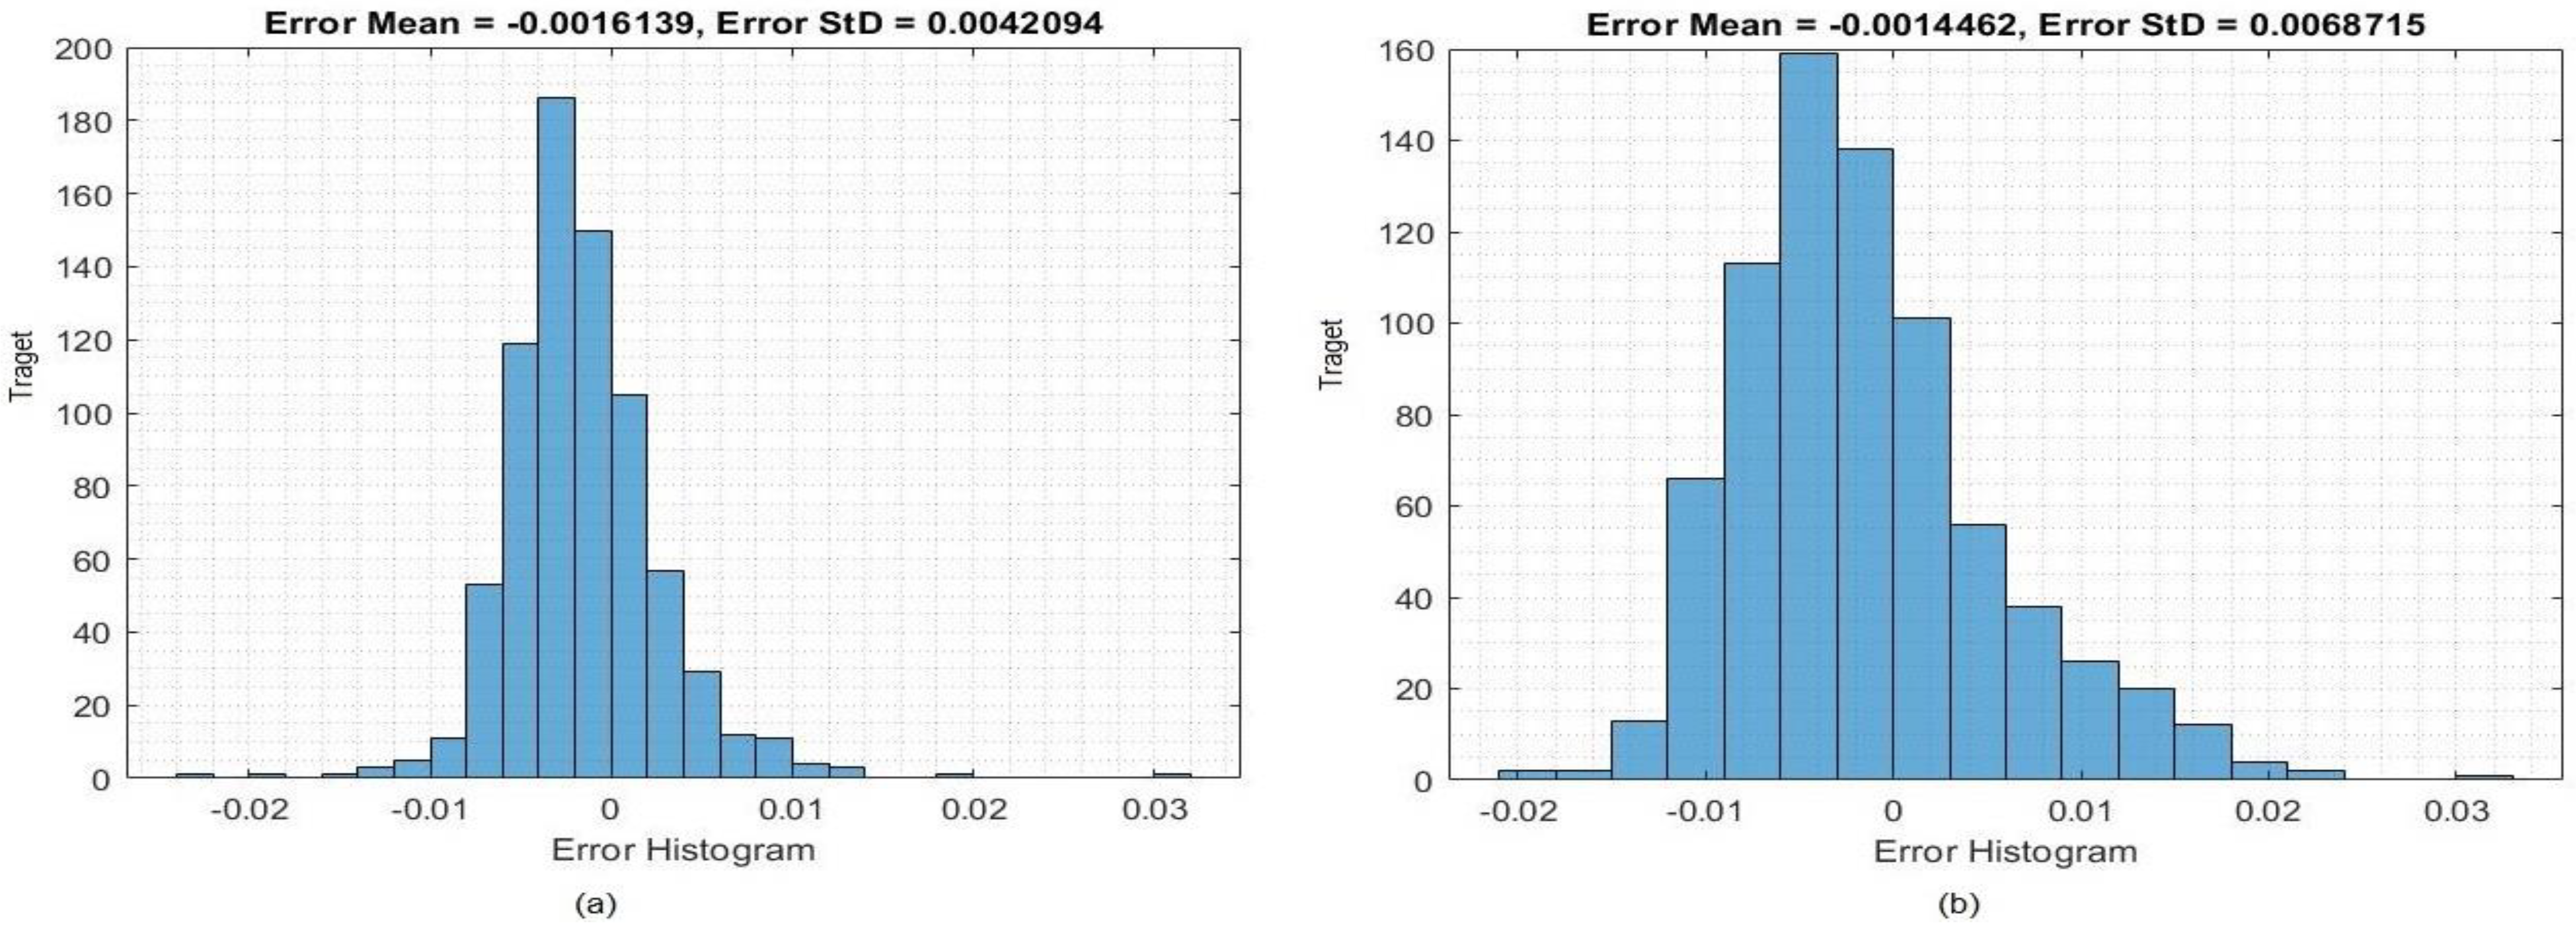
4.1. Results
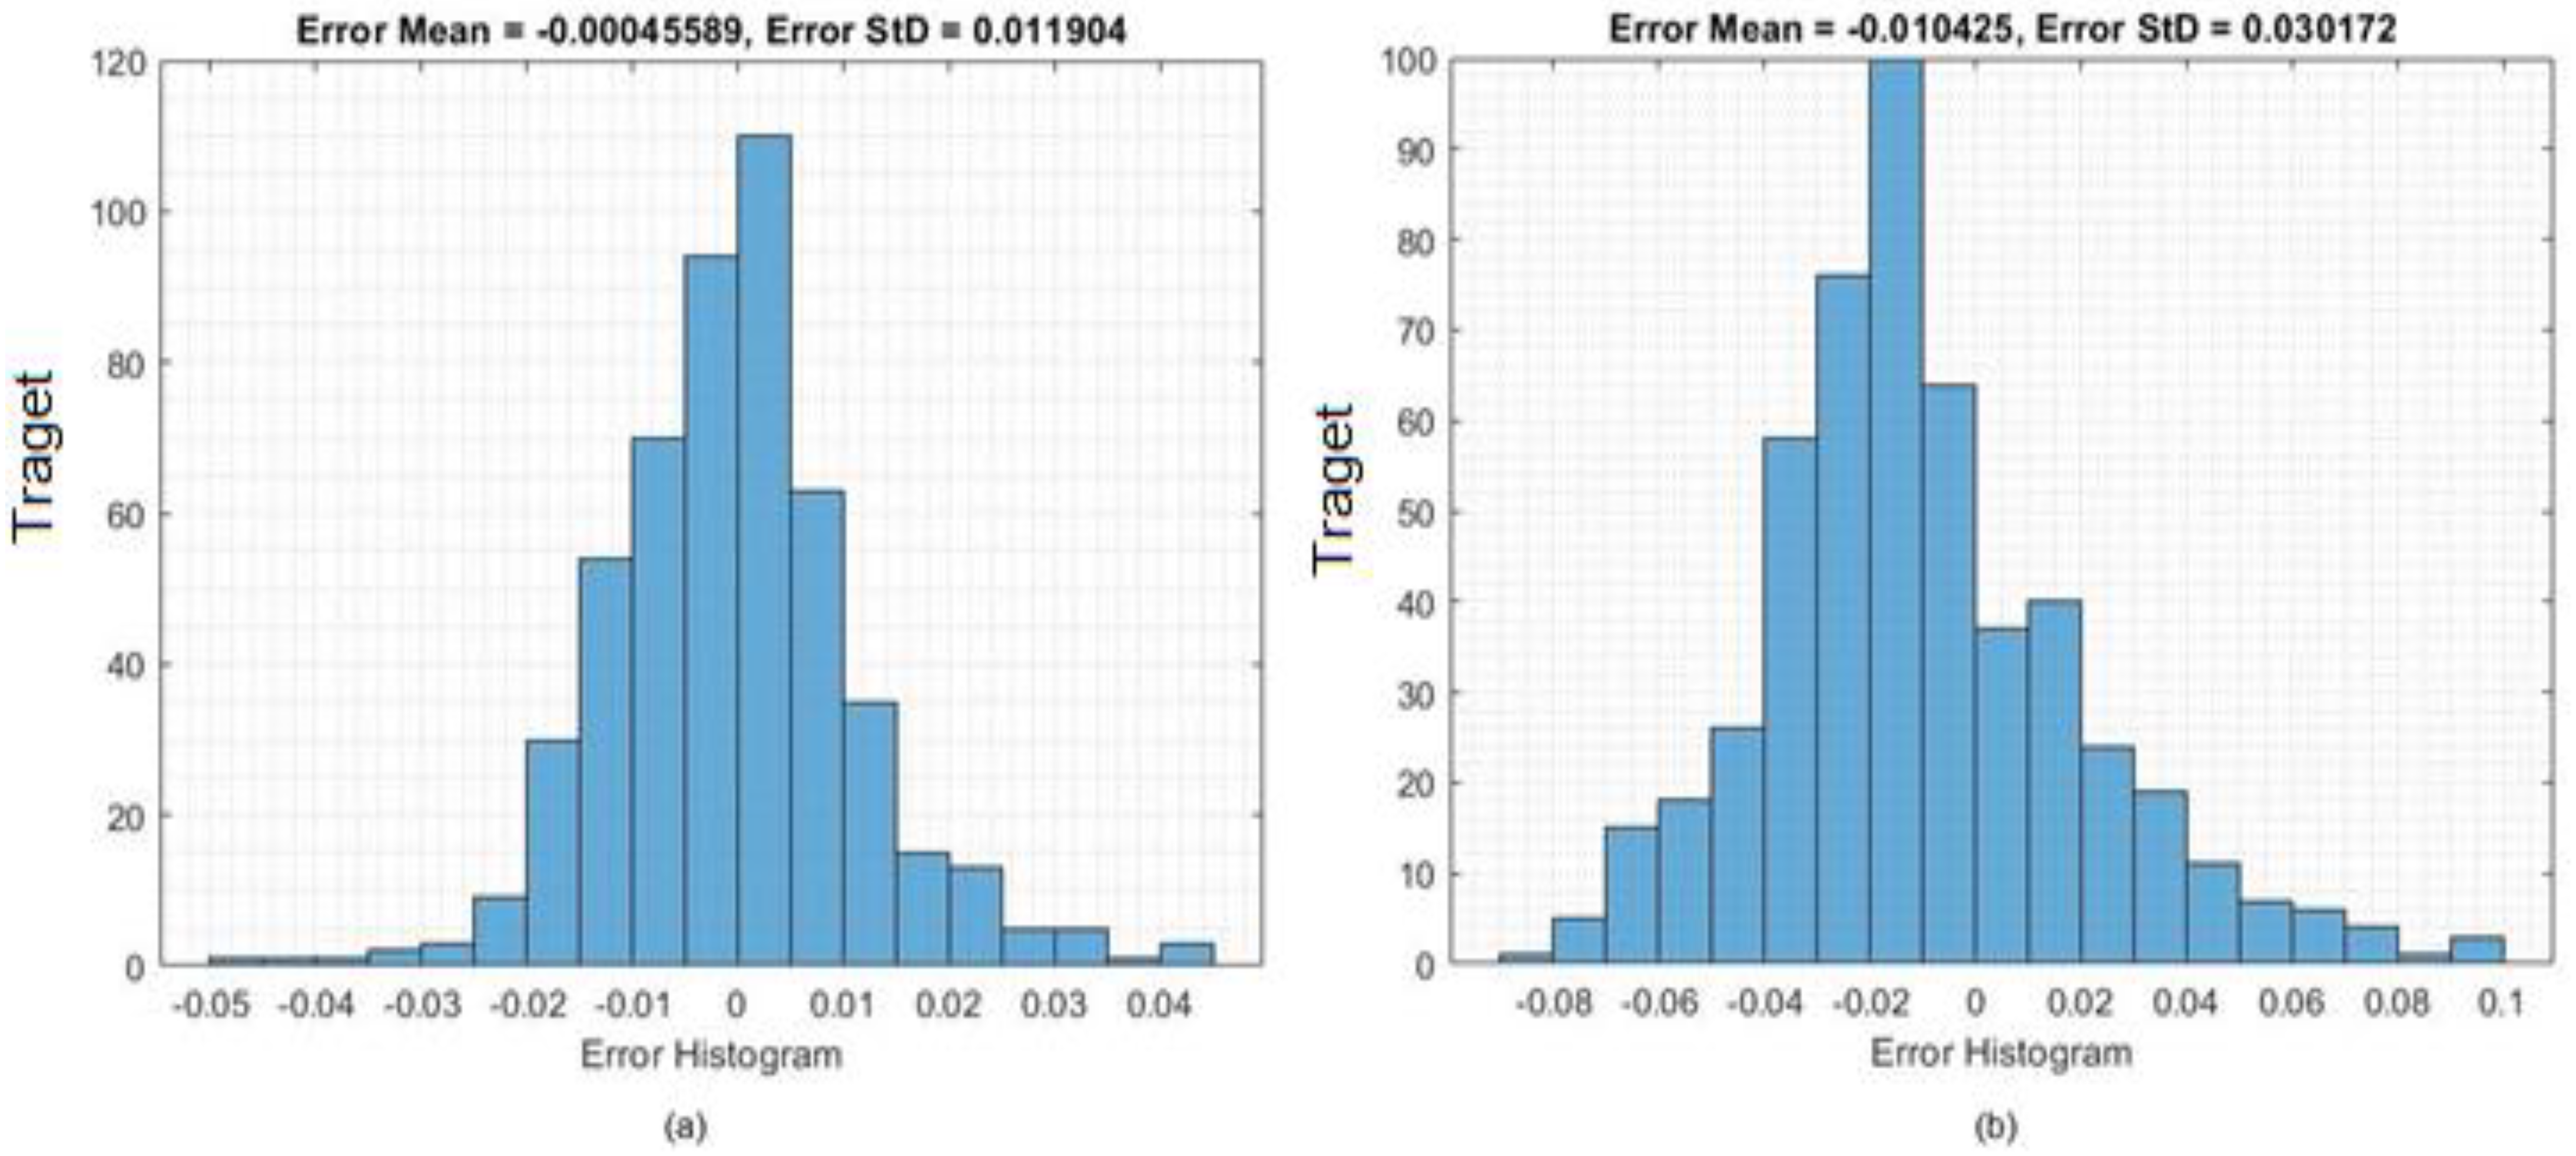
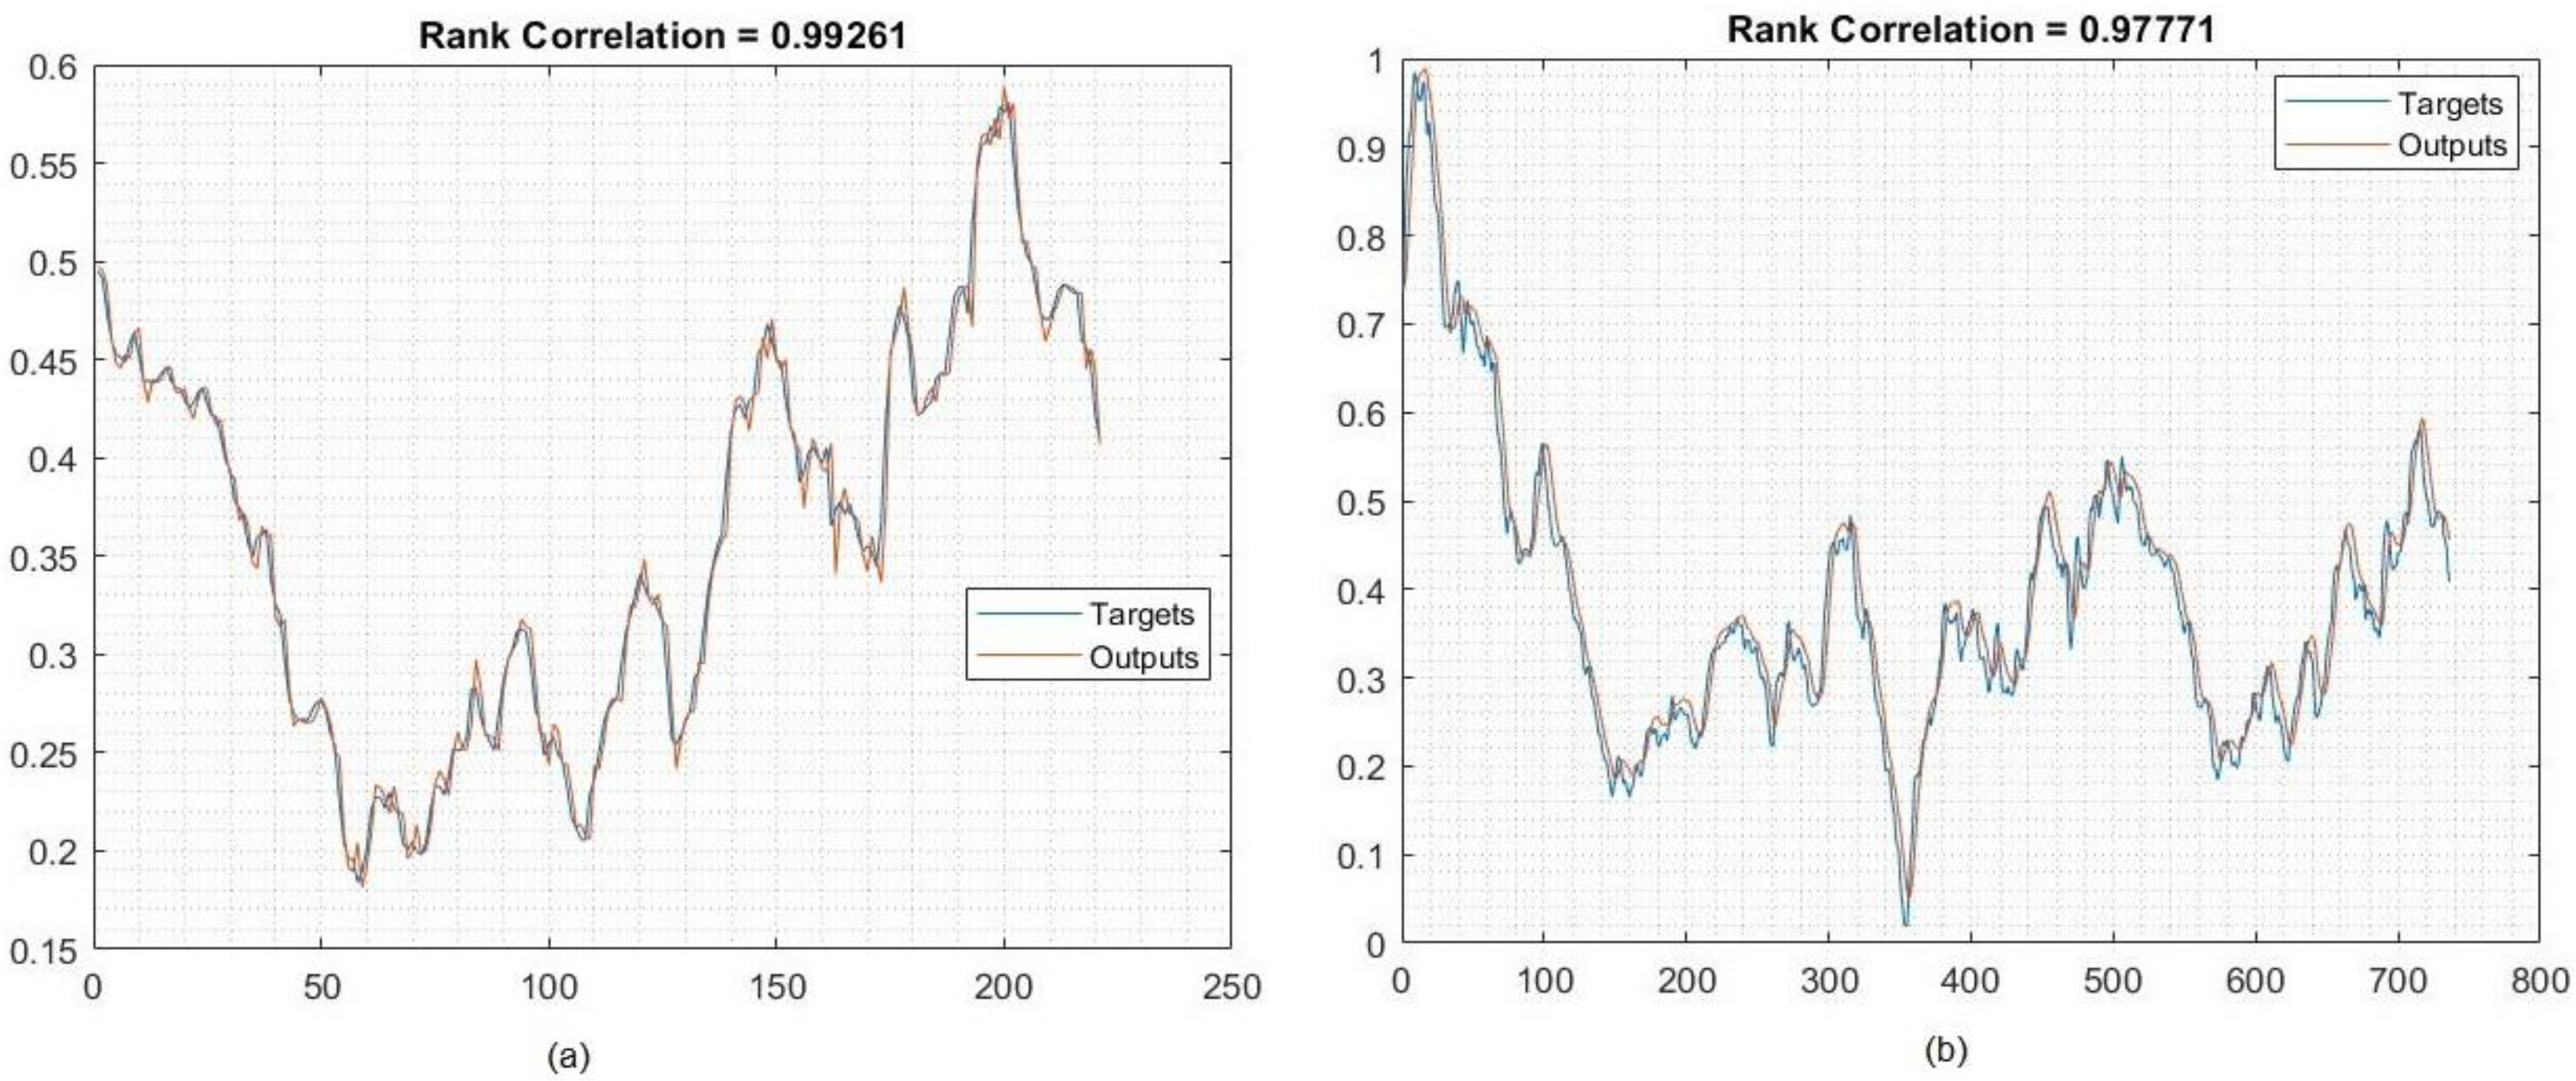
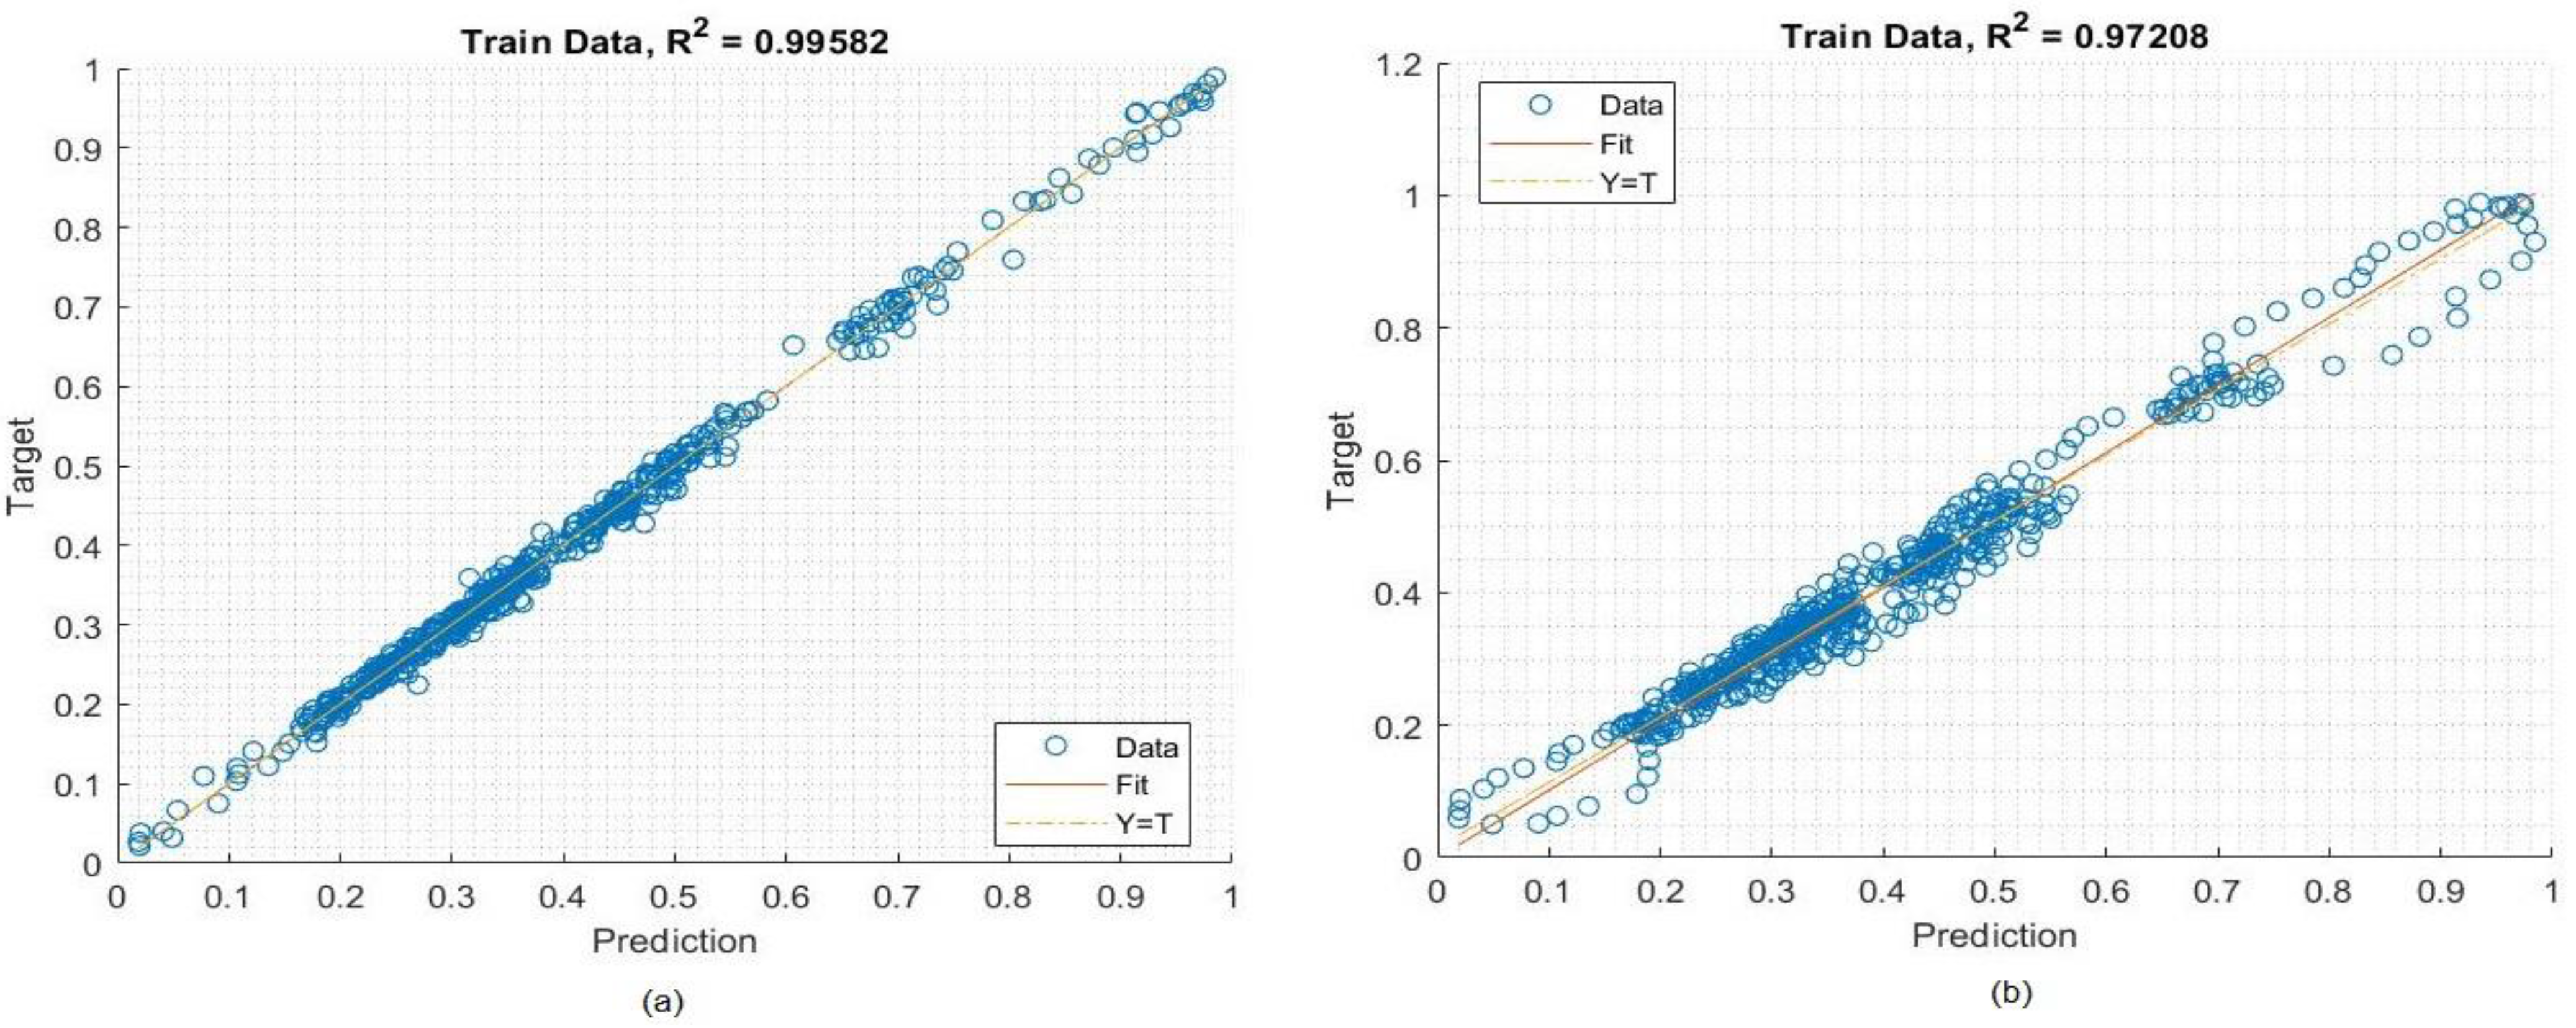
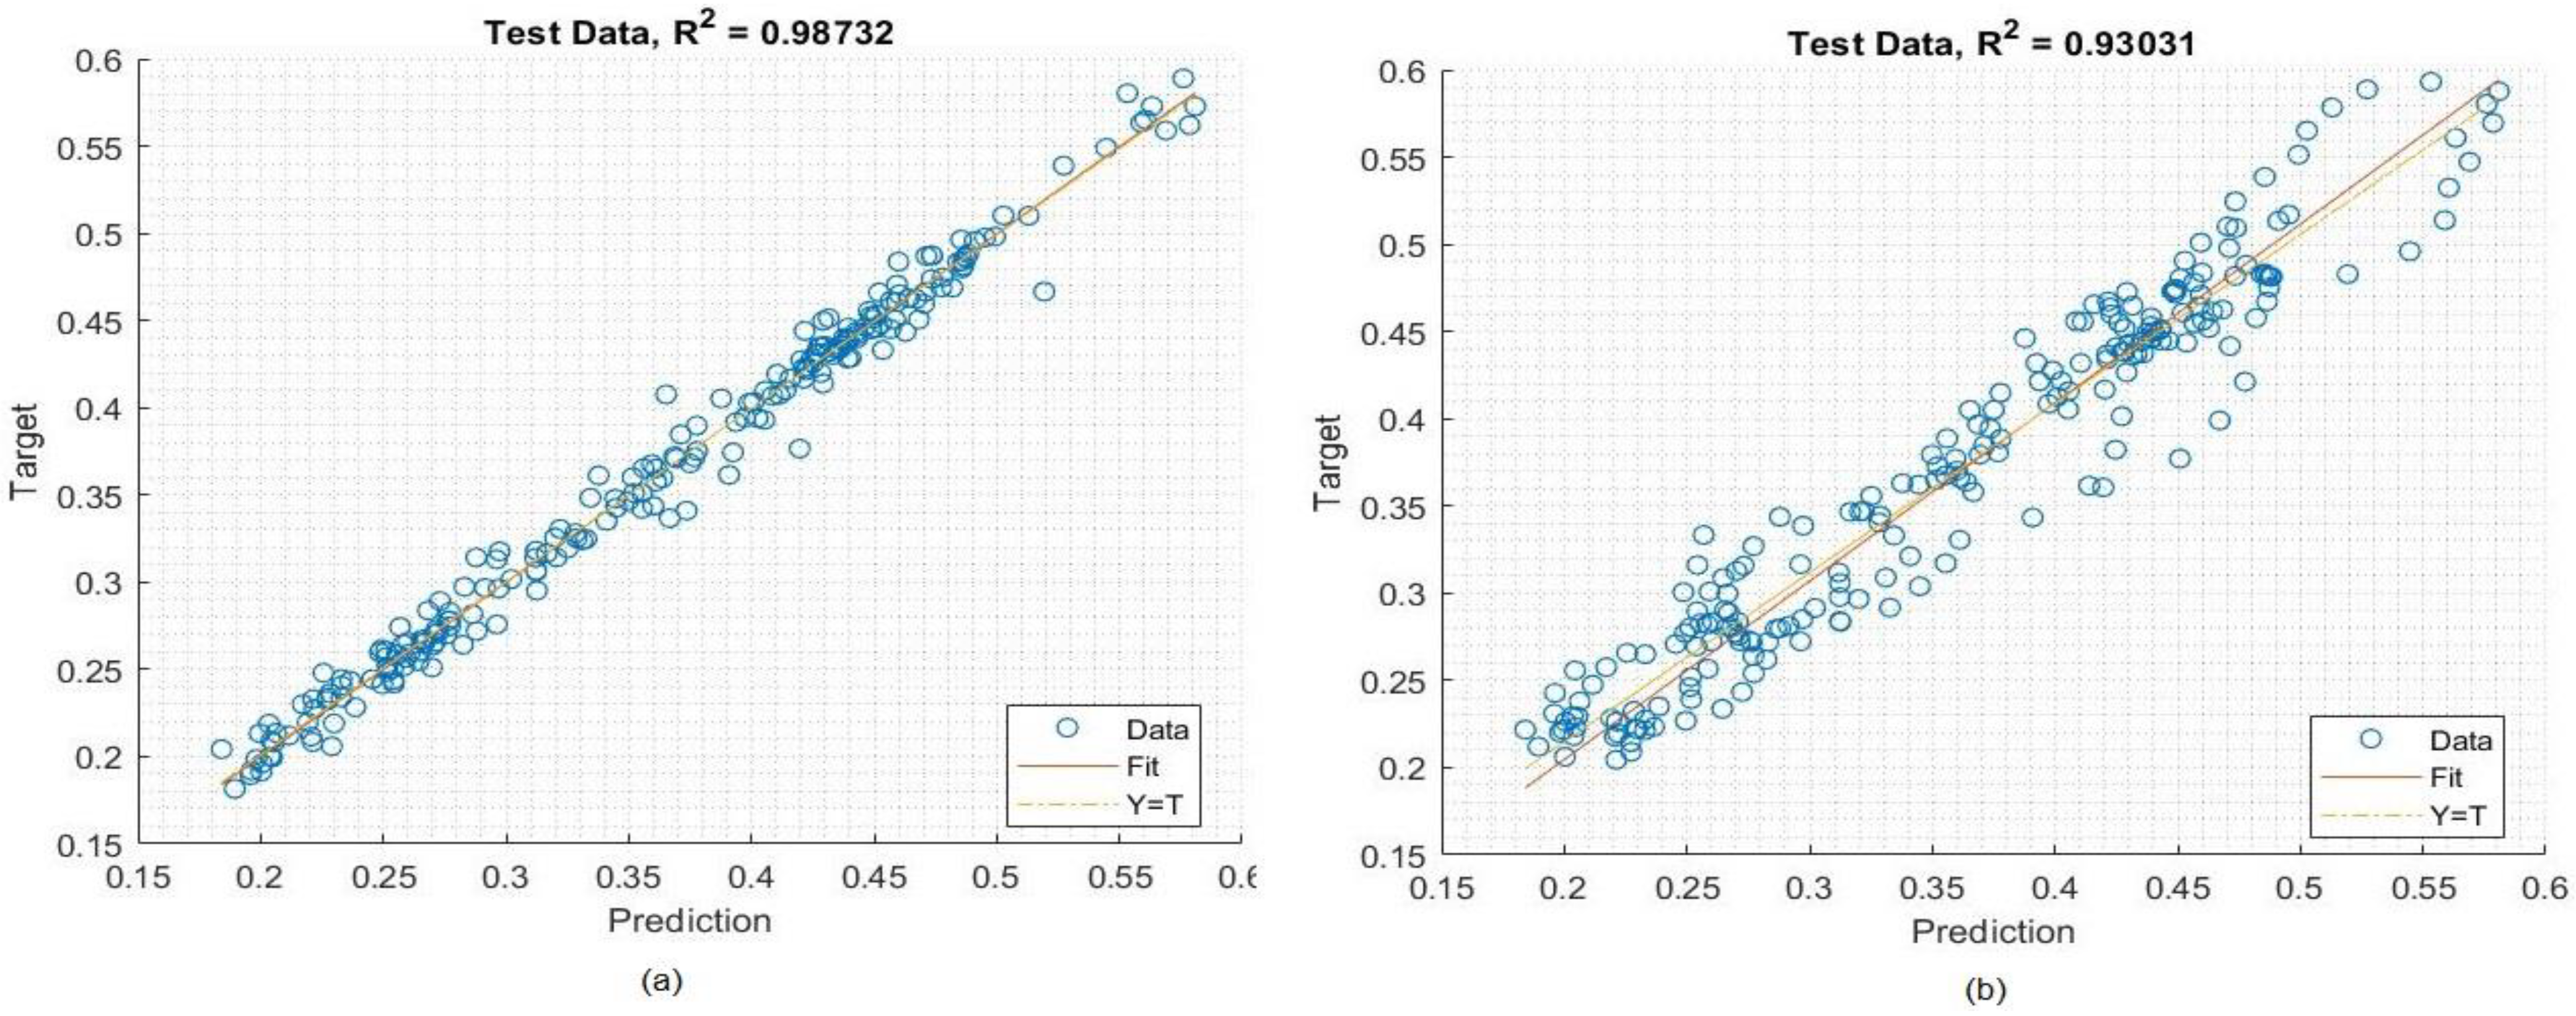
4.1.1. Deep Learning Results of Tesla Data
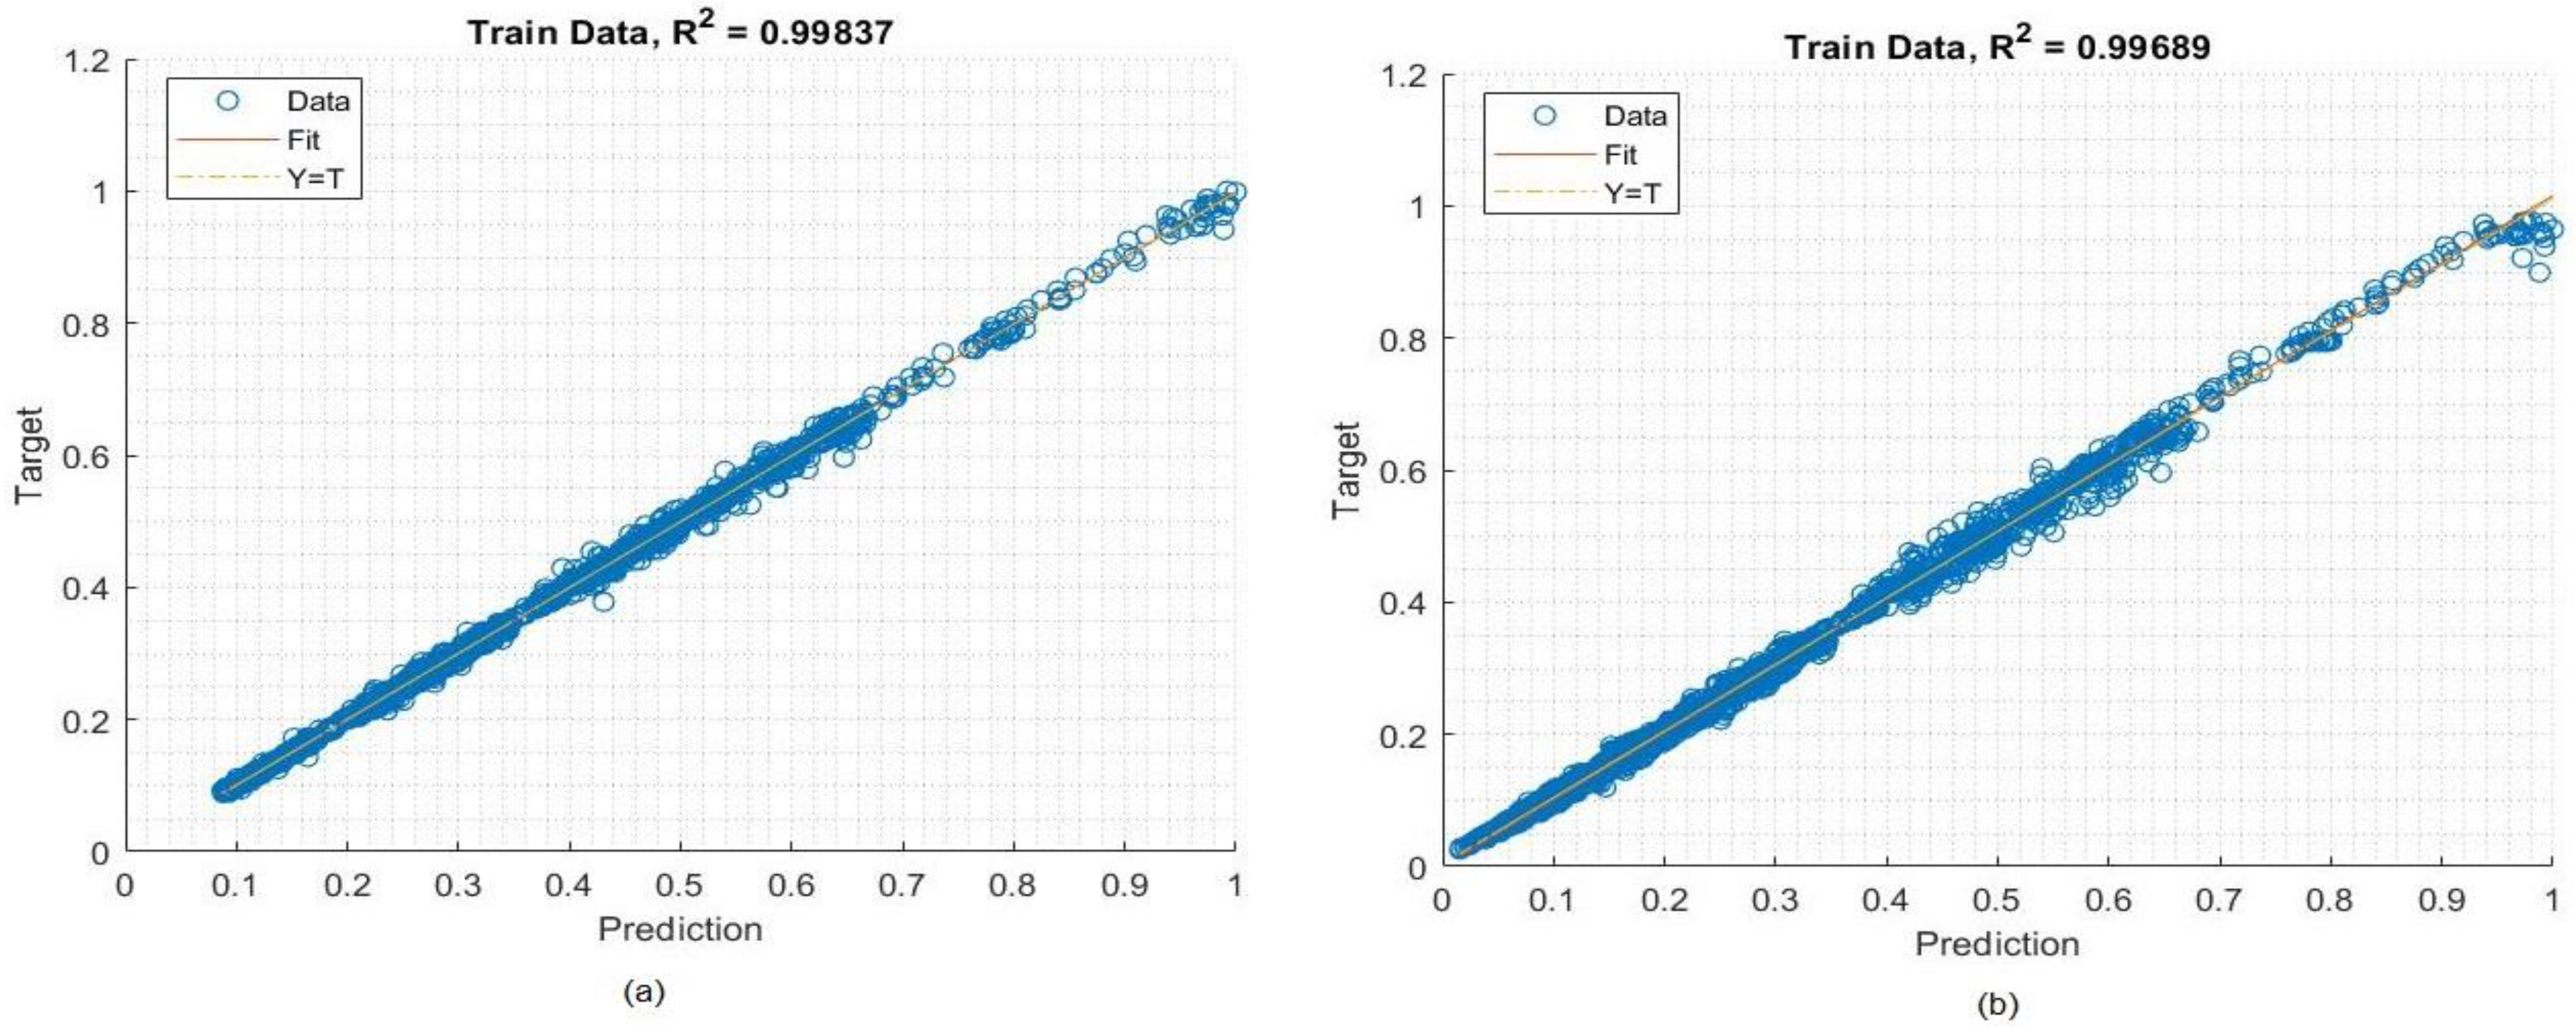
4.1.2. Deep Learning Results of Apple Data
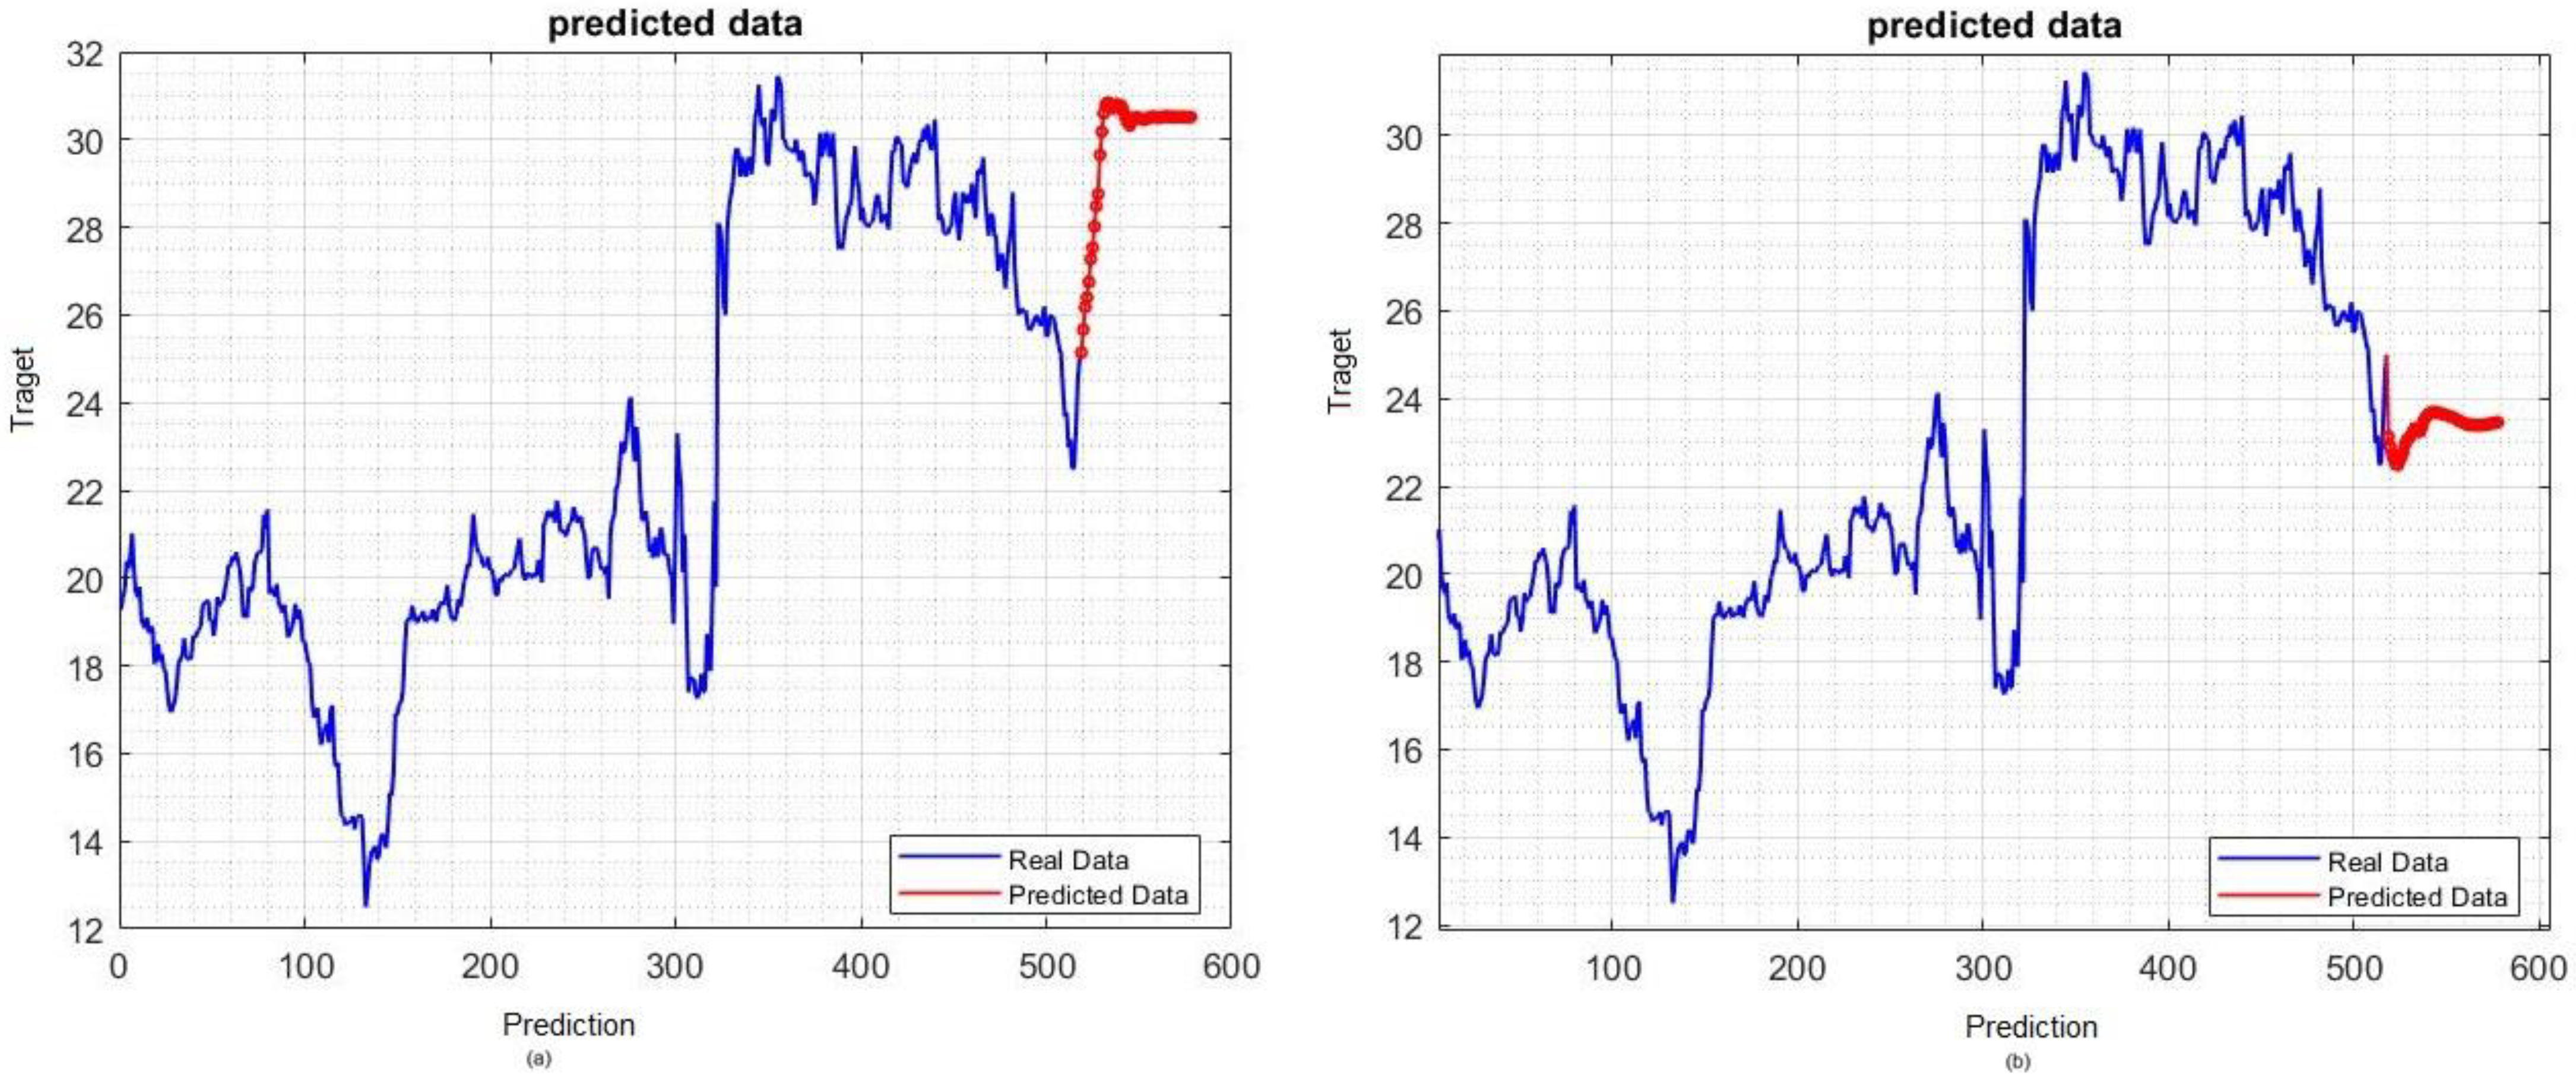
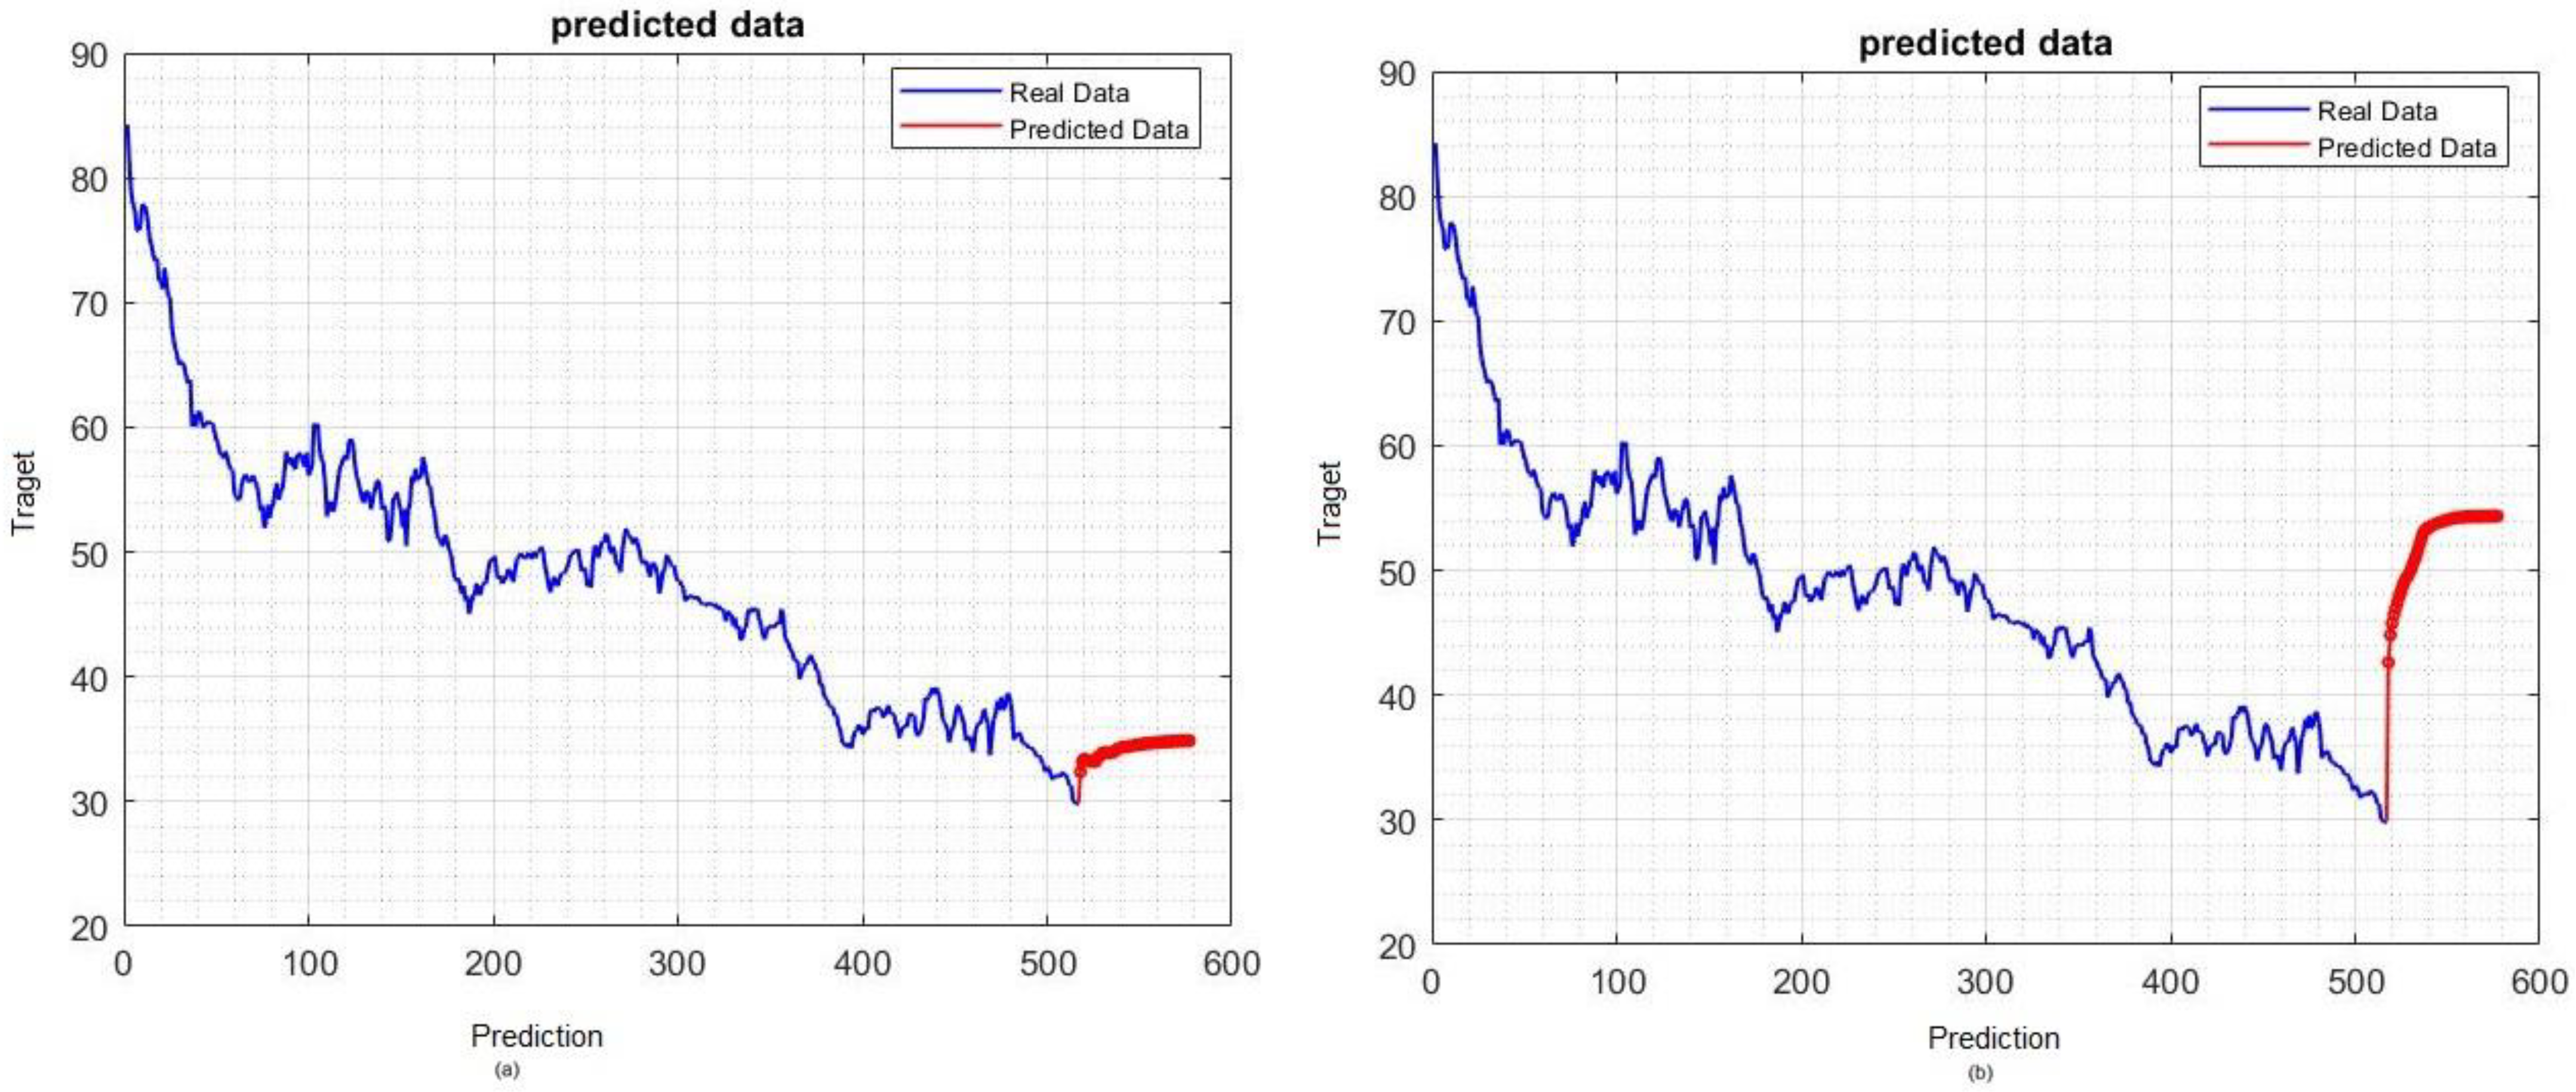
4.1.3. Forecasting Future Values of Tesla and Apple Data
5. Discussion
6. Conclusions
Author Contributions
Funding
Institutional Review Board Statement
Informed Consent Statement
Data Availability Statement
Acknowledgments
Conflicts of Interest
References
- Al-qaness, M.A.; Ewees, A.A.; Fan, H.; Abualigah, L.; Abd Elaziz, M. Boosted ANFIS model using augmented marine predator algorithm with mutation operators for wind power forecasting. Appl. Energy 2022, 314, 118851. [Google Scholar] [CrossRef]
- Danandeh Mehr, A.; Rikhtehgar Ghiasi, A.; Yaseen, Z.M.; Sorman, A.U.; Abualigah, L. A novel intelligent deep learning predictive model for meteorological drought forecasting. J. Ambient. Intell. Humaniz. Comput. 2022, 24, 1–5. [Google Scholar] [CrossRef]
- Mexmonov, S. Stages of Development of the Stock Market of Uzbekistan. Арxив Нayчныx Иccлeдoвaний 2020, 24, 6661–6668. [Google Scholar]
- Nti, I.K.; Adekoya, A.F.; Weyori, B.A. A systematic review of fundamental and technical analysis of stock market predictions. Artif. Intell. Rev. 2019, 53, 3007–3057. [Google Scholar] [CrossRef]
- Sengupta, A.; Sena, V. Impact of open innovation on industries and firms—A dynamic complex systems view. Technol. Forecast. Soc. Chang. 2020, 159, 120199. [Google Scholar] [CrossRef]
- Terwiesch, C.; Xu, Y. Innovation Contests, Open Innovation, and Multiagent Problem Solving. Manag. Sci. 2008, 54, 1529–1543. [Google Scholar] [CrossRef]
- Blohm, I.; Riedl, C.; Leimeister, J.M.; Krcmar, H. Idea evaluation mechanisms for collective intelligence in open innovation communities: Do traders outperform raters? In Proceedings of the 32nd International Conference on Information Systems, Cavtat, Croatia, 21–24 June 2010. [Google Scholar]
- Del Giudice, M.; Carayannis, E.G.; Palacios-Marqués, D.; Soto-Acosta, P.; Meissner, D. The human dimension of open innovation. Manag. Decis. 2018, 56, 1159–1166. [Google Scholar] [CrossRef]
- Daradkeh, M. The Influence of Sentiment Orientation in Open Innovation Communities: Empirical Evidence from a Business Analytics Community. J. Inf. Knowl. Manag. 2021, 20, 2150031. [Google Scholar] [CrossRef]
- Chang, P.C.; Liu, C.H. A TSK type fuzzy rule based system for stock price prediction. Expert Syst. Appl. 2008, 34, 135–144. [Google Scholar] [CrossRef]
- Bahadur, S.G.C. Stock market and economic development: A causality test. J. Nepal. Bus. Stud. 2006, 3, 36–44. [Google Scholar]
- Bharathi, S.; Geetha, A.; Sathiynarayanan, R. Sentiment Analysis of Twitter and RSS News Feeds and Its Impact on Stock Market Prediction. Int. J. Intell. Eng. Syst. 2017, 10, 68–77. [Google Scholar] [CrossRef]
- Sharma, A.; Bhuriya, D.; Singh, U. Survey of stock market prediction using machine learning approach. In Proceedings of the 2017 International Conference of Electronics, Communication and Aerospace Technology (ICECA), Coimbatore, India, 20–22 April 2017; pp. 506–509. [Google Scholar]
- Nassar, L.; Okwuchi, I.E.; Saad, M.; Karray, F.; Ponnambalam, K. Deep learning based approach for fresh produce market price prediction. In Proceedings of the 2020 International Joint Conference on Neural Networks (IJCNN), Glasgow, UK, 19–24 July 2020; pp. 1–7. [Google Scholar]
- Bathla, G. Stock Price prediction using LSTM and SVR. In Proceedings of the 2020 Sixth International Conference on Parallel, Distributed and Grid Computing (PDGC), Waknaghat, India, 6–8 November 2020; pp. 211–214. [Google Scholar]
- Kara, Y.; Boyacioglu, M.A.; Baykan, Ö.K. Predicting direction of stock price index movement using artificial neural networks and support vector machines: The sample of the Istanbul Stock Exchange. Expert Syst. Appl. 2011, 38, 5311–5319. [Google Scholar] [CrossRef]
- Zhang, Z.; Zohren, S.; Roberts, S. Deeplob: Deep convolutional neural networks for limit order books. IEEE Trans. Signal Process. 2019, 67, 3001–3012. [Google Scholar] [CrossRef]
- Wallbridge, J. Transformers for limit order books. arXiv 2020, arXiv:2003.00130. [Google Scholar]
- Watanabe, C.; Shin, J.; Heikkinen, J.; Tarasyev, A. Optimal dynamics of functionality development in open innovation. IFAC Proc. Vol. 2009, 42, 173–178. [Google Scholar] [CrossRef]
- Jeong, H.; Shin, K.; Kim, E.; Kim, S. Does Open Innovation Enhance a Large Firm’s Financial Sustainability? A Case of the Korean Food Industry. J. Open Innov. Technol. Mark. Complex. 2020, 6, 101. [Google Scholar] [CrossRef]
- Le, T.; Hoque, A.; Hassan, K. An Open Innovation Intraday Implied Volatility for Pricing Australian Dollar Options. J. Open Innov. Technol. Mark. Complex. 2021, 7, 23. [Google Scholar] [CrossRef]
- Wu, B.; Gong, C. Impact of open innovation communities on enterprise innovation performance: A system dynamics perspective. Sustainability 2019, 11, 4794. [Google Scholar] [CrossRef]
- Arias-Pérez, J.; Coronado-Medina, A.; Perdomo-Charry, G. Big data analytics capability as a mediator in the impact of open innovation on firm performance. J. Strategy Manag. 2021, 15, 1–15. [Google Scholar] [CrossRef]
- Zhang, K.; Zhong, G.; Dong, J.; Wang, S.; Wang, Y. Stock Market Prediction Based on Generative Adversarial Network. Procedia Comput. Sci. 2019, 147, 400–406. [Google Scholar] [CrossRef]
- Chesbrough, H.W. Open Innovation: The New Imperative for Creating and Profiting from Technology; Harvard Business Press: Boston, MA, USA, 2003. [Google Scholar]
- Moretti, F.; Biancardi, D. Inbound open innovation and firm performance. J. Innov. Knowl. 2020, 5, 1–19. [Google Scholar] [CrossRef]
- Kiran, G.M. Stock Price prediction with LSTM Based Deep Learning Techniques. Int. J. Adv. Sci. Innov. 2021, 2, 18–21. [Google Scholar]
- Bhatti, S.H.; Santoro, G.; Sarwar, A.; Pellicelli, A.C. Internal and external antecedents of open innovation adoption in IT organisations: Insights from an emerging market. J. Knowl. Manag. 2021, 25, 1726–1744. [Google Scholar] [CrossRef]
- Yang, C.H.; Shyu, J.Z. A symbiosis dynamic analysis for collaborative R&D in open innovation. Int. J. Comput. Sci. Eng. 2010, 5, 74. [Google Scholar]
- Esfahanipour, A.; Aghamiri, W. Adapted neuro-fuzzy inference system on indirect approach TSK fuzzy rule base for stock market analysis. Expert Syst. Appl. 2010, 37, 4742–4748. [Google Scholar] [CrossRef]
- Chen, Y.; Dong, X.; Zhao, Y. Stock Index Modeling Using EDA Based Local Linear Wavelet Neural Network. In Proceedings of the 2005 International Conference on Neural Networks Brain, ICNNB’05, Beijing, China, 13–15 October 2005; Volume 3, pp. 1646–1650. [Google Scholar]
- Sharma, G.D.; Yadav, A.; Chopra, R. Artificial intelligence and effective governance: A review, critique and research agenda. Sustain. Futures 2020, 2, 100004. [Google Scholar] [CrossRef]
- Baba, N.; Suto, H. Utilization of artificial neural networks and the TD-learning method for constructing intelligent decision support systems. Eur. J. Oper. Res. 2000, 122, 501–508. [Google Scholar] [CrossRef]
- Atsalakis, G.S.; Valavanis, K.P. Surveying stock market forecasting techniques—Part II: Soft computing methods. Expert Syst. Appl. 2009, 36, 5932–5941. [Google Scholar] [CrossRef]
- Gandhmal, D.P.; Kumar, K. Systematic analysis and review of stock market prediction techniques. Comput. Sci. Rev. 2019, 34, 100190. [Google Scholar] [CrossRef]
- Patil, P.; Wu, C.S.M.; Potika, K.; Orang, M. Stock market prediction using ensemble of graph theory, machine learning and deep learning models. In Proceedings of the 3rd International Conference on Software Engineering and Information Management, Sydney, Australia, 12–15 January 2020; pp. 85–92. [Google Scholar]
- Rana, M.; Uddin, M.M.; Hoque, M.M. Effects of activation functions and optimizers on stock price prediction using LSTM recurrent networks. In Proceedings of the 2019 3rd International Conference on Computer Science and Artificial Intelligence, Normal, IL, USA, 6–8 December 2019; pp. 354–358. [Google Scholar]
- Di Persio, L.; Honchar, O. Recurrent neural networks approach to the financial forecast of Google assets. Int. J. Math. Comput. Simul. 2017, 11, 7–13. [Google Scholar]
- Roondiwala, M.; Patel, H.; Varma, S. Predicting stock prices using LSTM. Int. J. Sci. Res. 2017, 6, 1754–1756. [Google Scholar]
- Hiransha, M.; Gopalakrishnan, E.A.; Menon, V.K.; Soman, K.P. NSE stock market prediction using deep-learning models. Procedia Comput. Sci. 2018, 132, 1351–1362. [Google Scholar]
- Chung, H.; Shin, K.-S. Genetic algorithm-optimized multi-channel convolutional neural network for stock market prediction. Neural Comput. Appl. 2020, 2, 7897–7914. [Google Scholar] [CrossRef]
- Sim, H.S.; Kim, H.I.; Ahn, J.J. Is deep learning for image recognition applicable to stock market prediction? Complexity 2019, 2019, 4324878. [Google Scholar] [CrossRef]
- Wen, M.; Li, P.; Zhang, L.; Chen, Y. Stock Market Trend Prediction Using High-Order Information of Time Series. IEEE Access 2019, 7, 28299–28308. [Google Scholar] [CrossRef]
- Rekha, G.; Sravanthi, D.B.; Ramasubbareddy, S.; Govinda, K. Prediction of Stock Market Using Neural Network Strategies. J. Comput. Theor. Nanosci. 2019, 16, 2333–2336. [Google Scholar] [CrossRef]
- Lee, J.; Kim, R.; Koh, Y.; Kang, J. Global stock market prediction based on stock chart images using deep Q-network. IEEE Access 2019, 7, 167260–167277. [Google Scholar] [CrossRef]
- Baldo, A.; Cuzzocrea, A.; Fadda, E.; Bringas, P.G. Financial Forecasting via Deep-Learning and Machine-Learning Tools over Two-Dimensional Objects Transformed from Time Series. In Proceedings of the Hybrid Artificial Intelligent Systems: 16th International Conference, HAIS 2021, Bilbao, Spain, 22–24 September 2021; pp. 550–563. [Google Scholar]
- LeCun, Y.; Bengio, Y. Convolutional Networks for Images, Speech, and Time Series. In The Handbook of Brain Theory and Neural Networks; MIT Press: Cambridge, MA, USA, 1995; Volume 3361, p. 1995. [Google Scholar]
- Ammer, M.A.; Aldhyani, T.H.H. Deep Learning Algorithm to Predict Cryptocurrency Fluctuation Prices: Increasing Investment Awareness. Electronics 2022, 11, 2349. [Google Scholar] [CrossRef]
- Aldhyani, T.H.H.; Alkahtani, H. A Bidirectional Long Short-Term Memory Model Algorithm for Predicting COVID-19 in Gulf Countries. Life 2021, 11, 1118. [Google Scholar] [CrossRef]
- Aldhyani, T.H.H.; Alkahtani, H. Artificial Intelligence Algorithm-Based Economic Denial of Sustainability Attack Detection Systems: Cloud Computing Environments. Sensors 2022, 22, 4685. [Google Scholar] [CrossRef]
- Alkhatib, K.; Khazaleh, H.; Alkhazaleh, H.A.; Alsoud, A.R.; Abualigah, L. A New Stock Price Forecasting Method Using Active Deep Learning Approach. J. Open Innov. Technol. Mark. Complex. 2022, 8, 96. [Google Scholar] [CrossRef]


| Name | Values |
|---|---|
| Optimizer function | rmsprop |
| maxEpochs | 200 |
| miniBatchSize | 256 |
| executionEnvironment | CPU |
| Firstlayer | 120 |
| DropoutValue | 0.5 |
| NumOfFeedForwardLeyars | 3 |
| maxItrations | 100 |
| Model | MSE | RMSE | NRMSE | R% |
|---|---|---|---|---|
| CNN-LSTM | 0.00101 | 0.03189 | 0.08048 | 99.58 |
| LSTM | 0.00141 | 0.01190 | 0.03003 | 97.97 |
| Model | MSE | RMSE | NRMSE | R% |
|---|---|---|---|---|
| CNN-LSTM | 0.00013 | 0.01143 | 0.03166 | 99.26 |
| LSTM | 0.00079 | 0.02826 | 0.07825 | 97.77 |
| Model | MSE | RMSE | NRMSE | R% |
|---|---|---|---|---|
| CNN-LSTM | 5.7258 × 10⁻⁵ | 0.00756 | 0.02081 | 99.87 |
| LSTM | 0.0001554 | 0.01246 | 0.04184 | 99.82 |
| Model | MSE | RMSE | NRMSE | R% |
|---|---|---|---|---|
| CNN-LSTM | 5.7258 × 10⁻⁵ | 0.00756 | 0.02081 | 99.73 |
| LSTM | 0.0001554 | 0.01246 | 0.04184 | 99.25 |
Publisher’s Note: MDPI stays neutral with regard to jurisdictional claims in published maps and institutional affiliations. |
© 2022 by the authors. Licensee MDPI, Basel, Switzerland. This article is an open access article distributed under the terms and conditions of the Creative Commons Attribution (CC BY) license (https://creativecommons.org/licenses/by/4.0/).
Share and Cite
Aldhyani, T.H.H.; Alzahrani, A. Framework for Predicting and Modeling Stock Market Prices Based on Deep Learning Algorithms. Electronics 2022, 11, 3149. https://doi.org/10.3390/electronics11193149
Aldhyani THH, Alzahrani A. Framework for Predicting and Modeling Stock Market Prices Based on Deep Learning Algorithms. Electronics. 2022; 11(19):3149. https://doi.org/10.3390/electronics11193149
Chicago/Turabian StyleAldhyani, Theyazn H. H., and Ali Alzahrani. 2022. "Framework for Predicting and Modeling Stock Market Prices Based on Deep Learning Algorithms" Electronics 11, no. 19: 3149. https://doi.org/10.3390/electronics11193149
APA StyleAldhyani, T. H. H., & Alzahrani, A. (2022). Framework for Predicting and Modeling Stock Market Prices Based on Deep Learning Algorithms. Electronics, 11(19), 3149. https://doi.org/10.3390/electronics11193149