Article

Multi-Underwater Gliders Coverage Path Planning Based on Ant Colony Optimization

School of Marine Science and Technology, Northwestern Polytechnical University, Xi’an 710072, China
*
Author to whom correspondence should be addressed.
Electronics 2022, 11(19), 3021; https://doi.org/10.3390/electronics11193021
Submission received: 23 August 2022 / Revised: 10 September 2022 / Accepted: 18 September 2022 / Published: 23 September 2022

Abstract

:
Underwater gliders (UGs) are widely applied to regional exploration to find potential targets. However, the complex marine environment and special movement patterns make it difficult to plan their coverage path. In this paper, a novel multi-underwater gliders coverage path planning algorithm based on ant colony optimization (MGCPP-ACO) is proposed. First, according to the detection radius of the sonar and the motion process of the UGs, we establish a detection coverage model. Then, considering the motion constraints of the UGs and optimization objectives, we redesign the feasible region, transition probability, pheromone update rule and heuristic function of the ACO algorithm. Finally, we carry out three groups of experiments. The simulation results show that the MGCPP-ACO can cover almost the entire sea area and adapt to different initial positions and heading angles. In addition, compared with the traditional scan-line (SCAN) algorithm, the MGCPP-ACO has a higher coverage efficiency and lower coverage cost.

1. Introduction

The underwater glider (UG) is a new type of underwater vehicle, which has the characteristics of low cost, low energy consumption and low noise [1]. It can carry various sensors to perform tasks, such as ocean observation [2], biological observation [3] and ocean mapping [4]. In addition, the UG can also equip with passive sonar for area detection to find underwater targets [5]. Reasonable coverage path planning will significantly improve coverage efficiency and reduce coverage costs.
The multi-robots coverage path planning method is widely used in autonomous underwater vehicles, ground robots, UAVs and other carriers, mainly in area detection [6], post-disaster search and rescue [7] and 3D structure detection [8]. Considering the existence of thermoclines in the ocean and the special motion of the UG, Ref. [9] proposed a full-coverage path planning and obstacle avoidance (CCPP-OA) algorithm to make two UGs collect the data from the entire sea area. Kapoutsis proposed a DARP algorithm that converted multiple robot problems into a single robot problem, with each region corresponding to a robot to ensure full coverage [10]. Extending the traditional grid decomposition-based coverage path planning method, Nedjati used multiple drones to collect images of the earthquake site to assess the damage caused by the earthquake [11].
The premise of most current methods is that the detection range of the robot is always the same, so as to facilitate the pre-planning of the waypoints. When all the waypoints are traversed, the entire area can be covered. Ref. [12] considered that the terrain affected moving speed and detection radius of the robot. However, in the ocean environment, the situation is more complicated. Seawater temperature, salinity, depth, and seabed topography will significantly affect the detection ability of sonar [13,14]. Detection performance tends to vary at different locations in the region, so it is challenging to plan the waypoints in advance. In this paper, the heuristic function of the ant colony algorithm is redesigned so that the UGs can be adaptive to different detection radius and improve the detection effect.
In addition, although the characteristics of the UG make it very suitable for area detection, the coverage path planning is complicated. On the one hand, the saw-tooth pattern motion of the UG in three-dimensional space is easy to hit the seabed [15]. On the other hand, the UG cannot communicate with the commander under the water, so their navigation parameters can only be planned before entering the water. After entering the water, it will sail according to the saw-tooth pattern trajectory, but the navigation trajectory will directly affect the detection area [16]. Considering the UG’s motion pattern and communication constraints, we propose an adaptive coverage path planning algorithm for multiple UGs in the complex ocean environment. For the cooperation problem between multiple UGs, we give the cooperation strategy with reference to the working process of ant colony.
The contributions of this paper are as follows:
(1)
A detection coverage model for single period of the UG is proposed;
(2)
Redesign the feasible region of the ants adapt to the motion constraints of the UGs;
(3)
Reconstruct the transition probability, pheromone update rule and fitness function of ant colony algorithm to increase coverage efficiency and reduce coverage costs.
The rest of this paper is arranged as follows: Section 2 shows the motion process of UG. In Section 3, the regional detection coverage model is given. In Section 4, an adaptive coverage path planning algorithm based on MGCPP-ACO is proposed. Section 5 analyzes the simulation results of the algorithm and compare it with the traditional SCAN algorithm. Section 6 presents the conclusions.

2. Motion Process of UG

To reduce energy consumption, the UG does not carry underwater acoustic communication equipment, so the glider can only be set with mission parameters at the surface (a), and then dive to perform the mission. The UG will glide for one period in the saw-tooth pattern motion shown in Figure 1. A complete period of gliding includes the following steps:
  • (a). Setting gliding parameters, including gliding angle, heading angle, depth, and then preparing to dive.
  • (a–b). Reducing buoyancy, gliding down at glide angle and adjusting the wing angle. Influenced by the wings, the UG moves forward simultaneously during the diving process.
  • (b). Adjusting buoyancy and preparing to float.
  • (b–c). Increasing buoyancy, gliding upwards at glide angle and adjusting the wings to the opposite direction. Influenced by the wings, the UG moves forward simultaneously during the floating process.
  • (c). Surfacing and reporting location.

3. Detection Coverage Modeling

3.1. Sonar Detection Probability

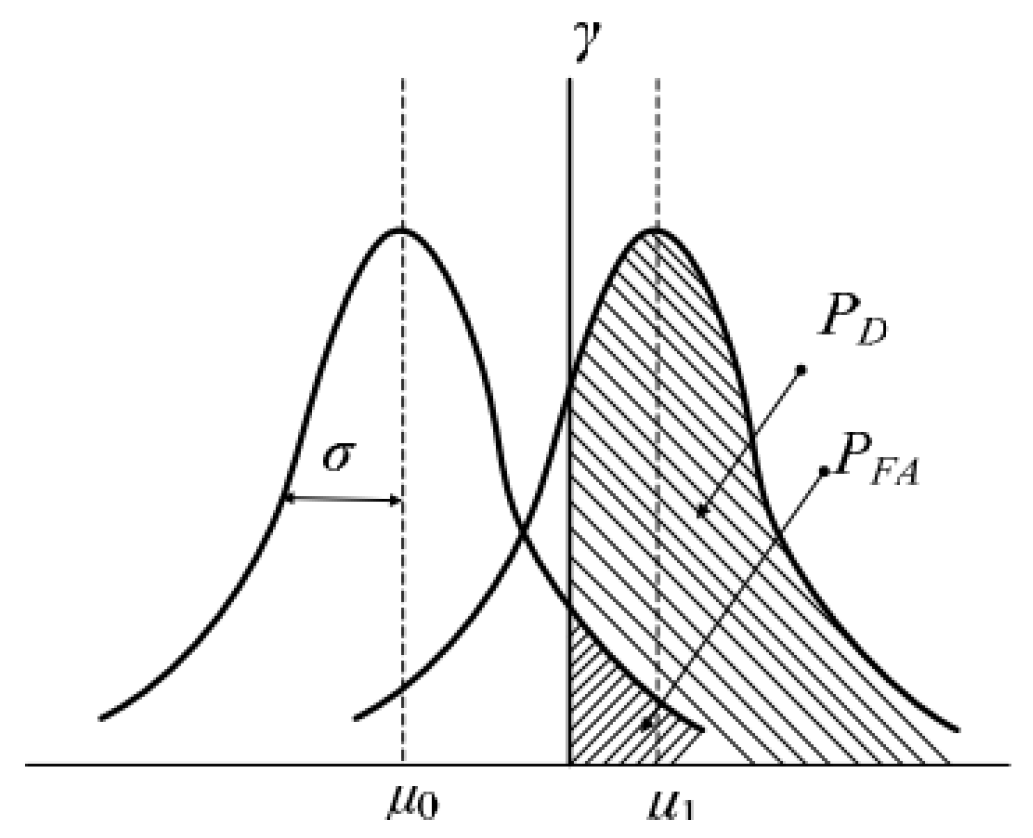
Underwater gliders are equipped with passive sonar to detect targets. The detection probability of the sonar presents a normal distribution, as shown in Figure 2.
Then the detection probability P d and false alarm probability P f can be expressed as:
P f = Q γ μ 0 σ 2
P d = Q γ μ 1 σ 2
where μ 1 is the signal mean, μ 0 is the noise mean, σ 2 is the noise variance, γ is the detection threshold, Q is the standard normal distribution function.
The signal margin can be expressed as:
S E = 10 × lg d 2 d 0 2
where d 2 = ( μ 1 μ 0 ) 2 σ 2 , when μ 0 = 0, it is expressed as the system output signal-to-noise ratio; d 0 2 is the signal-to-noise ratio when the false alarm probability and detection probability are constant.
The underwater glider is equipped with passive sonar, which can be obtained from the sonar equation:
S E = F O M T L ( p , φ , r , h )
The FOM is the inherent property of the sonar, which is generally a constant under the condition that the background noise is relatively stable, and TL represents the propagation loss, which is related to the location of the sonar and the pressure p , relative azimuth φ , relative distance r , and depth h of the detection point.
Using Equations (3) and (4), the detection probability can be expressed as:
P d = Q ( Q 1 ( P f ) d 0 × 10 0.05 × ( F O M T L ( p , φ , r , h ) ) )
Equation (5) shows that the sonar target detection probability is closely related to the marine environment.

3.2. Detection Radius Map

We construct the map using the grid method [17]. The dimension of the grid map is M × N , where M is the number of rows and N is the number of columns. Complex marine environment leads to uneven detection radius of sonar. We adopt the calculation method of literature [18] to calculate the detection radius.
The whole area is discretized into M × N sub-areas, and the detection efficiency of each sub-area is calculated separately to obtain the detection efficiency of the whole area. The specific calculation steps are as follows:
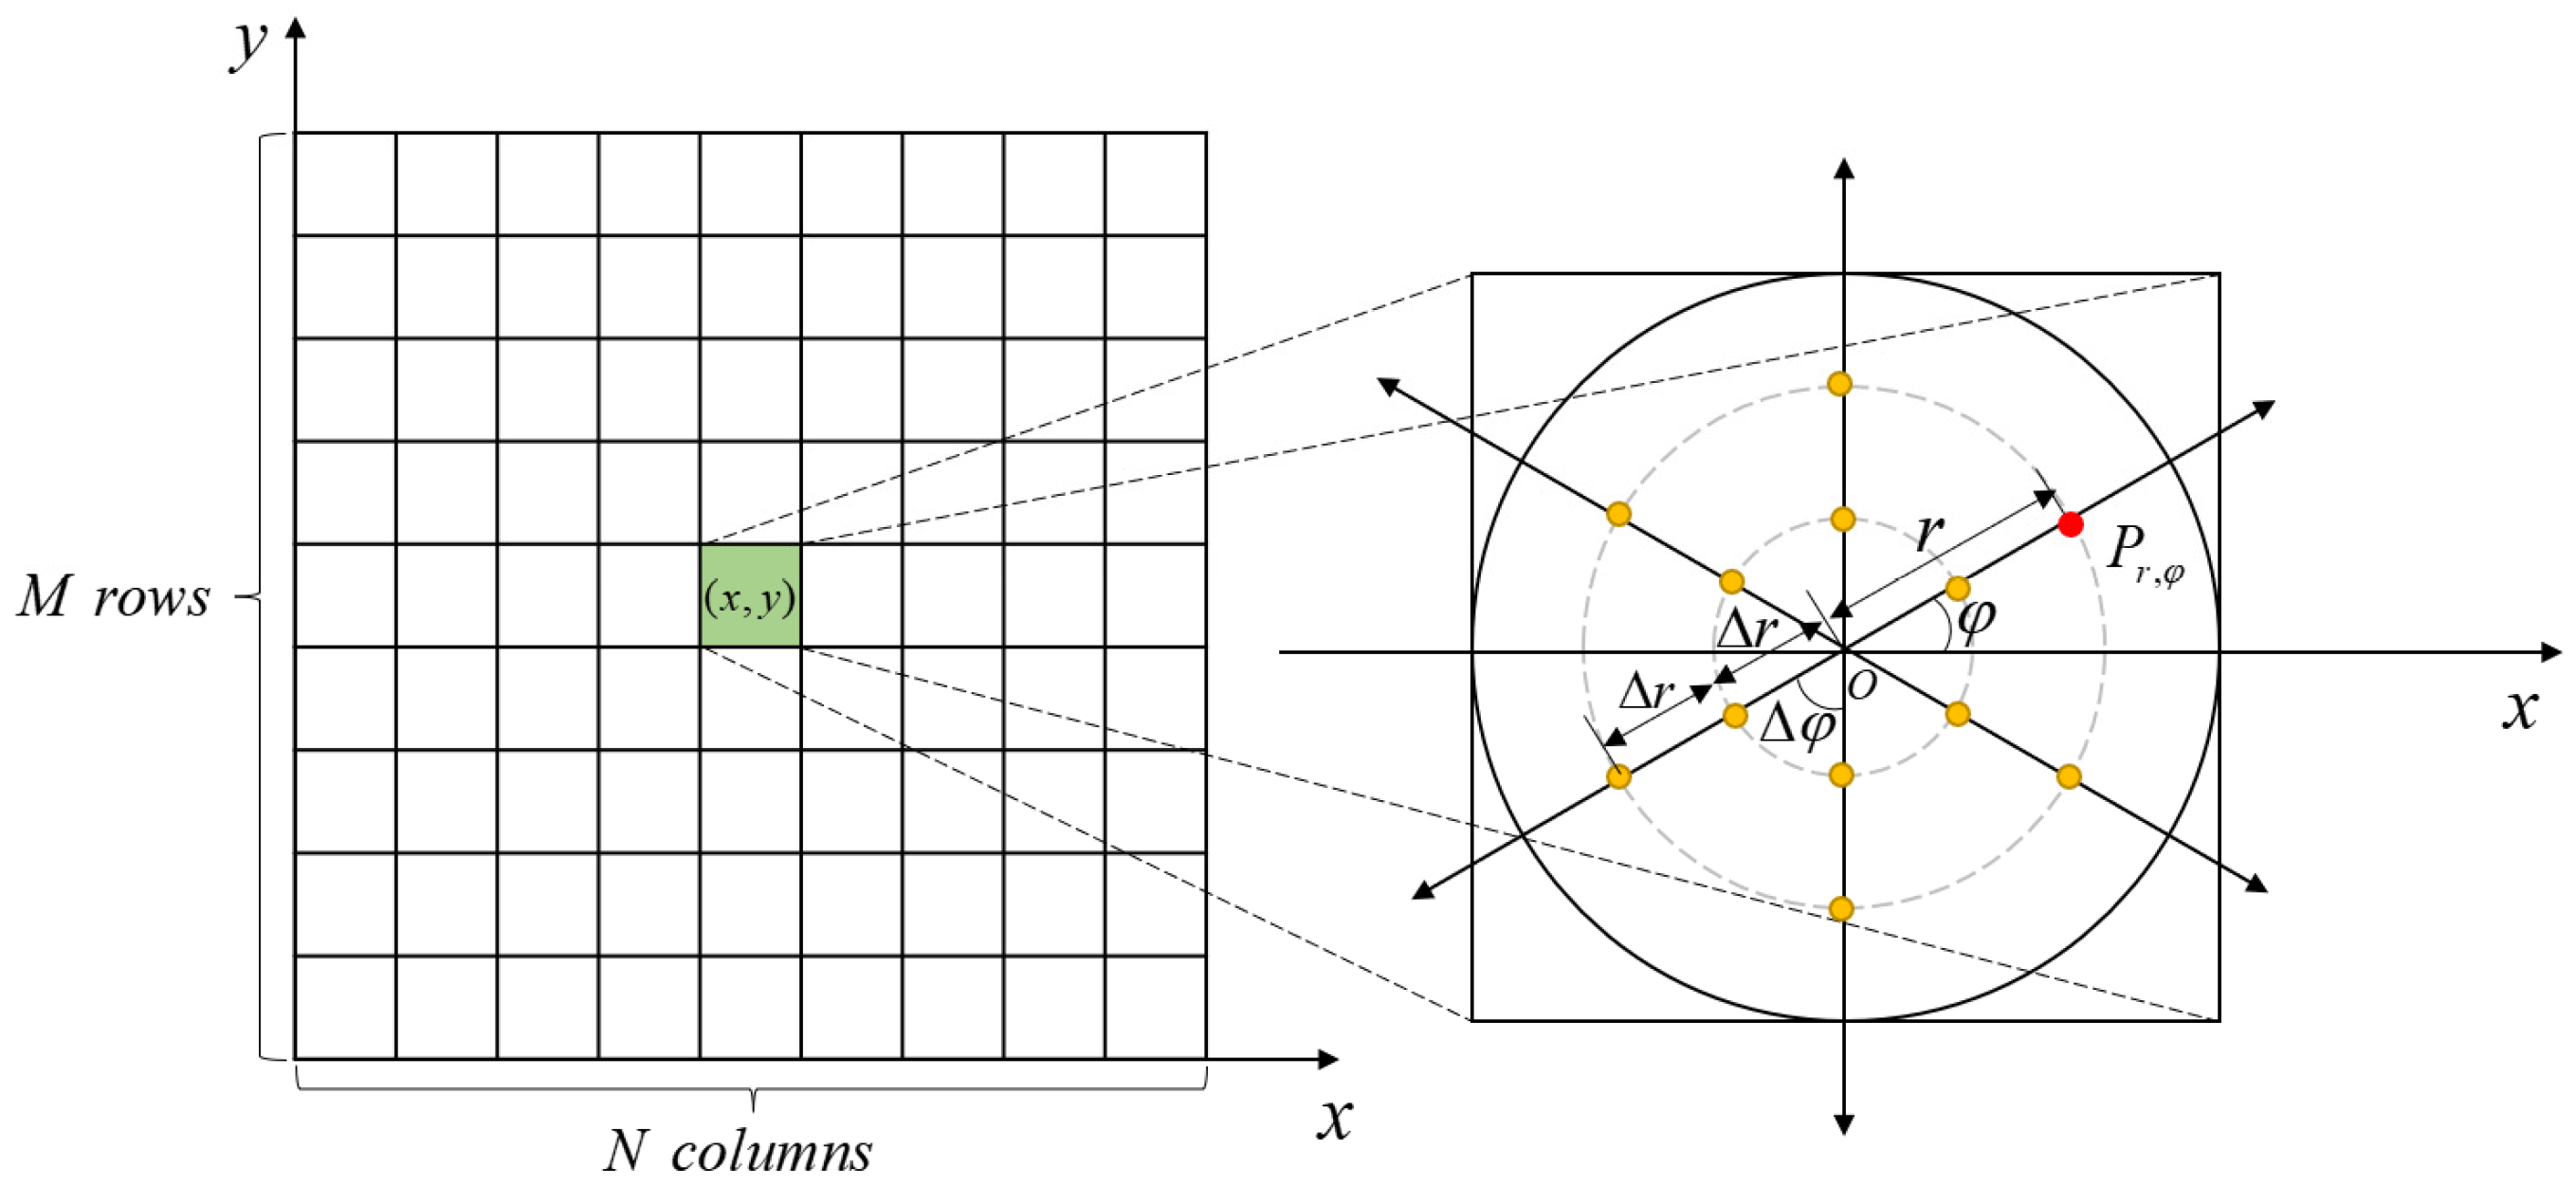
(1) At a certain depth h , divide the entire area into multiple sub-areas, as shown in Figure 3.
(2) Based on the center point O of each sub-areas, according to azimuth interval Δ φ and distance step Δ r , take a series of sampling points. Then, calculate the detection probability P φ , r of each calculation point using Equation (5).
Where P φ , r is the probability of calculation point which is located at relative azimuth φ and relative distance r ;
(3) For a specific azimuth φ i , if P φ i , r greater than the detection threshold P λ , it is considered that the point can be detected. R φ i is the maximum detectable distance in the azimuth, as shown in Equation (6).
R φ i = arg   max r ( P φ i , r > P λ )
(4) The average of the detection distances in all directions is recorded as the detection radius of this sub-area, indicating the distance that can be detected if the underwater glider is located in this sub-area.
R x y = 360 Δ φ i = 1 360 / Δ φ R φ i
where R x y ( x = 1 , 2 , , M , y = 1 , 2 , N ) is the detection radius at the grid ( x , y ) .
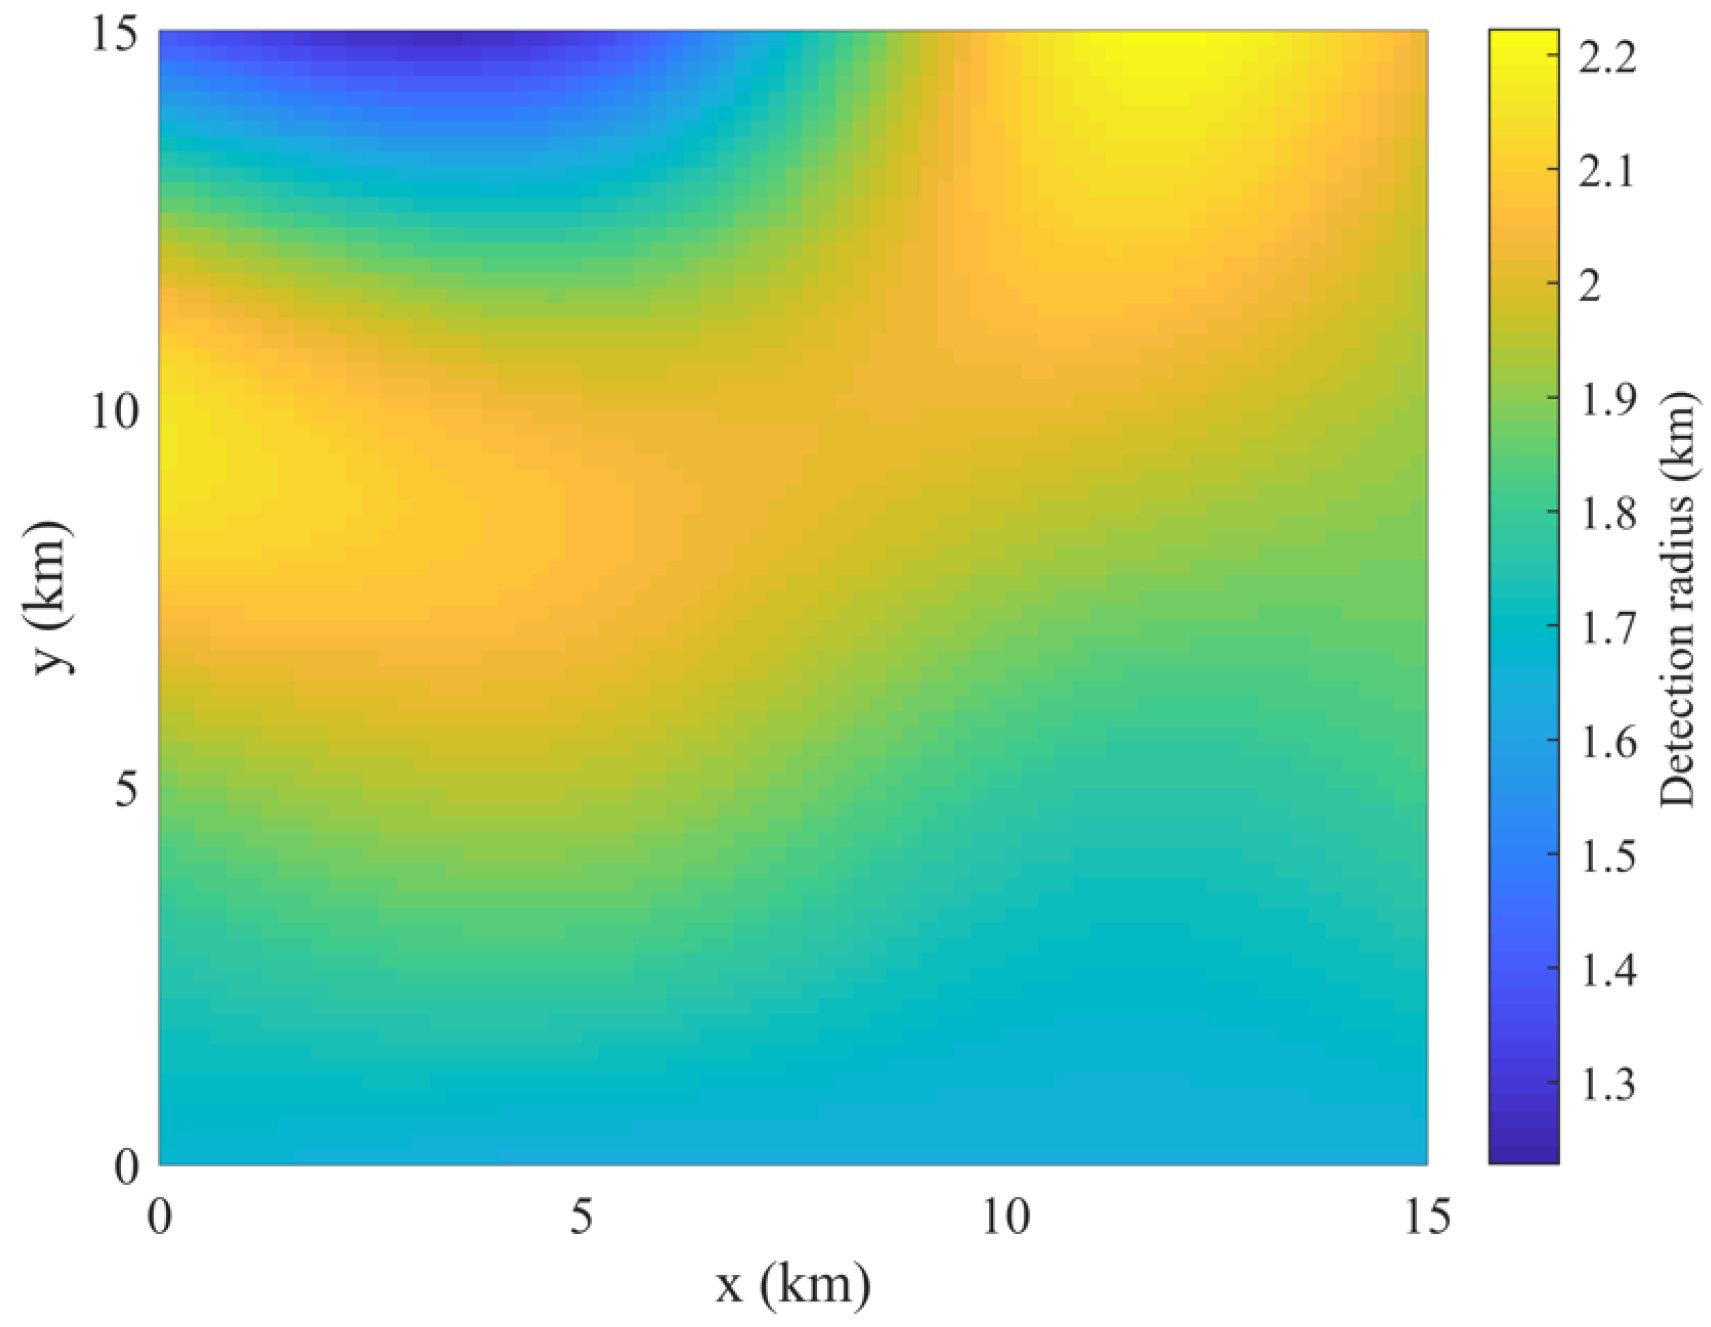
The detection radius of different points is shown in Figure 4. The warmer the color of the grid, the larger the detection radius, and vice versa.
In general, the detection radius of the UG is much larger than the depth of the seabed topography. Therefore, we assume that the UG can detect all depth ranges of the current grid, and we only need to consider the 2D coverage effect.
At time t , the state of the grid ( x , y ) is o x y ( t ) , using binary encoding, which is set to 1 if the grid is covered, and set to 0 if the grid is not covered. Assuming the glider is in grid ( x , y ) at time t , its detection range follows:
o x y ( t ) = 1 , i f ( d i s < R x y ) 0 , i f ( d i s > R x y )
where d i s represents the Euclidean distance between the surrounding grid and the grid where the glider is currently located.

3.3. Detection Model of One-Period Gliding

The UG will glide for one period in the saw-tooth pattern motion shown in Figure 1. Assuming that the diving gliding angle and the ascending gliding angle are the same as θ , and the steady-state gliding speed is V , the vertical speed V z and horizontal speed V x can be calculated as follows:
V z = V sin ( θ ) V x = V cos ( θ )
Assuming the horizontal distance for one period of gliding:
S = 2 D tan ( θ )
where D is the dive depth. The time required to glide one period is:
T p e r = 2 D V z = 2 D V sin ( θ )
At time t , the UG is ready to start a period of gliding. The UG enters the water from point P t ( x t , y t ) , and glides one period at heading angle H . The water outlet point P t + T p e r ( x t + T p e r , y t + T p e r ) and the water inlet point satisfy the following relationship:
x t + T p e r = x t + S × cos ( H ) y t + T p e r = y t + S × sin ( H )
where t + T p e r is the water outlet time.
The UG will detect during the entire gliding period and update the grid coverage state according to Equation (8).

4. MGCPP-ACO

4.1. Optimization Objective

Multiple UGs may cover the same grid repeatedly. As long as any UG covers the grid, the grid is considered to be covered. C x y ( P ) represents the situation of grid coverage map after P periods and it can be calculated:
C x y ( P ) = 1 , k = 1 m t = 1 P o x y ( P ) > 1 0 , k = 1 m t = 1 P o x y ( P ) = 0
where m is the number of UGs.
The optimization objective is to maximize the area coverage rate after m UGs glide for P periods, as shown in the following formula:
max P c ( P ) = x = 1 M y = 1 N C x y ( P ) M × N
where P c is the area coverage rate.

4.2. Ant Colony Optimization

The ant colony optimization (ACO) algorithm is an intelligent optimization algorithm, which has good advantages in discrete optimization problems [19]. The ants are considered UGs for coverage path planning. The mapping relationship between UGs and ants is shown in Table 1:
We improve the algorithm based on ant colony optimization to meet the UG’s motion constraints and optimization objectives. In each iteration, we use w groups of ants, and each group has m ants, corresponding to m UGs. The initial position of the ants corresponds to the initial position of the UGs, and the initial heading of the ants corresponds to the initial heading of the UGs.

4.2.1. Collaboration Strategy

Specifically, each group of ants walks in turn according to the transition probability and stops after walking for P periods in each iteration. After the w × m ants in one iteration have all walked, the pheromone on the updated path provides a reference for the ants in the next iteration. As the iteration progresses, the ants’ paths will gradually converge. The final convergent path is the optimal path for area coverage.

4.2.2. Feasible Region Constraints

Considering the special kinematic characteristics of UGs, the feasible region needs to be redesigned. Firstly, UGs have special motion trajectories. The horizontal distance for one gliding period is affected by the gliding angle and the depth, and both of them have limitations that lead to the limited water exit point. Secondly, the flexibility of the UG is low, and it cannot complete a large turn, so there is a constraint on the amount of change in the turning angle. Therefore, the feasible region is a restricted set of water outlet points.
From Equation (10), the relationship between the single-period horizontal distance and the profile depth and gliding angle variation can be shown in Figure 5. When the gliding angle is the largest and the depth is the smallest, the single period gliding horizontal distance takes the smallest value S min . When the gliding angle is the smallest and the depth is the largest, the single period gliding horizontal distance takes the maximum value S max .
H p is the heading angle of the p period and the heading change angle is Δ H . The heading angle range of the p + 1 period is H p + 1 [ H min , H max ] . The heading angle is defined as the angle between the positive direction of the axis. H min and H max can be calculated:
H min = H p Δ H / 2 H max = H p + Δ H / 2
The maximum horizontal distance of gliding, the minimum horizontal distance of gliding and the heading angle jointly constrain the feasible region. The next exit point of the UG will be in the fan-shaped area as shown in Figure 6.
Considering the special zigzag motion trajectory of the UG, it may bottom out during the gliding process, so it is necessary to further constrain the feasible region. According to the motion model of the UG, all the waypoints of the UG can be calculated. If the depth of a point in the waypoint is greater than the terrain depth, the grid is marked as an unreachable point and removed from the feasible region.
Restricted by terrain and steering, the feasible region may be empty. At this time, the ant is determined to be a dead ant, and will not walk in the future. The fitness of this ant is set to -Inf.

4.2.3. State Transition Rule

The k th ( k = 1 , 2 , , m ) ant in each group of ants chooses the next path in turn, and the probability of the k th ant transferring from the grid i to the grid j at time t is P i j k ( t ) , which is calculated by the following formula:
P i j k ( t ) = ( τ i j k ( t ) ) α ( η i j ( t ) ) β a a l l o w ed τ a ( t ) η a ( t ) a a l l o w ed k ( t ) 0 o t h e r
where a l l o w ed k ( t ) is the set of grids that k th ant can choose in the next step at time t .
τ k i j ( t ) represents the pheromone concentration between grid i and grid j at time t . There are m pheromones in the map, corresponding to m ants. The k th ant is only affected by the k th pheromone, and the pheromone will be updated after the ant walks through the grid. α represents the pheromone weight. β is the weight of the heuristic function.
η i j ( t ) is the heuristic function, representing the expected degree of ant transfer from grid i to grid j . Assuming that the ant is in the grid i at time t , and the ants are in the j grid at time t + T p e r , the definition is as follows:
η i j ( t ) = x = 1 , y = 1 M × N o x y ( t + T p e r ) x = 1 , y = 1 M × N o x y ( t )
where x = 1 , 2 , , M , y = 1 , 2 , , N . x = 1 , y = 1 M × N o x y ( t + T p e r ) indicates the number of grids covered at time t + T p e r , x = 1 , y = 1 M × N o x y ( t ) indicates the number of grids covered at time t . The difference η i j ( t ) represents the increased number of undetected grids transferred from i grid to grid j , which can make the ants move towards the unexplored grid.
Calculate the transition probability of the current grid i and all grids in the feasible region in turn. Use the roulette method to choose which grid the ants will choose next. This helps to increase the randomness of the paths chosen by the ants and prevents the algorithm from falling into local optima.

4.2.4. Escape from Local Optimum

When the ants find that η i j ( t ) of all grids in the feasible region is zero, it means that the ants cannot explore new uncovered grids. The ants are trapped in the local optimum, and the heading is adjusted according to the following formula:
H = arg min H a H a H t a r
where H a represents all the selectable headings in the feasible region. H t a r is the target heading of the ants, which can be calculated by the following formula:
H t a r = atan ( y t a r y t x t a r x t )
where ( x t a r , y t a r ) is the closest uncovered grid to the current grid and ( x t , y t ) represents the current coordinates of the ant.

4.2.5. Fitness Function

The fitness function is the number of grids covered by the P period after the ants walk. The calculation method is as follows:
f i t = x = 1 , y = 1 M × N C x y ( P )
In Section 3.2, the optimization objective is the coverage from 0 to 1, and directly using the coverage as the fitness function will lead to small calculation results. In order to reflect the different coverage effects of ants choosing different paths and accelerate the convergence speed of the algorithm, the number of grids covered by ants in P cycles after walking was taken as the fitness function, which was obtained by enlarging the optimization objective by M × N times. In fact, both functions are unified.

4.2.6. Pheromone Update Rule

Before iteration, there are initial pheromones τ 0 on all paths. During each iteration, each m ants walk as an ant unit with the same fitness. When w × m ants all finish their pathfinding, the m pheromones on the path are updated. In order to prevent the same group of ants from interfering with each other, we made some restrictions. The k th ( k = 1 , 2 , , m ) ant will only affect the k th pheromone.
In the algorithm, the dimension of the pheromone matrix is consistent with the dimension of the grid map, both are M × N. When the ant’s path contains the grid, the pheromone of the grid will be updated by pheromone update rules. For grids without ants passing by, the pheromone in them will evaporate over time, the evaporation rate controlled by the evaporation coefficient ρ .
The pheromone update rule is as follows:
τ k i j ( t + T p e r ) = ( 1 ρ ) τ k i j ( t ) + Δ τ k i j
τ k i j ( t + T p e r ) represents the k th pheromone between grid i and grid j after the update at time t + T p e r , τ k i j ( t ) and represents the k th pheromone between grid i and grid j before the update at time t . ρ is the volatility coefficient, Δ τ k i j is the pheromone left by the ants, and the calculation method is as follows:
Δ τ k i j = Q × f i t k , ant s   path   contains   cell   i , j 0 , o t h e r s
where Q is a constant, f i t k is the fitness of the k th ant. Too high or too low pheromone will increase the probability of falling into a local optimum. In order to avoid this situation, the pheromone is limited to a certain range τ min , τ max . The optimized pheromone update rules are as follows:
τ k i j ( t + T p e r ) = τ min τ k i j ( t + T p e r ) < τ min τ k i j ( t + T p e r ) τ min < τ k i j ( t + T p e r ) < τ max τ max τ k i j ( t + T p e r ) > τ max

4.3. Pseudocode of MGCPP-ACO

The pseudocode of MGCPP-ACO is given in Algorithm 1. Lines 1 to 2 correspond to the initialization of the algorithm. Lines 3 to 25 correspond to the main loop of the algorithm. At the end of the algorithm (line 26), it will return the optimal coverage path after iteration.
Algorithm 1: MGCPP-ACO
01: Model underwater environments and initialize pheromone amount
02: Determine the initial positions and heading of ants and parameters of ACO
03: while termination rule is not met do
04: Mark all ants as alive and place them at starting points
05: for g = 1 to w
06:  for p = 1 to P
07:   for i = 1 to m
08:   if  a n t i is alive
09:    Implement state transition rule to select next waypoint
10:    if feasible region is NULL
11:     Escape from local optimum
12:    end if
13:   else
14:    The fitness of anti = -Inf
15:   end if
16:    a n t i moves to next waypoint
17:   if  a n t i collisions with the seabed
18:    Mark a n t i as dead
19:   end if
20:   end for
21:  end for
22:  Evaluate paths of all alive ants;
23: end for
24: Implement pheromone update rule to update pheromone
25: end while
26: Returns the final path of the iteration

5. Simulation Experiment and Result Analysis

In this section, we show the path of the algorithm in the 2D plane and 3D space and analyze the adaptability of the algorithm to different initial positions and initial headings. Then, we compare the algorithm with the traditional scan-line algorithm and analyze the performance.

5.1. Simulation Environment

We use MATLAB for simulation; multiple UGs will perform coverage tasks in 15 km × 15 km, and we use the actual seabed topography as the depth constraint. The UG simulation parameters are shown in Table 2 [20].

5.2. Analysis of MGCPP-ACO Algorithm

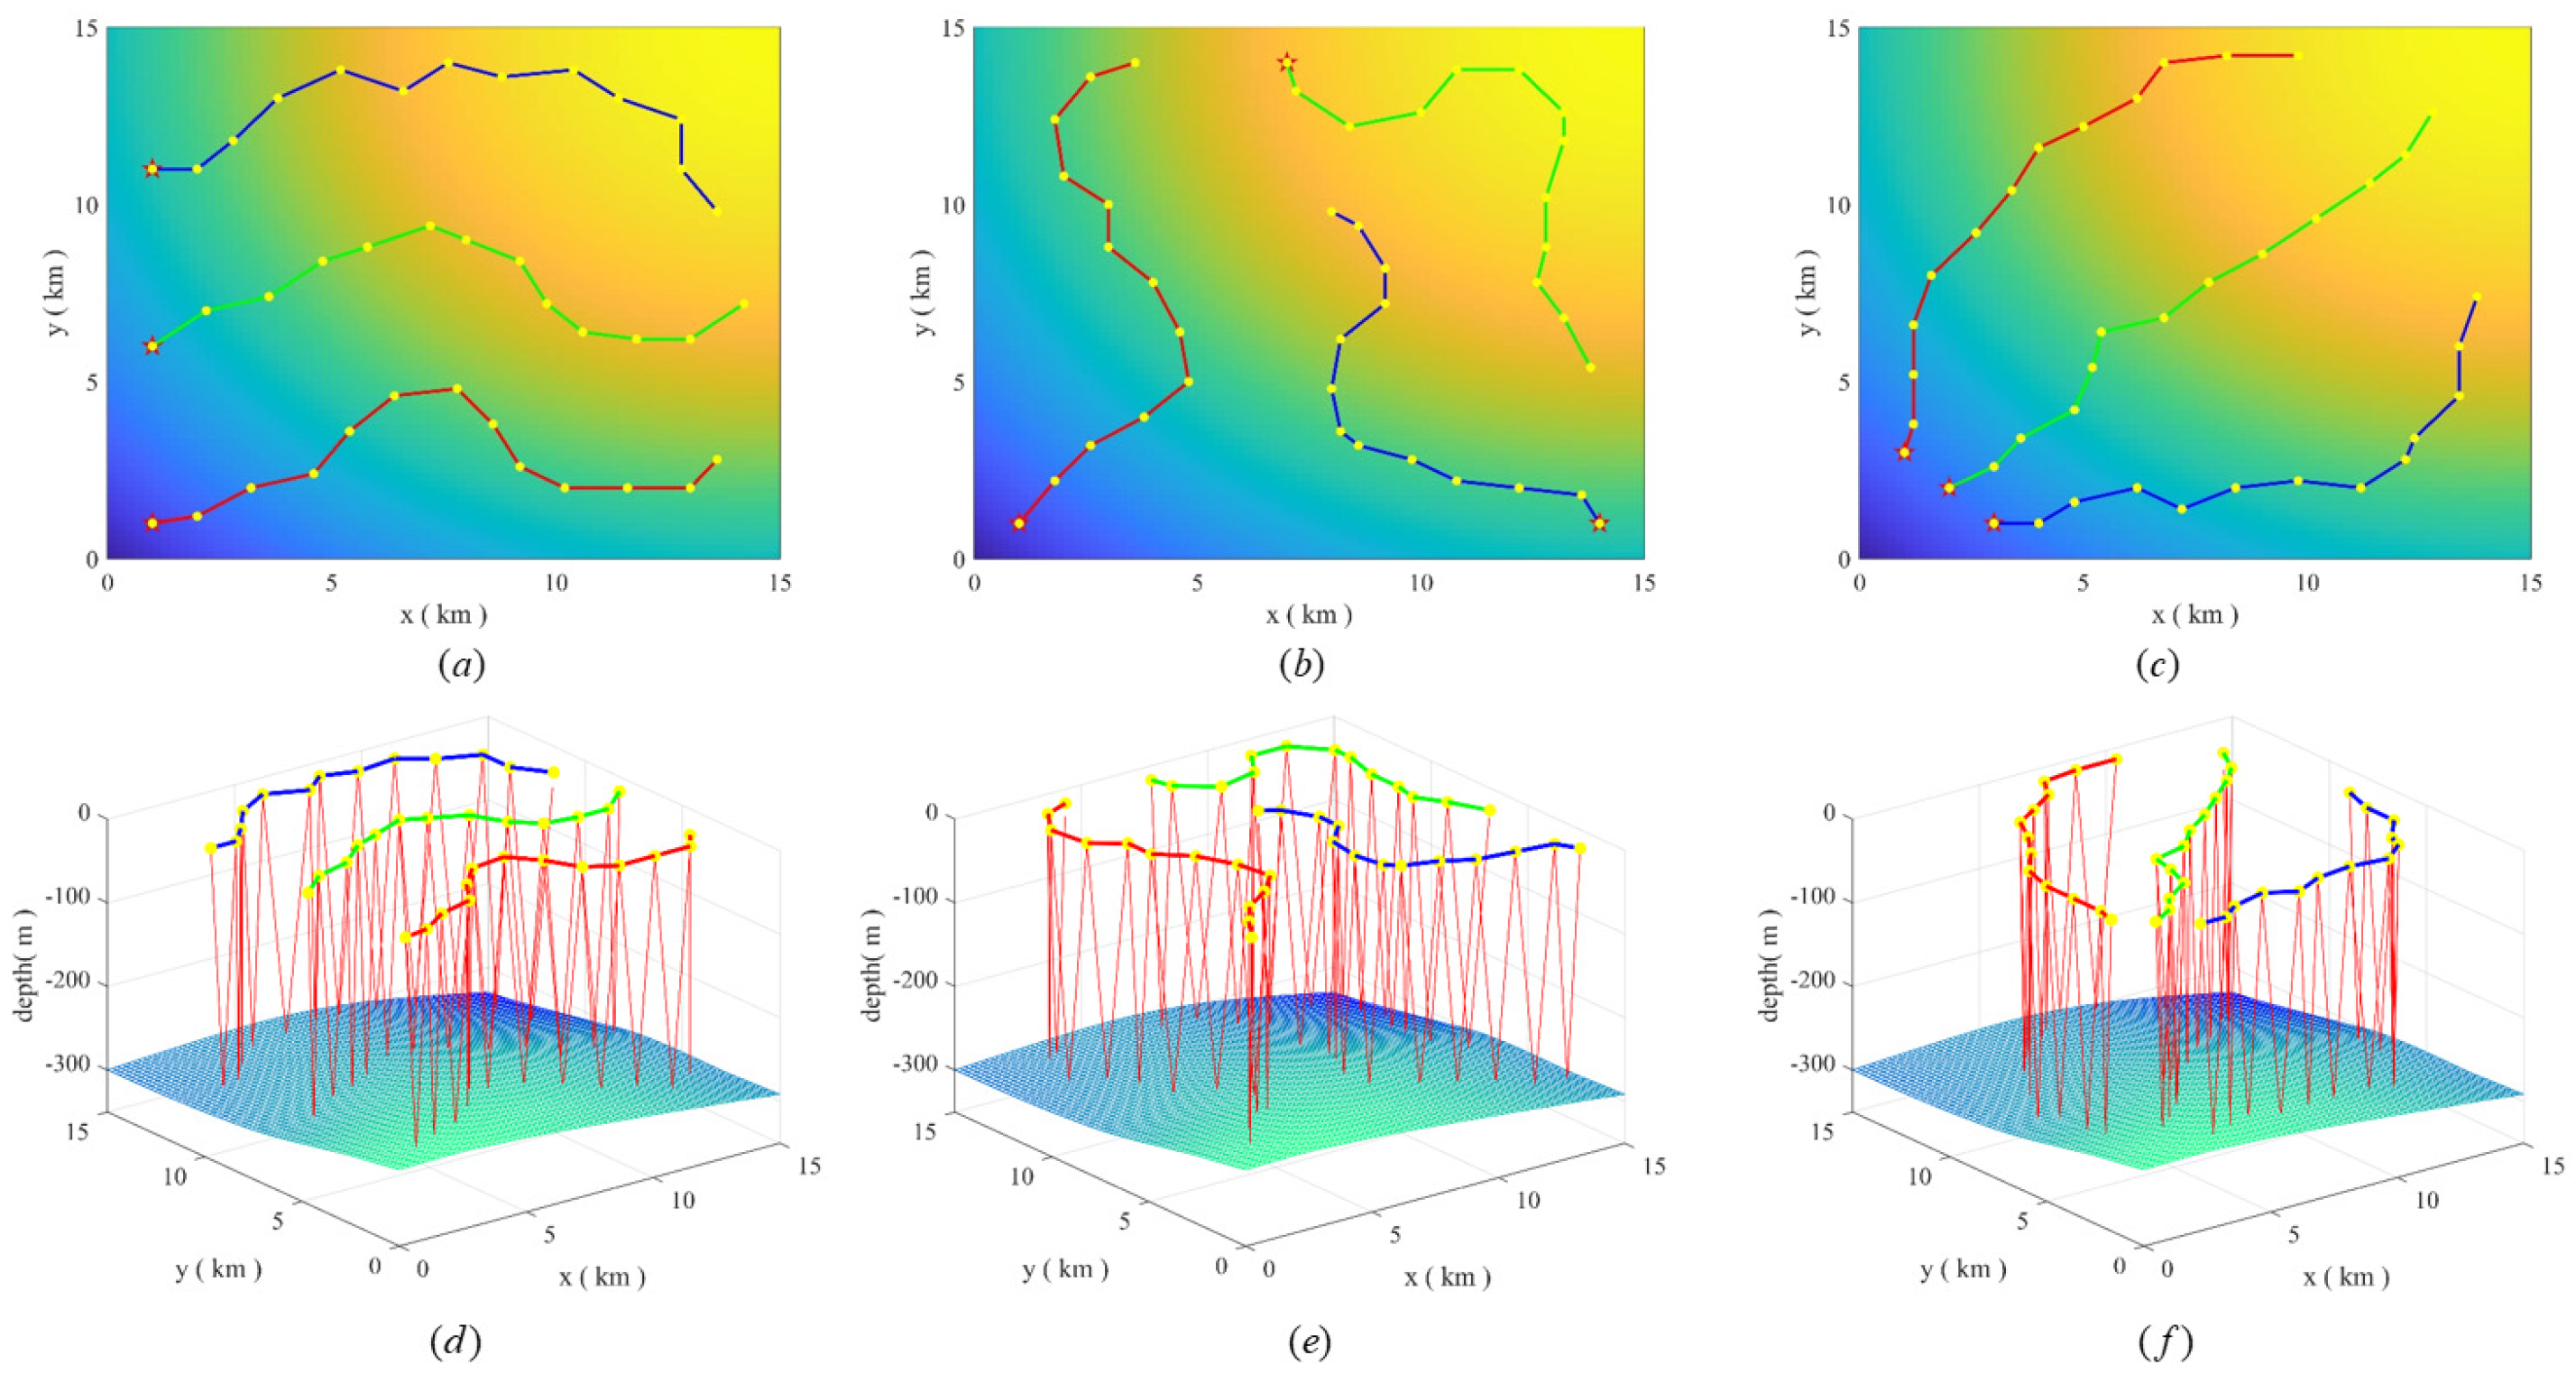
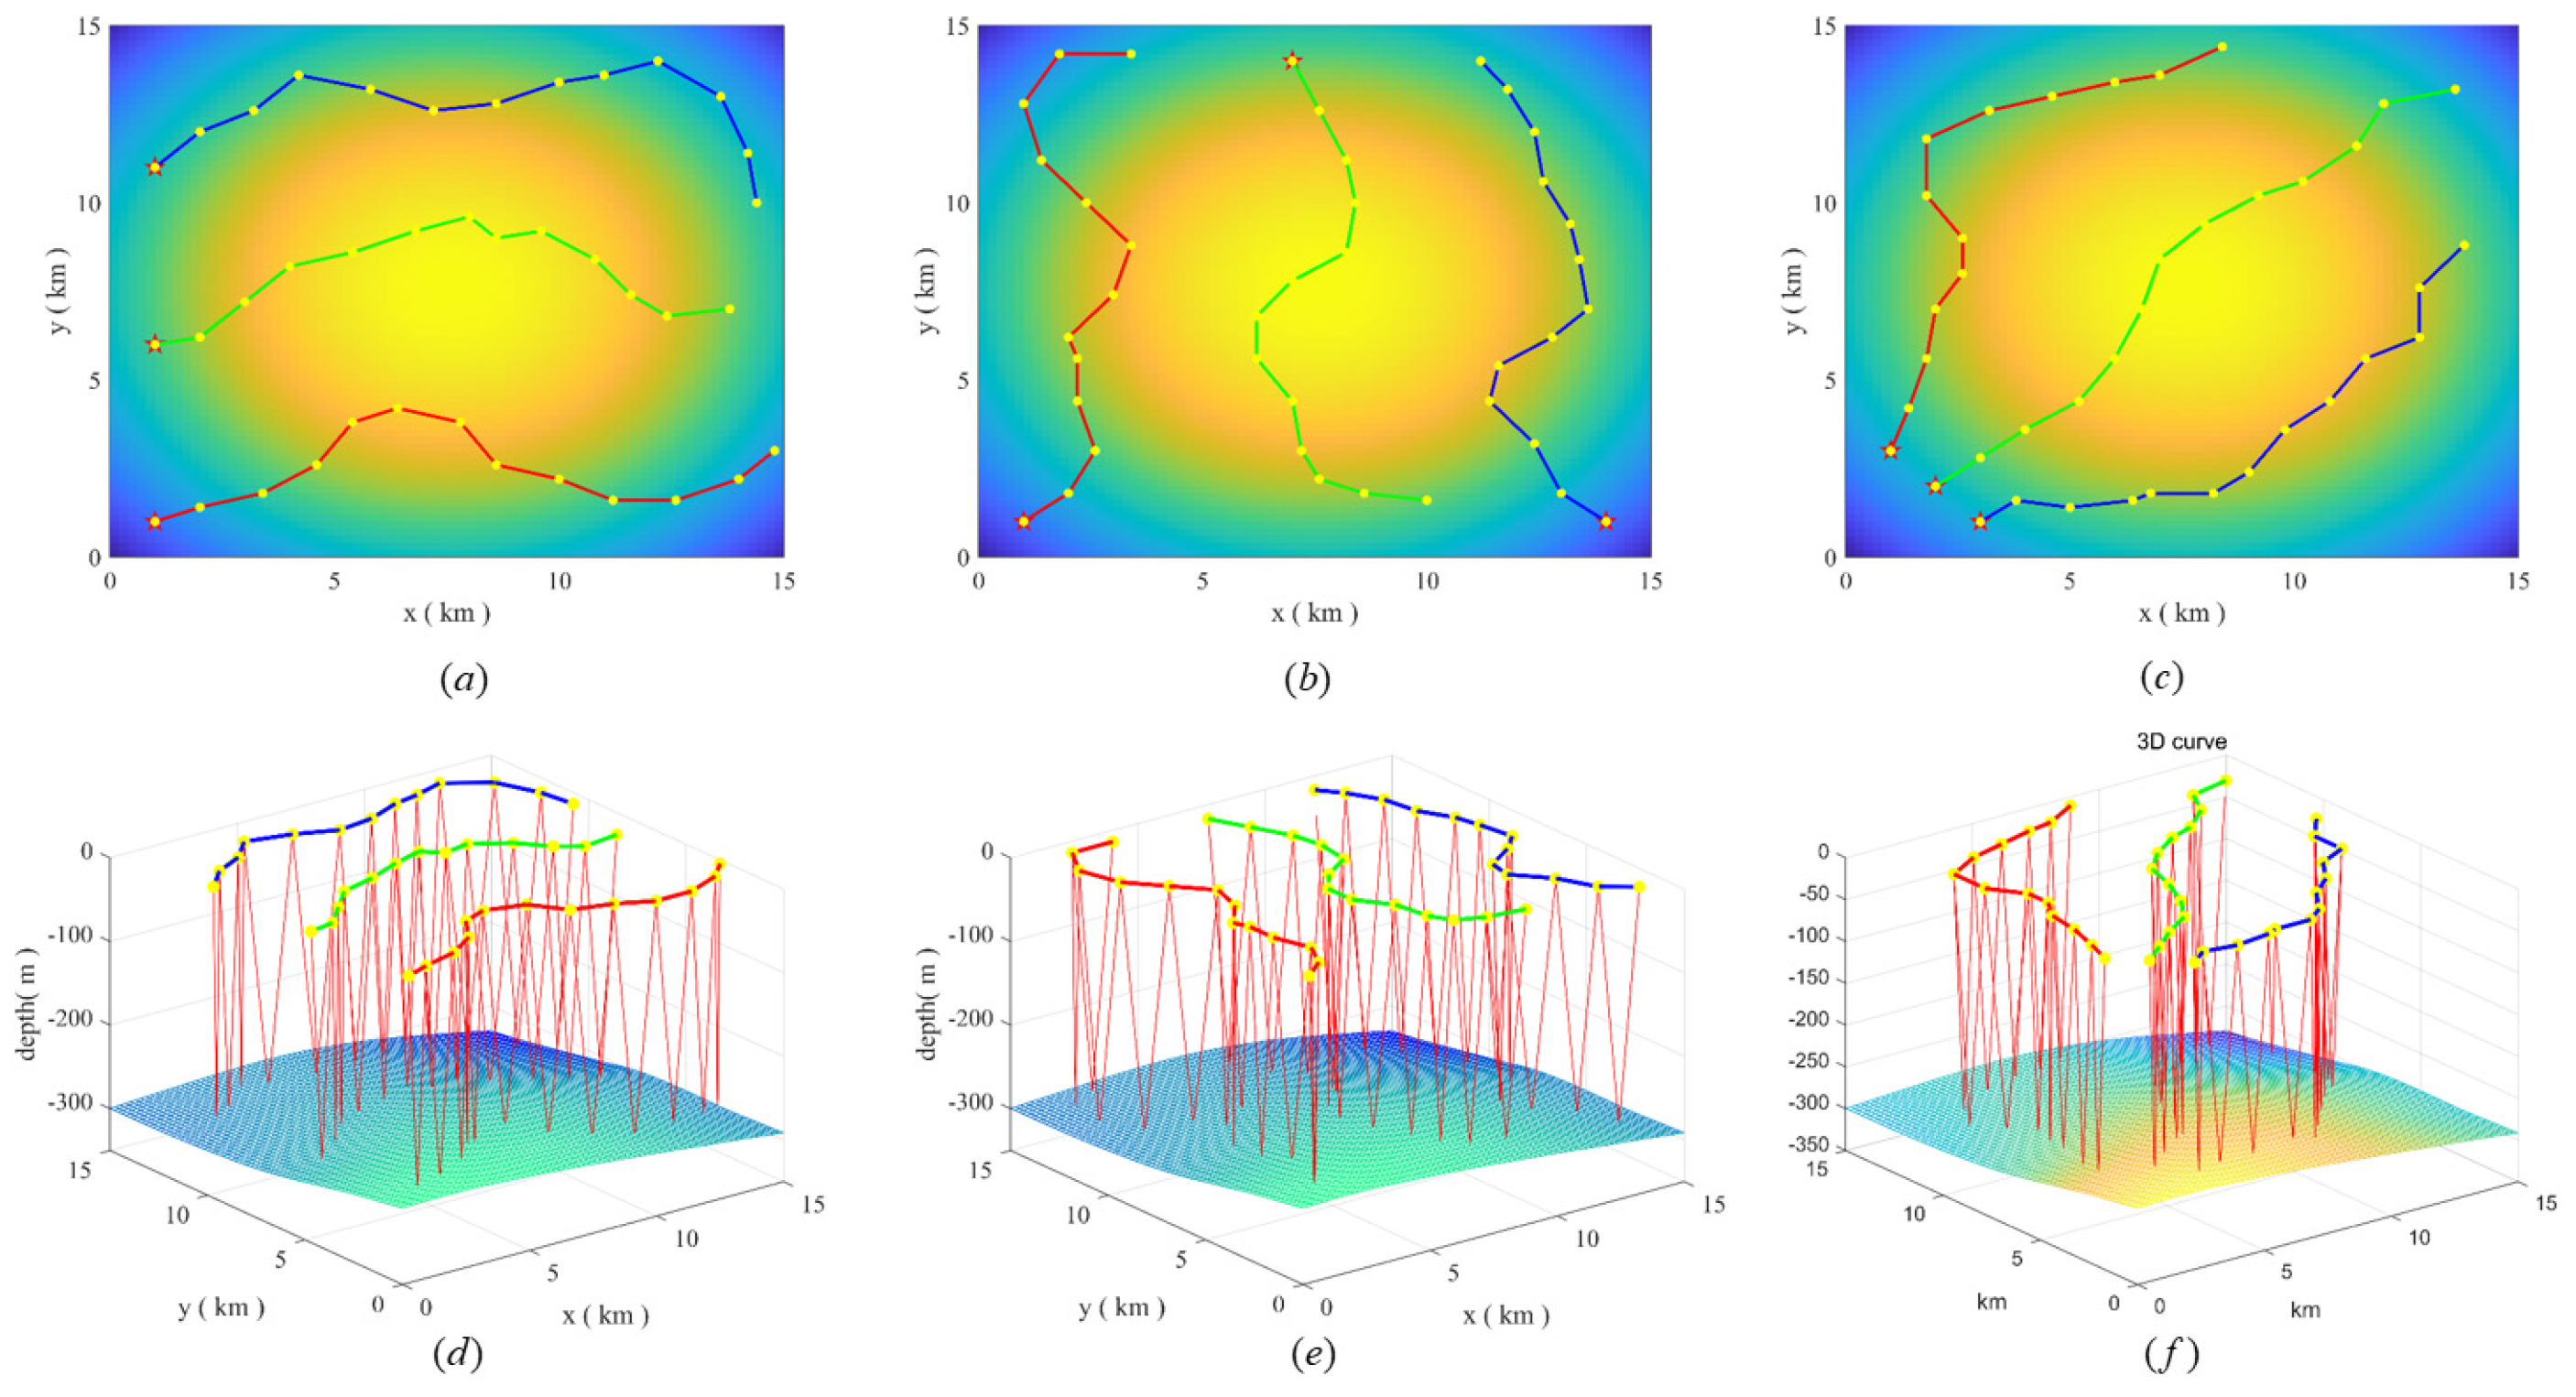
In Scenario 1, we carried out several simulation experiments to demonstrate that the proposed algorithm adapts to the different initial positions and headings angles. The three UGs glide fixedly for 12 periods. Table 3 shows the initial coordinates and heading angle, and Figure 7 show the coverage effect under different parameters.
As shown in Table 3, the proposed algorithm achieves high coverage for different initial positions and initial heading angles.
Figure 7a–c show that the UGs keep going to the undetected area and avoid colliding with each other. This is due to the setting of the heuristic function, since the number of new uncovered grids is reduced by the close distance. The pheromone mechanism of the ant colony maintains the global optimality of the algorithm and allows the algorithm to have a high area coverage.
In addition, the algorithm makes full use of the detection effectiveness of the region. The UGs glider to locations with larger detection radius to improve the area coverage.
Figure 7d–f show that the 3D trajectories of the UGs are not the same for each glide, because the algorithm adaptively adjusts the glide angle and depth to avoid collision with the seafloor, and adjusts the water exit point to reach the place with better detection effectiveness.
In addition, to demonstrate the adaptability of the algorithm under different detection radius maps, we additionally conduct two group of experiments whose detection radius maps are not the same.
Figure 8 shows the detection radius map and simulation results under scenario 2. Figure 9 shows the detection radius map and simulation results under scenario 3. The simulation results and the coverage rate in Table 3 show that the algorithm still has high adaptability to different detection radius maps.

5.3. Performance Comparison

5.3.1. Scanline Covering (SCAN) Algorithm

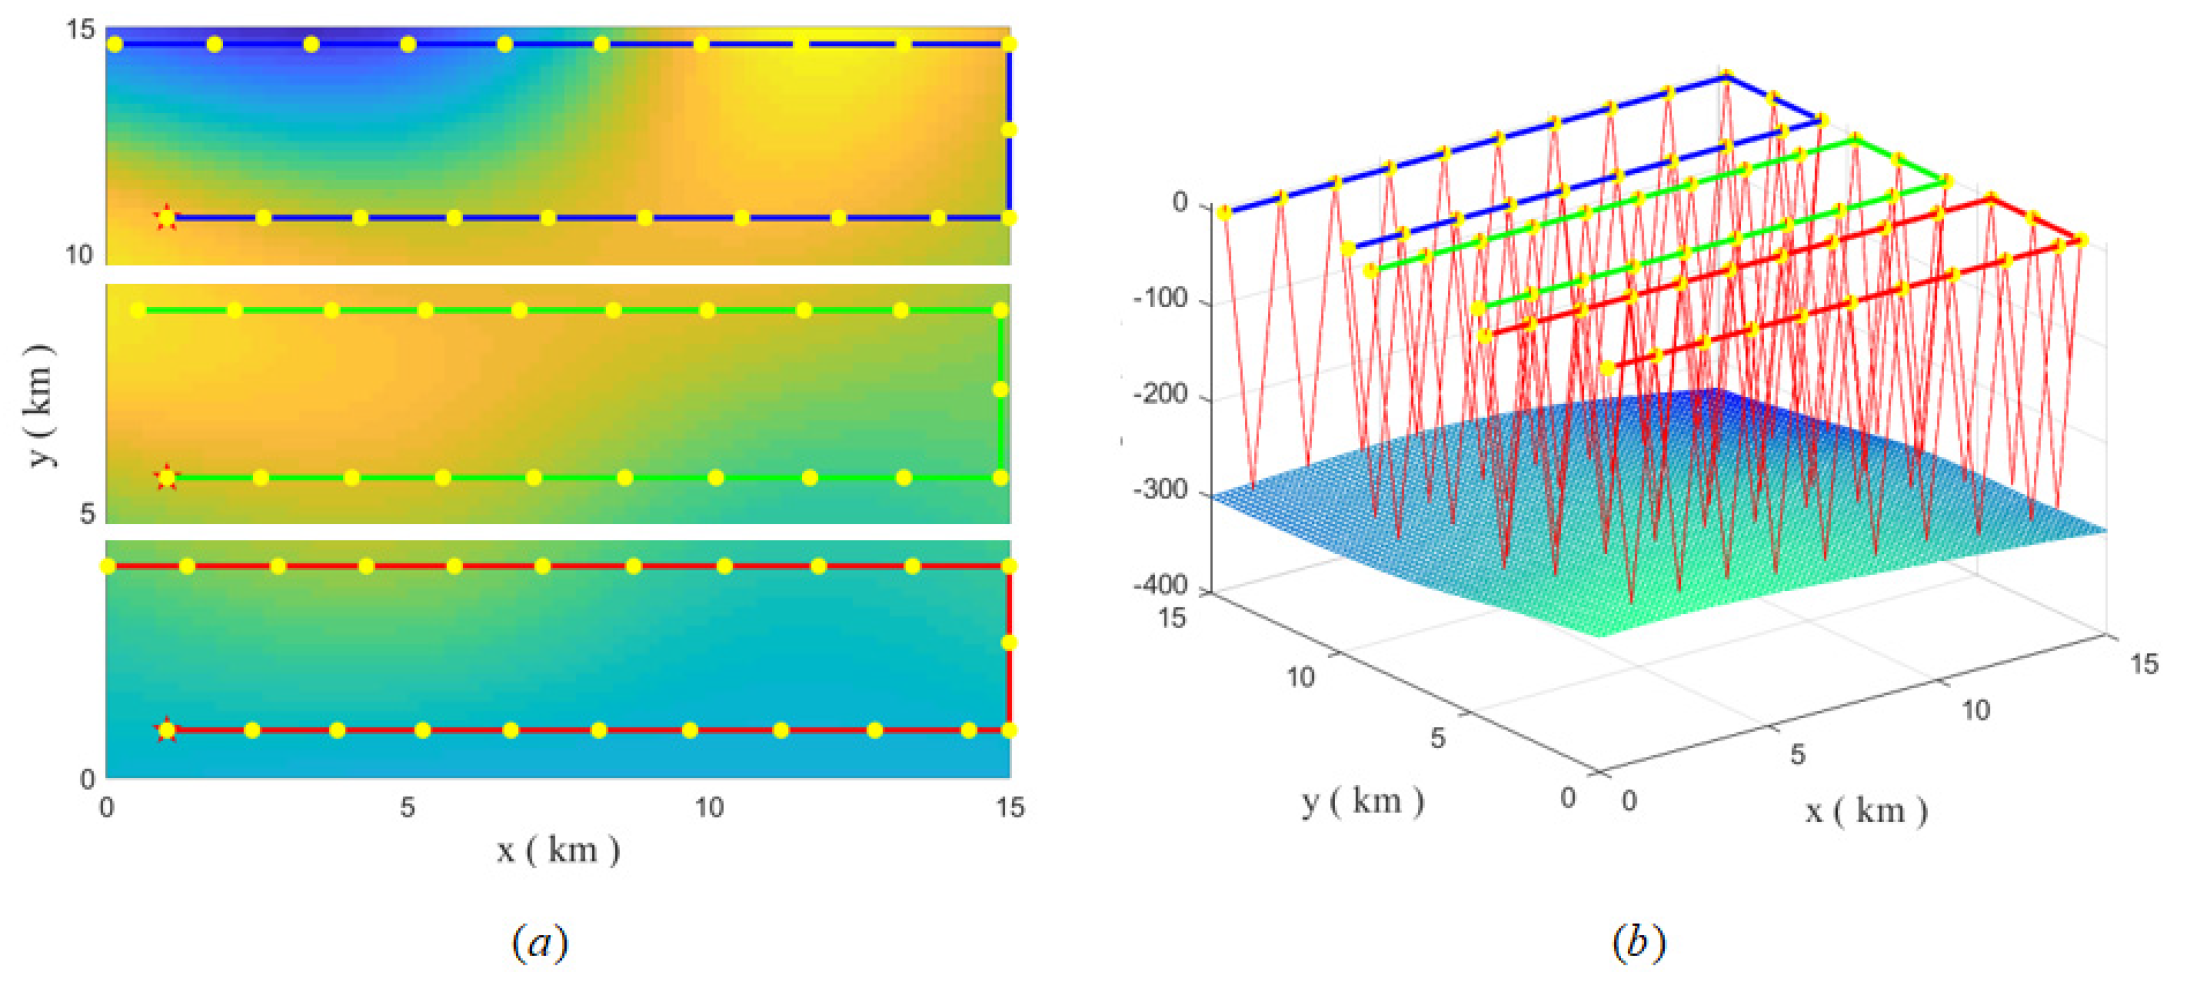
The scan-line (SCAN) algorithm proved to be simple and effective when covering rectangular areas [21]. The coverage path consists of straight lines and 90° turns, and the two parallel lines are separated by twice the detection radius to minimize overlapping coverage [22].
We decompose the entire area into rectangular areas equal to the number of UGs, where each glider covers an area correspondingly. They all use the SCAN algorithm to cover sub-regions.
The UG uses the most energy-efficient gliding angle for sailing while avoiding hitting the seabed. Because of the different gliding parameters each time, the horizontal distance of gliding is also different. There is a different detection radius at different locations, so we use twice the average detection radius of the entire sea area as the interval between parallel lines. The UG will automatically calculate the glide period according to the interval. Figure 10 shows the motion trajectories of the SCAN algorithm in 2D space and 3D space, respectively.

5.3.2. Comparison and Analysis

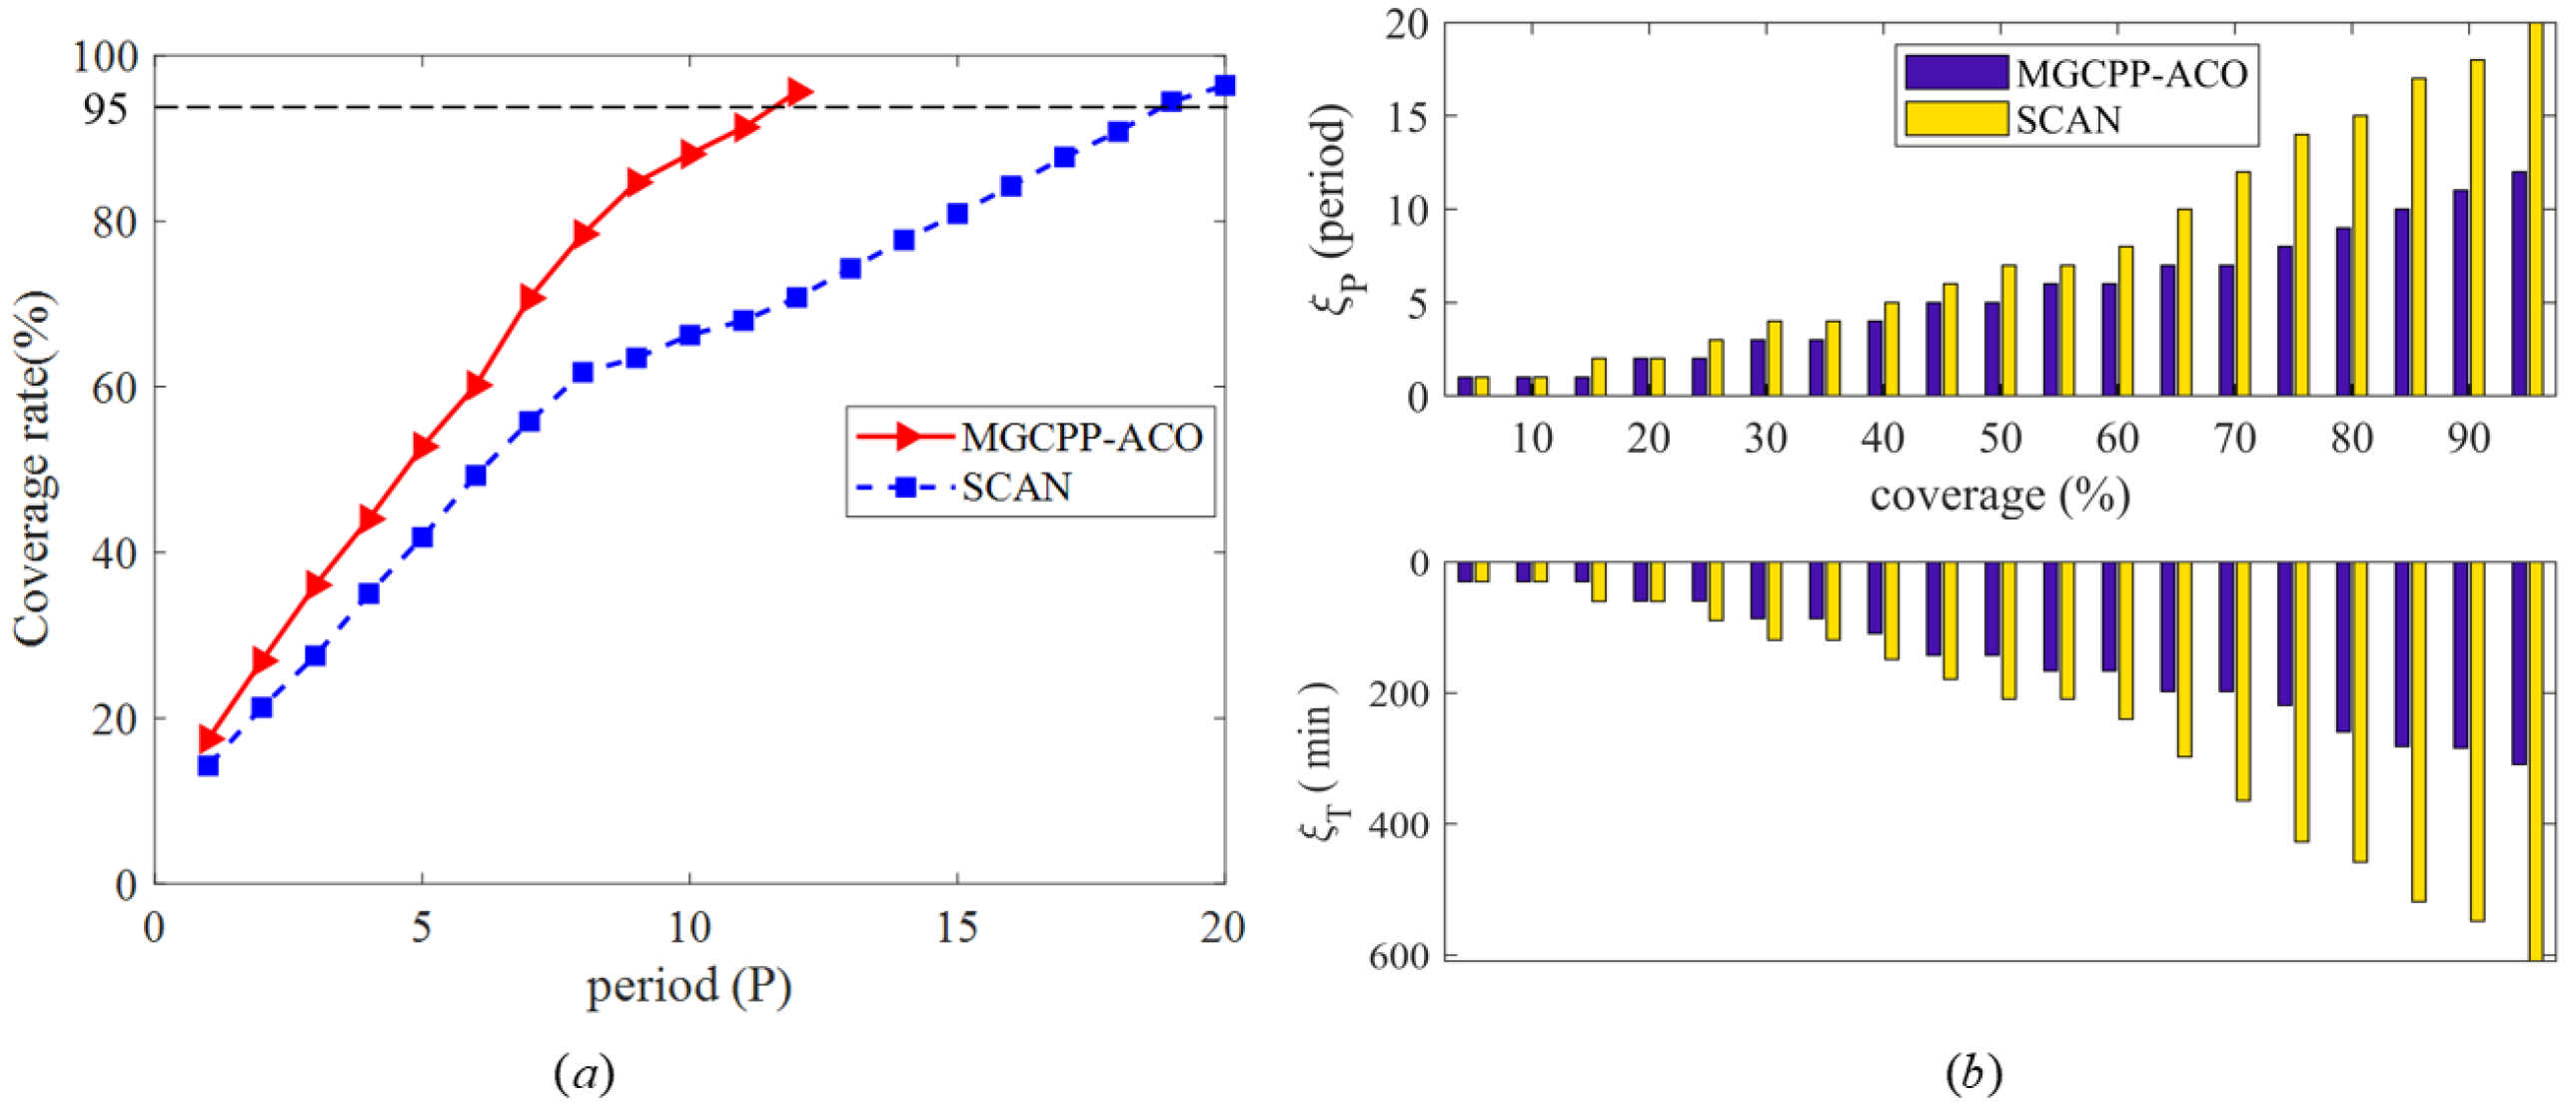
Next, we compare the proposed algorithm with the SCAN algorithm. The initial headings and initial positions of the three UGs are the same as those of simulation No.1 in Table 3. The simulation requires to reach 95% area coverage rate; otherwise, continue to increase the glide period.
Coverage rate P c and coverage requirements ξ P , ζ T are used to evaluate both algorithms. P c can be calculated by Equation (14), which represents the detection coverage of the area after a fixed glide P period. ξ P is the number of periods required to glide when the same coverage is required, and ζ T is the time required to glide when the same coverage is required.
Figure 11a shows the coverage rate of the two algorithms. When sailing for the same number of periods, the MGCPP-ACO algorithm has higher coverage than the SCAN algorithm and completes the task earlier (the 12th period), while the SCAN algorithm takes 20 periods to complete the task. The coverage efficiency of the MGCPP-ACO algorithm is also significantly better than that of the SCAN algorithm. This is due to the setting of the heuristic function, which makes the glider tend to go to the uncovered grid, so the MGCPP-ACO coverage is more efficient.
Figure 11b shows the coverage requirements of the two algorithms, that is, the number of periods and time required to achieve the same coverage. The requirements of the MGCPP-ACO algorithm are significantly smaller than those of the SCAN algorithm. This shows that the algorithm proposed in this paper is less expensive and can complete the coverage task in fewer periods and time.

6. Conclusions

In this paper, we innovatively propose the MGCPP-ACO algorithm to solve the multi-UGs coverage problem. First, fully considering the influence of the kinematic constraints of the UG and the complex ocean environment on the sonar detection radius, we built the UG detection model. Then, for the multi-glider coverage planning problem, the basic ACO is improved to obtain higher coverage efficiency. Finally, the improved ACO algorithm is used to compare with the SCAN algorithm. The simulation shows that the MGCPP-ACO algorithm has higher coverage efficiency and lower coverage cost. In the future, we will consider the impact of ocean currents on multi-UGs coverage path planning.

Author Contributions

Software, H.J.; writing—original draft preparation, H.J.; writing—review and editing, H.H.; supervision, X.P.; project administration, X.P.; funding acquisition, X.P. All authors have read and agreed to the published version of the manuscript.

Funding

This work was funded by the National Natural Science Foundation of China under Grants 62076203.

Data Availability Statement

No new data were created or analyzed in this study. Data sharing is not applicable to this article.

Conflicts of Interest

The authors declare no conflict of interest.

References

  1. Wu, H.; Niu, W.; Wang, S.; Yan, S. An analysis method and a compensation strategy of motion accuracy for UG considering uncertain current. Ocean. Eng. 2021, 226, 108877. [Google Scholar] [CrossRef]
  2. Takeshita, Y.; Jones, B.D.; Johnson, K.S.; Chavez, F.P.; Rudnick, D.L.; Blum, M.; Conner, K.; Jensen, S.; Long, J.S.; Maughan, T. Accurate pH and O2 measurements from spray UGs. J. Atmos. Ocean. Technol. 2021, 38, 181–195. [Google Scholar] [CrossRef]
  3. Zhang, F.; Ennasr, O.; Litchman, E.; Tan, X. Autonomous sampling of water columns using gliding robotic fish: Algorithms and harmful-algae-sampling experiments. IEEE Syst. J. 2015, 10, 1271–1281. [Google Scholar] [CrossRef]
  4. Zhou, M.; Bachmayer, R.; de Young, B. Working towards seafloor and underwater iceberg mapping with a Slocum glider. In Proceedings of the 2014 IEEE/OES Autonomous Underwater Vehicles (AUV), Oxford, MS, USA, 6–9 October 2014; pp. 1–5. [Google Scholar]
  5. Wang, C.; Yuan, M. Application study of a new UG with single vector hydrophone for target direction finding. IEEE Access 2021, 9, 34156–34164. [Google Scholar] [CrossRef]
  6. Guastella, D.C.; Cantelli, L.; Giammello, G.; Melita, C.D.; Spatino, G.; Muscato, G. Complete coverage path planning for aerial vehicle flocks deployed in outdoor environments. Comput. Electr. Eng. 2019, 75, 189–201. [Google Scholar] [CrossRef]
  7. Perez-Imaz, H.I.; Rezeck, P.A.; Macharet, D.G.; Campos, M.F. Multi-robot 3D coverage path planning for First Responders teams. In Proceedings of the 2016 IEEE International Conference on Automation Science and Engineering (CASE), Fort Worth, TX, USA, 21–25 August 2016; pp. 1374–1379. [Google Scholar]
  8. Adaldo, A.; Mansouri, S.S.; Kanellakis, C.; Dimarogonas, D.V.; Johansson, K.H.; Nikolakopoulos, G. Cooperative coverage for surveillance of 3D structures. In Proceedings of the 2017 IEEE/RSJ International Conference on Intelligent Robots and Systems (IROS), Vancouver, BC, Canada, 24–28 September 2017; pp. 1838–1845. [Google Scholar]
  9. Han, G.; Zhou, Z.; Zhang, T.; Wang, H.; Liu, L.; Peng, Y.; Guizani, M. Ant-colony-based complete-coverage path-planning algorithm for UGs in ocean areas with thermoclines. IEEE Trans. Veh. Technol. 2020, 69, 8959–8971. [Google Scholar] [CrossRef]
  10. Kapoutsis, A.C.; Chatzichristofis, S.A.; Kosmatopoulos, E.B. DARP: Divide areas algorithm for optimal multi-robot coverage path planning. J. Intell. Robot. Syst. 2017, 86, 663–680. [Google Scholar] [CrossRef]
  11. Nedjati, A.; Izbirak, G.; Vizvari, B.; Arkat, J. Complete coverage path planning for a multi-UAV response system in post-earthquake assessment. Robotics 2016, 5, 26. [Google Scholar] [CrossRef]
  12. Huang, X.; Sun, M.; Zhou, H.; Liu, S. A multi-robot coverage path planning algorithm for the environment with multiple land cover types. IEEE Access 2020, 8, 198101–198117. [Google Scholar] [CrossRef]
  13. Glegg, S.A.L.; Olivieri, M.P.; Coulson, R.K.; Smith, S.M. A passive sonar system based on an autonomous underwater vehicle. IEEE J. Ocean. Eng. 2001, 26, 700–710. [Google Scholar] [CrossRef]
  14. Guo, Y.; Ai, R.; Chen, Y.; Qi, Y. Prediction of Passive Sonar Detection Range in Different Detection Probability. In Proceedings of the 2018 5th International Conference on Systems and Informatics (ICSAI), Nanjing, China, 10–12 November 2018; pp. 1289–1293. [Google Scholar]
  15. Rudnick, D.L.; Davis, R.E.; Eriksen, C.C.; Fratantoni, D.M.; Perry, M.J. Underwater gliders for ocean research. Mar. Technol. Soc. J. 2004, 38, 73–84. [Google Scholar] [CrossRef]
  16. Kepper, J.H.; Claus, B.C.; Kinsey, J.C. A navigation solution using a MEMS IMU, model-based dead-reckoning, and one-way-travel-time acoustic range measurements for autonomous underwater vehicles. IEEE J. Ocean. Eng. 2018, 44, 664–682. [Google Scholar] [CrossRef]
  17. Ajeil, F.H.; Ibraheem, I.K.; Azar, A.T.; Humaidi, A.J. Grid-based mobile robot path planning using aging-based ant colony optimization algorithm in static and dynamic environments. Sensors 2020, 20, 1880. [Google Scholar] [CrossRef]
  18. Kierstead, D.P.; DelBalzo, D.R. A genetic algorithm applied to planning search paths in complicated environments. Mil. Oper. Res. 2003, 8, 45–59. [Google Scholar] [CrossRef]
  19. Dorigo, M.; Birattari, M.; Stutzle, T. Ant colony optimization. IEEE Comput. Intell. Mag. 2006, 1, 28–39. [Google Scholar] [CrossRef]
  20. Stützle, T.; López-Ibáñez, M.; Pellegrini, P.; Maur, M.; de Oca, M.M.; Birattari, M.; Dorigo, M. Parameter adaptation in ant colony optimization. In Autonomous Search; Springer: Berlin/Heidelberg, Germany, 2011; pp. 191–215. [Google Scholar]
  21. Cabreira, T.M.; Brisolara, L.B.; Ferreira, P.R., Jr. Survey on coverage path planning with unmanned aerial vehicles. Drones 2019, 3, 4. [Google Scholar] [CrossRef] [Green Version]
  22. Artemenko, O.; Dominic, O.J.; Andryeyev, O.; Mitschele-Thiel, A. Energy-aware trajectory planning for the localization of mobile devices using an unmanned aerial vehicle. In Proceedings of the 2016 25th International Conference on Computer Communication and Networks (ICCCN), Waikoloa, HI, USA, 1–4 August 2016; pp. 1–9. [Google Scholar]
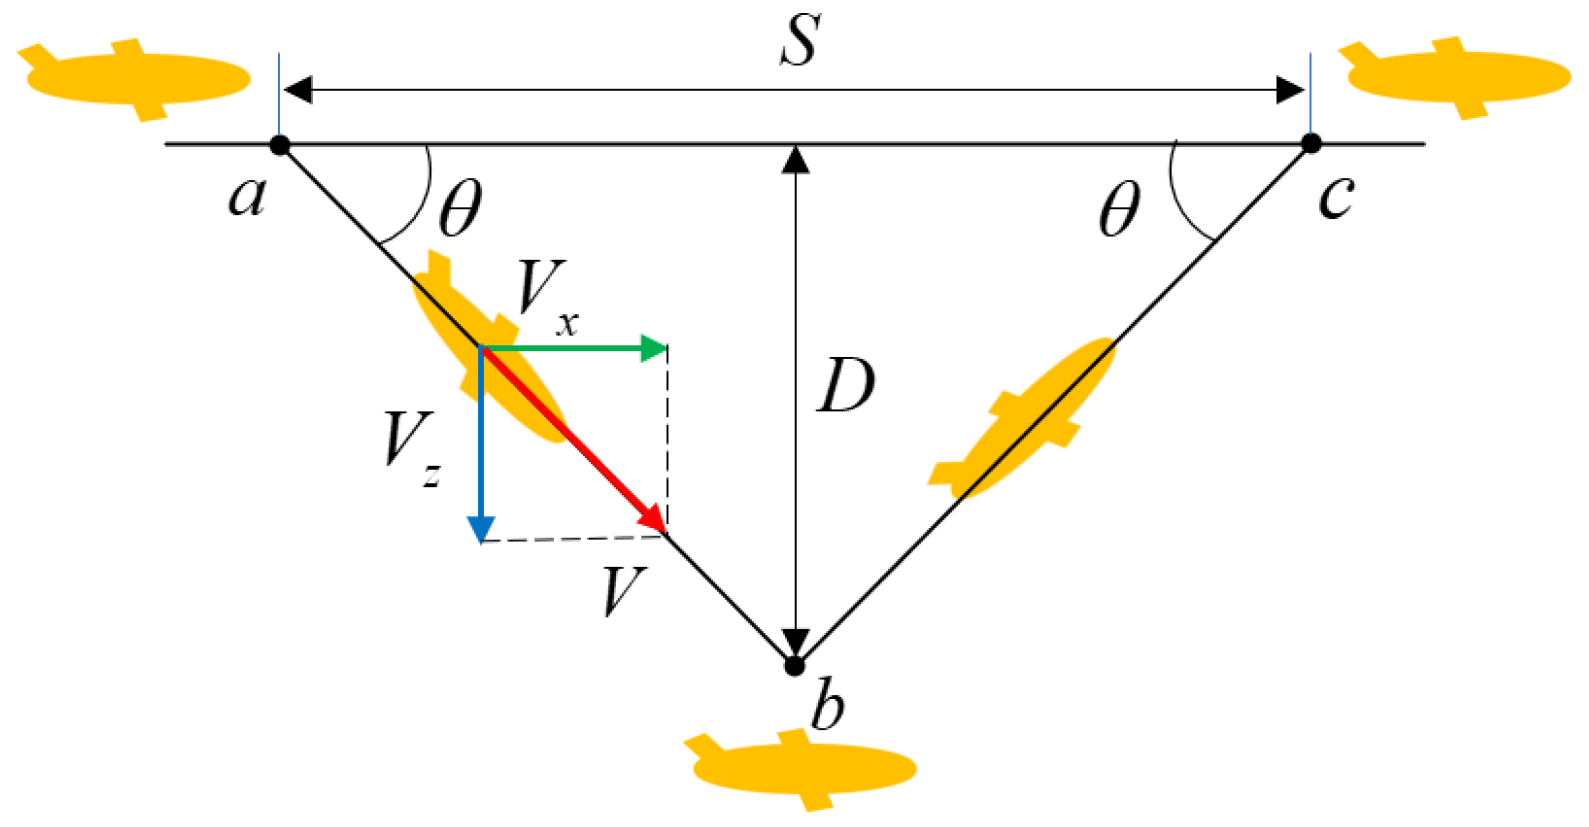
Figure 1. The UG motion process.
Electronics 11 03021 g001
Figure 2. Normal distribution of detection probability of sonar.
Electronics 11 03021 g002
Figure 3. The calculation method of the radius.
Electronics 11 03021 g003
Figure 4. Detection radius map.
Electronics 11 03021 g004
Figure 5. The relationship between the single-period horizontal distance and the profile depth and gliding angle.
Electronics 11 03021 g005
Figure 6. Feasible region constraints.
Electronics 11 03021 g006
Figure 7. The MGCPP−ACO algorithm path planning results in scenario 1 (where (ac) are 2D plane trajectories, and (df) are 3D space trajectories).
Electronics 11 03021 g007
Figure 8. The MGCPP−ACO algorithm path planning results in scenario 2 (where (ac) are 2D plane trajectories, and (df) are 3D space trajectories).
Electronics 11 03021 g008
Figure 9. The MGCPP−ACO algorithm path planning results in scenario 3 (where (ac) are 2D plane trajectories, and (df) are 3D space trajectories).
Electronics 11 03021 g009
Figure 10. (a) The 2D plane trajectory of SCAN algorithm, (b) 3D space trajectory of SCAN algorithm.
Electronics 11 03021 g010
Figure 11. (a) P c of the two algorithms, (b) ξ P and ζ T of the two algorithms.
Electronics 11 03021 g011
Table 1. The mapping relationship between UGs and ants.
UGsAnts
Mobile spacegrid mapforaging space
Feasible Domaina set of restricted outlet pointsnext walkable area
Behaviorfrom the water entry point to the next water outlet pointtransfer next cell
Targetmaximum coverage ratefind food
Table 2. Simulation Parameters.
ParametersValuesDescription
M 75number of rows in the grid map
N 75number of columns in the grid map
m 3number of UGs
w 100number of ant groups
Δ H 180 heading range
D [ 100   m , 400   m ] gliding depth range
θ [ 20 , 40 ] gliding angle range
α 0.8weight of the pheromone
β 0.8weight of the heuristic function
ρ 0.05evaporation coefficient
Q 0.5fitness factor
τ 0 100initial value of pheromone
τ min 10minimum value of pheromone
τ max 10,000maximum value of pheromone
Table 3. Initial positions and heading angles.
Scenario NumberFigNo.Initial Coordinate (km) Initial   Heading   Angles   ( ) Coverage Rate (%)
P 0 ( 1 ) P 0 ( 2 ) P 0 ( 3 ) H 0 ( 1 ) H 0 ( 2 ) H 0 ( 3 )
1Figure 71(1, 1)(1, 6)(1, 11)00095.62
2(1, 1)(7, 14)(14, 1)902709091.33
3(1, 3)(2, 2)(3, 1)9045090.61
2Figure 84(1, 1)(1, 6)(1, 11)00091.45
5(1, 1)(7, 14)(14, 1)902709084.64
6(1, 3)(2, 2)(3, 1)9045089.25
3Figure 97(1, 1)(1, 6)(1, 11)00091.59
8(1, 1)(7, 14)(14, 1)902709087.17
9(1, 3)(2, 2)(3, 1)9045091.06
Publisher’s Note: MDPI stays neutral with regard to jurisdictional claims in published maps and institutional affiliations.