1. Introduction
The Internet of Things (IoT) is an expansive network and interconnected service infrastructure consisting of heterogeneous devices that can be seamlessly incorporated into the Internet [
1]. As IoT systems become more integrated into our daily tasks, they also require an increase in hardware sophistication and computational power. Because of the limitations in terms of hardware capabilities of native IoT devices, there are many times when they are incapable of fully executing all types of tasks [
2,
3]. Hence, some tasks or portions of tasks are then offloaded to the cloud for additional processing [
4,
5]. Task offloading has significantly contributed to the formation of multi-access edge computing to mitigate the offloading problem, while reducing reliance on the cloud computing layer [
6,
7,
8].
Further, the rapid growth and sophistication of IoT systems, which includes the emergence of new applications such as edge AI, mobile gaming, virtual reality, healthcare, and transportation, has increased the number of mission-critical tasks, or ones that must function or execute properly in order to avoid service disruptions in terms of application downtime [
9]. In addition, executing computationally intensive IoT tasks often requires low latency and energy consumption.
While IoT devices have increased in terms of hardware capabilities in recent years, there exists many computational tasks such as deep learning tasks (e.g., NLP, visual recognition, clustering, classification, transcription, synthesis, and sampling) that cannot easily be performed locally on these devices, due to the computational intensively of these tasks requiring excessive processing power and memory usage. Executing such tasks on resource-constrained devices translates into longer execution times and high energy consumption. Because many IoT devices depend on batteries for power, executing such tasks drains the batteries very quickly, sometimes without even completing the tasks [
10]. To this extent, offloading becomes a natural solution that complements the processing on IoT devices for task execution. However, allocating resources efficiently on the edge or fog layers becomes a very complex task that often requires efficient optimization and decision making strategies [
11].
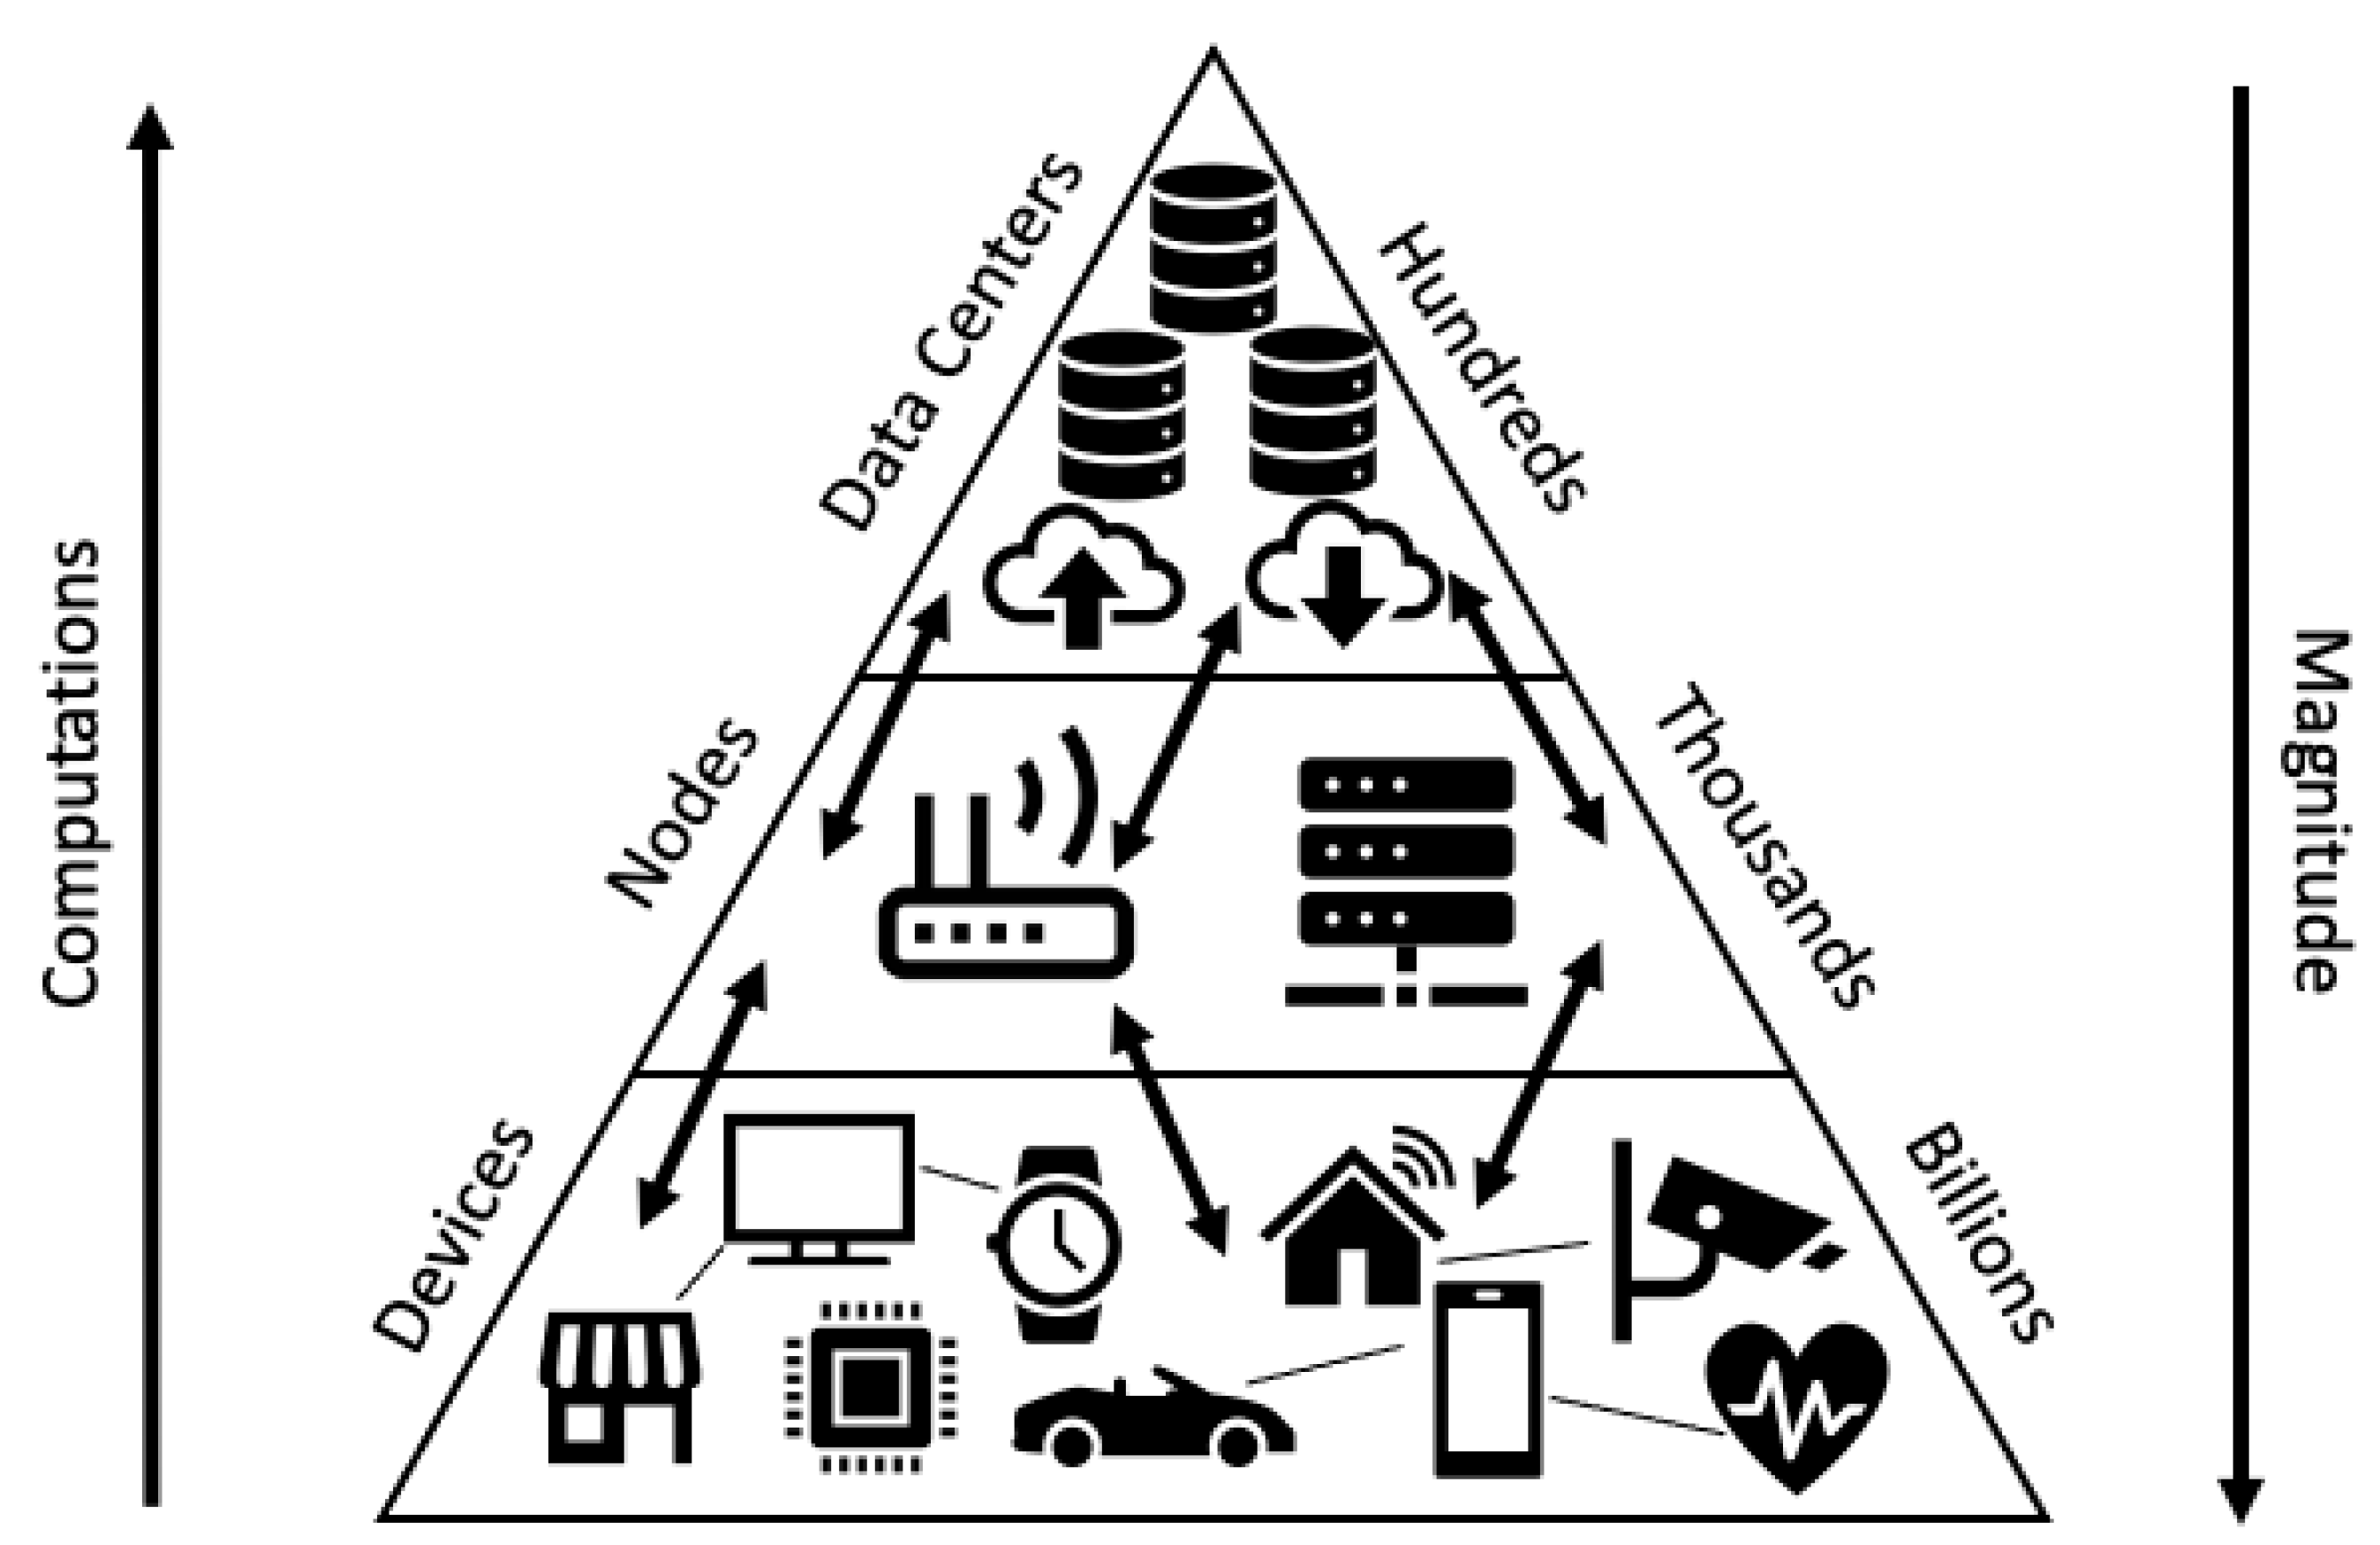
Figure 1 presents the various layers that exist across the IoT computing paradigm.
As demonstrated in
Figure 1, from an IoT perspective, as we move away from the cloud layer, the number and magnitude of devices increases significantly. However, as we move toward the cloud, the sophistication of tasks increases. Hence, the edge computing layer is intended to process light tasks, whereas more intensive operations shift to the fog layer and ultimately to that of the cloud. To this extent, optimizing tasks that can be localized on the edge layer, and ones that can execute on the fog node prior to migrating them to the cloud, becomes inevitable. Further, as we migrate to the fog layer and further to the edge layer, there is more localization of both computations and nodes. This can help in terms of providing contextualized services. However, this localization decreases as tasks move away from edge and fog layers. Offloading therefore become an ideal solution for solving these discrepancies that exist across the IoT paradigm. An offloadable task represents parts or an entire program or process consisting of code instruction that require migrating to a remote destination, to be executed on a compatible environment (e.g., OS).
Furthermore, variations among offloadable tasks make the resource allocation process even more challenging [
12]. Task offloading is not a novel concept and has been widely used in areas such as TCP offloading, mainly used for reducing the CPU overhead that often exist across fast networks [
13]. This offloading type divides large volumes of data into smaller units of data that are sent between source and destination. The challenge in IoT offloadable tasks is quite different in the sense that offloadable tasks are not easily partitioned and depend on program execution and compilation workflows. Nonetheless, task offloading is similar to that of TCP/IP in terms of how the tasks are allocated across the network. Hence, we assume in this paper that offloadable tasks have been defined and the allocation of resources is the stage we focus on throughout the remainder of this paper.
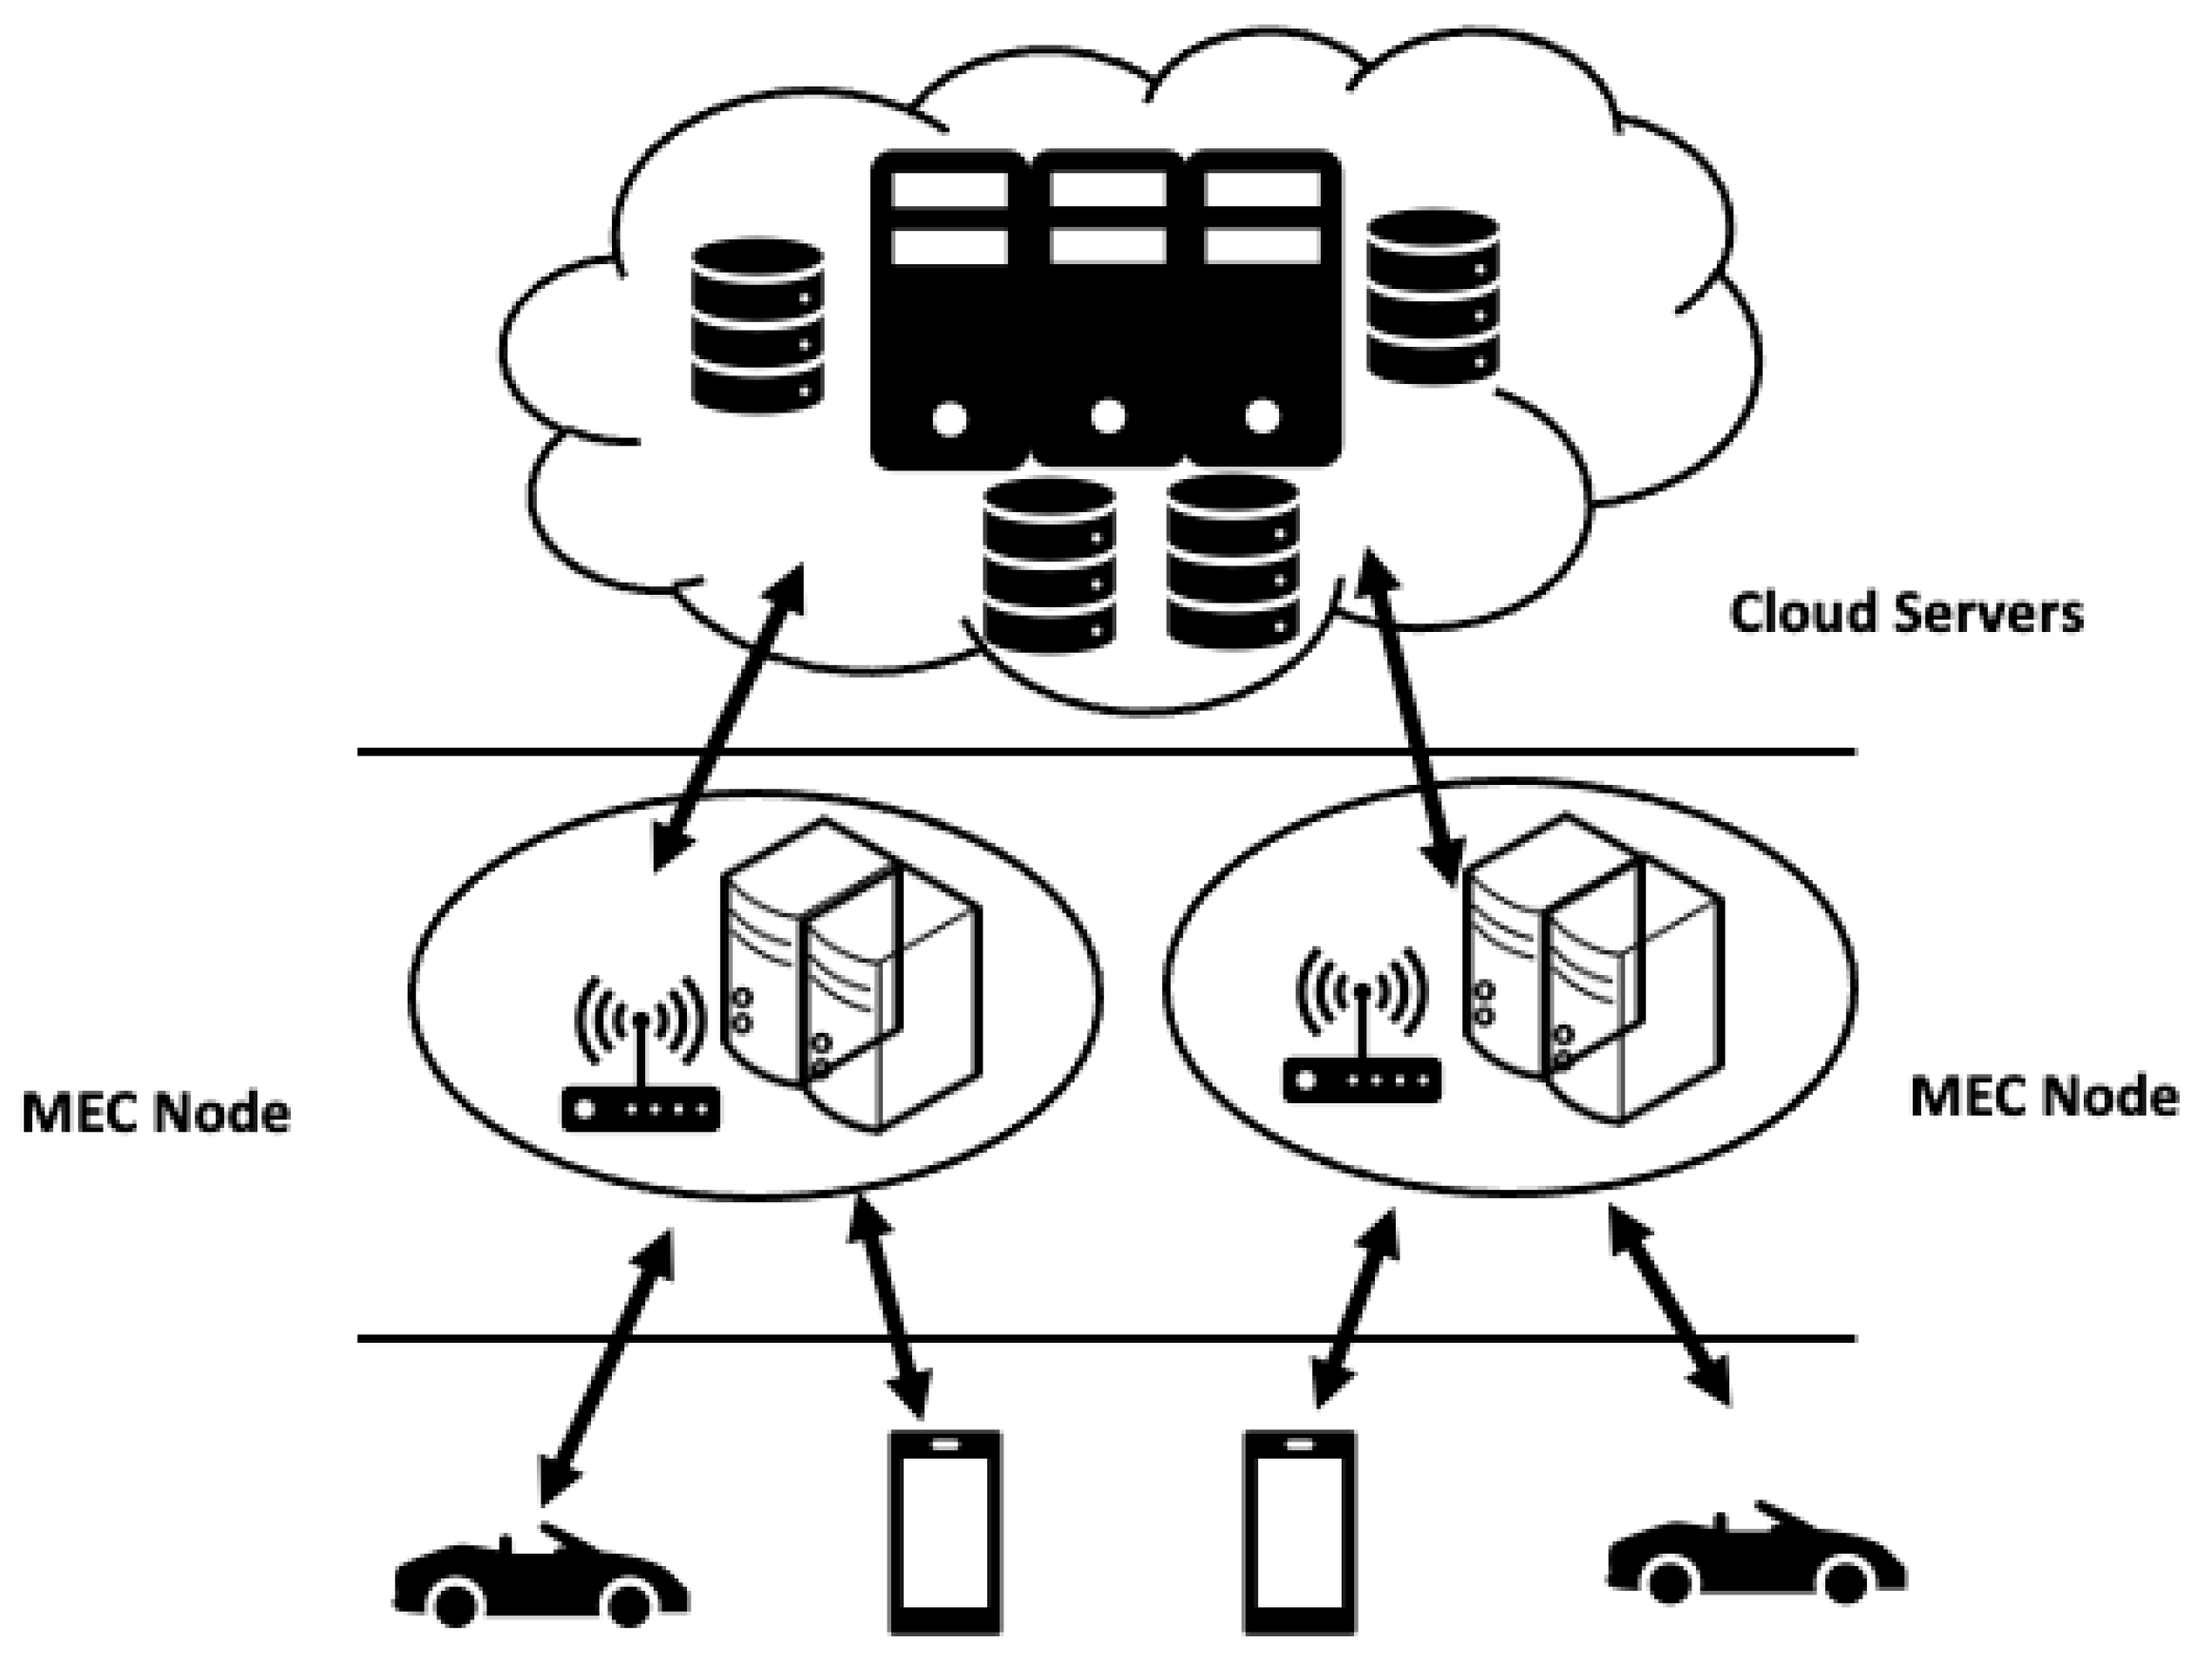
The emergence of the edge computing paradigm in recent years allows for data to be processed in local nodes, or intermediary ones that exist nearby native IoT devices. To this extent, the introduction of multi-access edge computing (MEC) is designed such that it decreases the transfer latency [
14]. However, as shown in
Figure 2, MEC requires a complex ecosystem of hardware, software, and networking. Further, using multi-access edge computing presents data privacy and security concerns that are often neglected [
14]. Further, using multi-access edge computing presents data privacy and security concerns that are often neglected [
14]. Further, the network of interconnected devices will then need to apply uniform security policies. In addition, MEC network administrators will need to define identity and access management rules for a large number of users spread across the multi-access edge computing network. Even though MEC is promising for latency reduction for offloadable tasks, there are major challenges associated with the deployment of heterogeneous IoT devices and meeting application Quality of Service (QoS) requirements.
Generally, computation offloading, or offloadable tasks, is performed by transferring them to remote destinations (e.g., other edge, fog, or cloud resources) for execution, and the outcomes or response deliverables are then returned to the native IoT device. In terms of edge-to-cloud offloading, cloud service providers often provide access to a plethora of computing resources in the areas of software applications, artificial intelligence, storage, and processing power. Although computation offloading allows access to robust and heterogeneous processing cloud resources, it is often associated with some limitations. The majority of the limitations are often associated with latency issues when relying on external computing resources, as well as execution downtime and load balancing issues [
15].
Downtime occurs with cloud computing services when there is a disruption due to some power outage, network connection failures, or service or resource unavailability. Additionally, the latency factor introduced when computing over the internet cannot be tolerated by certain applications such as mission-critical IoT applications (e.g., autonomous driving, healthcare analytics, among others), which increase the demand for optimizing the offloading of tasks across edge environments.
Whether offloading occurs to a cloud service provider or a multi-access edge computing network, there are key challenges that need to be considered in an offloading strategy. How to offload a task, for example, is a key challenge when considering the heterogeneous connectivity methods that are supported by the IoT paradigm (e.g., wireless, cellular, WiFi, WAN, etc.). Another challenge is associated with the ability to identify parts of the computation that can be offloaded to the remote destination. That is, not all functionalities are offloadable (e.g., mobile screen rendering). This makes the task of finding appropriate resources with the necessary hardware requirements to execute the computation more challenging. Finally, when to begin offloading a task is another challenge that can be impacted by signal to noise ratios, or service migration instances.
While there are many challenges associated with task offloading, we focus primarily on optimizing the resource allocation process across this multi-layered IoT architecture. A number of research efforts in the area of optimization of resource allocation have been conducted which include algorithms that allocate resources on a predetermined schedule or manual resource allocation [
16,
17,
18,
19]. Additionally, some work has been conducted on calculating the resource requirements for a task and preemptively allocating resources. While many of the existing methods are effective, they often require human intervention, while failing to provide IoT devices to make their own offloading decisions [
6,
7,
8]. Further, many of the existing solutions do not consider the heterogeneity of devices that exist at the edge of the network, and do not support hybrid offloading operations that may occur, as shown in
Figure 1 and
Figure 2.
Resource allocation optimization has been a focal point for improving the offloading process across edge environments. The strategy of relying on only cloud computing or the use of a multi-access edge computing network both have drawbacks. A hybrid approach that is able to identify and allocate resources from all three computing layers (cloud, fog, and edge) more efficiently is integral and is often neglected by existing research efforts. Hence, an offloading strategy that is able to consider end-user or applications requirements when performing offloading operations is very critical. We present some of the key offloading task types that often exist across IoT environments in
Table 1.
To demonstrate the importance of associating task type when completing an offloadable task, consider a mission critical scenario involving a task for deciding whether to stop for a traffic light or change driving lanes as part of a self-driving vehicle, and a compounded data collection from soil sensors within a smart city IoT system. Both of these scenarios are associated with different types of offloadable tasks. For example, the self-driving car is often associated with mission-critical and time sensitive tasks that require low runtime, high memory availability, and high processing power to process operations, whereas the smart city system is not as time-sensitive as that of the self-driving car and can tolerate some short latency rates. Hence, associating the type of tasks during the offloading process is critical and is often neglected in existing research efforts for resource allocation [
11].
With these challenges and applications requirements in mind, the objective of our research is to develop a reliable resource allocation offloading strategy that can be utilized on both the edge and fog computing layers. In order to allocate resources across multiple computing environments in an optimal manner, we first need to develop an optimization framework that considers task requirements. In addition, this offloading framework needs to be able to handle multiple criteria in order to maintain an acceptable degree of Quality of Service (QoS) level that is part of a service level agreement. Further, the optimization strategy needs to minimize task execution time, energy consumption, and cost spending. Finally, the optimization framework needs to create a buffer for processing and memory availability. To accomplish all of the above, we developed OpERA, a multi-objective optimization approach for efficiently allocating edge-based resource during offloading operations.
Table 2 presents a comparison of existing research approaches on resource allocation for supporting offloading operations.
One of the primary objectives of OpERA is to identify available resources existing across heterogeneous edge or fog environments to determine the usefulness of offloading tasks. Our proposed approach supports multiple criteria for offloading decisions including what code segments to offload, when to offload tasks, and where to offload them. Further, OpERA considers the tradeoff that exists among existing resources and considering the various layers that exist throughout the edge paradigm. In addition, offloading granularity in terms of fully uploading an entire task (i.e., binary offloading) or partially offloading code segments of a task (i.e., partial offloading) is critical for improving the execution of tasks and allocating resources across edge environments. Unlike existing approaches, which focus on multi-objective decisions, we employ a multi-criteria decision making (MCDM) algorithm that is based on the Technique for Order of Preference by Similarity to Idea Solution (TOPSIS) to improve the decision making when executing offloadable tasks.
TOPSIS is a MCDM method that is used across many real-world applications [
32]. It is widely used in areas such as supply chain management [
33], logistics [
34], design engineering [
35], manufacturing systems [
36], software defined networks [
37,
38,
39], and business management [
40]. In addition, TOPSIS is used in energy management and water resource management. To the best of our knowledge, MCDM methods have not been employed in the decision making for resource allocation and service provisioning [
41,
42,
43]. To this extent, we employ the TOPSIS method for improving the decision making of our OpERA approach. Using TOPSIS, OpERA is capable of identifying localized resources that can execute tasks. If local resources are non-optimal, OpERA recommends nearby intermediary nodes that are suitable for executing tasks within upper layers in the multilayered IoT architecture.
Table 3 list the acronyms used frequently throughout this paper.
3. OpERA: A Resource Allocation Optimization Model
We developed an optimization model that is based on MCDM, which allows us to identify and analyze differences among choices or alternatives. What we mean by alternatives is the available resources that can execute an offloadable task. Given a task, we employ MCDM to determine which of the available resources is best optimized to run that task. Further, MCDM approaches also employ the minimization or maximization of specific attributes through linear objective functions [
58].
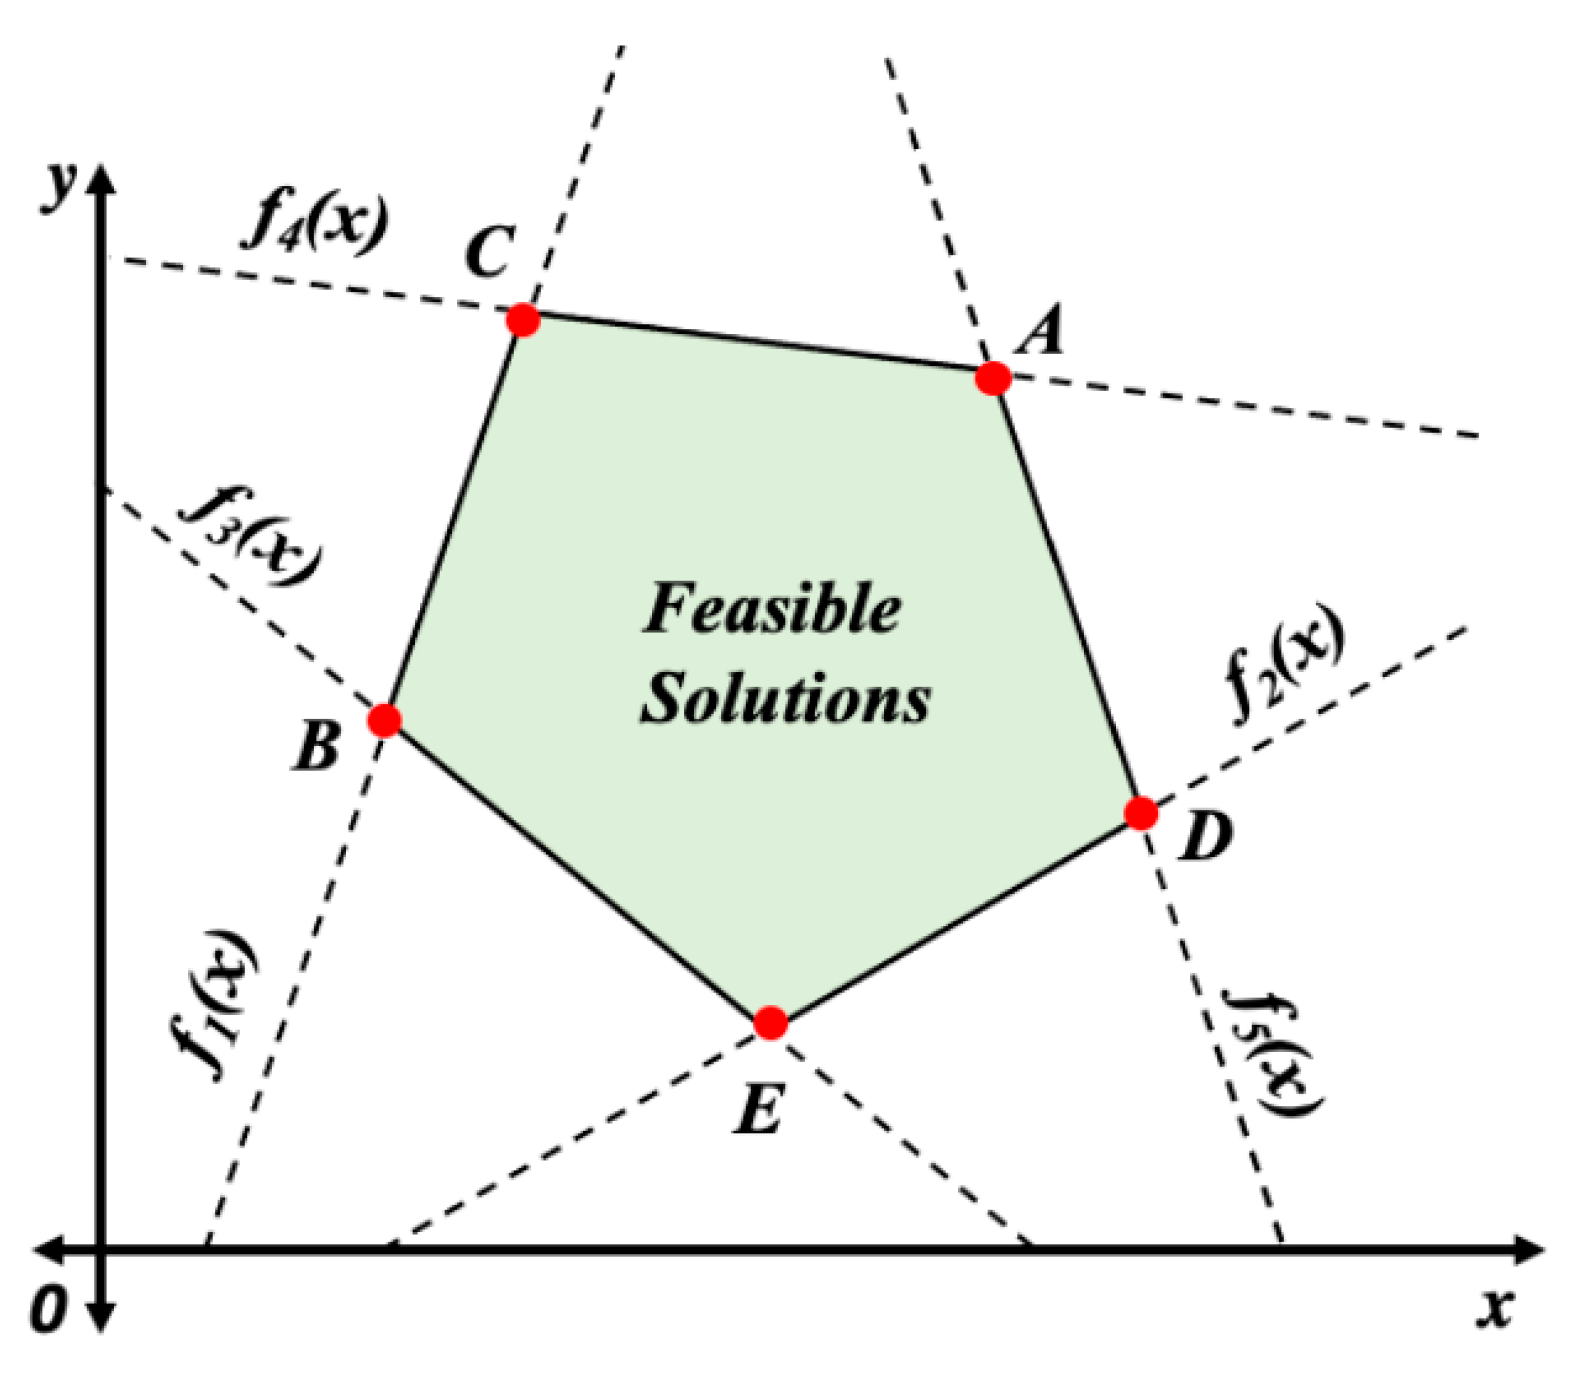
Figure 3 illustrates the region containing the possible solutions. Negative slopes represent objective functions whose qualities are being minimized. Positive slopes represent objective functions whose attributes are being maximized [
58].
As illustrated in
Figure 3, the ideal values within the bounded regions for objective functions 1 and 2 are vertices C and D. For objective functions 3, 4, and 5, the optimal solutions are located at vertices B, C, and A, respectively. The range of feasible alternatives is inferred, but selecting the ideal solution requires more investigation. For our resource allocation optimization, the feasible solutions region represents the set of discovered compute resources (or alternatives) that are all capable of executing offloadable tasks. The degree to which each alternative can complete the task varies. It is worth noting that not all alternatives can meet the objectives defined for executing offloadable tasks. These objectives include processor availability, memory availability, projected execution time, cost, storage space requirements, and network bandwidth, among others. MCDM methods help define the objectives and constraints and are capable of identifying the best or optimal solution in the feasible region.
There exists a number of MCDM methods, such as Elimination and Choice Expressing Reality (ELECTRE) [
20], Technique for Order Preference by Similarity to Ideal Solution (TOPSIS) [
21], Preference Ranking Organization Method for Enrichment of Evaluations (PROMETHEE) [
22], and Multi-criteria Optimization and Compromise Solution (VIKOR) [
23]. We employ the TOPSIS method, which extends our previous work on resource allocation within edge environments [
59], due to the ability to measure the geometric distance between every alternative and an ideal one. The ideal one is determined based on a set of preferences, which are assigned to multiple criteria. Hence, TOPSIS allows us to perform a multi-objective optimization without the need to use meta-heuristic methods, which are time consuming and quite complex to develop.
TOPSIS is an MCDM method that selects the best alternative among a number of alternatives having the shortest Euclidean distance to an ideal best solution, and the longest Euclidean distance to the ideal worst solution [
60]. TOPSIS takes into consideration the weighted preference attributes. That is, a preference for an attribute can be either advantageous (need to be maximized) or detrimental (need to be minimized) [
60]. The input weights, which represent priority or importance of the attribute in the optimization process, can be arbitrarily chosen, however, they must all add up to one.
The weights are used by TOPSIS to identify the preferences of the decision variables used in the decision making process. Each decision variable, or criterion, can be either non-beneficial or beneficial. Each criterion can be either beneficial or non-beneficial. A beneficial criterion is one that needs to be minimized and a non-beneficial is one that needs to be maximized. The list of decision variables or criteria used for our OpERA is presented in
Table 4. An end-user may assign various weights to the decision variables and the total weights must sum to 1. The higher the weight, the more priority is given by TOPSIS to the decision variable, or criterion, associated with the weight. For example, a memory-driven offloading use case indicates more priority (i.e., higher weight) is assigned to memory availability compared to other decision variables. A general offloading use case does not specify any priority to a specific attribute and all decision variables are treated with the same importance. Through weight assignment, an end-user or programmer can selectively control the execution of offloadable tasks depending on the operation type. For example, a mission-critical offloadable task may be assigned higher weight in terms of execution time, while having a lower cost (e.g., execute the offloadable task at any cost).
For our resource allocation optimization model, we consider memory availability, CPU usage, runtime, execution cost, and energy consumption. OpERA constructs a normalized matrix consisting of alternatives, represented by rows, and criteria, represented by columns, respectively. Each cell in this matrix represents a normalized value corresponding to a specific alternative for a particular criterion. Alternatives represent virtual machine resources that are equipped with processor, memory, storage, and network resources.
For each criterion, a weight is associated to identify its priority or importance on the overall optimization process. This makes our OpERA model user-centric such that end users or IoT application developers can specific their own preferences of how they wish to control the optimization outcomes. Further, a computational node in this model represents a resource and an offloadable task represents a program or code segment that needs to execute on this node. To this extent, a node can be a local IoT device, a virtual machine (VM), or a container. A resource represents a computing node that exists on either edge, fog, or cloud layers. Nodes are equipped with sufficient resources (e.g., processor, memory, etc.) to execute offloadable tasks. OpERA identifies the optimal VM nodes that contain sufficient compute, memory, storage, and network resources, for completing the task. We will present our runtime prediction model in the following section.
3.1. Measuring Expected Execution Time
We developed an expected execution time model that is capable of projecting the overall execution time of tasks on different computational nodes. We focus primarily on virtual machines (VMs) as nodes which are available throughout the multi-layered IoT architecture. To measure the expected execution time on a particular node for a specific task, we use Amdahl’s Law [
61]. Amdahl’s Law [
61] enables us to measure the theoretical maximum speed-up in parallel computing runtime environment when a single processor is used. To this extent, we use Amdahl’s law to find the maximum speedup of a system when multiple processors are used. The speedup is defined as:
where
n represents the number of cores, and
p represents the portion of a program that is parallelizable.
In order to use Amdahl’s law (Equation (1)), we need to determine the portion of the program that is parallelizable. We assume that the execution time of the task on the local device can be determined, for which we can then derive the execution time on the destination computational node (e.g., VM). We also assume that the estimated execution time on the local device, or , is based on running the task on a single core processor. Using Amdahl’s Law, we are able to estimate the execution time with considering parallelization. Hence, we employ an execution time model based on the performance gain on which the offloadable task can execute on the destination node by considering the number of cores and a parallelization fraction that is determined in terms of the speedup factor.
Through this model, it is then possible to account for more complex operations using Amdahl’s Law that run on tasks on hardware that supports multiple cores. To this extent, for a given task that requires execution, we randomly generate the p value within the range of 0.2–0.99, while ensuring that all of the p values generated fit a Gaussian distribution. Using Gaussian distribution, we simulate a real-world data center environment that is equipped with heterogeneous hardware types that support multi-core execution of programs. Further, this distribution helps in simulating executing offloadable tasks by accounting for other factors such as resource contention, resource discovery, and scheduling, among others. Through this approach, we consider various data and program profiling, estimating possible errors that may occur during program execution more realistically. It should be noted that generating the p values in a Gaussian distribution with a standard deviation of 0.1 and mean, we use 0.6 which is ideal to reduce bias in the random number generator.
The measured speedup factor can then be used to derive the predicted execution time, as shown in Equation (2); we multiply the speedup factor by the observed execution time for a job. The expected execution time is reflective of how long the job would take to run an alternative resource:
where
ExecutionTimeobserved represents the observed execution time on a local IoT device, and speedup is the relative performance with the destination node that measures the expected enhancement, and
ExecutionTimeestimated is the expected execution time for the offloadable task to execute on a destination node. We compute the
ExecutionTimeestimated for all of the alternatives that are considered for the decision matrix.
3.2. Measuring Energy Consumption
Because the amount of power needed to execute a program primarily depends on the amount of time it takes for the processing hardware and resources employed to execute the program (e.g., execution time), we can then estimate the amount of energy that will be consumed for executing a task. That is, the energy consumption uses the expected execution time computed in Equation (2) to derive the total energy consumption for completing an offloadable task. To this extent, we employ the thermal design power (TDP), which is measured in Watts, to compute the overall energy consumption on the destination node as follows:
where
ExecutionTimeestimated is the expected execution time on the destination node computed in Equation (2), and TDP represents the average power for a processor to complete tasks. Using Equation (3), we can estimate the total amount of energy consumed by hardware resources based on the total execution time it takes for a task to complete. That is, the result is the estimated energy consumption on the destination node for a specific task. We compute energy for all of the alternatives in the decision matrix and the energy consumption metric is used as a criterion or an objective, which requires minimization (i.e., a beneficial attribute). Further, the TDP value is retrieved from the processor specifications. That is, each VM is equipped with a processor for which we identify from its specifications the TDP value and then use it in the decision matrix. This helps us conduct real-world computations when employing datasets as discussed in the following section.
3.3. Measuring Utilization Cost
We derive cost based on the cloud service providers’ use of cloud resources. That is, a cloud service provider generally charges a fee to utilize virtual machines. Hence, we use existing cloud provider calculators and match the processor specifications with ones associated with the alternatives in the decision matrix. We use this cost analysis to reflect on the utilization cost for consuming resources on the cloud. In addition, we vary the cloud utilization costs to derive ones for the fog and edge layers, respectively. To this extent, we used the Azure Pricing Calculator [
62] as a basis for generating the cost utilization model, as shown in
Table 5. To compute the overall cost associated with consuming the resource, we employ the expected execution time from Equation (2).
3.4. CPU and Memory Availability Measurements
We extend our earlier optimization model introduced in [
59], to define the objective functions for CPU usage and memory availability, as in Equations (4) and (5), respectively. Using existing profiling tools, which can measure the performance of a program during execution, we employ profiling tools (e.g.,
gperftools) that are supported by operating systems to determine the CPU and memory availability on existing hardware. We assume that this profiling data is accessible to OpERA during the decision making process. By employing CPU and memory availability data, OpERA is capable of identifying suitable resources that can execute offloadable tasks more efficiently. Hence, we use CPU and memory availability data to optimally determine resources for task execution. To this extent, CPU usage and memory availability are used as attributes in the decision matrix for our OpERA TOPSIS-based algorithm. The CPU usage is measured as follows:
where
is the
CPU capacity for the current device
x,
is the maximum CPU capacity among all of the devices, and
is the percentage of the CPU used by the current device. For the memory availability, it is measured as follows:
where
is the memory availability for the current device
x,
is the maximum memory availability among all of the devices, and
is the percentage of the memory used by the current device.
4. Evaluation and Assessment
To evaluate our OpERA resource allocation algorithm, we employ real-world datacenter job and workload traces datasets. To this extent, we evaluate our OpERA algorithm based on the Materna [
63] and the AuverGrid [
64] from the Grid Workload Archives (GWA) [
65]. GWA provides traces from an actual datacenter, which includes a job traces dataset representing tasks requirements, whereas the AuverGrid represents snapshots of the VM states residing within the datacenter. We use these snapshots to identify the resource states and use OpERA for optimizing the allocation process. We import the traces from the datasets into a local repository using Big Query, and a summary of the datasets schema are presented in
Table 6.
4.1. Dataset Preparation & Data Workflow
We randomly selected Materna VM dataset traces to represent available resources. Similarly, we select at random traces from the AuverGrid that correspond to an IoT application request. To simulate the resource availability within a datacenter, we employ a total of 1592 VM traces from the Materna dataset. Each resource has a number of CPU cores, CPU utilization (MHz), and memory utilization, among others. This information is sufficient for our OpERA algorithm to make resource allocation decisions. To simulate a real-world heterogeneous IoT environment, our randomization method consisted of classifying the resources into three distinct layers, representing edge, fog, and cloud layers. We followed the analogy presented in
Figure 1, such that as we migrate to the cloud layer, the number and complexity (or capacity) of the resources increase. Thus, it is assumed that the cloud layer has more powerful resources than the fog layer, while the fog layer has more powerful resources than the edge layer. This reflects the current state of typical hybrid IoT environments in the real world. Randomly mapping the Materna traces dataset’s resources into these layers, while ensuring that the most powerful resources are assigned to the higher layers, we ensure that the Materna traces dataset’s resources are distributed as follows:
Figure 4 illustrates the random distribution of VM traces from the Materna dataset.
Using the AuverGrid traces dataset, we simulate 404,176 workload requests received by the OpERA algorithm, which uses request details and resource availability to determine how to effectively allocate resources. We observe that the average runtime duration of the AuverGrid dataset tasks ranges from 900 s (or 15 min) to 345,600 s (or 4 days). These runtime durations represent the execution of real-world jobs with variable workloads. In other words, the dataset reflects the real-world environment by providing traces for both simple (i.e., those that do not require complex computations) and advanced tasks (i.e., ones that re-quire complex compute operations such as ML, or AI). Furthermore, we observe that the memory usage for the tasks ranged from 1700 KB to 3,667,655 KB. About 15% of the AuverGrid workloads lacked data for key metrics, such as CPU runtime and memory usage, requiring us to exclude these workloads from our experiments.
As described in
Section 3, the AuverGrid and Materna datasets provide measured values from which we derive computed values such as estimated runtime, energy consumption, and cost. The derivations of these values are essential to our OpERA algorithm in order to determine how an offload operation will perform on multiple available resources on a given layer (e.g., edge, fog, or cloud).
Figure 5 depicts all the steps involved in the resource allocation process in order to illustrate the overall dataflow process for our testing and evaluation.
Figure 5 illustrates how we retrieve the job traces from the AuverGrid and filter out the job specifications. We simultaneously retrieve VM traces from the dataset of Materna VM traces. Every time our OpERA algorithm is used to initiate a simulation, this procedure is rerun. Thus, each time we conduct an experiment utilizing our OpERA algorithm, we randomly retrieve and identify new traces. This allows us to evaluate OpERA in a real-world environment where the resources are dynamically changing, and as a result, we have access to new VM traces at the beginning of each experiment we conduct.
Given the task information randomly selected from the AuverGrid, OpERA begins estimating the runtime on the identified VM traces selected from the 1592 Materna VM traces dataset. Using runtime, we then derive the energy and cost which are then used by our multi-criteria decision making algorithm to rank resources based on ideal best and ideal worst, as described in
Section 3. We describe the details of this decision making in the following section.
4.2. Optimization Modeling and Simulation
Our optimization model’s inputs consist of the weight preferences for each decision variable and the decision matrix reflecting the Materna traces dataset’s data. The values for the decision matrix are queried from the resource table. Given a task’s properties, the decision matrix is initialized with the resources that fulfill the minimal criterion for memory availability. The decision matrix has dimensions of , where n represents the total number of decision variables and m represents the total number of discovered VMs from the Materna dataset.
As shown in
Table 4, we apply the following five decision variables or attributes: memory availability (MA), execution cost (ExC), energy consumption (EnC), expected runtime (R), and CPU utilization (CPU). The total number of virtual machines, or m, is limited to a range between 0 and 1592, the maximum number of VMs available from the Materna dataset. If M is zero, the algorithm terminates because there are no available memory resources that fulfill the minimal requirement.
The preference for each decision variable or attribute is expressed by a plus sign (+) or minus sign (−), signifying the type of beneficial or non-beneficial attribute. Memory availability is the only beneficial attribute, as it is desirable to have more memory availability. We would like to minimize execution cost, energy consumption, estimated runtime, and CPU utilization, for the remaining four attributes.
The assignments for the experimental test cases are detailed in
Table 7. To observe the outcomes of our OpERA resource allocation method, we begin by modeling a preference using a single attribute, and then transition the dominance to other qualities. As shown in
Table 7, we design the weight assignment for four distinct test cases to simulate real-world experience for our OpERA algorithm. Using each of the test cases given in
Table 8, we analyze OpERA and present the results along with a discussion in the following sections.
4.3. Experiment A: General Test Case
We analyze OpERA using general test scenarios in which resource allocation optimization for a task with equally weighted attributes is considered. The weights are divided evenly across all decision variables, with each variable receiving a weight of 0.2. We choose at random a task from the AuverGrid (Task ID 108145), whose specifications are listed in
Table 8. Based on the real task information provided by the AuverGrid, this task is currently modelled as cloud-based, with a total runtime of 33 s and a total energy consumption of 2838 Joules. The actual cost for this endeavor is
$0.002.
The task specifications in
Table 8 are used by our OpERA algorithm to decide on the suitability of resources discovered from the Materna VM traces such that these resources are capable of completing the task much more efficiently. Therefore, we utilize OpERA to optimize the placement of resources in order to improve or enhance the process of resource allocation, while lowering runtime, cost, and overall energy consumption. In this regard, we use the weights in this general use case to locate alternative resources that can run this task more efficiently. The results from the top 10 alternatives recommended by our OpERA algorithm are shown in
Table 9.
As can be seen in
Table 9, OpERA yields results having VM m1062 as an optimal resource for completing the Task ID 108145. It is clear that VM m1062 completes this task more optimally across all decision variables. For example, the actual energy consumption from
Table 9 for this task is 2838 Joules, whereas OpERA yields an alternative resource that can complete the same task with 816.86 Joules, or 2021.84 Joules less (a 71% reduction in terms of energy consumption). Similarly, the estimated runtime is 21.5 s, which is less than the actual runtime of 33 s. This represents a runtime reduction or improvement of 35%. In terms of the cost, m1062 completes the task with a total cost of
$0.001, which is a 50% improvement compared to
$0.002 based on the original task specification. OpERA’s average improvement across the three objectives: (a) runtime, (b) energy, and (c) cost, is 52% for Task 108145.
Furthermore, results shown in
Table 9 indicate that m1146 has the lowest values for energy usage and execution time. However, OpERA does not rank this alternative as the best option because it has a significantly higher CPU availability than m1062. If dominance is more desirable, OpERA would recommend m1146 as the optimal alternative. Likewise, m1 is connected with the lowest CPU utilization. This is not true for the typical use case, as there is a tradeoff between memory availability, CPU availability, execution time, energy usage, and total cost. In subsequent test cases, we shall show the distinctions between tradeoffs.
In addition, the data presented in
Table 9 demonstrate that the ranking alternatives for CPU utilization, energy consumption, and execution time, are not ranked from smallest to largest. Memory availability ranking choices are not ordered from largest to smallest. These results confirm that the general use case generates a non-dominant solution set and that the weights are translated as expected within the optimization model.
It should be emphasized that OpERA optimal VM considers the placement or distance measure of the compute node that is capable of performing the task when lowering execution time. In other words, although some computing nodes on the cloud layer may be more powerful, OpERA prioritizes allocating resources to edge devices that are physically close. Consequently, m1012 is not only the best-recommended resource, but also a resource on the fog layer and in the cloud. This eliminates any costs associated with transferring the task to the cloud, which greatly minimizes network latency.
The values from energy consumption, cost and estimate execution time in
Table 9 are derived based on our proposed energy, cost and runtime prediction models presented in
Section 3. To derive the predicted runtime for m1012, for example, we use the number of CPU cores that the virtual machine has and compare it to the number of CPU cores that the Task 108145 was executed on. We note that all of the tasks in the AuverGrid dataset were executed on single CPU machines as mentioned in
Section 3.
To demonstrate how OpERA computes execution times for various VM options, consider VM m1012, which comprises 2 CPU cores and yields a
p-value (parallelizable fraction) of 69.2% for Task 108145. Consequently, based on Equation (1), we compute the acceleration factor to be 1.53. Using Equation (3), we calculate the estimated execution time (21.5 s) based on the observed runtime (33 s) and the speedup factor (1.53). Similar to the cost model, the energy consumption model is based on the expected runtime multiplied by the basic TDP allocated to each CPU type in our model. In order to boost the heterogeneity of our testing environment, VMs from the Materna VM dataset were randomly allocated multiple CPU types, each of which is associated with a particular power consumption number, TDP. This is illustrated by the differences in energy consumption values presented in
Table 9, which illustrate the variety of VM resources. We present in
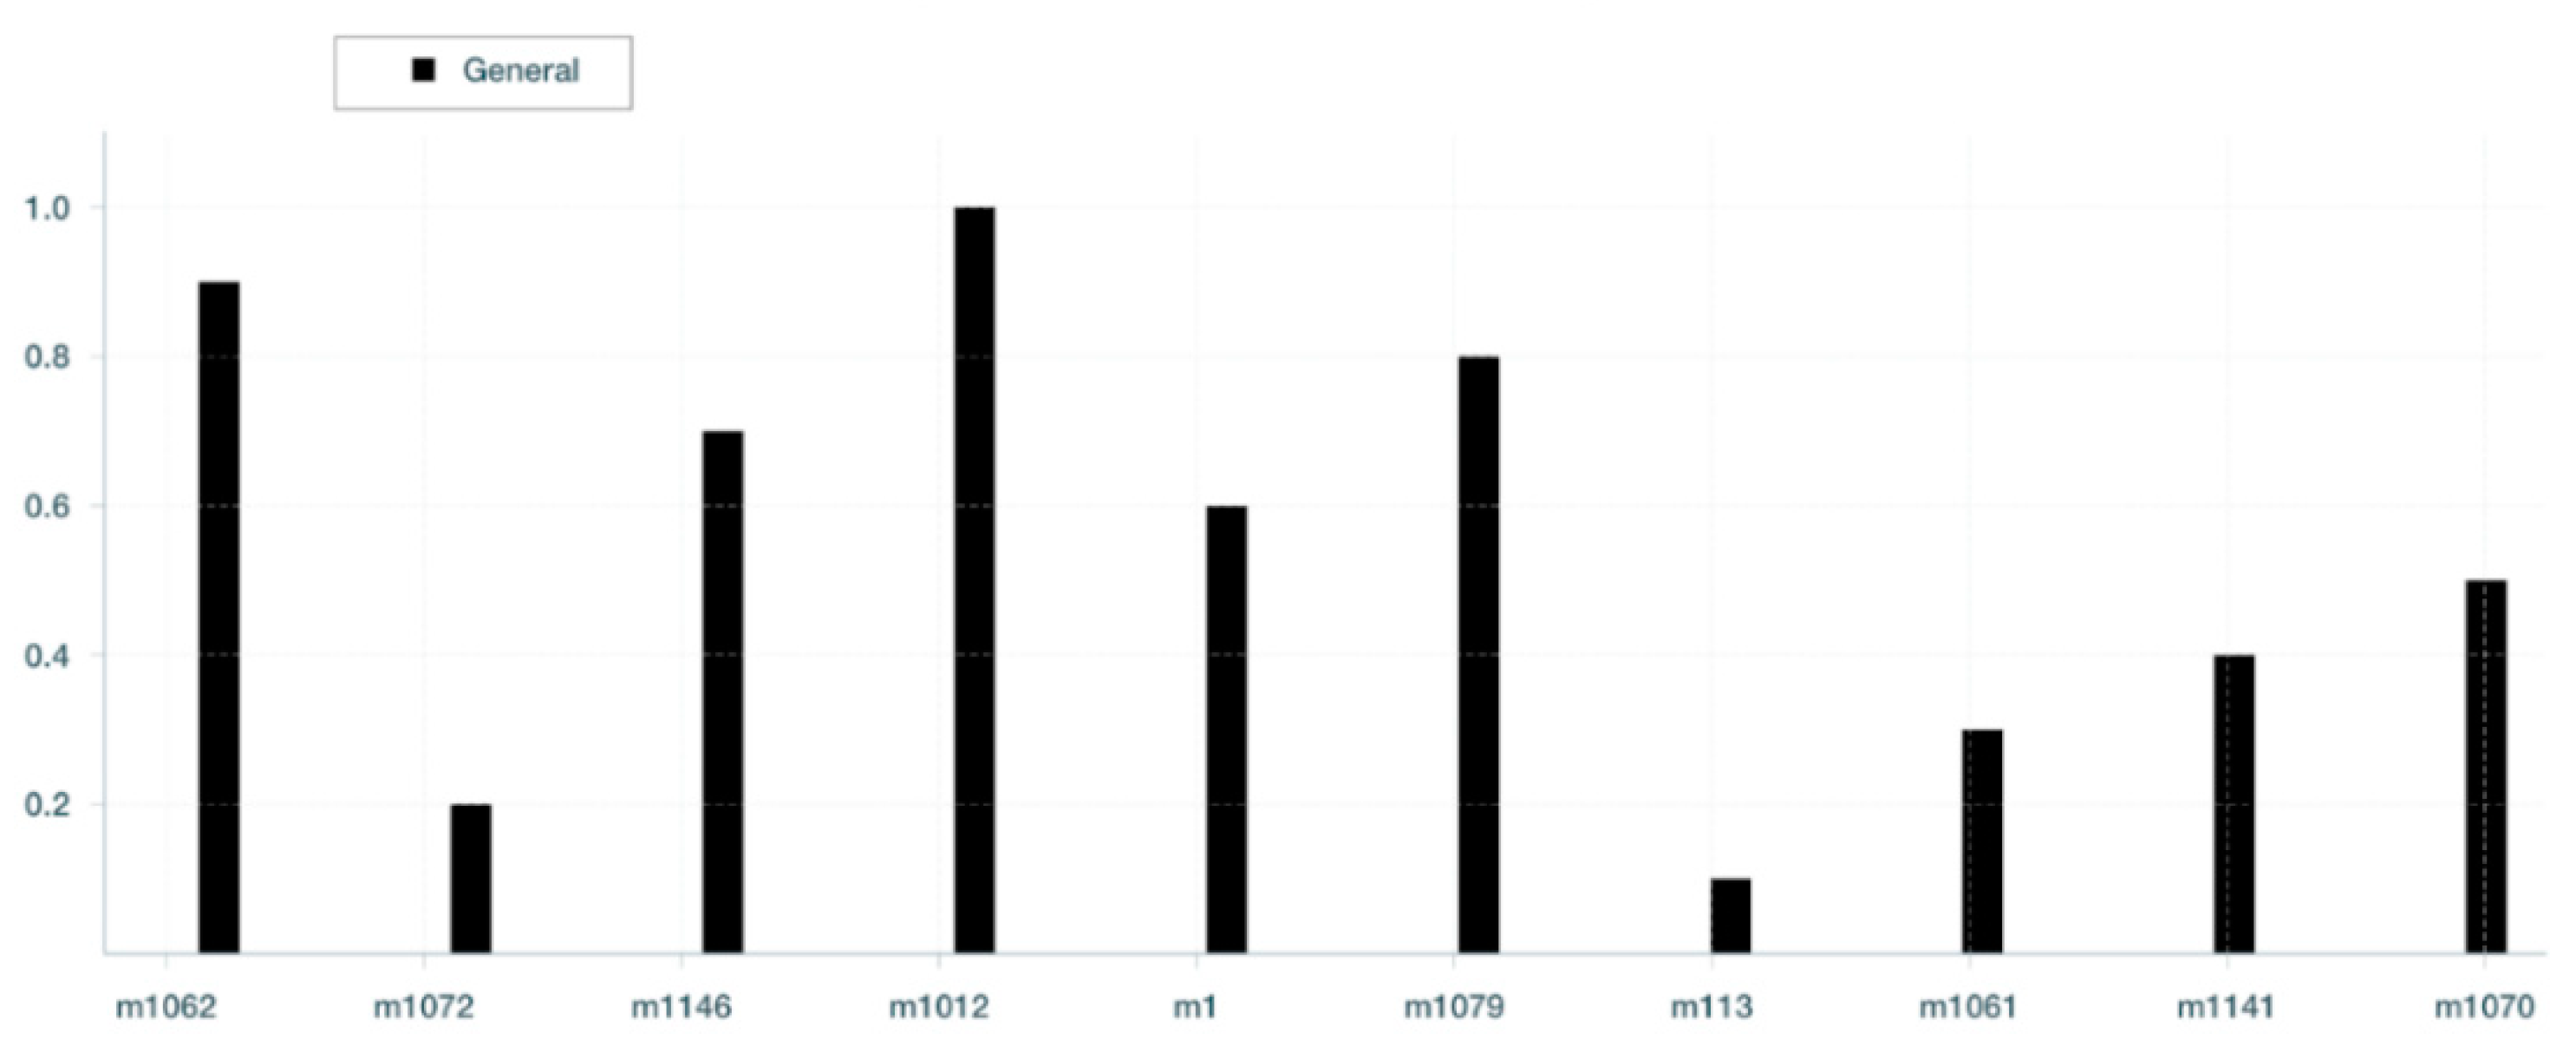
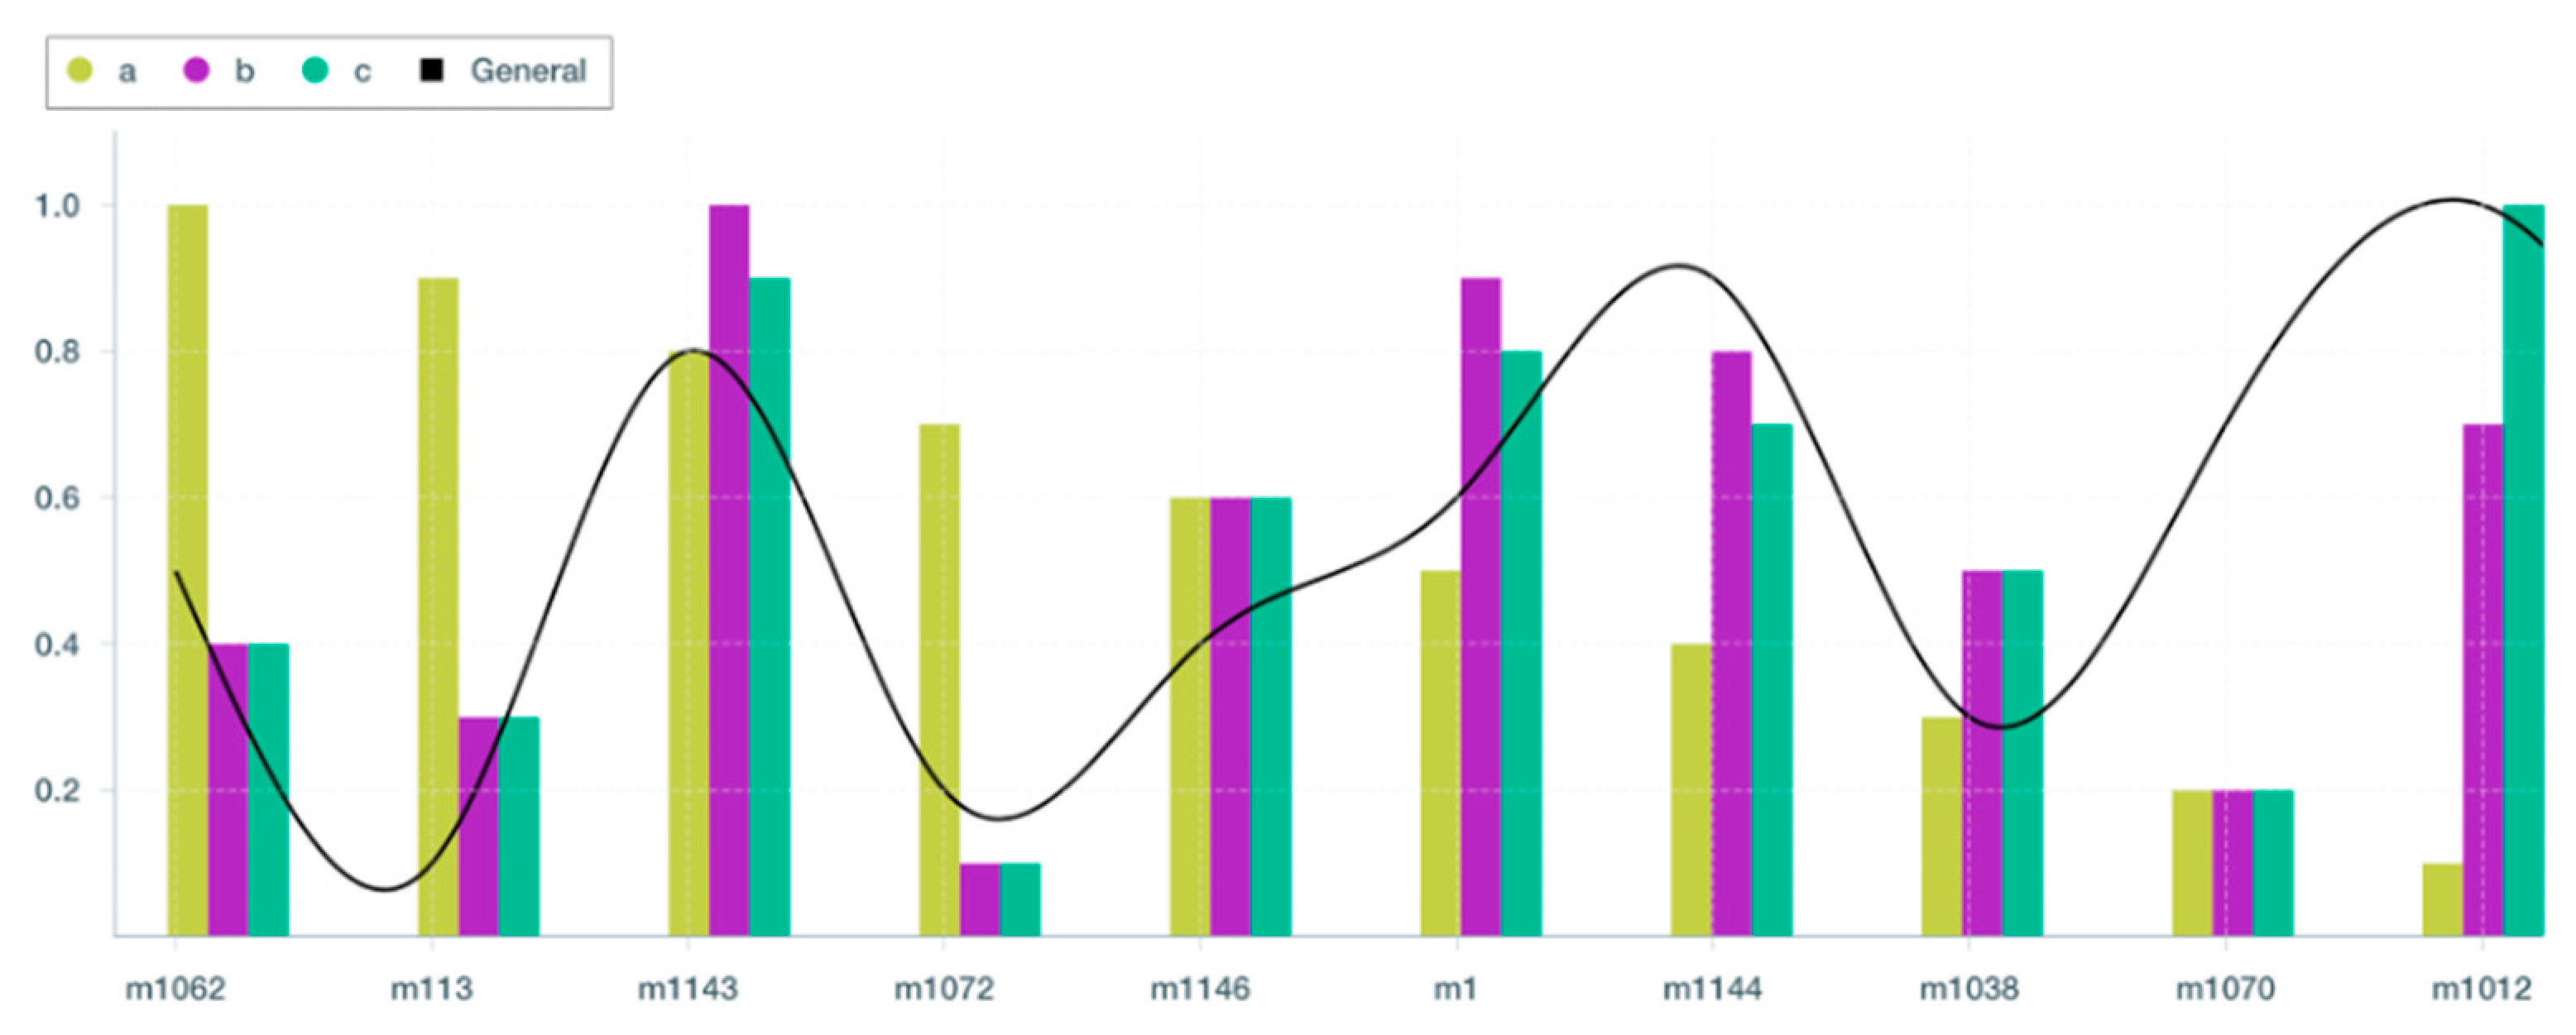
Figure 6 a column chart representing the OpERA ranking of VM alternatives.
As shown in
Figure 6, OpERA identifies VM m1012 as the optimal option for completing the offloading of Task 108145 in this generic use scenario. Our investigation of all returned VM options, in
Figure 6, confirms that the performance score associated with VM m1012, which represents the optimal resource, is accurate and that OpERA consistently returns meaningful results throughout the top 10 VMs recommended for performing this work.
4.4. Experiment B: Memory-Driven Test Case
For this memory-driven test case, we explore three variations of weight preferences to illustrate more clearly the usefulness of the OpERA algorithm in yielding consistent and reliable VM alternatives. To this extent, we begin with full dominance on memory availability, then transition into a much higher preference to energy consumption. That is, we consider two decision variables in this experiment: (a) memory availability, and (b) execution cost. Through this test case we demonstrate how the results are impacted by the preference or priority assigned to the decision variables considered. Hence, we start with the memory-driven use case, then slightly transition into a more dominant execution cost use case, using these two decision variables only in order to observe the outcome of our OpERA algorithm. The weight preference distribution we explore in this experiment are described below.
We randomly consider another task from the AuverGrid dataset, Task ID 224334, whose characteristics are listed in
Table 10. This task has been completed in the fog layer, with a cost factor of
$0.12, uses 187,222 Joules of energy, 1,494,608 KB of memory, and requires 2177 s, or 36 min, to complete. Compared to the task in Experiment A, the task in Experiment 2 is evidently more complex and demands more computing resources.
We will evaluate the outcomes of our OpERA approach as we transition from one test case to the next, based on varying weighting factors. In
Table 11, we present the results of our OpERA algorithm processing VM resources for resource allocation for the clear memory-driven use case. According to
Table 11, OpERA recommends VM m1062 since it has the most available memory among all other VM resources analyzed. Despite the fact that m1062 is not the ideal resource in terms of execution time, it is evident that the criterion used in this test scenario is memory-drive, regardless of whether the resource is local, close to the edge device, or distant (e.g., on the cloud). Moreover, m1062 is not the most cost-effective resource when compared to VMs m1143 and m1012. As we transition the dominance away from memory availability, we should observe a change in the OpERA ranking as different VMs are dynamically allocated for each test case.
In
Table 11, we present the results of our OpERA algorithm for the second test case, which slightly adjusts the emphasis from memory availability to execution cost. As shown in
Table 11, OpERA recommends m1143 VM as the best option, despite the fact that it is not the optimal VM resource in terms of memory availability when compared to options 7, 8, and 10, respectively. In addition, despite the fact that resource m1143 does not have the highest memory availability, its cost has lowered by 33 percent compared to the cost utilization of the first alternative chosen from the first test case provided in
Table 11, which was
$0.091 for resource m1062. This demonstrates that OpERA is reflective and responds dynamically dependent on the weights of the decision variables. It should be noted that highly rated VM resources are not necessarily optimal for this test case in terms of execution time. As we transition to a much higher cost-driven dominance over memory availability, the optimal resources selected by OpERA, as indicated in
Table 12, should become increasingly apparent.
As can be observed from
Table 13, as we transition the weight to execution cost, we clearly see that m1012 is ranked first compared to m1143 since it has much lower execution time (1637.65 compared to 2177 s). This also applies to the third alternative m1 when compared to m1012, the first alternative. Further, m10162 has clearly transitioned from being a memory-drive resource to a slightly more moderate. To this extent, results from
Table 13 clearly demonstrate that our OpERA algorithm is yielding relevant results given the fine-tuning or adjusting the weights. In addition, OpERA is capable of yielding relevant results, while considering a well-balanced strategy when recommended resources for allocation.
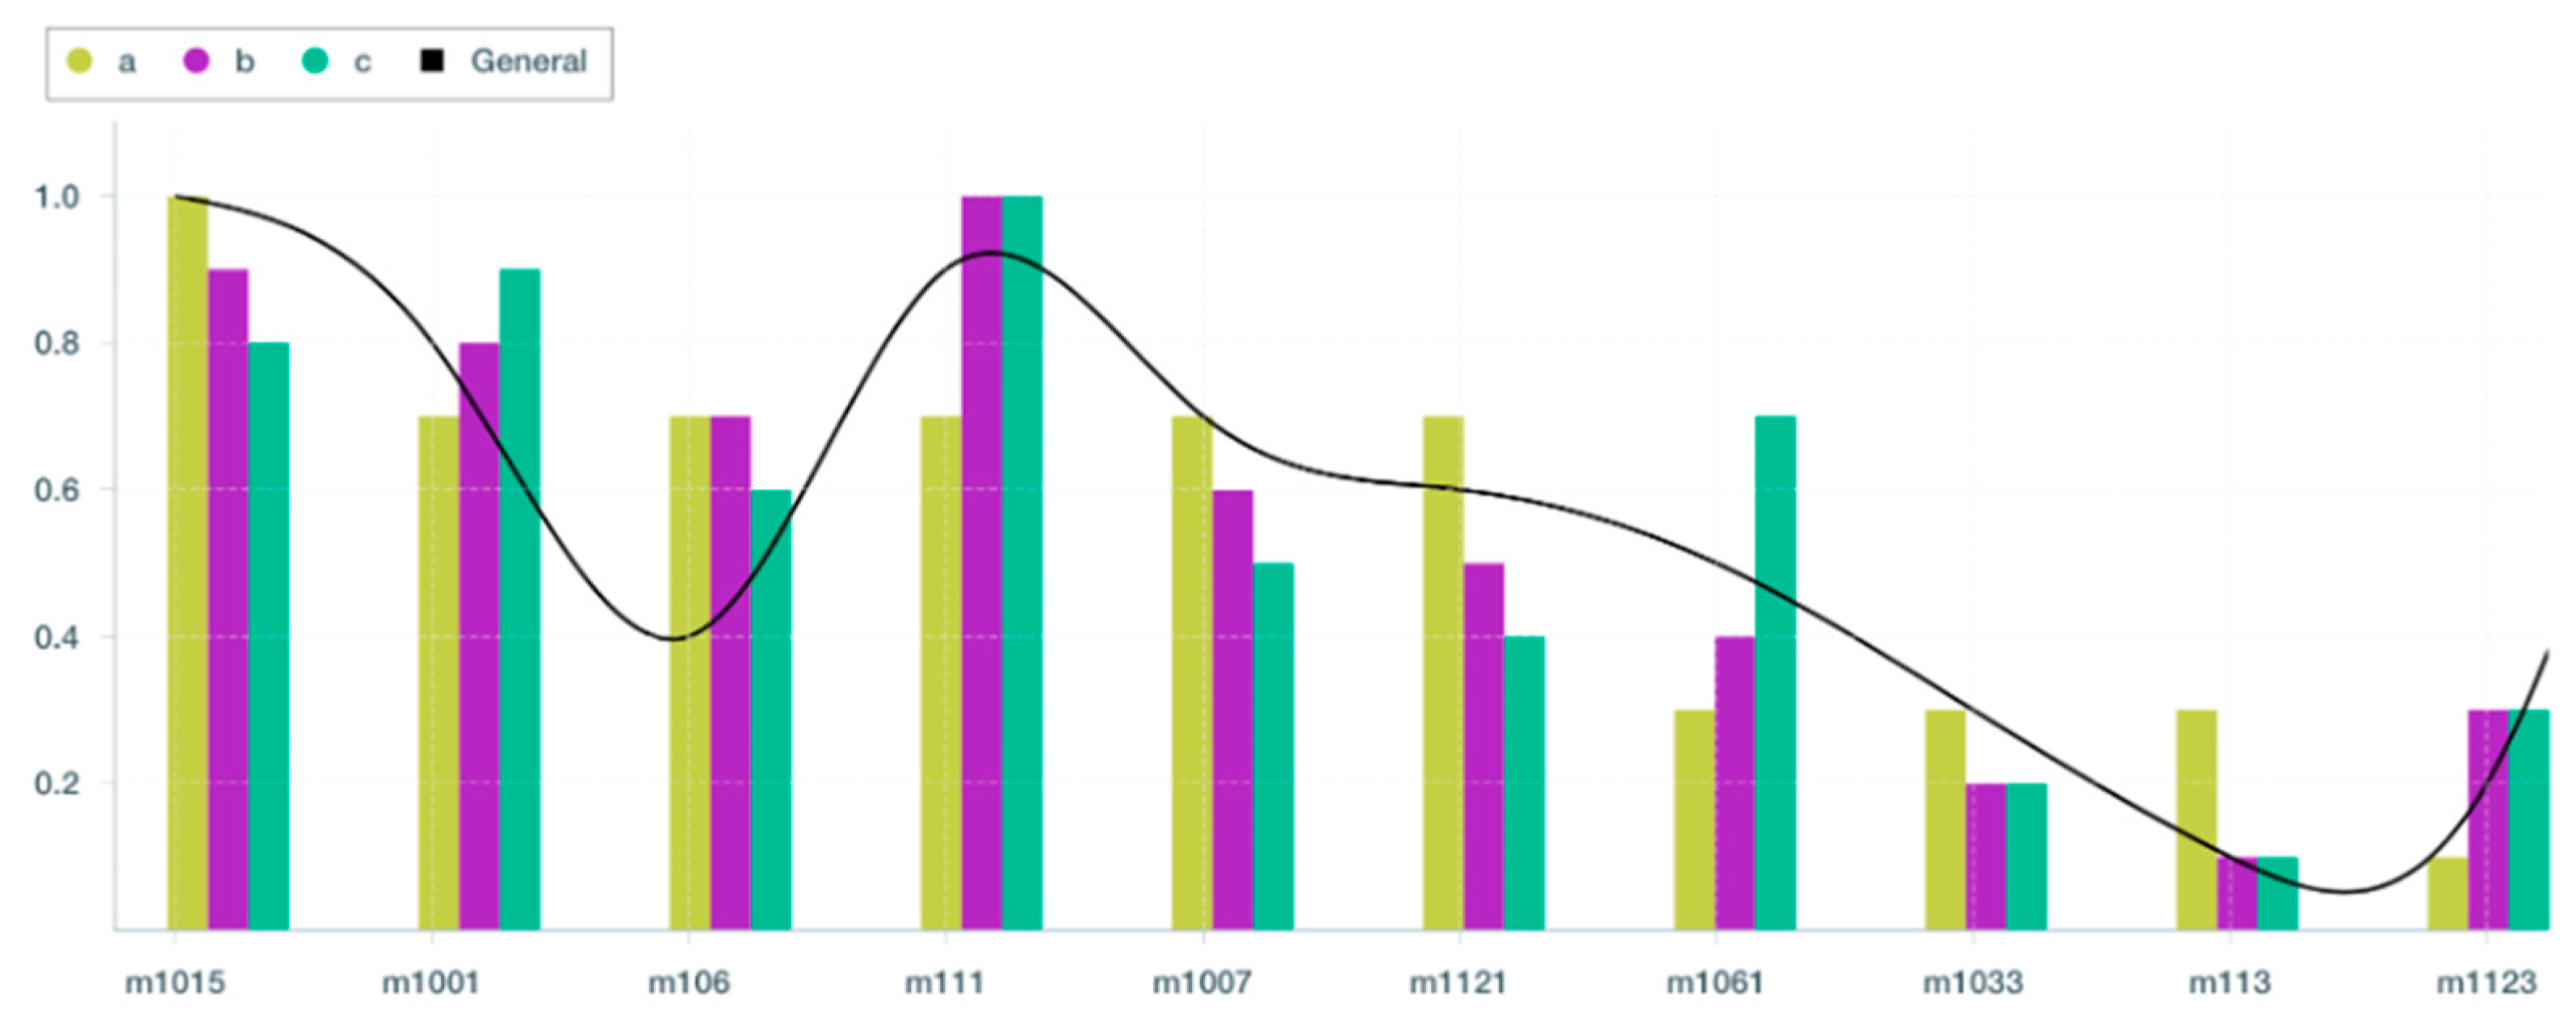
Figure 7 presents a column chart of the results obtained from this experiment.
Based on the results shown in
Table 11,
Table 12 and
Table 13 and
Figure 7, the recommended resources to offload Task 224334 for test cases (a), (b), and (c), are m1062, m1143, and m1012, respectively. Memory is possessed by all three of these resources, allowing them to execute Task 224334. According to
Table 11,
Table 12 and
Table 13, delegating Task 224334 to any of the alternatives reduces cost, energy usage, and execution time. However, m1012 receives the greatest increases across all three areas, resulting in a 25% increase in runtime (i.e., from 2177 s to 1637.65 s). In addition, as demonstrated in
Table 10 and
Table 13, delegating Task 224334 to m1012 reduces energy usage by 67 percent and costs by 62 percent, respectively. The performance score analysis suggests that all of the top ten identified VM resources indicated by OpERA, particularly m1062, m1143, and m1012, are ideal or appropriate resources for executing the offloaded tasks with an overall acceptable performance improvement. This demonstrates how well our OpERA system can offer optimal resources for task allocation, which can enhance the overall performance of offloading activities as the number of IoT devices increases.
4.5. Experiment C: Cost-Driven Test Case
We adjust the CPU’s weight relative to the energy cost component for the cost-driven test case. The rationale for this is that there is a correlation between CPU usage and energy consumption, such that the more complex the task, the more processing would be required. Consequently, energy consumption increases. In the use case driven by cost savings, we begin by assigning a weight of 1 to cost and a weight of 0 to all other attributes. We will then change the weight dominance from cost to CPU consumption and observe the results. The weight preference distribution we investigate in these tests is given in detail below.
We examine a random task from the Materna dataset, Task ID 318037, whose specifications are given in
Table 14. Task ID 318037 based on Materna traces was performed on a cloud layer with a cost factor of
$6.31, energy consumption of 7,717,828 Joules, memory usage of 70,104 KB, and a duration of 112,998 s or 31.39 h. As can be seen, the complexity of this experiment’s task is considerably greater than that of experiments A and B.
First, we investigate the outcomes of the weight distribution that is weighted in support of cost, as represented by test case (a) in
Table 15. As presented in
Table 15, our OpERA algorithm recommends selecting VM resource m1015 at the top of the list because it has the lowest cost (
$1.55). The remaining options are ranked according to an ascending cost factor. For test case (b), we begin to move our preference from cost to incorporate CPU availability, as shown in
Table 16.
As we transition the weights dominance away from cost and towards CPU usage minimization (test case (b)), the ordering of the alternatives in terms of ranking position begins to change, with m111 being ranked as the optimal resource. The resource m111, which was ranked fourth in case (c), is now ranked first due to its low CPU utilization (13 MHz). The second choice recommended by OpERA is m1015, which is associated with a lower cost but has a CPU utilization that is approximately 2600 times greater than that of m111. The tradeoff in this situation is a loss of 25% in cost accumulation due to the best recommended resource being m111.
As we transition further to CPU usage minimization for test scenario (c), where CPU usage becomes a more dominating decision variable, it is evident from
Table 17 that m111 maintains its optimal ranking because it is a resource associated with the lowest CPU usage (13 MHz). However, m1001 is recommended as the second ideal option above m10155 since, as shown in
Table 17, its CPU utilization is significantly lower (267 MHz vs. 340 MHz, respectively).
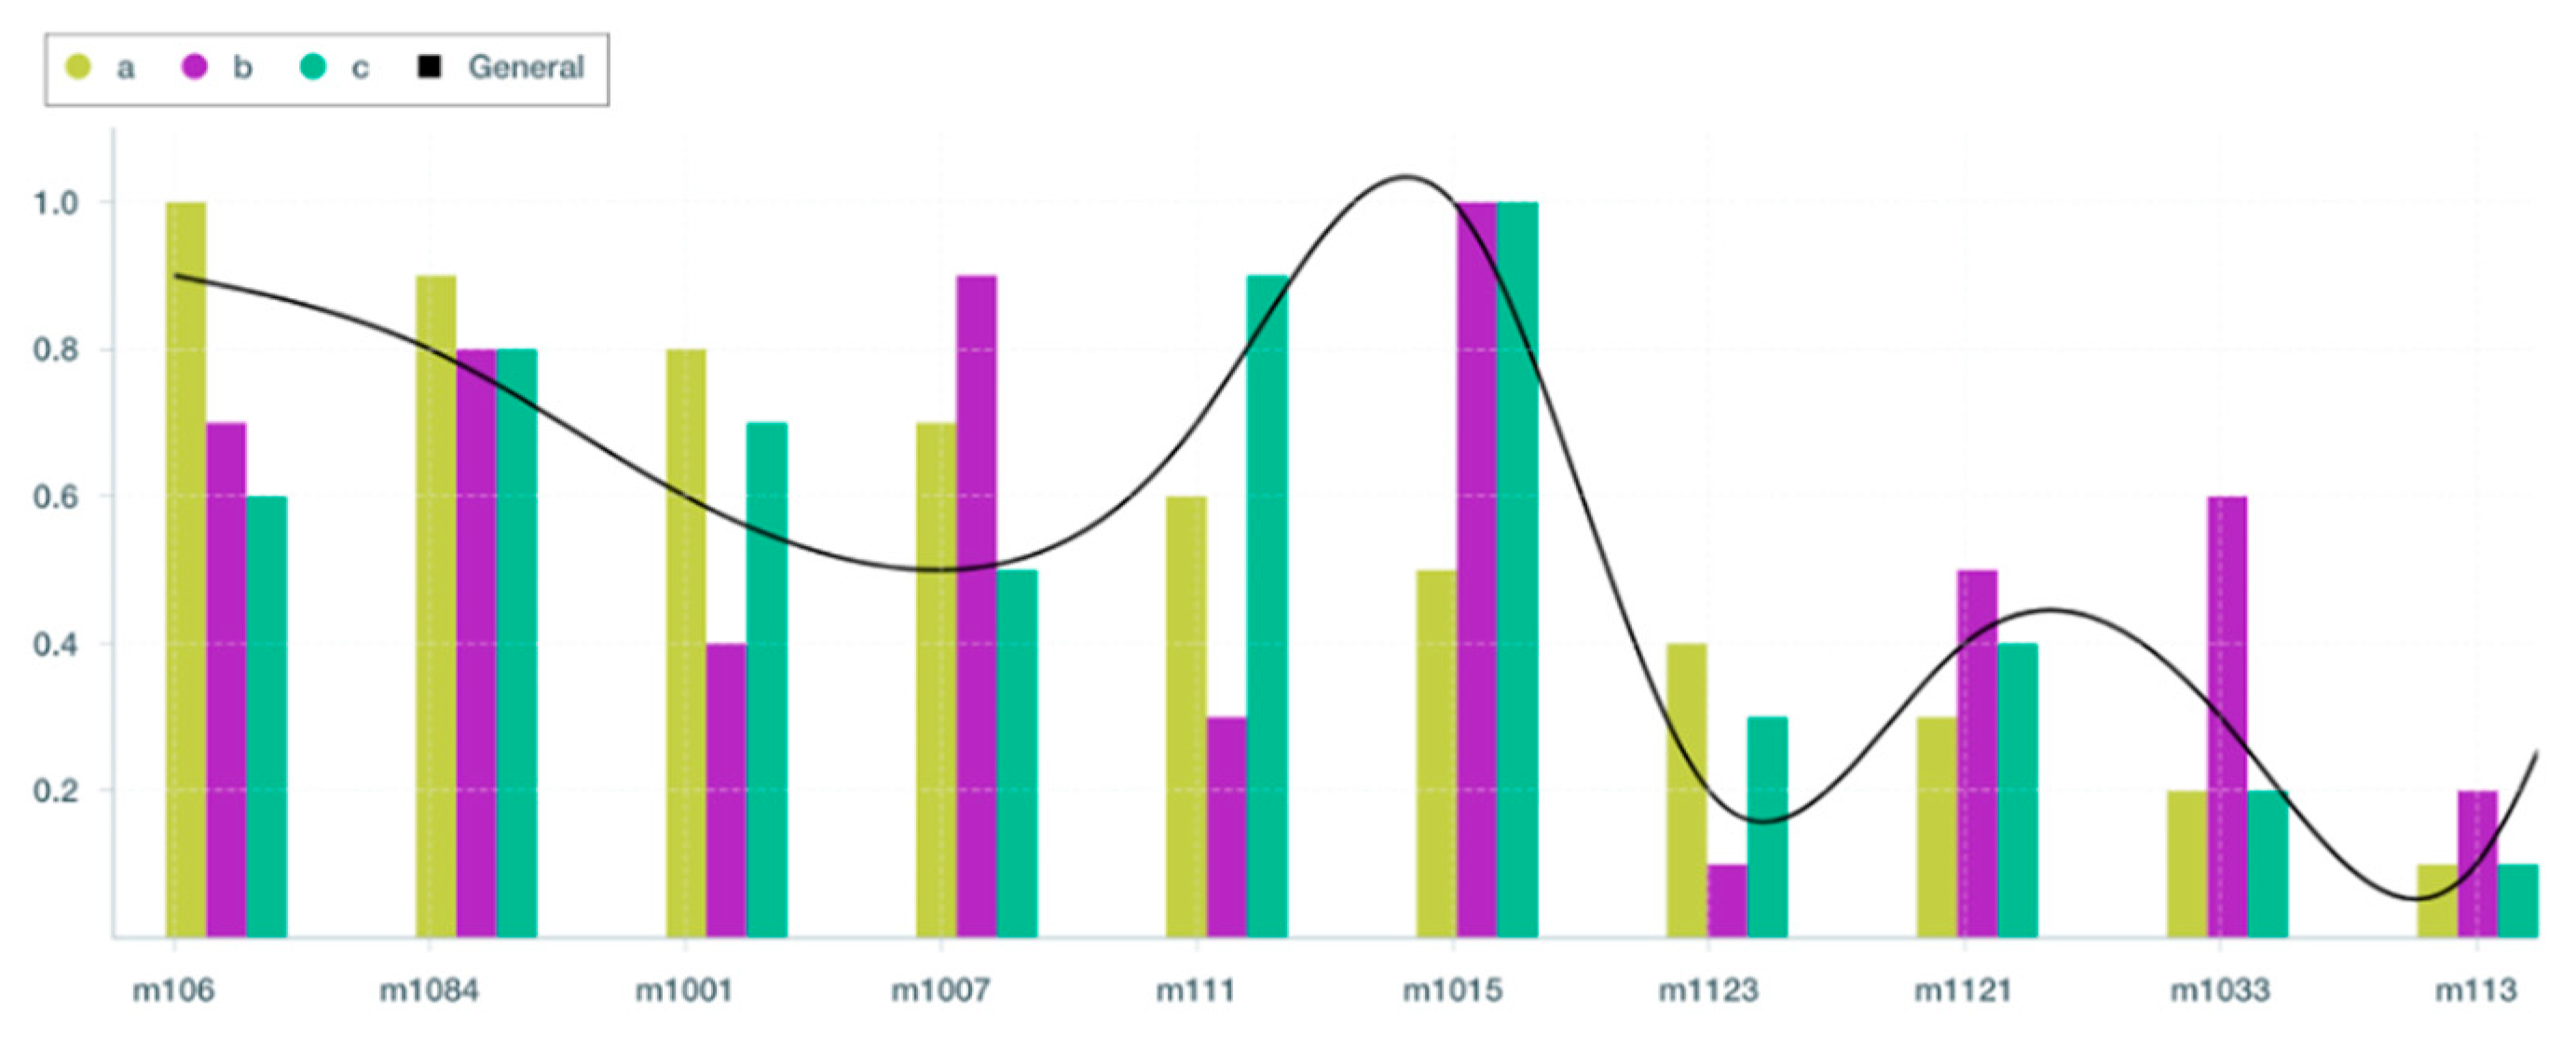
Based on the results shown in
Table 15,
Table 16 and
Table 17 and
Figure 8, OpERA recommends VM m1015 for test case (a), but VM m111 for test cases (b) and (c), respectively. Further, we can see that VM m1061 was among the lowest-ranked VMs in test cases (a) and (b), although it is clear that it is one of the top four VM resources recommended by OpERA. In addition, as demonstrated in
Table 15,
Table 16 and
Table 17, delegating Task 318037 to m1015 reduces energy usage by 85% and costs by 75%, from
$6.31 to
$1.55. Our analysis of the performance score indicates that all 10 resources selected for all of the weight assignments, particularly m1015, are optimal for performing the offloaded task with performance gains. This demonstrates that OpERA is able to recommend optimal solutions with varying degrees of optimality.
4.6. Experiment D: Compute-Driven Test Case
We broaden our decision variable selection for the compute-driven experiment to include memory availability, CPU utilization, and energy consumption attributes. For use case (a), we first assign a weight of 0.495% to memory availability, 0.495% to CPU usage, and 0.015% to energy consumption, while assigning a weight of 0 to all other variables. The specified weights reflect a workload that demands extensive CPU and memory to complete its operations. Then, in use cases (b) and (c), we see the impacts of switching the weight dominance between memory availability, CPU usage, and energy consumption. The weight preference distribution analyzed in these tests is described in full below.
Task ID 334016, whose specifications are provided in
Table 18, is randomly selected from the AuverGrid dataset. This work was assessed to have been finished in 3419 s (or 56 min), with energy use of 294,034 Joules, memory usage of 732,832 KB, and a cost factor of
$0.19.
We begin by analyzing the results of the weight distribution for memory and CPU use. As shown in
Table 19, our OpERA algorithm ranks resource m106 as the optimal resource to be allocated due to its higher memory availability, and lower CPU utilization when compared to other alternatives in the list.
Table 19 demonstrates that the weight associated with energy consumption does not play a significant role in the decision, as highly ranked resources are not energy-ware.
In test case (b), we shift the weights’ dominance away from CPU usage and toward minimizing energy consumption; the resulting values are shown in
Table 20. As seen in
Table 10, OpERA recommends VM resource m1015 as the ideal solution due to its lower energy consumption of 3614.73 Joules in comparison to other VMs in the list. However, the 0.495-weighted energy consumption dominance is reflected in CPU usage, such that the highly rated VM resources in
Table 20 are not always ideal in terms of CPU usage. VM resource m1015, for instance, has a CPU consumption of 340. However, this VM resource’s CPU use is not the worst. In fact, it is evident that this sorted list of OpERA’s suggestions exemplifies the organization’s balanced approach to selecting recommended resources for allocation. In addition, even though m1015 does not have the maximum memory availability, its memory availability is approximately 36 percent lower than the second option. As indicated in
Table 20, the energy savings represent a reduction of more than 56 percent compared to the second-best option, m1007.
In use case (c), we restore to CPU usage dominance, but we reduce the weight for memory availability, while energy consumption remains the same (0.495) as in use case (b). The resulting values are displayed in
Table 21. As seen in
Table 21, OpERA continues to recommend the VM resource m1015 as the ideal resource since it strikes a balance between CPU utilization and energy consumption. Nonetheless, it is evident that the adjustments have affected m1007, which has been demoted to sixth place in the ranking list due to its higher CPU utilization of 634 than the top five VM resources revealed in this list. Moreover, it is evident from the results in
Table 21 that the energy consumption is the most important component in the ranking, with the slight exception of VM resources m1121 and m123, which are ranked higher despite having higher energy consumption values. However, both of these VM resources have significantly lower CPU utilization than the lowest VM resources on the list, m1033 and m113, which have CPU usage that is three to four times higher, respectively.
By applying OpERA on a range of edge-based operation types, we have proved that our optimization technique yields at least a 30% gain in terms of overall performance. Additionally, results shown in
Figure 9 demonstrate how well OpERA is able to produce optimal results related to the utilized weight preferences. For instance,
Figure 9 depicts m1015 as the best resource for executing offloadable Task 334016 in use cases (b) and (c). However, it is not a particularly suitable test scenario (a). This is because in use cases (b) and (c), the emphasis was on CPU usage and memory availability, whereas energy consumption played no role in the ranking. Nonetheless, as this technique shifts in use cases (b) and (c), it is evident that this VM becomes the most recommended since it has the lowest energy consumption value among all VM detected with 36134.73 Joules.
In addition, a comparison of
Table 19 and
Table 21 reveals that offloading Task 334016 to m1015 (use cases (b) and (c)) reduces energy consumption by 88 percent, from 294,034 Joules to 36,134 Joules, and cost by a factor of 76 percent, when compared to m106 in use case (a). Despite the fact that the top alternatives in each category are ideal resources for executing the offloaded task, m1015 and m106 are the most performant resources with the greatest performance increases. In this way, we demonstrate that OpERA is able to provide relevant insights with a high success rate of 96% in identifying suitable resources for offloadable task.


