
Detection of Diabetic Retinopathy in Retinal Fundus Images Using CNN Classification Models

 , ,
, , 
Abstract
1. Introduction
- This work’s laboratory database has a very large size, is little, and has some noise, and deep networks are slightly difficult to train. Thus, this study uses some preprocessing methodologies on the laboratory datasets to increase the training dataset and improve the performance of using a deep training network, such as resizing of input images, augmentation, and data normalization.
- This study demonstrates that CNN-based approaches could achieve state-of-the-art performance in DR detection. In addition, this work uses CNN methods to find the fundamental picture features relevant to disease grade prediction. Later on, it justifies those aspects in light of expert expertise. Furthermore, this study evaluates different CNNs rigorously, taking into consideration what factors were used to determine illness state, and justifies their clinical utility.
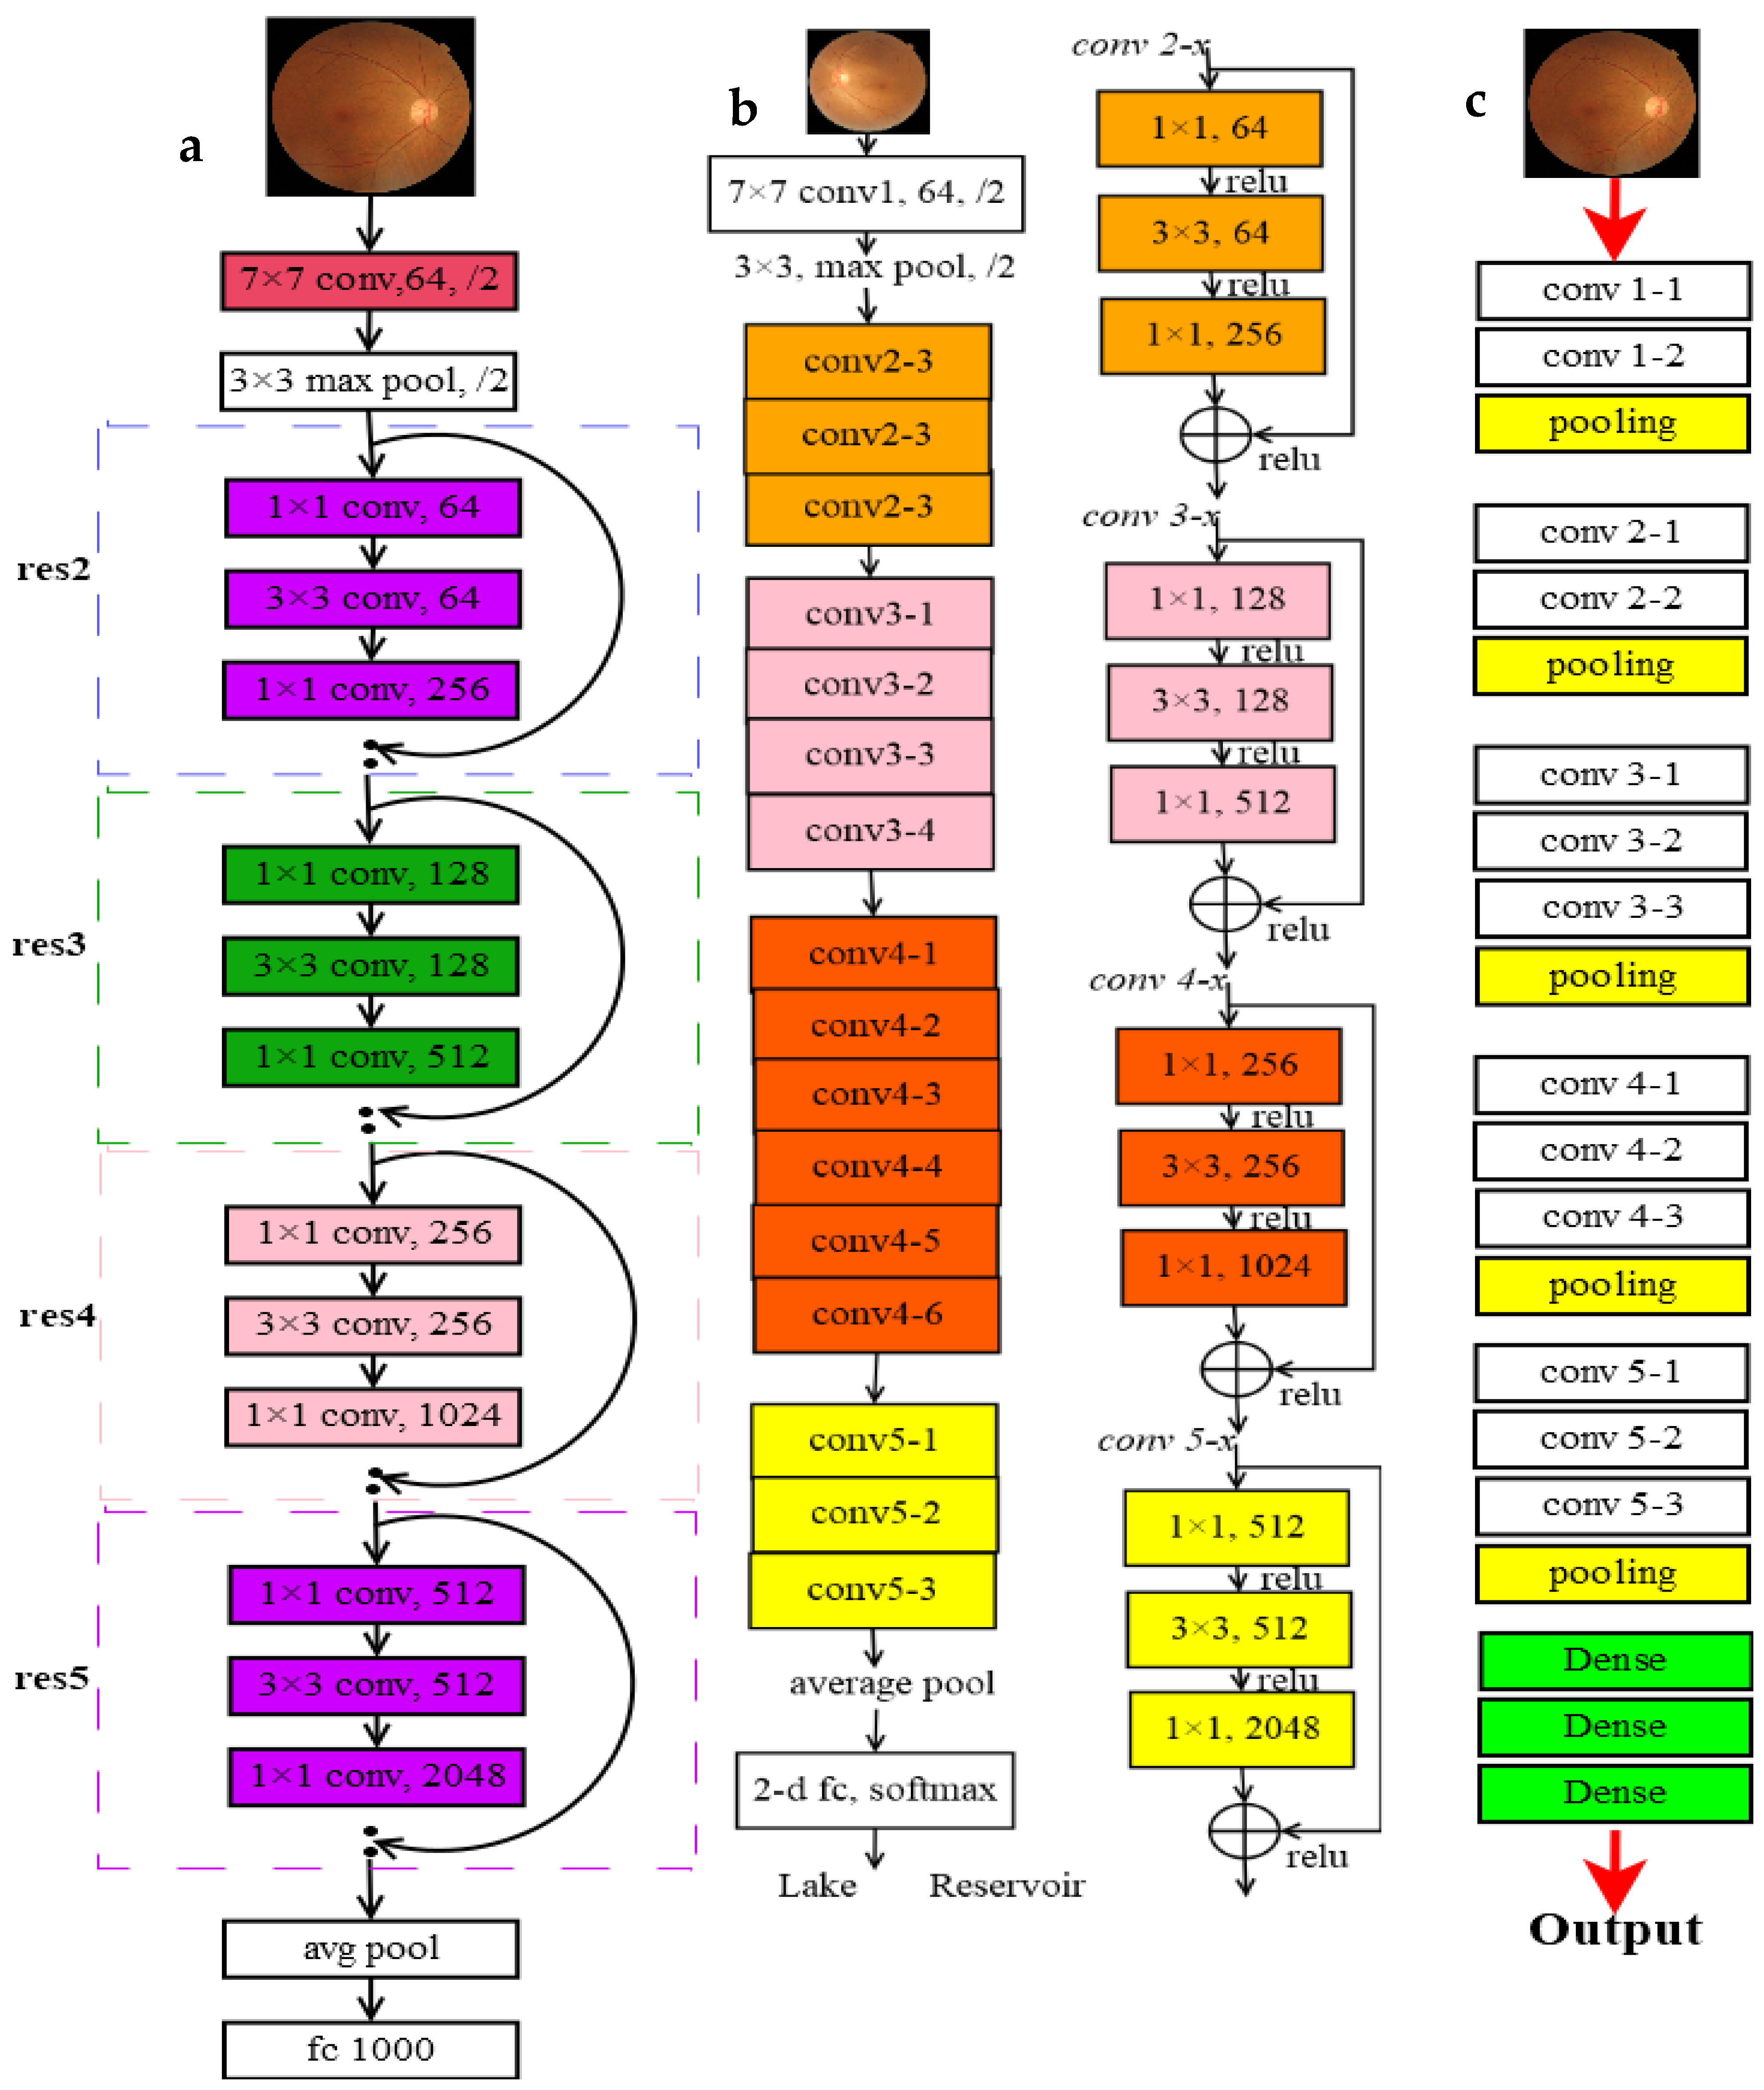
- Exploiting the advantages of CNN and ResNet with images, this work utilizes ResNet-101, ResNet-50, and VggNet-16 to recognize the slight differences and classify DR images.
- This study also compares these three networks to determine the best for this kind of image.
2. Related Work
3. Methods
3.1. Proposed Solution for Solving the Dataset Issues
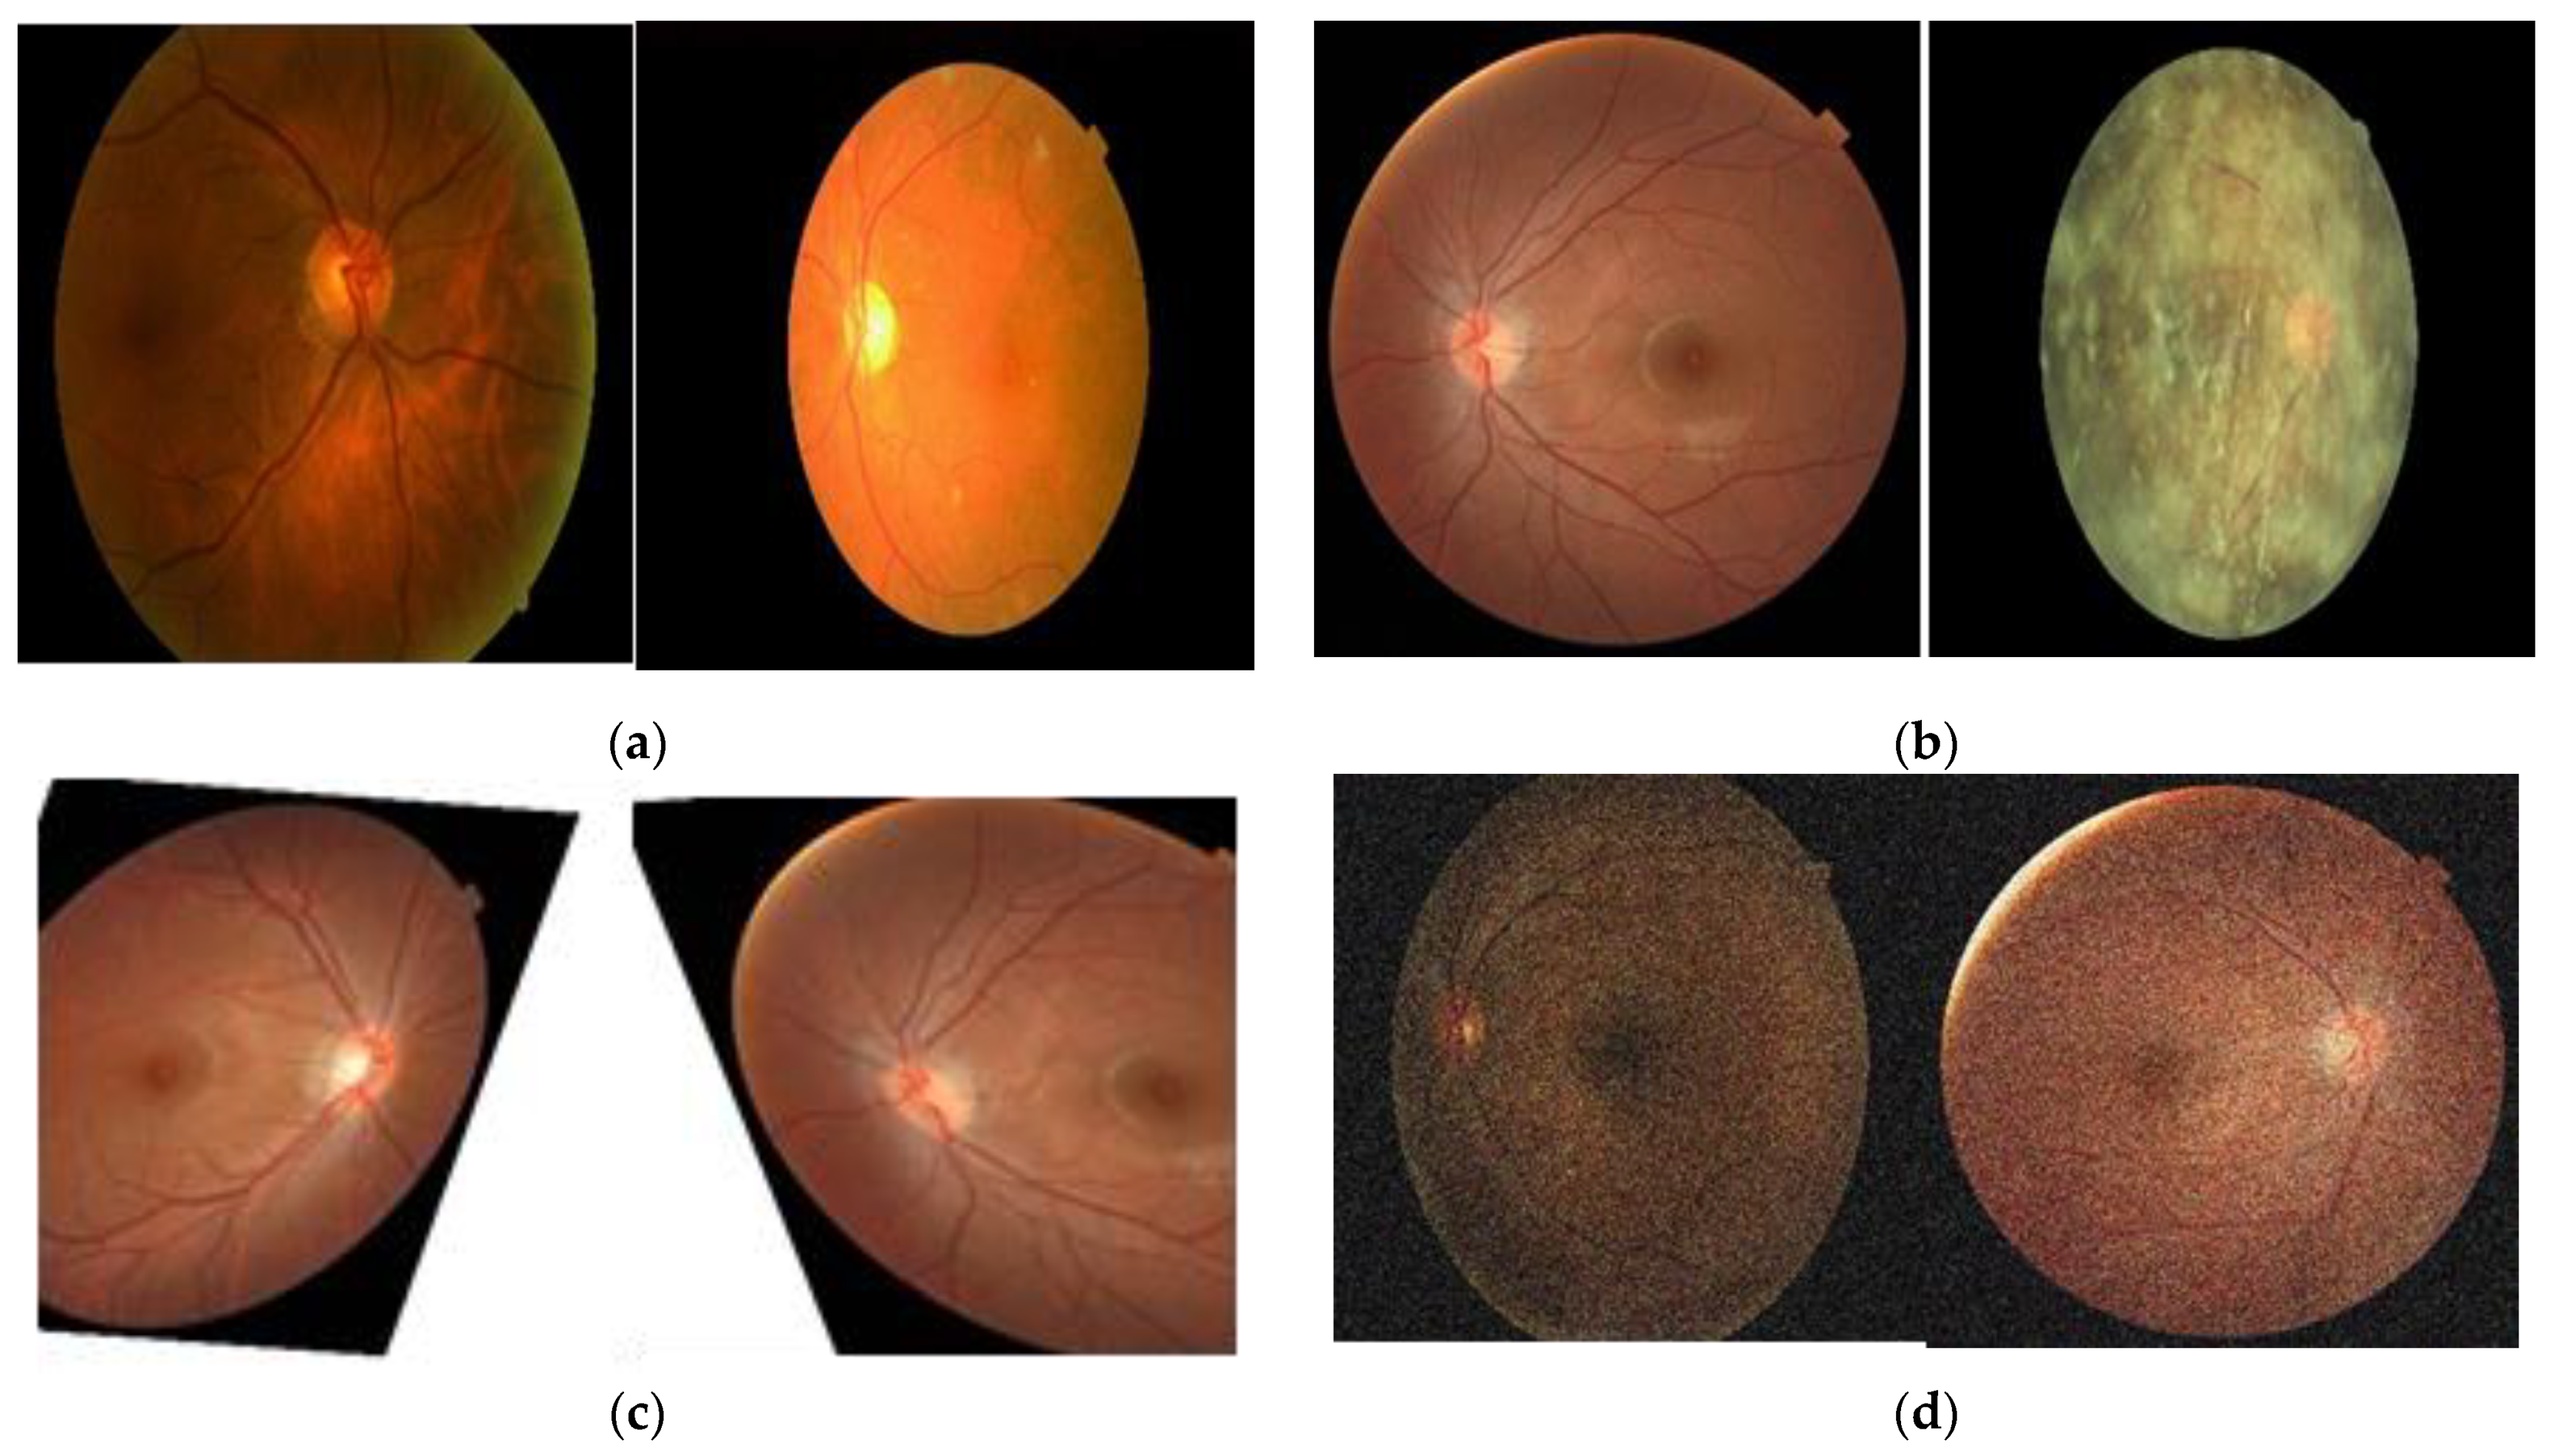
3.1.1. Data Preprocessing
- Original fundus image dataset and retinal image grading systems
3.1.2. Data Augmentation
3.1.3. Utilizing CNN Models
- VggNet-16
- ResNet (50 and 101)
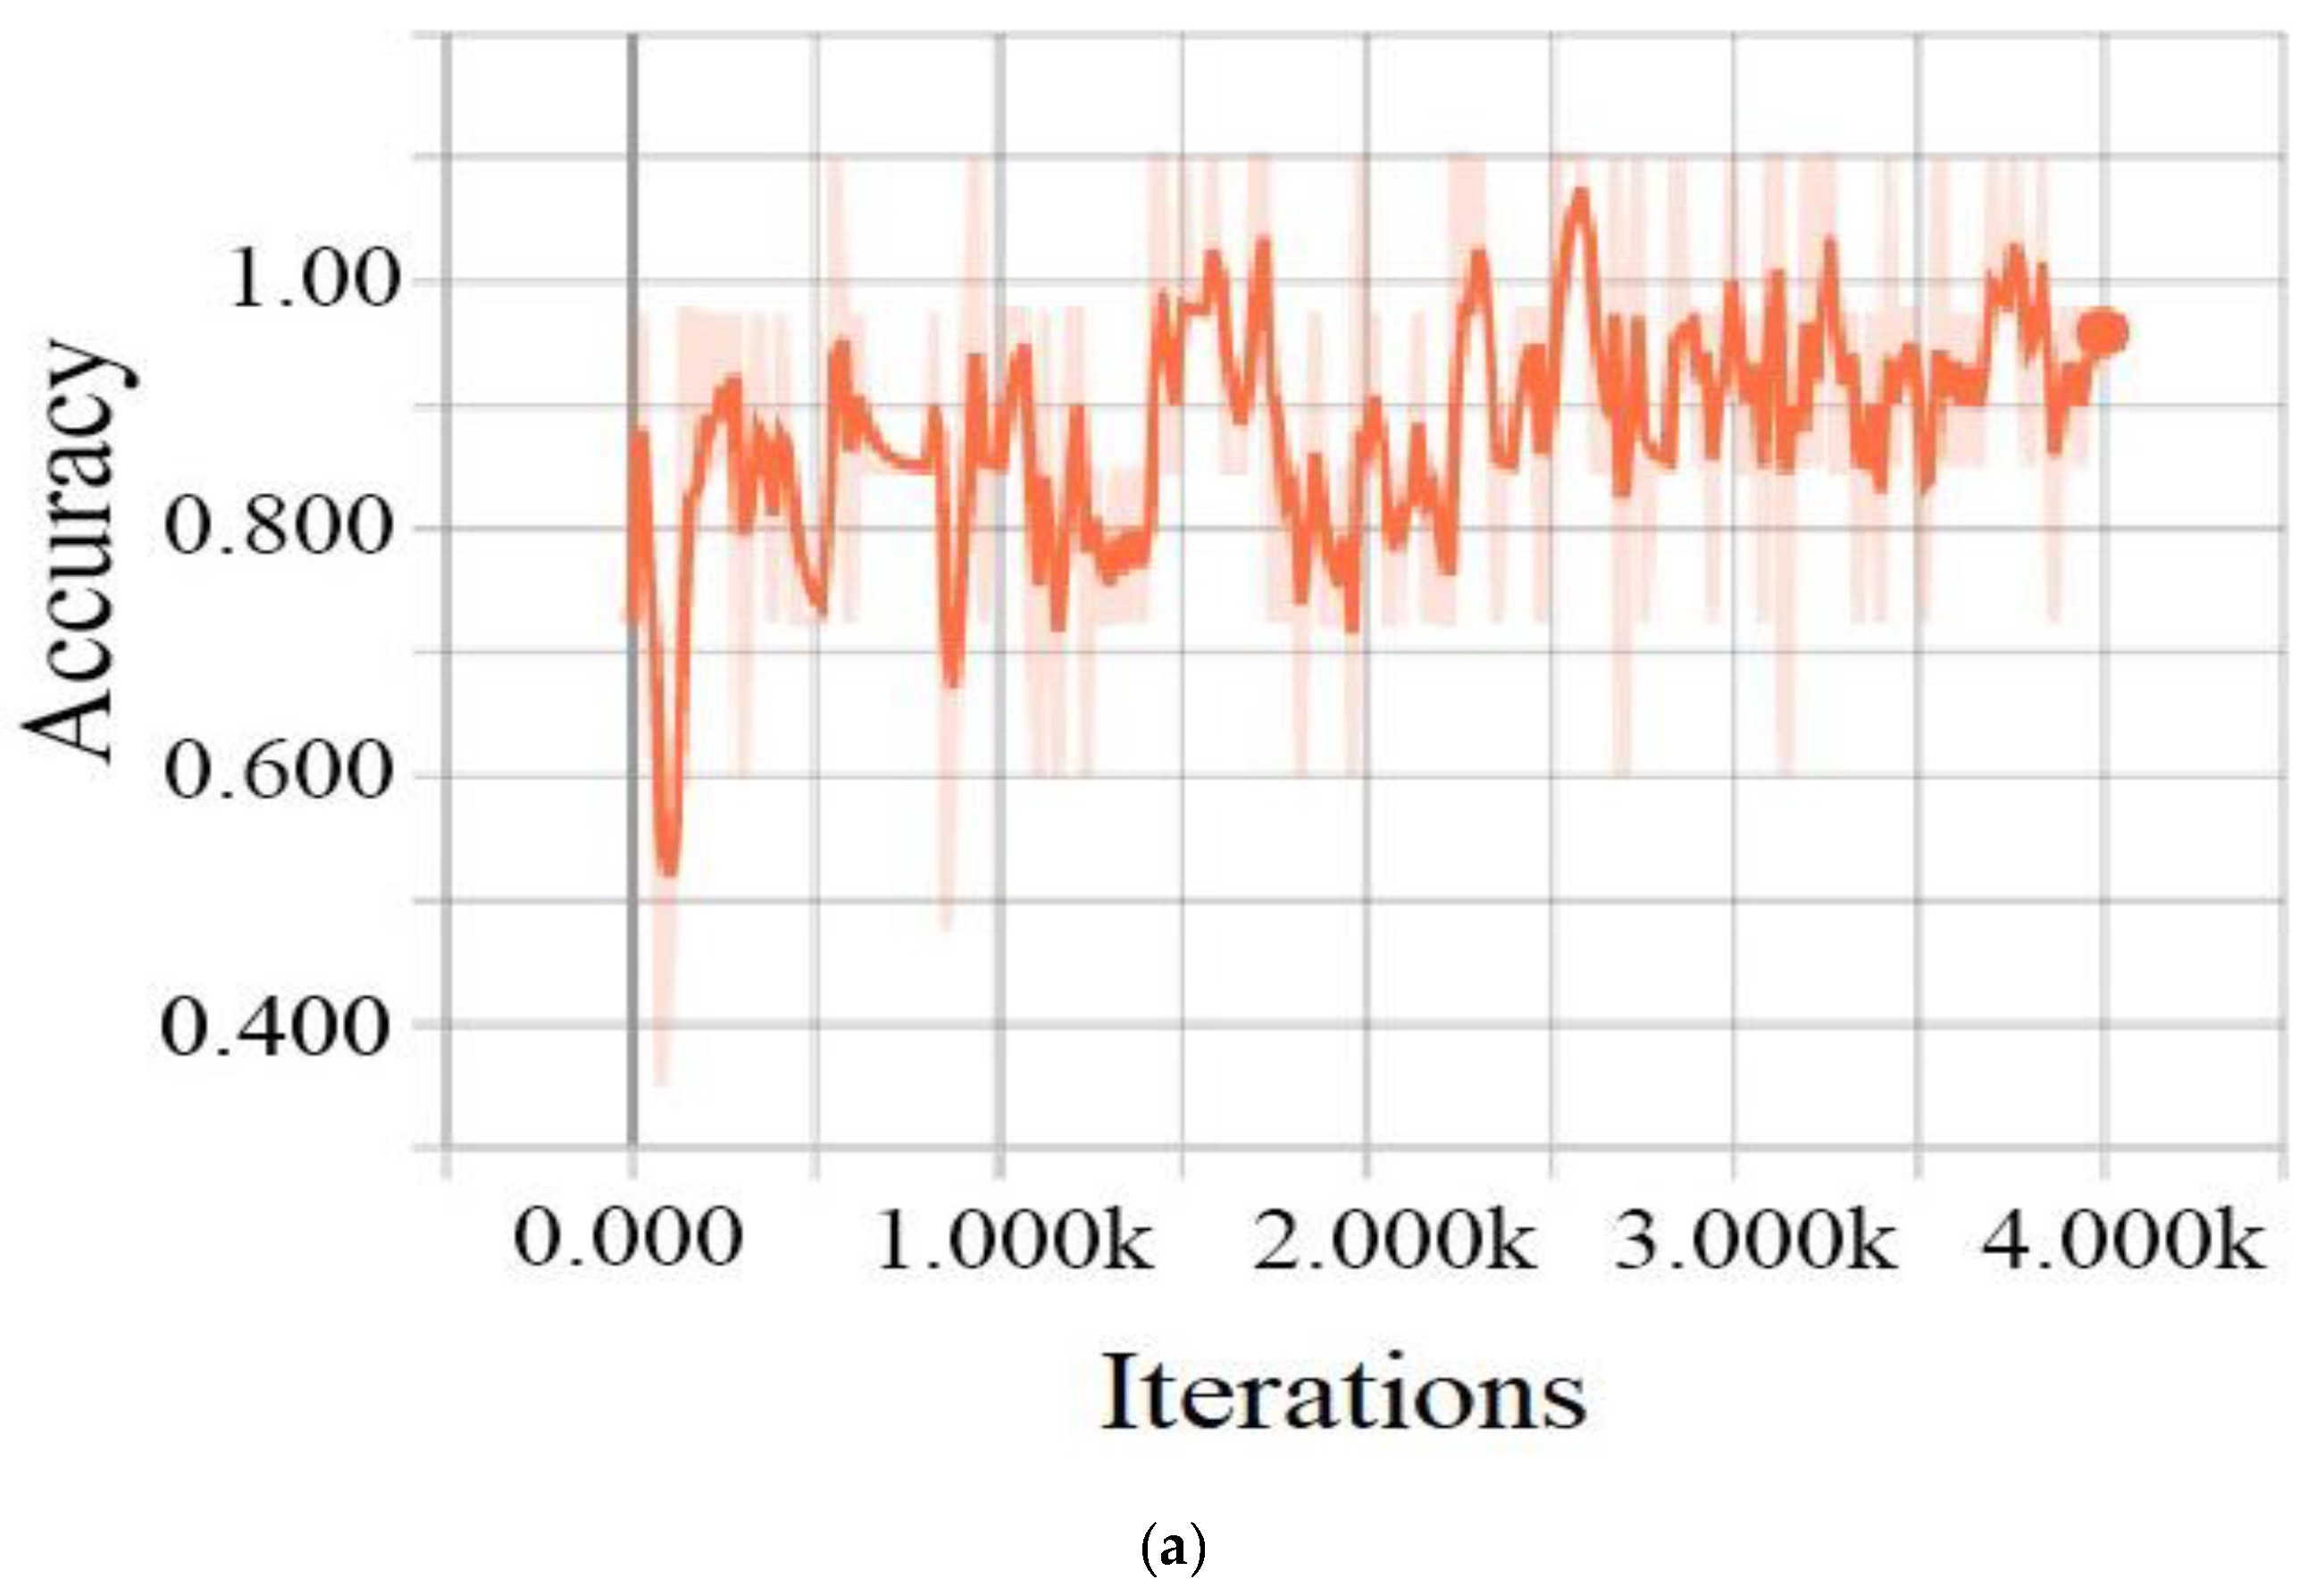
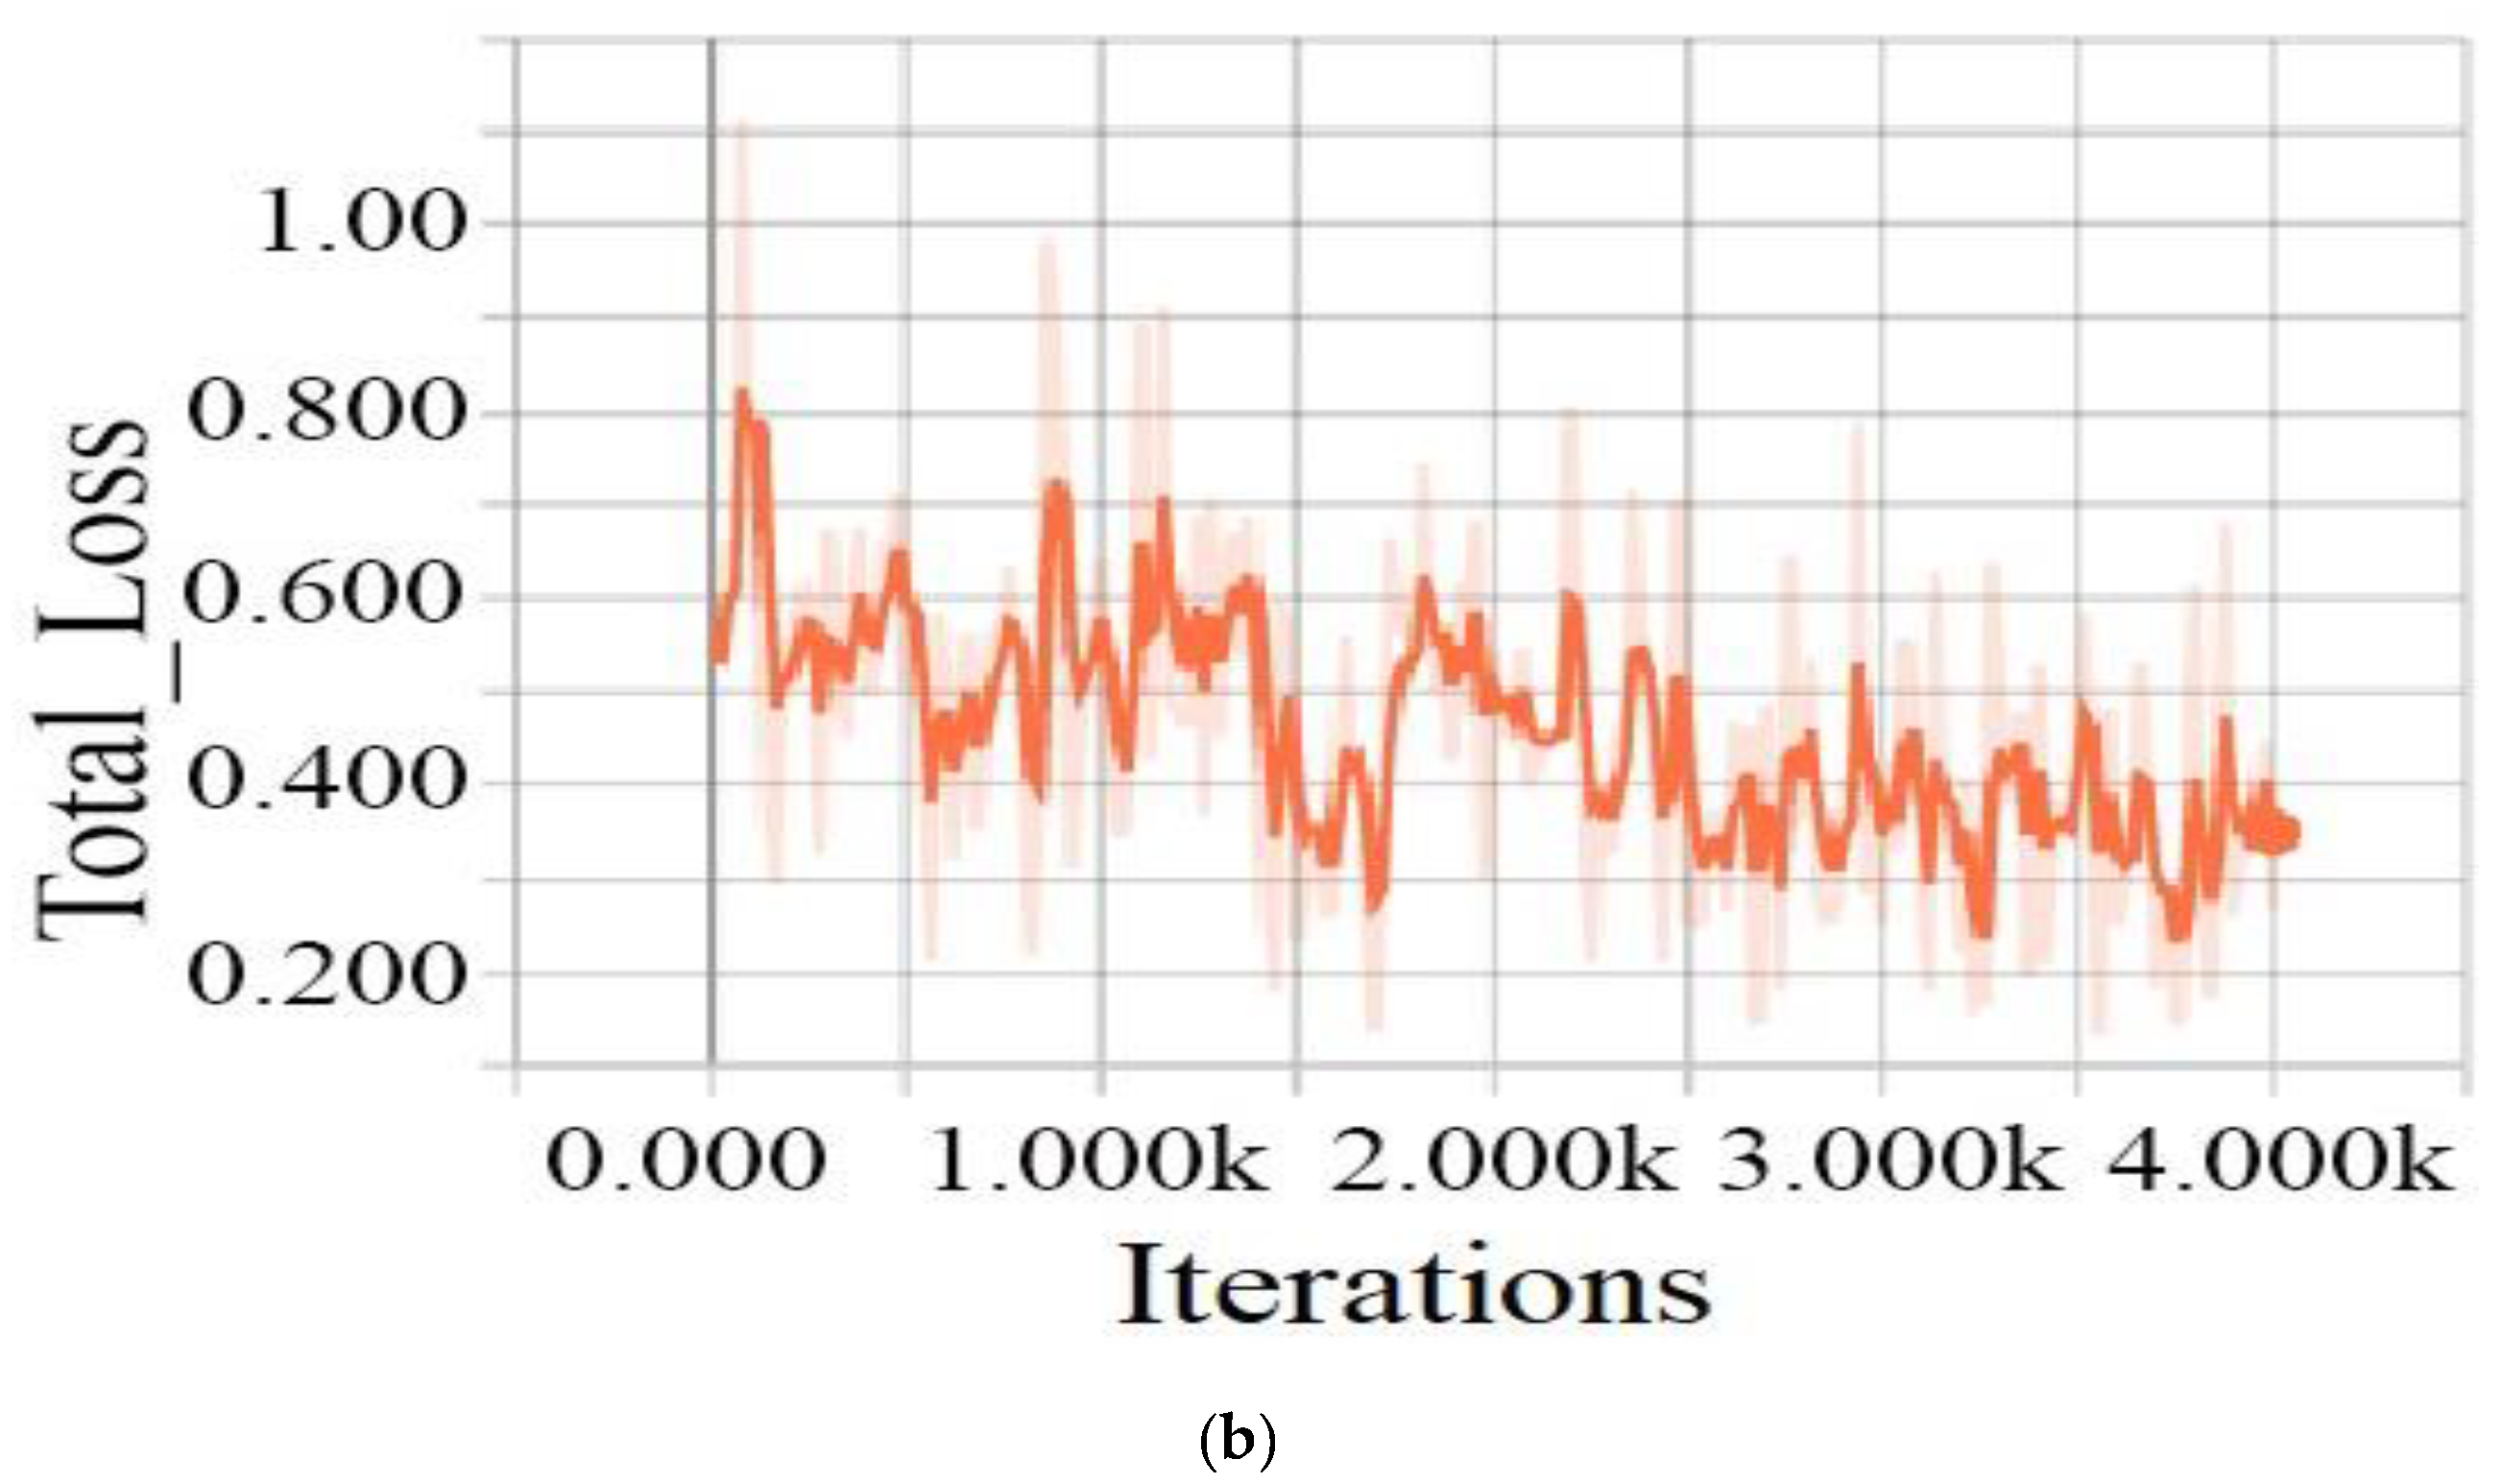
3.1.4. Training Process
4. Experiment
4.1. Dataset and Preprocessing
4.2. Results and Discussion
4.3. Performance Evaluation
4.4. Performance Evaluation Criteria
5. Conclusions
Author Contributions
Funding
Data Availability Statement
Acknowledgments
Conflicts of Interest
References
- Reguant, R.; Brunak, S.; Saha, S. Understanding inherent image features in CNN-based assessment of diabetic retinopathy. Sci. Rep. 2021, 11, 9704. [Google Scholar] [CrossRef]
- Aguirre, F.; Brown, A.; Cho, N.H.; Dahlquist, G.; Dodd, S.; Dunning, T.; Hirst, M.; Hwang, C.; Magliano, D.; Patterson, C.; et al. IDF Diabetes Atlas, 6th ed.; International Diabetes Federation: Basel, Switzerland, 2013. [Google Scholar]
- Ting, D.S.; Tan, K.A.; Phua, V.; Tan, G.S.; Wong, C.W.; Wong, T.Y. Biomarkers of Diabetic Retinopathy. Curr. Diabetes Rep. 2016, 16, 125. [Google Scholar] [CrossRef]
- Bourne, R.R.; Stevens, G.A.; White, R.A.; Smith, J.L.; Flaxman, S.R.; Price, H.; Jonas, J.B.; Keeffe, J.; Leasher, J.; Naidoo, K.; et al. Causes of vision loss worldwide, 1990–2010: A systematic analysis. Lancet Glob. Health 2013, 1, e339–e349. [Google Scholar] [CrossRef]
- Cheung, N.; Mitchell, P.; Wong, T.Y. Diabetic retinopathy. Lancet 2010, 376, 124–136. [Google Scholar] [CrossRef]
- Kroenke, K. Telemedicine screening for eye disease. JAMA 2015, 313, 1666–1667. [Google Scholar] [CrossRef] [PubMed][Green Version]
- DCCT/EDIC Research Group; Nathan, D.M.; Bebu, I.; Hainsworth, D.; Klein, R.; Tamborlane, W.; Lorenzi, G.; Gubitosi-Klug, R.; Lachin, J.M. Frequency of Evidence-Based Screening for Retinopathy in Type 1 Diabetes. N. Engl. J. Med. 2017, 376, 1507–1516. [Google Scholar]
- Chan, J.C.; Malik, V.; Jia, W.; Kadowaki, T.; Yajnik, C.S.; Yoon, K.H.; Hu, F.B. Diabetes in Asia: Epidemiology, risk factors, and pathophysiology. JAMA 2009, 301, 2129–2140. [Google Scholar] [CrossRef] [PubMed]
- Congdon, N.G.; Friedman, D.S.; Lietman, T. Important causes of visual impairment in the world today. JAMA 2003, 290, 2057–2060. [Google Scholar] [CrossRef] [PubMed]
- Marshall, S.M.; Flyvbjerg, A. Prevention and early detection of vascular complications of diabetes. BMJ 2006, 333, 475–480. [Google Scholar] [CrossRef] [PubMed]
- Hutchinson, A.; McIntosh, A.; Peters, J.; O’keeffe, C.; Khunti, K.; Baker, R.; Booth, A. Effectiveness of screening and monitoring tests for diabetic retinopathy—A systematic review. Diabet. Med. 2000, 17, 495–506. [Google Scholar] [CrossRef]
- Taylor, R.; Batey, D. Handbook of Retinal Screening in Diabetes: Diagnosis and Management; John Wiley & Sons: Hoboken, NJ, USA, 2012. [Google Scholar]
- Gulshan, V.; Peng, L.; Coram, M.; Stumpe, M.C.; Wu, D.; Narayanaswamy, A.; Venugopalan, S.; Widner, K.; Madams, T.; Cuadros, J.; et al. Development and validation of a deep learning algorithm for detection of diabetic retinopathy in retinal fundus photographs. JAMA 2016, 316, 2402–2410. [Google Scholar] [CrossRef]
- Ting, D.S.W.; Cheung, C.Y.L.; Lim, G.; Tan, G.S.W.; Quang, N.D.; Gan, A.; Hamzah, H.; Garcia-Franco, R.; San Yeo, I.Y.; Lee, S.Y.; et al. Development and validation of a deep learning system for diabetic retinopathy and related eye diseases using retinal images from multiethnic populations with diabetes. JAMA 2017, 318, 2211–2223. [Google Scholar] [CrossRef]
- Chaudhuri, S.; Chatterjee, S.; Katz, N.; Nelson, M.; Goldbaum, M. Detection of blood vessels in retinal images using two-dimensional matched filters. IEEE Trans. Med. Imaging 1989, 8, 263–269. [Google Scholar] [CrossRef]
- Sinthanayothin, C.; Boyce, J.F.; Cook, H.L.; Williamson, T.H. Automated localisation of the optic disc, fovea, and retinal blood vessels from digital colour fundus images. Br. J. Ophthalmol. 1999, 83, 902–910. [Google Scholar] [CrossRef]
- Baudoin, C.E.; Lay, B.J.; Klein, J.C. Automatic detection of micro aneurysms in diabetic fluorescein angiography. Rev. D’épidémiol. St. Publique 1984, 32, 254–261. [Google Scholar]
- Silberman, N.; Ahrlich, K.; Fergus, R.; Subramanian, L. Case for automated detection of diabetic retinopathy. In Proceedings of the 2010 AAAI Spring Symposium Series, Stanford, CA, USA, 22–24 March 2010; Available online: https://nyuscholars.nyu.edu/en/publications/case-for-automated-detection-of-diabetic-retinopathy (accessed on 24 May 2022).
- Lowe, D.G. Distinctive image features from scale-invariant key points. Int. J. Comput. Vis. 2004, 60, 91–110. [Google Scholar] [CrossRef]
- Lindeberg, T. Scale-invariant feature transform. Scholarpedia 2012, 7, 10491. [Google Scholar] [CrossRef]
- Pires, R.; Jelinek, H.F.; Wainer, J.; Valle, E.; Rocha, A. Advancing bag-of-visual-words representations for lesion classification in retinal images. PLoS ONE 2014, 9, e96814. [Google Scholar] [CrossRef]
- Bay, H.; Tuytelaars, T.; Van Gool, L. Surf: Speeded up robust features. In European Conference on Computer Vision; Springer: Berlin/Heidelberg, Germany, 2006; pp. 404–417. [Google Scholar]
- Séoud, L.; Faucon, T.; Hurtut, T.; Chelbi, J.; Cheriet, F.; Langlois, J.P. Automatic detection of microaneurysms and haemorrhages in fundus images using dynamic shape features. In Proceedings of the 2014 IEEE 11th International Symposium on Biomedical Imaging (ISBI), Beijing, China, 29 April 2014–2 May 2014; pp. 101–104. [Google Scholar]
- Seoud, L.; Chelbi, J.; Cheriet, F. Automatic grading of diabetic retinopathy on a public database. In Ophthalmic Medical Image Analysis International Workshop; University of Iowa: Iowa City, IA, USA, 2015. [Google Scholar]
- Paranjpe, M.J.; Kakatkar, M.N. Automated diabetic retinopathy severity classification using support vector machine. Int. J. Res. Sci. Adv. Technol. 2013, 3, 86–91. [Google Scholar]
- Liaw, A.; Wiener, M. Classification and regression by random Forest. R News 2002, 2, 18–22. [Google Scholar]
- Joachims, T. Making large-scale SVM learning practical. In Technical Report; University of Dortmund: Dortmund, Germany, 1998; Available online: https://www.econstor.eu/handle/10419/77178 (accessed on 4 August 2022).
- Walter, T.; Klein, J.C.; Massin, P.; Erginay, A. A contribution of image processing to the diagnosis of diabetic retinopathy-detection of exudates in color fundus images of the human retina. IEEE Trans. Med. Imaging 2002, 21, 1236–1243. [Google Scholar] [CrossRef] [PubMed]
- Zeiler, M.D.; Fergus, R. Visualizing and understanding convolutional networks. In European Conference on Computer Vision, Proceedings of the 13th European Conference, Zurich, Switzerland, 6–12 September 2014; Springer: Cham, Switzerland, 2014; pp. 818–833. [Google Scholar]
- Wang, Z.; Yang, J. Diabetic retinopathy detection via deep convolutional networks for discriminative localization and visual explanation. In Proceedings of the Workshops at the Thirty-Second AAAI Conference on Artificial Intelligence, New Orleans, LA, USA, 8 February 2017. [Google Scholar]
- Yang, Y.; Li, T.; Li, W.; Wu, H.; Fan, W.; Zhang, W. Lesion detection and grading of diabetic retinopathy via two-stages deep convolutional neural networks. In International Conference on Medical Image Computing and Computer-Assisted Intervention; Springer: Cham, Switzerland, 2017; pp. 533–540. [Google Scholar]
- Wang, S.; Yin, Y.; Cao, G.; Wei, B.; Zheng, Y.; Yang, G. Hierarchical retinal blood vessel segmentation based on feature and ensemble learning. Neurocomputing 2015, 149, 708–717. [Google Scholar] [CrossRef]
- Krizhevsky, A.; Sutskever, I.; Hinton, G.E. Imagenet classification with deep convolutional neural networks. Adv. Neural Inf. Process. Syst. 2012, 25, 1097–1105. [Google Scholar] [CrossRef]
- Szegedy, C.; Ioffe, S.; Vanhoucke, V.; Alemi, A.A. Inception-v4, inception-resnet and the impact of residual connections on learning. In Proceedings of the Thirty-First AAAI Conference on Artificial Intelligence, San Francisco, CA, USA, 4–9 February 2017. [Google Scholar]
- Parkhi, O.M.; Vedaldi, A.; Zisserman, A. Deep Face Recognition. The University of Oxford Is a Collegiate Research University in Oxford, England. 2015. Available online: https://www.robots.ox.ac.uk/~vgg/publications/2015/Parkhi15/parkhi15.pdf (accessed on 15 August 2022).
- Simonyan, K.; Zisserman, A. Very deep convolutional networks for large-scale image recognition. arXiv 2014, arXiv:14091556. [Google Scholar]
- Szegedy, C.; Liu, W.; Jia, Y.; Sermanet, P.; Reed, S.; Anguelov, D.; Erhan, D.; Vanhoucke, V.; Rabinovich, A. Going deeper with convolutions. In Proceedings of the IEEE Conference on Computer Vision and Pattern Recognition, Boston, MA, USA, 7–12 June 2015; pp. 1–9. [Google Scholar]
- He, K.; Zhang, X.; Ren, S.; Sun, J. Deep residual learning for image recognition. In Proceedings of the IEEE Conference on Computer Vision and Pattern Recognition, Las Vegas, NV, USA, 27–30 June 2016; pp. 770–778. [Google Scholar]
- Wan, S.; Liang, Y.; Zhang, Y. Deep convolutional neural networks for diabetic retinopathy detection by image classification. Comput. Electr. Eng. 2018, 72, 274–282. [Google Scholar] [CrossRef]
- Alyoubi, W.L.; Abulkhair, M.F.; Shalash, W.M. Diabetic Retinopathy Fundus Image Classification and Lesions Localization System Using Deep Learning. Sensors 2021, 21, 3704. [Google Scholar] [CrossRef]
- Behera, M.K.; Mishra, R.; Ransingh, A.; Chakravarty, S. Prediction of different stages in Diabetic retinopathy from retinal fundus images using radial basis function based SVM. Indian J. Sci. Technol. 2020, 13, 2030–2040. [Google Scholar] [CrossRef]
- Sankar, M.; Batri, K.; Parvathi, R. Earliest diabetic retinopathy classification using deep convolution neural networks. Int. J. Adv. Eng. Technol. 2016, 10, M9. [Google Scholar]
- Lim, G.; Lee, M.L.; Hsu, W.; Wong, T.Y. Transformed representations for convolutional neural networks in diabetic retinopathy screening. In Proceedings of the Workshops at the Twenty-Eighth AAAI Conference on Artificial Intelligence, Québec City, QC, Canada, 27–28 July 2014. [Google Scholar]
- Pratt, H.; Coenen, F.; Broadbent, D.M.; Harding, S.P.; Zheng, Y. Convolutional neural networks for diabetic retinopathy. Procedia Comput. Sci. 2016, 90, 200–205. [Google Scholar] [CrossRef]
- Kaggle. Diabetic Rentinopathy Detection Challenge. 2016. Available online: http://www.kaggle.com/c/diabetic-retinopathy-detection/data (accessed on 1 June 2022).
- Zhou, B.; Khosla, A.; Lapedriza, A.; Oliva, A.; Torralba, A. Learning deep features for discriminative localization. In Proceedings of the IEEE Conference on Computer Vision and Pattern Recognition, Las Vegas, NV, USA, 27–30 June 2016; pp. 2921–2929. [Google Scholar]
- Lin, M.; Chen, Q.; Yan, S. Network in network. arXiv Prepr. 2013, arXiv:1312.4400. [Google Scholar]
- Lekshmi, S.A.; Rajathi, G.M. Detection of Glaucoma and Diabetic Retinopathy using Image Processing Technique by Raspberry pi. Indian J. Sci. Technol. 2019, 12, 29. [Google Scholar] [CrossRef]
- Bindu, C.H.; Sravanthi, G.S. Retinopathy Detection of EYE Images in Diabetic Patients. Indian J. Sci. Technol. 2019, 12, 3. [Google Scholar] [CrossRef]
- Sarki, R.; Ahmed, K.; Wang, H.; Zhang, Y.; Ma, J.; Wang, K. Image Preprocessing in Classification and Identification of Diabetic Eye Diseases. Data Sci. Eng. 2021, 6, 455–471. [Google Scholar] [CrossRef]
- Henry, A.G.P.; Jude, A. Convolutional neural-network-based classification of retinal images with different combinations of filtering techniques. Open Comput. Sci. 2021, 11, 480–490. [Google Scholar] [CrossRef]
- Frid-Adar, M.; Klang, E.; Amitai, M.; Goldberger, J.; Greenspan, H. Synthetic data augmentation using GAN for improved liver lesion classification. In Proceedings of the 2018 IEEE 15th International Symposium on Biomedical Imaging, Washington, DC, USA, 4–7 April 2018; pp. 289–293. [Google Scholar]
- University of Erlangen-Nuremberg. High Resolution Fundus (HRF) Image Database; University of Erlangen-Nuremberg: Erlangen, Germany, 2014; Available online: http://www5.cs.fau.de/research/data/fundus-images/ (accessed on 2 May 2021).
- Goldbaum, M. Structured Analysis of the Retina. 2013. Available online: http://www.ces.clemson.edu/ahoover/stare/ (accessed on 24 May 2021).
- DIARETDB0 Database. Medical Image Understanding and Analysis. March 2014. Available online: http://www.it.lut.fi/project/imageret/diaretdb (accessed on 24 March 2022).
- Decenciere, E.; Zhang, X.; Cazuguel, G.; Lay, B.; Cochener, B.; Trone, C. Feedback on a publicly distributed image database: The MESSIDOR database. Image Anal. Stereol. 2014, 33, 231–234. [Google Scholar] [CrossRef]
- Li, T.; Gao, Y.; Wang, K.; Guo, S.; Liu, H.; Kang, H. Diagnostic assessment of deep learning algorithms for diabetic retinopathy screening. Inf. Sci. 2019, 501, 511–522. [Google Scholar] [CrossRef]
- Liu, Y.P.; Li, Z.; Xu, C.; Li, J.; Liang, R. Referable diabetic retinopathy identification from eye fundus images with weighted path for convolutional neural network. Artif. Intell. Med. 2019, 99, 101694. [Google Scholar] [CrossRef]
- Jiang, H.; Yang, K.; Gao, M.; Zhang, D.; Ma, H.; Qian, W. An interpretable ensemble deep learning model for diabetic retinopathy disease classification. In Proceedings of the 2019 41st Annual International Conference of the IEEE Engineering in Medicine and Biology Society (EMBC), Berlin, Germany, 23–27 July 2019; pp. 2045–2048. [Google Scholar]
- Das, S.; Kharbanda, K.; Suchetha, M.; Raman, R.; Dhas, E. Deep learning architecture based on segmented fundus image features for classification of diabetic retinopathy. Biomed. Signal Processing Control. 2021, 68, 102600. [Google Scholar] [CrossRef]
- Wang, X.; Lu, Y.; Wang, Y.; Chen, W.B. Diabetic retinopathy stage classification using convolutional neural networks. In Proceedings of the 2018 IEEE International Conference on Information Reuse and Integration (IRI), Salt Lake City, UT, USA, 6–9 July 2018; pp. 465–471. [Google Scholar]
- Khan, S.H.; Abbas, Z.; Rizvi, S.D. Classification of diabetic retinopathy images based on customised CNN architecture. In Proceedings of the 2019 Amity International Conference on Artificial Intelligence (AICAI), Dubai, United Arab Emirates, 4–6 February 2019; pp. 244–248. [Google Scholar]
- Shanthi, T.; Sabeenian, R.S. Modified Alexnet architecture for classification of diabetic retinopathy images. Comput. Electr. Eng. 2019, 76, 56–64. [Google Scholar] [CrossRef]


| Class Name | Degree of DR | Number of Labels | For Training | For Testing |
|---|---|---|---|---|
| Class 0 | Nonsymptoms | 1000 | 800 | 200 |
| Class 1 | Symptoms | 607 | 485 | 122 |
| Description | Output Shape |
|---|---|
| weight_decay | 0.00001 |
| num_classes | 2 |
| batch_size | 8 |
| val_batch_size | 32 |
| image_height | 300 |
| image_width | 300 |
| image_channels | 3 |
| num_iters | 4000 |
| lr | [0.0001, 0.001] |
| momentum | 0.9 |
| batch_norm_scale | True |
| batch_norm_epsilon | 1 × 10⁻⁵ |
| batch_norm_decay | 0.997 |
| Class | All | Training Set | Tasting Set | |
|---|---|---|---|---|
| Before Augmentation | After Augmentation | |||
| No symptoms | 1000 | 800 | 1982 | 200 |
| Symptoms | 607 | 485 | 1204 | 122 |
| Model | Training Accuracy (%) | Training Loss (%) | Testing Accuracy (%) |
|---|---|---|---|
| ResNet-101 | 80.88 | 40.1 | 79.76 |
| ResNet-50 | 79.7 | 37.6 | 71.8 |
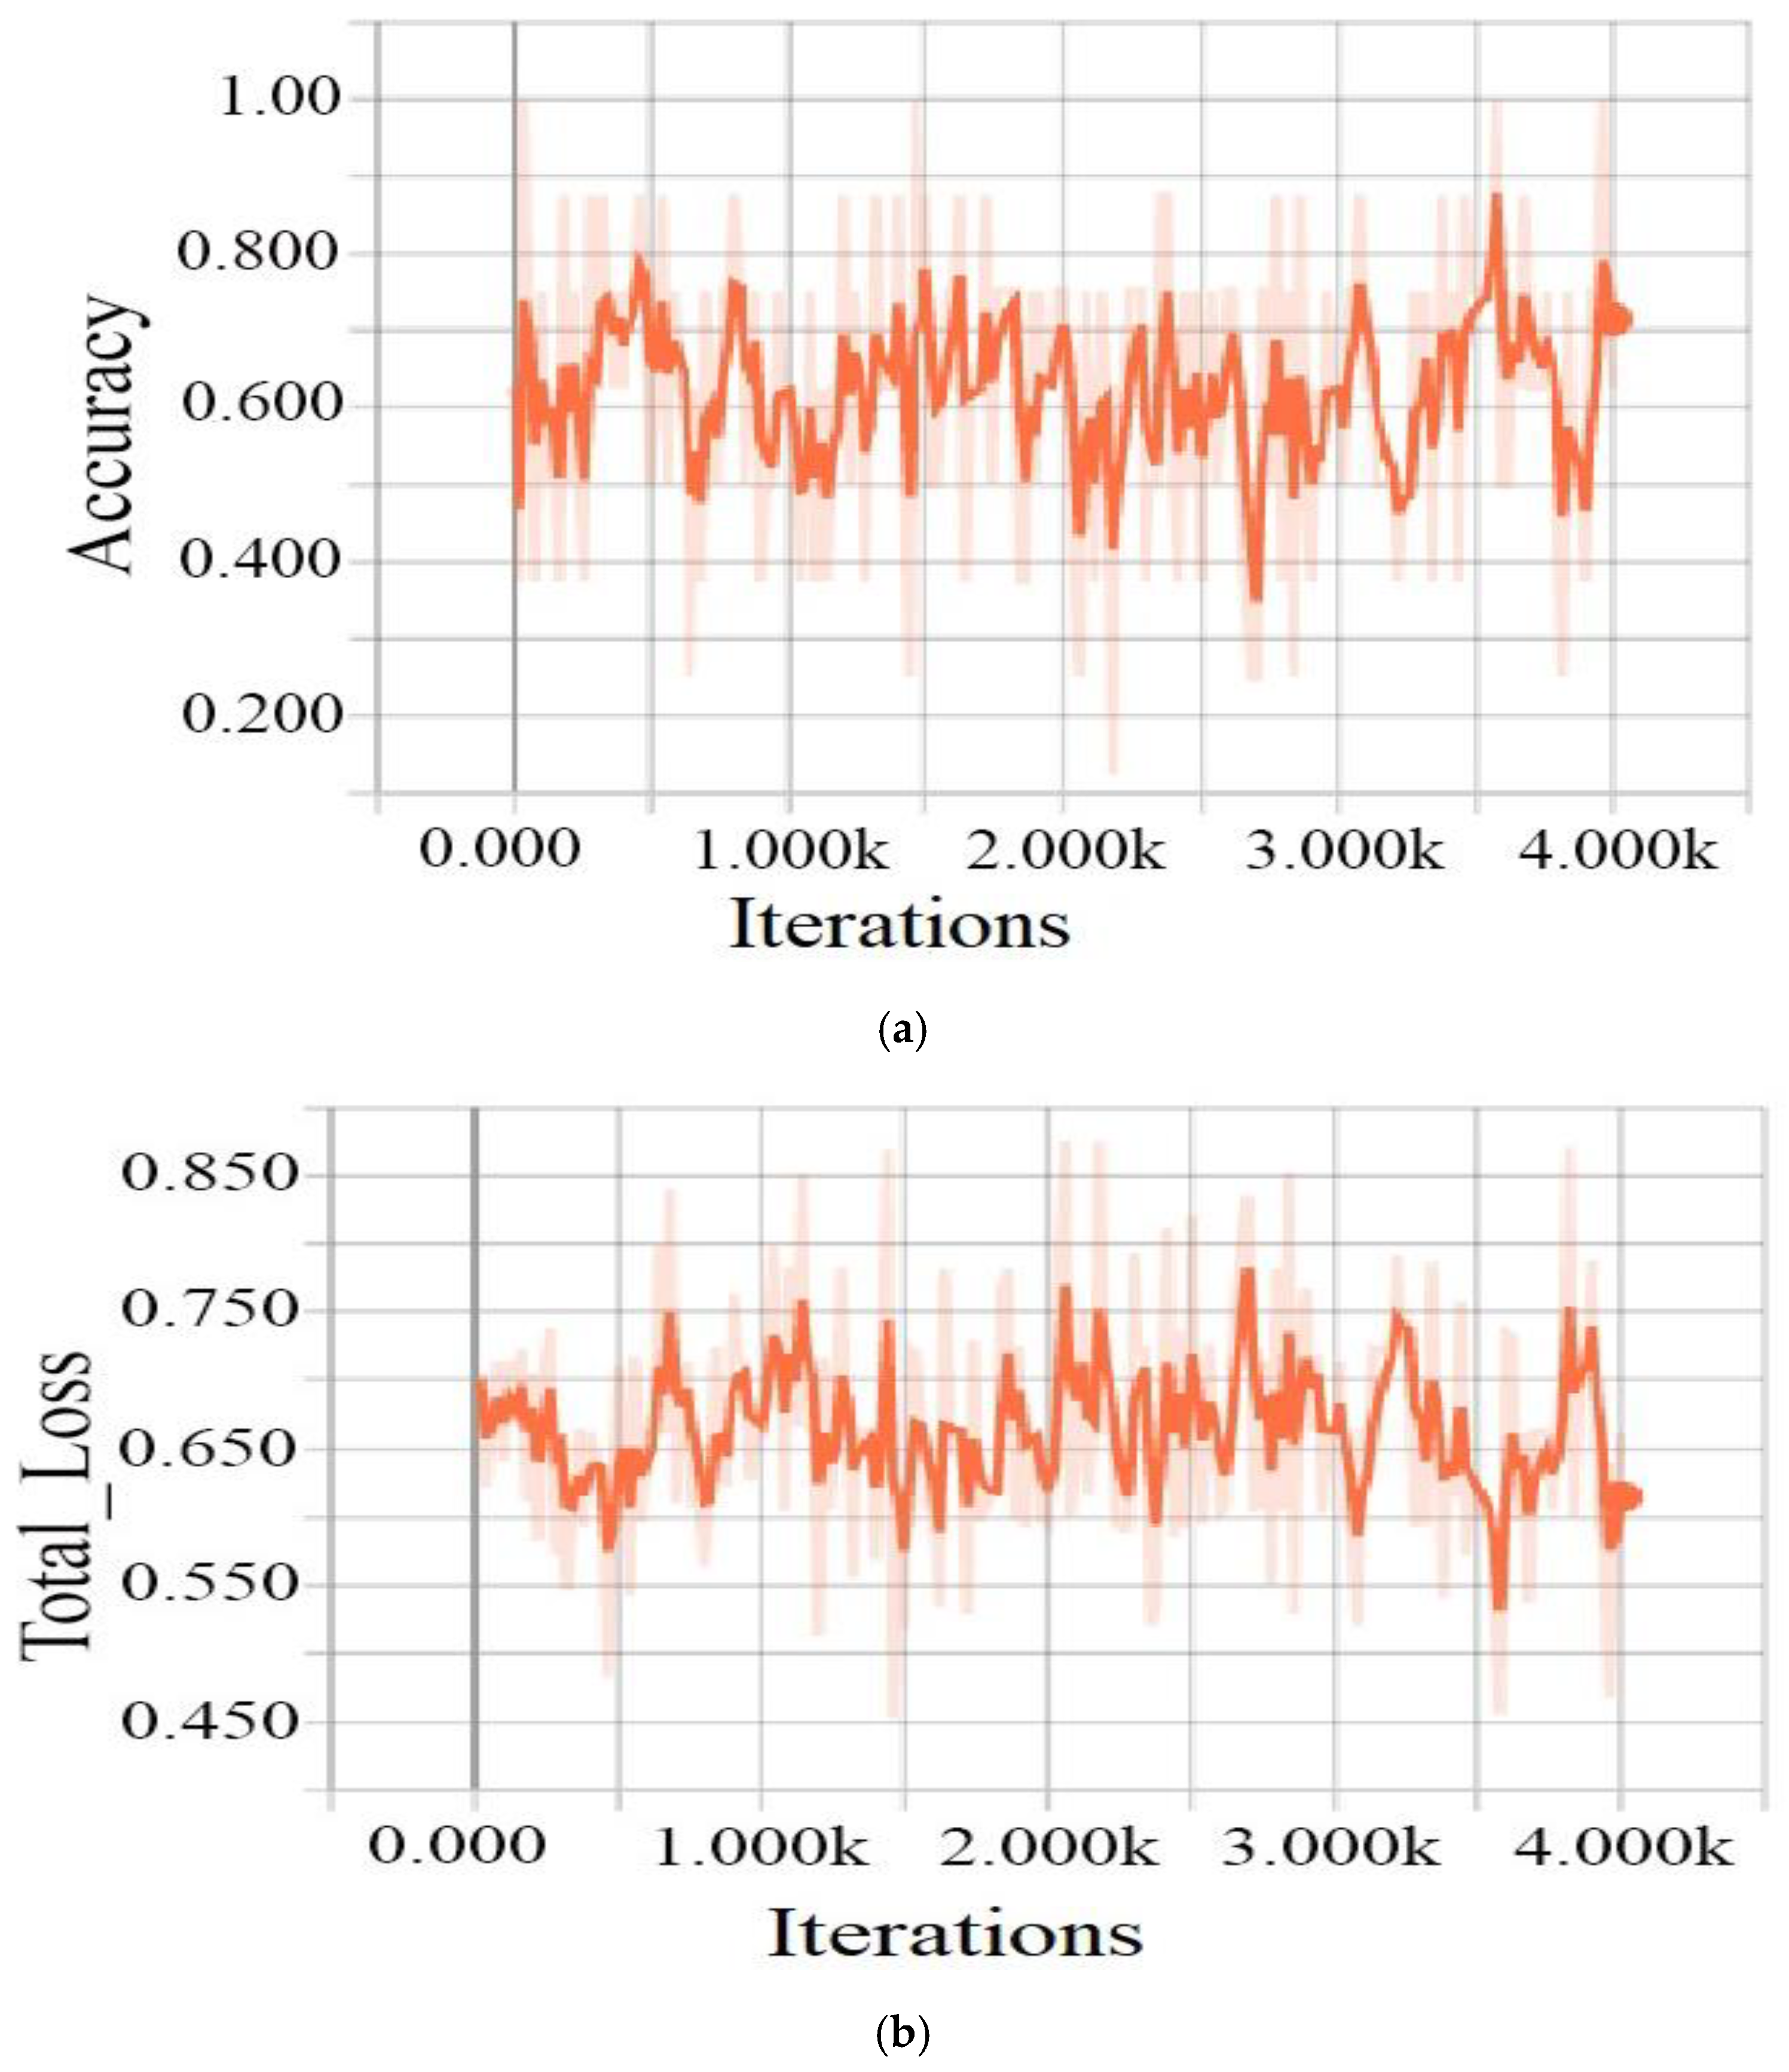
| VggNet-16 | 64.4 | 67.32 | 62.11 |
| Model | Training Accuracy (%) | Training Loss (%) | Testing Accuracy (%) |
|---|---|---|---|
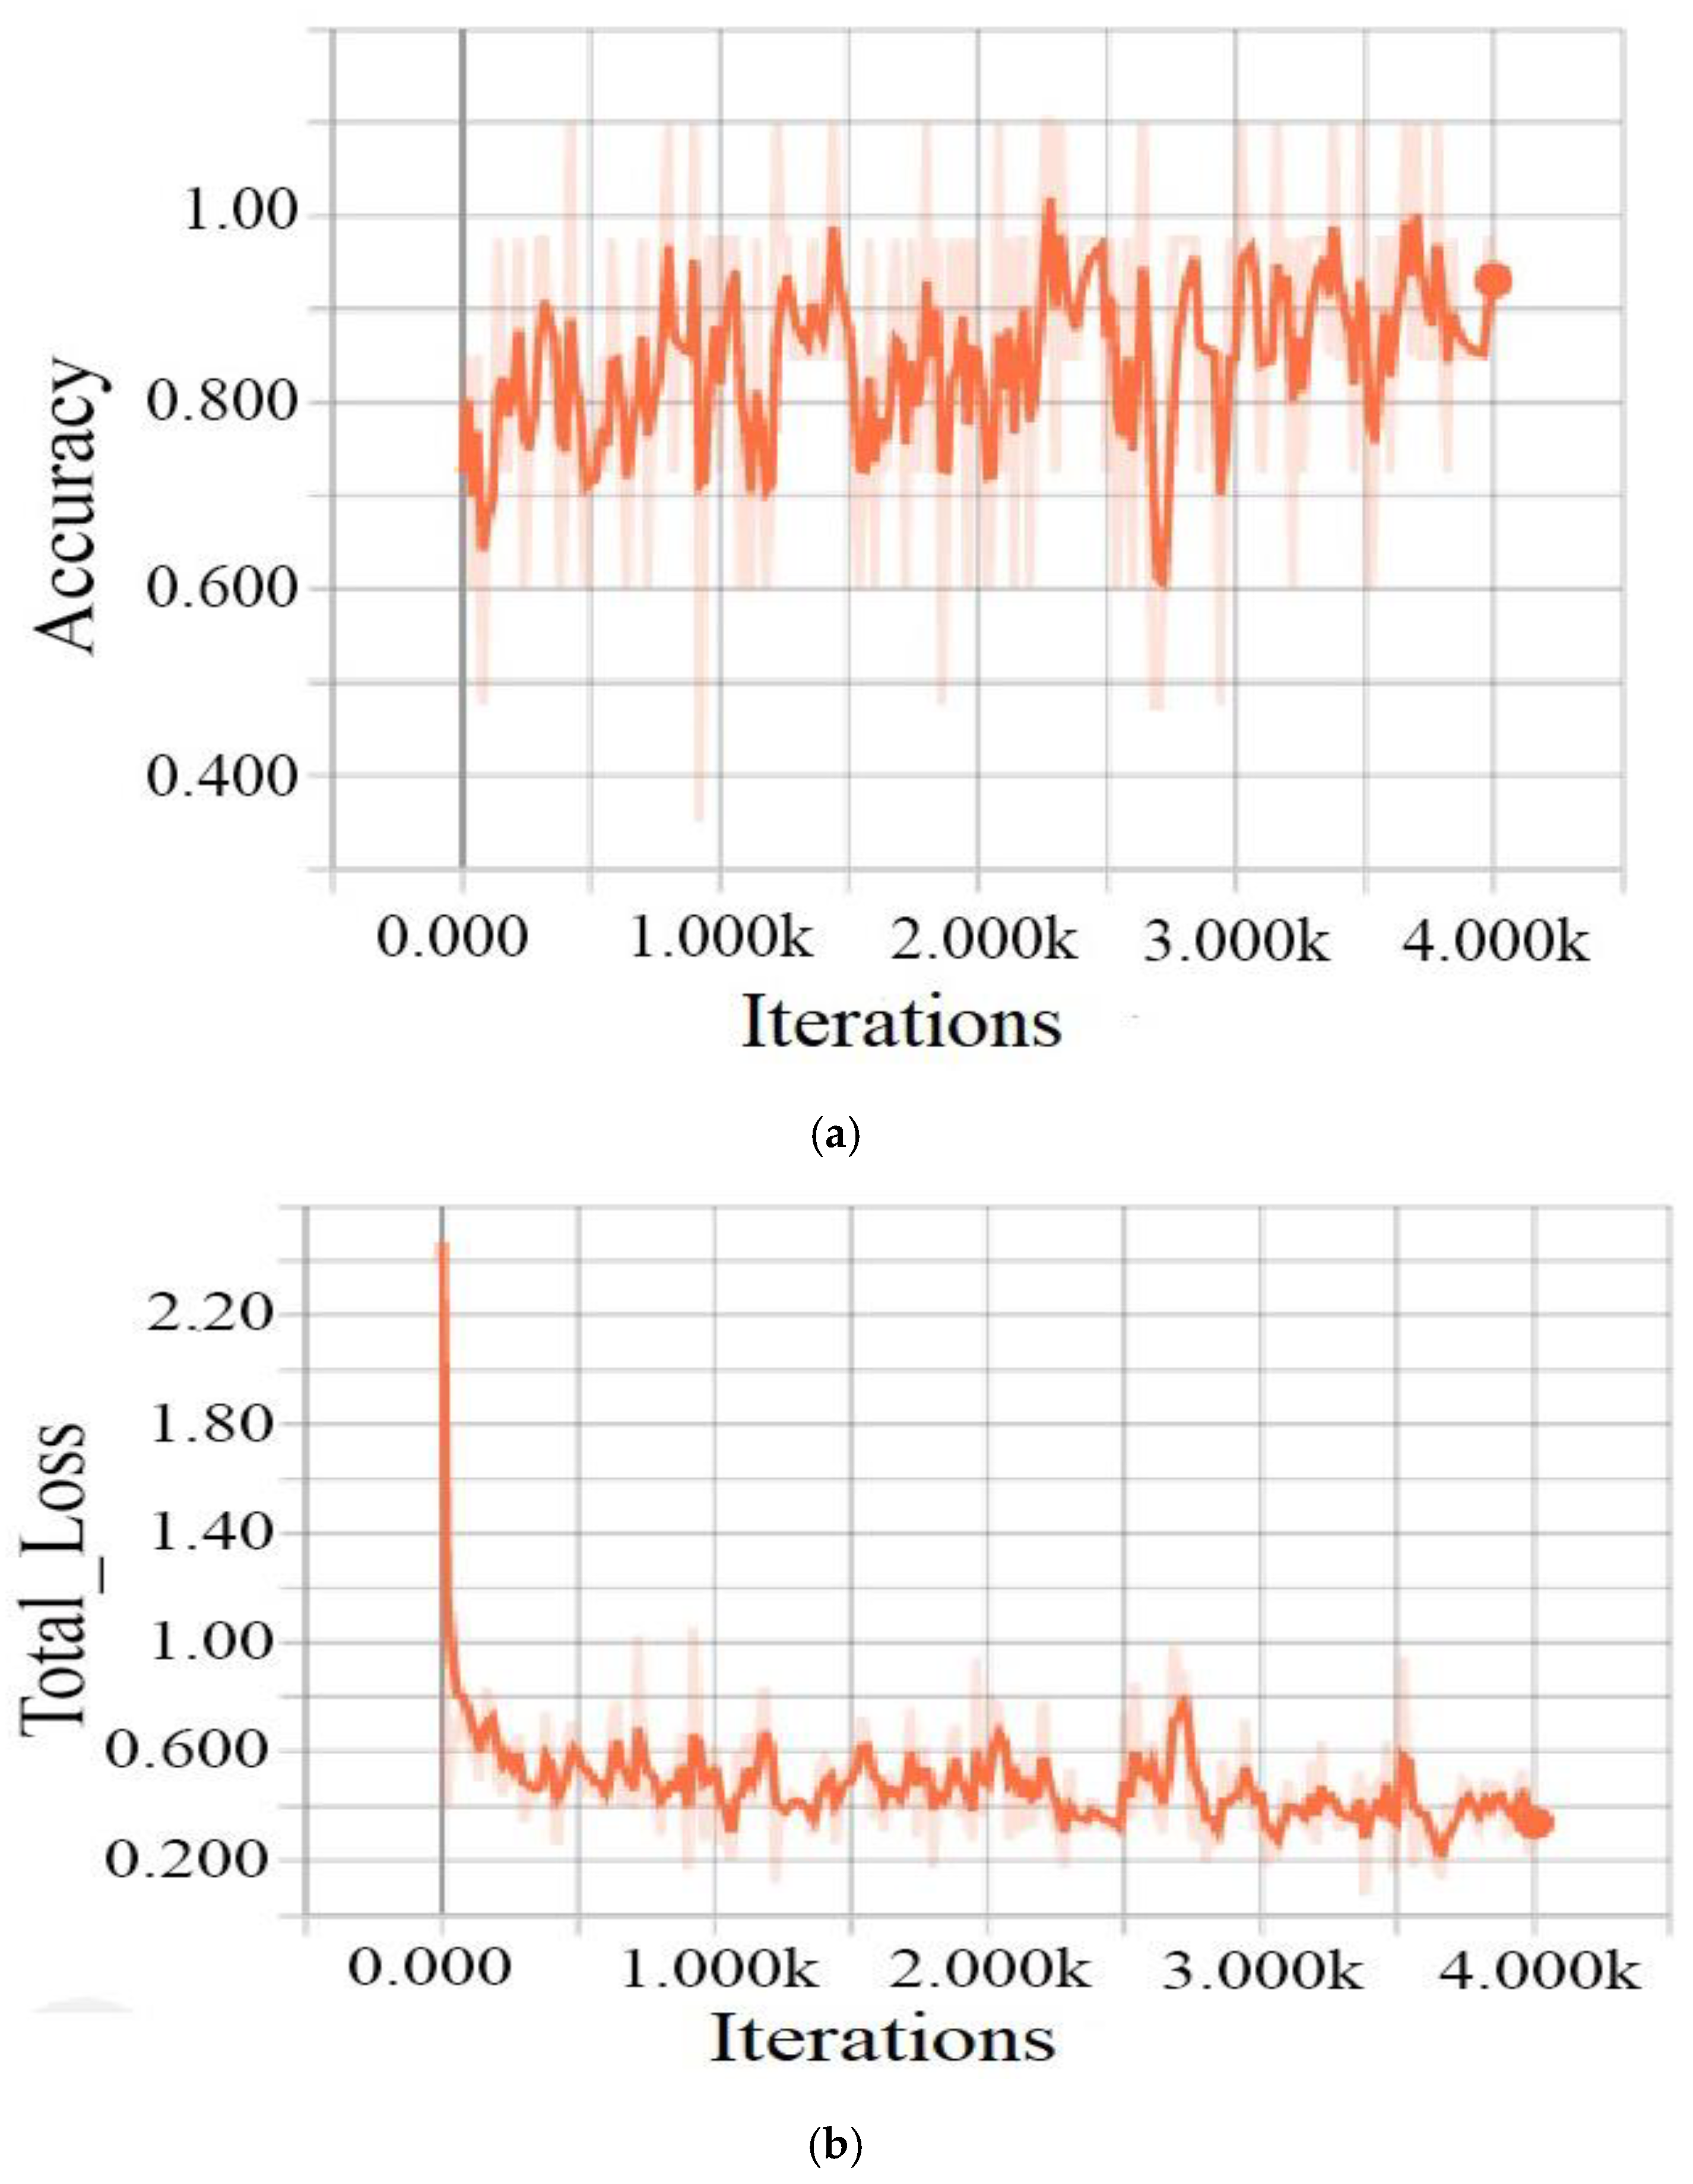
| ResNet-101 | 98.88 | 34.99 | 98.82 |
| ResNet-50 | 93 | 34 | 91.5 |
| VggNet-16 | 71.39 | 61.48 | 64.11 |
| Dataset | Number of Images | No DR | DR |
|---|---|---|---|
| XHO datasets | 1607 | 1000 | 607 |
| HRF datasets | 30 | 15 | 15 |
| STARE datasets | 20 | 12 | 8 |
| DIARETDB0 datasets | 130 | 20 | 110 |
| MESSIDOR | 1200 | 851 | 349 |
| Total | 2987 | 1898 | 1089 |
| Dataset | Test Images | Correctly Detected | Accuracy (%) | Sensitivity (%) | Specificity (%) | F1 Score (%) | AUC (%) |
|---|---|---|---|---|---|---|---|
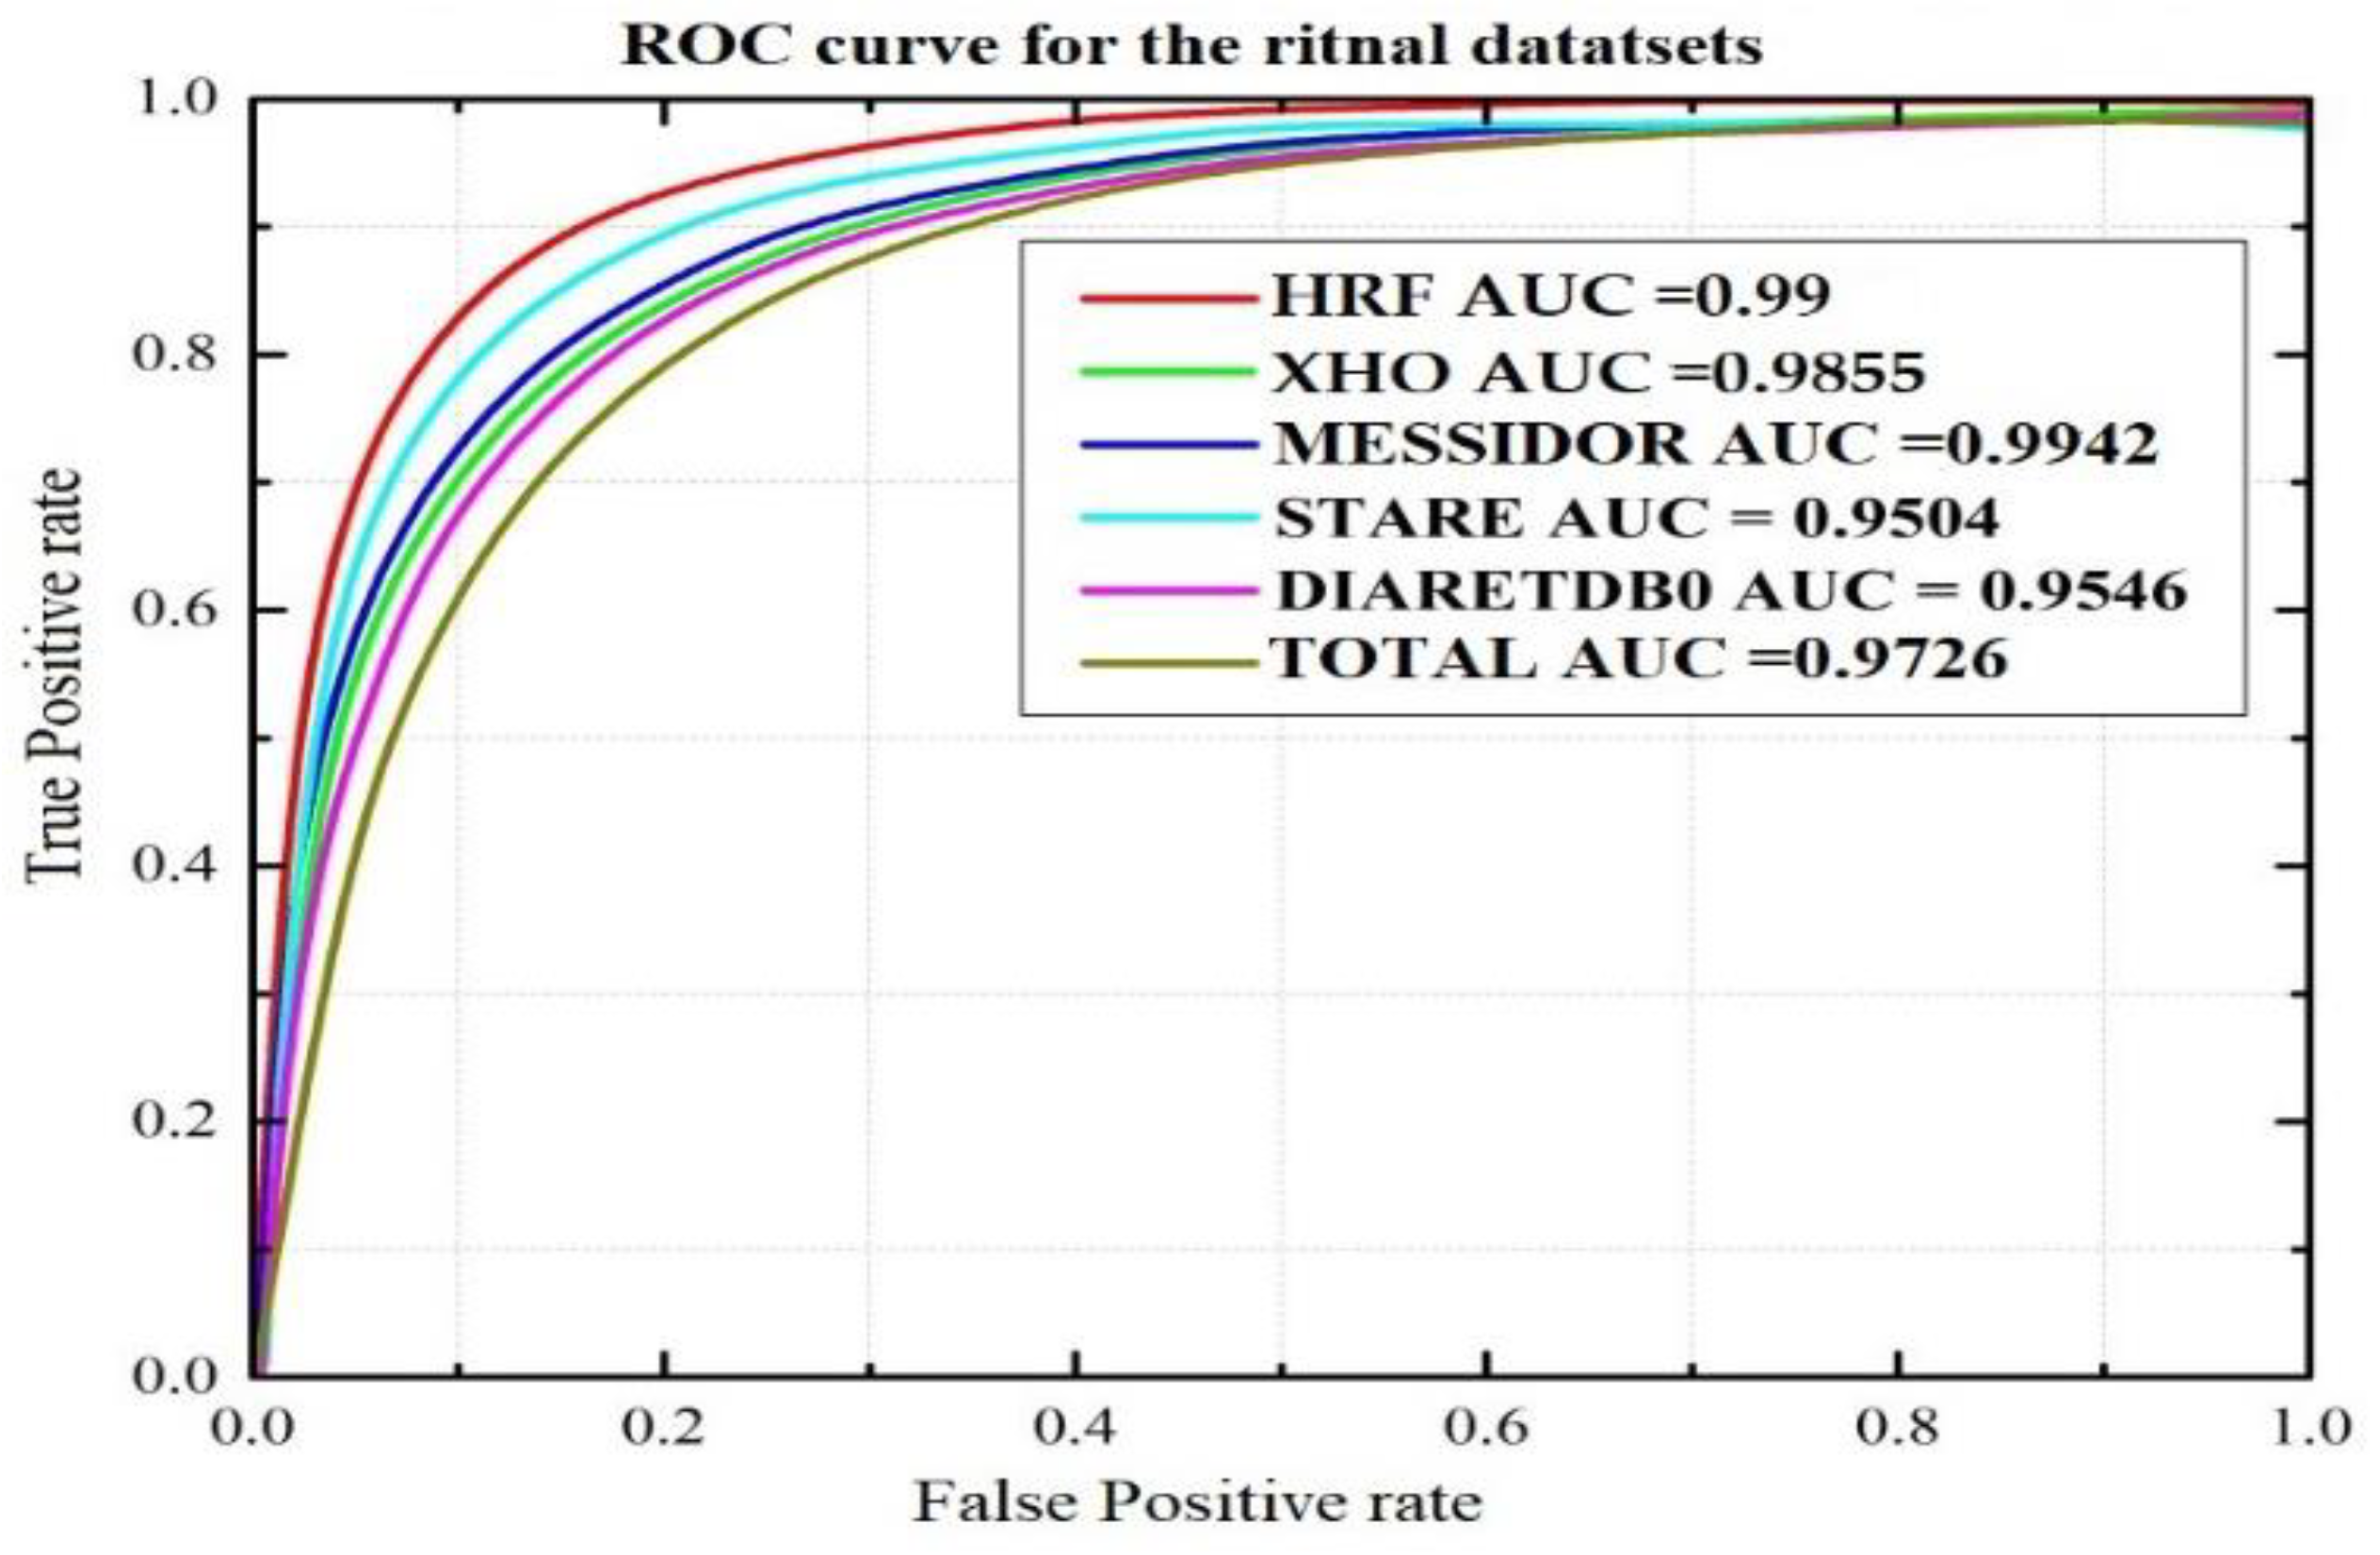
| XHO datasets | 200 | 196 | 98 | 97.14 | 97.65 | 97.36 | 98.55 |
| HRF datasets | 30 | 30 | 100 | 99.98 | 99.98 | 99.98 | 99.99 |
| STARE datasets | 20 | 19 | 95 | 94.96 | 95.11 | 95.03 | 95.04 |
| DIARETDB0 datasets | 110 | 105 | 95.45 | 95.39 | 99.38 | 95.45 | 95.46 |
| MESSIDOR | 349 | 347 | 99.42 | 99.45 | 99.38 | 99.41 | 99.42 |
| Total | 360 | 349 | 97 | 96.87 | 98.03 | 96.95 | 97.26 |
| Evaluated Parameter | [57] | [58] | [59] | Proposed Method | [60] | [39] | [61] | [62] | [63] | |
|---|---|---|---|---|---|---|---|---|---|---|
| Number of Classes | 2 | 5 | 4 | 5 | ||||||
| Detect Lesion | No | No | No | Yes | ||||||
| Dataset | private dataset | Kaggle | Messidor | DDR | ||||||
| Performance Measure | ACC | 94.23% | 88.21% | 98.7% | 98.88% | 63.23% | 95.6% | 98.15% | 96.35% | 82.84% |
| AUC | 0.9823 | 0.946 | - | 98.55% | - | 0.978 | - | - | - | |
Publisher’s Note: MDPI stays neutral with regard to jurisdictional claims in published maps and institutional affiliations. |
© 2022 by the authors. Licensee MDPI, Basel, Switzerland. This article is an open access article distributed under the terms and conditions of the Creative Commons Attribution (CC BY) license (https://creativecommons.org/licenses/by/4.0/).
Share and Cite
Asia, A.-O.; Zhu, C.-Z.; Althubiti, S.A.; Al-Alimi, D.; Xiao, Y.-L.; Ouyang, P.-B.; Al-Qaness, M.A.A. Detection of Diabetic Retinopathy in Retinal Fundus Images Using CNN Classification Models. Electronics 2022, 11, 2740. https://doi.org/10.3390/electronics11172740
Asia A-O, Zhu C-Z, Althubiti SA, Al-Alimi D, Xiao Y-L, Ouyang P-B, Al-Qaness MAA. Detection of Diabetic Retinopathy in Retinal Fundus Images Using CNN Classification Models. Electronics. 2022; 11(17):2740. https://doi.org/10.3390/electronics11172740
Chicago/Turabian StyleAsia, Al-Omaisi, Cheng-Zhang Zhu, Sara A. Althubiti, Dalal Al-Alimi, Ya-Long Xiao, Ping-Bo Ouyang, and Mohammed A. A. Al-Qaness. 2022. "Detection of Diabetic Retinopathy in Retinal Fundus Images Using CNN Classification Models" Electronics 11, no. 17: 2740. https://doi.org/10.3390/electronics11172740
APA StyleAsia, A.-O., Zhu, C.-Z., Althubiti, S. A., Al-Alimi, D., Xiao, Y.-L., Ouyang, P.-B., & Al-Qaness, M. A. A. (2022). Detection of Diabetic Retinopathy in Retinal Fundus Images Using CNN Classification Models. Electronics, 11(17), 2740. https://doi.org/10.3390/electronics11172740