Article

Development of an Electrooculogram (EOG) and Surface Electromyogram (sEMG)-Based Human Computer Interface (HCI) Using a Bone Conduction Headphone Integrated Bio-Signal Acquisition System

1
Department of Artificial Intelligence, Korea University, Seoul 02841, Korea
2
School of Information, Communications and Electronics Engineering, Catholic University of Korea, Bucheon 14662, Korea
*
Author to whom correspondence should be addressed.
Electronics 2022, 11(16), 2561; https://doi.org/10.3390/electronics11162561
Submission received: 28 July 2022 / Revised: 11 August 2022 / Accepted: 13 August 2022 / Published: 16 August 2022
(This article belongs to the Special Issue Application Research Using AI, IoT, HCI, and Big Data Technologies)

Abstract

:
Human–computer interface (HCI) methods based on the electrooculogram (EOG) signals generated from eye movement have been continuously studied because they can transmit the commands to a computer or machine without using both arms. However, usability and appearance are the big obstacles to practical applications since conventional EOG-based HCI methods require skin electrodes outside the eye near the lateral and medial canthus. To solve these problems, in this paper, we report development of an HCI method that can simultaneously acquire EOG and surface-electromyogram (sEMG) signals through electrodes integrated into bone conduction headphones and transmit the commands through the horizontal eye movements and various biting movements. The developed system can classify the position of the eyes by dividing the 80-degree range (from −40 degrees to the left to +40 degrees to the right) into 20-degree sections and can also recognize the three biting movements based on the bio-signals obtained from the three electrodes, so a total of 11 commands can be delivered to a computer or machine. The experimental results showed the interface has accuracy of 92.04% and 96.10% for EOG signal-based commands and sEMG signal-based commands, respectively. As for the results of virtual keyboard interface application, the accuracy was 97.19%, the precision was 90.51%, and the typing speed was 5.75–18.97 letters/min. The proposed interface system can be applied to various HCI and HMI fields as well as virtual keyboard applications.

1. Introduction

Recently, various types of electronic devices including computers, robots, mobile devices, and home appliances have been used and their interfaces are continuously evolving to enhance the usability of electronic devices. Human–computer interfaces (HCIs) and human–machine interfaces (HMIs) are technology focused on the interaction between user and computer or machine, and to enhance the usability of a HCI or HMI, it is required to understand the purpose of the users and design an appropriate interface method accordingly. Among the various bio-signals, electrooculograms (EOGs), electromyograms (EMGs), and electroencephalograms (EEGs) are widely used as input signals for new interface methods. In particular, EEG-based brain–computer interface (BCI) and brain–machine interface (BMI)-related research has been actively conducted, but the scope of its practical application is very limited due to the limitations of the measuring environment, inconvenience of electrode attachment, and the cost of equipment. The EOG-based interface methods using eye movement and blinking have been continuously studied because they can be used for selecting targets and determining the direction of movement without using one’s hands. Postelnicu et al. [1] developed an EOG-based interface by assigning the eye saccades, eye blinks or winks to six low-level commands (left, hard left, right, hard right, forward, and backward) using band pass filtering and fuzzy logic rules. They showed that this interface method can be used to control visual navigation interfaces in games. Lopez et al. [2] also developed an EOG-based interface to control computer game using wireless EOG signal acquisition hardware, a wavelet transform method for denoising, and the AdaBoost machine learning algorithm for signal classification of the four basic eye movement (up, down, right, left) and blinks. However, similar to conventional EOG-based HCI, developed systems discussed above require the attachment of four electrodes and one additional reference electrode around the eyes, so are not convenient to use in practical applications. To maximize usability, Ang et al. [3] developed a commercial wearable device (the NeuroSky MindWave headset), based on HCI, that can recognize EOG from a double-blink action and applied it for cursor control. This method has the advantage of increasing the user’s convenience by using a single channel dry electrode sensor, but can recognize only a double-blink action. Barbara et al. [4] compared a commercial wearable EOG acquisition system called “JINS MEME EOG glasses” that can acquire EOG signals in the form of wearable glasses with a conventional standard EOG acquisition system. According to the performance evaluation through the virtual keyboard interface, their system was very simple compared to the conventional gel-based wired acquisition system, although the writing speed showed only a small difference of 2 characters/min. However, the electrode located on the nose pad of the glasses has a limit in forming a reliable contact with the user’s forehead, and the value of the contact resistance may vary depending on the position of the glasses. In addition, since this method distinguishes eye blinking and eye movement using only the amplitude of the EOG signal, it may have a performance limitation due to the noise generated by the movement of glasses. Similar to our proposed method, there have been several research efforts to acquire EOG signals around the ear. Manabe et al. [5] implemented an eye gesture interface using conductive rubber electrodes for an in-ear earphone. They found through experiments that a conductive rubber electrode with mixed Ag filler was the most appropriate electrode material for the in-ear earphone-based EOG signal acquisition method. Although they showed the possibility of its application to daily life through preliminary experiments, they said that it was not suitable for daily life use due to limitations such as the “no input intention” problem. Hládek et al. [6] conducted research on classifying the eye gaze angle using the EOG signal obtained using an in-ear conductive ear module. They said that there was an in-ear EOG signal quality problem due to errors in the detection and integration steps, and further improvement was needed. However, their system has advantages in terms of weight and portability, so it has great potential for practical application. However, this method is also an in-ear type, and in this case, it is easy to receive interference from the EEG signal. In addition, since the signal is always obtained in a state in which the ear hole is closed with the sensor module, it may cause inconvenience to the user. To compare the performance of a bio-signal-based HCI system, cursor control interface and virtual keyboard applications are very common examples. They are useful for quantitatively comparing the performance of the developed system through performance metrics. In addition, it is possible to confirm how many classes (or types) of input signals can be used for selection of different commands. Research results on EOG-based virtual keyboards have shown various approaches including detection of saccadic eye movement (right and left), classification of intentional eye movement in four directions (up, down, right, and left), or combination of eyeball movement and eye-blinking. Among them, the most common method is to classify the difference in EOG signals according to eye movement in four directions (up, down, left, and right) using five electrodes, as in Keskinoglulu’s study [7]. Yamagishi et al. [8] developed an EOG-based interface that can classify in total eight kinds of eye movement (up, down, right, left, up right, up left, down right, and down left) and one selected operation using voluntary eye blinks by logical combination of signals from horizontal and vertical EOG signals. Compared to a simple horizontal eye movement (left and right)-based interface, combination of a horizontal and vertical EOG signals-based interface can support more input control. However, because EOG from vertical eye movement is affected by blinks or eyelid closure, it will inevitably show lower accuracy and precision in accurate quantitative analysis [9]. In some studies, more advanced interface methods were developed by recognizing the angle as well as the movement of direction of eye-gaze. Some studies provide a more useful interface method by recognizing the movement direction of the eyeball as well as the movement angle. Dhillon et al. [10] modeled an angular range of ±40° with 10° resolution and applied it to an EOG-based virtual keyboard. As shown in the results of previous studies, the performance of the EOG-based HCI method has steadily improved and the range of its application is expanding. However, usability or use convenience is a big obstacle to practical applications since conventional EOG-based HCI methods require multiple skin electrodes outside the eye, near the lateral and medial canthus.
To overcome the problems discussed above, for this paper, we developed a bio-signals acquisition method that enhances user convenience by attaching electrodes to bone conduction headphones. In other words, this made it possible to acquire bio-signals from the ear region where the bone conduction earphone is located rather than around the eyes where the conventional EOG acquisition electrodes are located. Since the bone conduction headphones deliver sound directly to the inner ear, the developed system leaves one’s ears open during the EOG signal acquisition and it made for a much more comfortable measurement environment for users. The developed system also has advantages from an aesthetic point of view because the electrodes are not exposed on the face. Despite these advantages, as the location of electrodes is moved farther away from the eyes, the amplitude of the EOG signals decreases and is greatly affected by noise. Therefore, in order to extract the desired features from the EOG signals captured from the electrodes where the bone conduction headphones are located, it is necessary to design the amplifiers with an appropriate amplitude and filters for noise removal. For this, a signal amplifier with a hardware-based analog filter and software-based digital filter were designed and the features of EOG signals were extracted using the variance and deviation-based feature extraction method. Based on signal processing and a feature extraction process, the eye movements were classified into a level of 20° within the range of ±40°. In addition to EOG signals, the number of commands used in the interface was increased by acquiring and classifying the surface EMG (sEMG) signals generated from the bite action without adding extra electrodes. For performance evaluation of the proposed interface system and comparison with related works, it was applied to the virtual keyboard interface on a PC. To evaluate the EOG signal and EMG signal-based interface performance, the command recognition accuracy was analyzed, respectively. A confusion matrix was calculated to examine the ratio of errors by error type and to calculate accuracy and precision. In addition, the number of commands, typing speed, and accuracy were compared with existing studies.

2. Materials and Methods

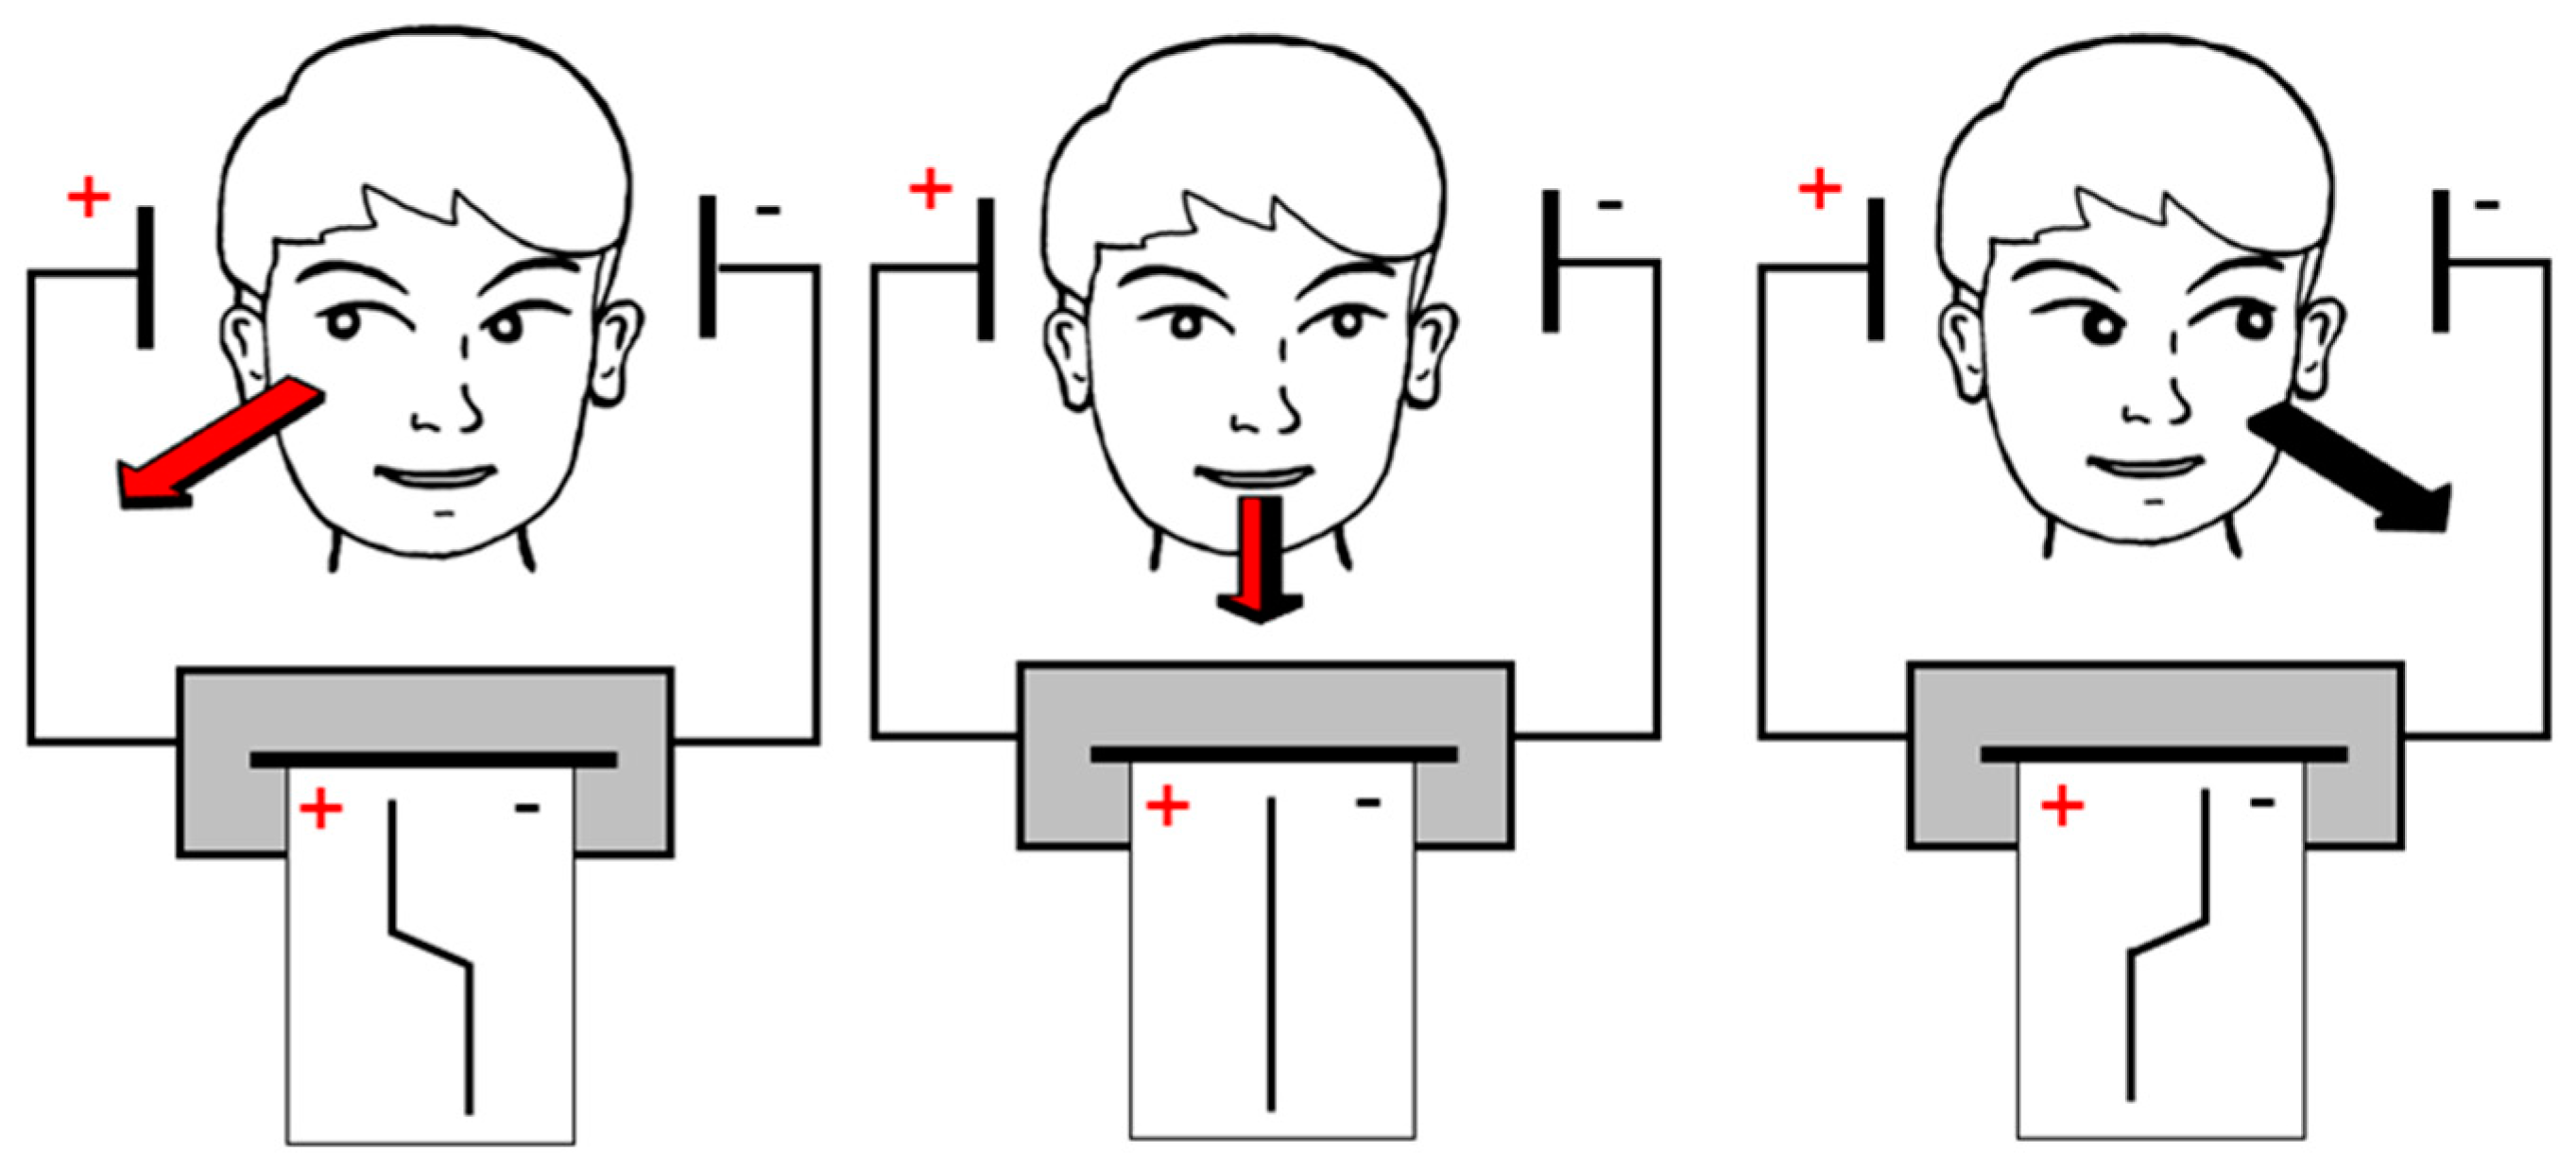
2.1. EOG and EMG Signals

In this study, two bio-signals, EOG and EMG, were used as inputs for HCI. A constant potential exists between the cornea and the retina due to the difference in metabolic activity. This potential is maintained when the gaze is fixed, and when the eyeball is moved, the potential changes, as shown in Figure 1.
This corneo–retinal potential difference ranges between 0.1 and 3.5 mV and the frequency range is 0.1–20 Hz [11]. The magnitude of the potential difference generated by the gaze movement is linearly proportional up to ±30°, and it is known that the magnitude is about 15 to 20 mV per 1° of eye rotation [12].
EMG signals are generated by skeletal–muscle activity and typically have an amplitudes in the range of 50 μV to 30 mV [13]. Compared to the conventional needle EMG (nEMG) used for clinical diagnosis purposes, surface electromyogram (sEMG) signals are detected over the skin surface during muscle contraction, and can be measured in a non-invasive manner [14]. In this study, the biting motion was additionally used as an interface input to increase the number of operations in HCI. To detect this, sEMG signals from the masseter muscle and temporalis muscle generated by the biting motion were measured simultaneously with an EOG at the same electrodes.

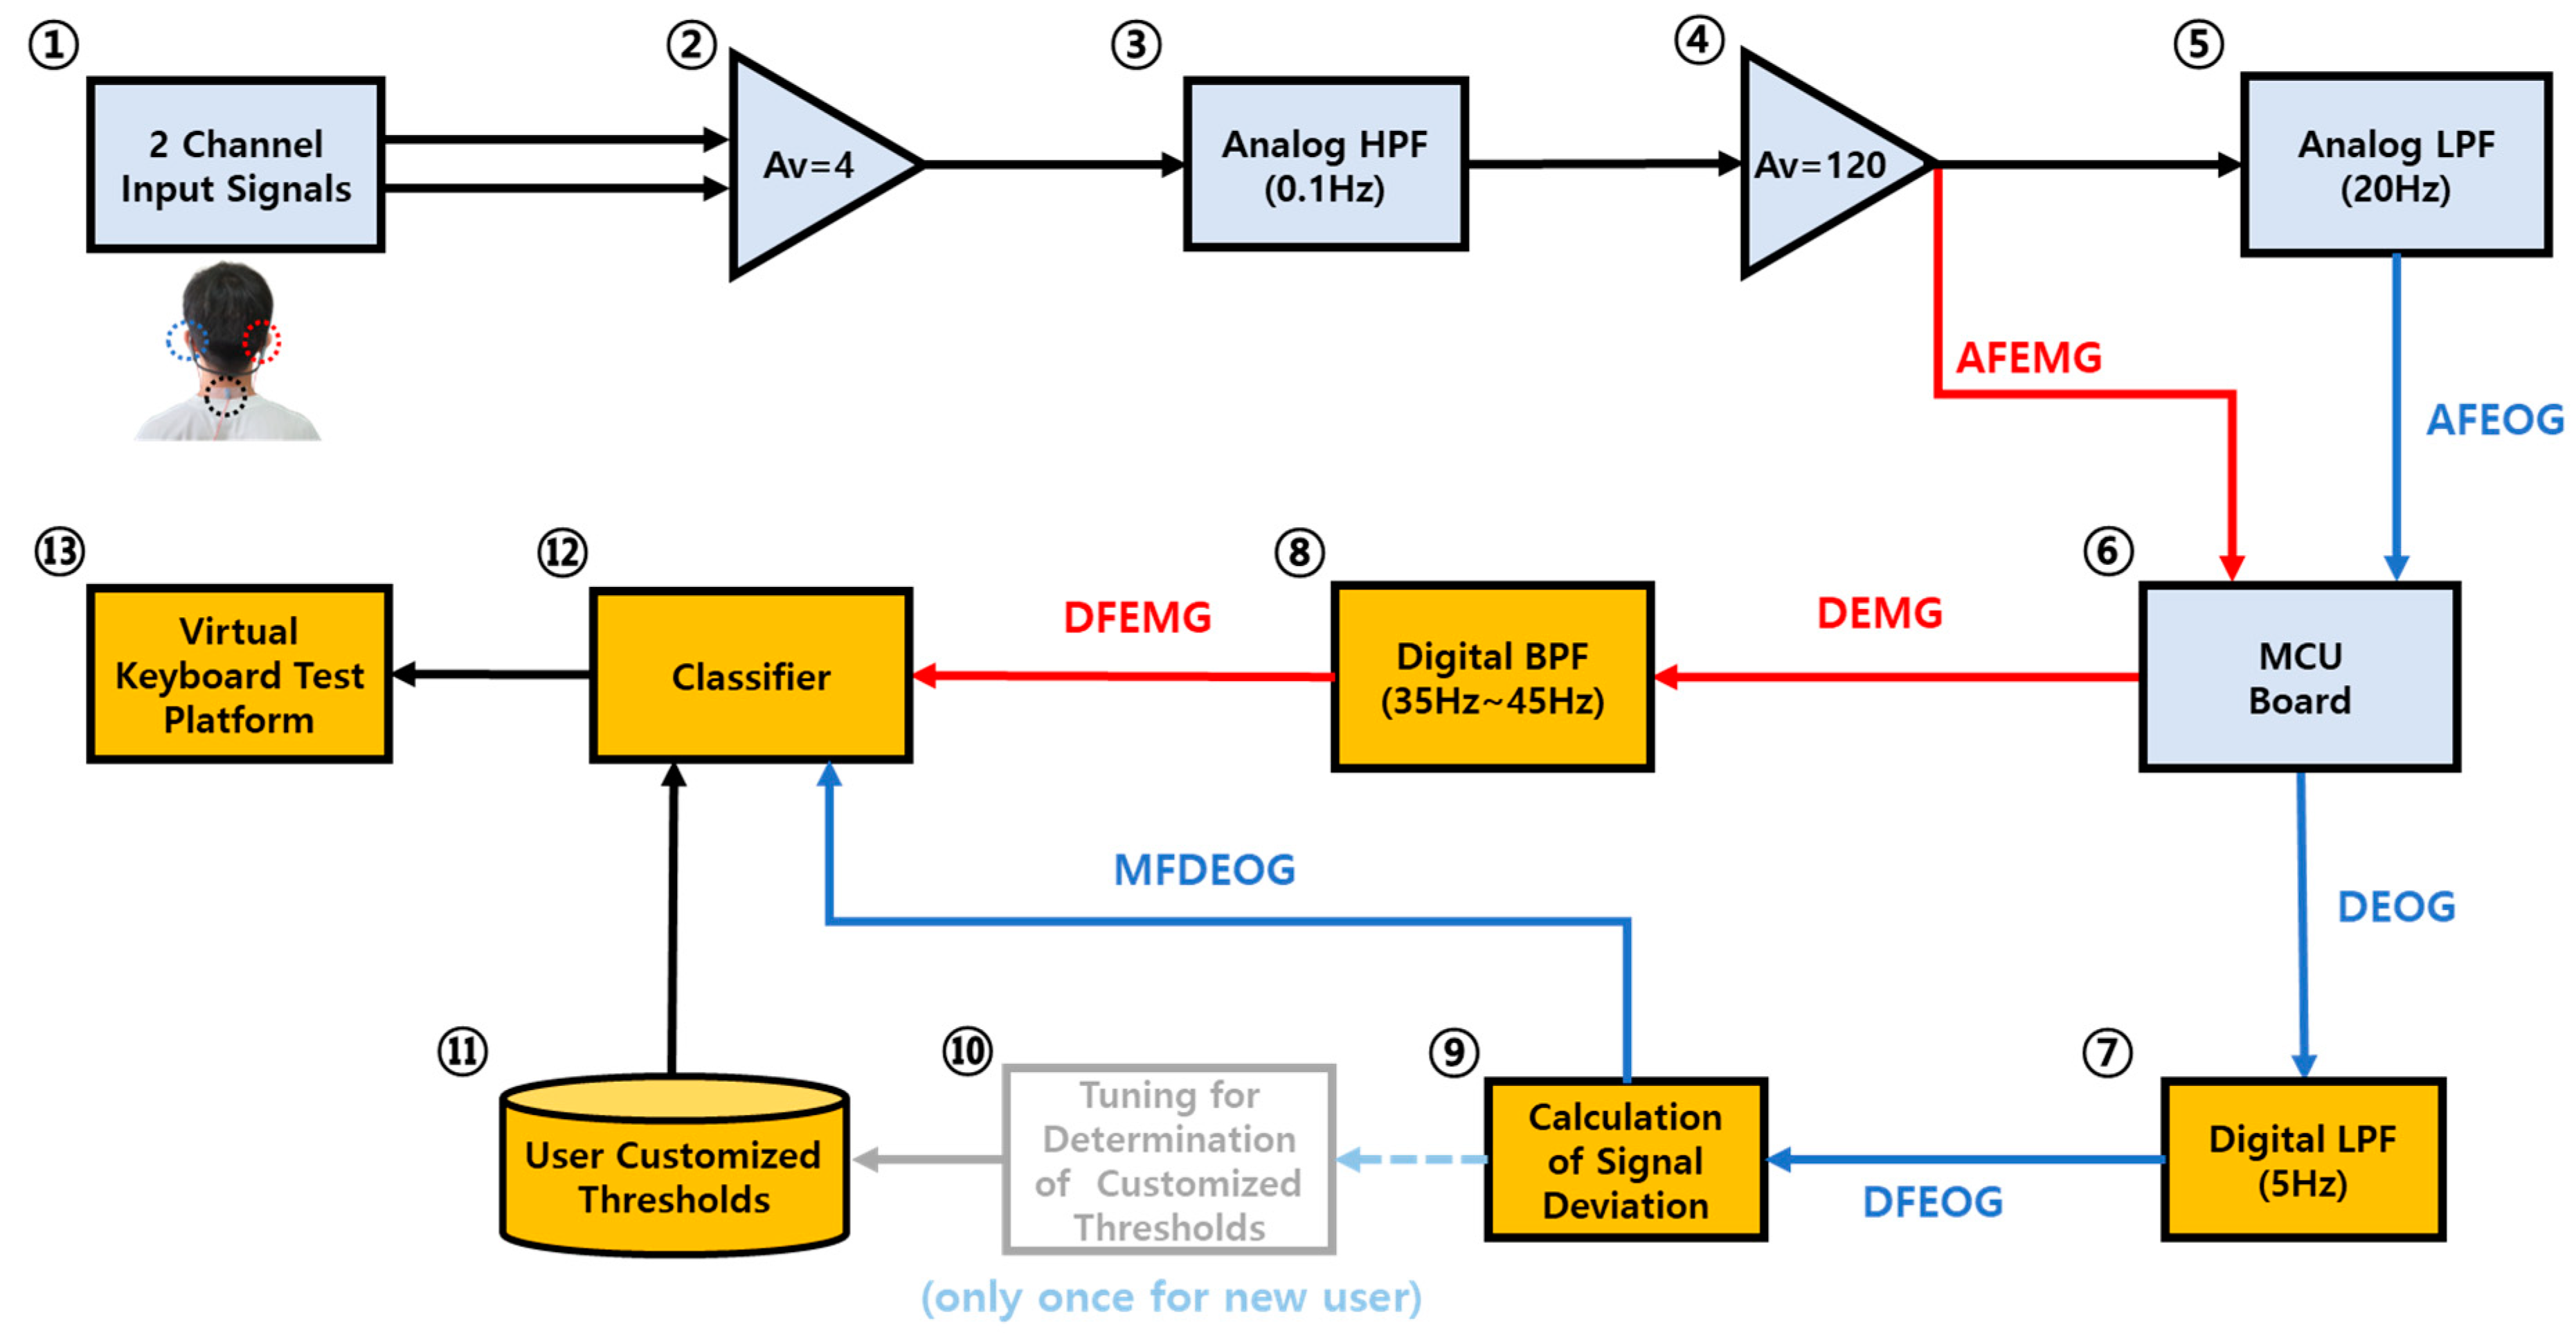
2.2. EOG and EMG Signal Acquisition System

Figure 2 is a block diagram of the developed interface system that can be used for the virtual keyboard application. In this figure, the light-blue blocks represent hardware components, and the orange blocks represent software components, respectively.
In terms of bio-signals transmission, the blue arrows indicate the flow of EOG signals, and the red arrows indicate the flow of EMG signals, respectively. In this study, the bio-signal-based HCI system was composed of four parts: electrodes, an analog circuit board for bio-signal acquisition (①–⑤), an MCU board for A/D conversion and serial communication (⑥), a software module for feature extraction and signal classification (⑦–⑫), and an HCI test module (⑬). For EOG and EMG signal acquisition, two electrodes were located at both sides of the bone conduction headphones, respectively, and the ground electrode was located at the back of the user’s neck. The EOG signals from the horizontal eye movement and the sEMG signals from the biting operation were measured through the electrodes attached to the bone conduction headphones. The signal acquisition board was composed of two-stage analog amplifier and analog filters for noise removal and separation of EOG and EMG signals. For A/D conversion and serial communication of analog-filtered EOG (AFEOG) and analog-filtered EMG (AFEMG) signals, an NXP FRDM-KL25Z MCU board was used. Then, digitized EOG (DEOG) and digitized EMG (DEMG) signals from the MCU board were transmitted to the PC for feature extraction and classification of eye gaze direction and angle. To enhance the feature extraction and classification performance, software-level additional digital filters were used. Using the digital filtered EOG (DFEOG) signals, the features were extracted by a moving average filter-based deviation calculation. Then, the moving average filtered deviation of EOG (MFDEOG) signals was fed into the classifier. To remove the noises and to obtain the effect of a biting operation from the DEMG, the software level bandpass filter was used and the digital filtered EMG (DFEMG) signals were also fed into the input of another classifier for classification of the biting operation. The details of each block are described later in this paper.

2.2.1. Bone Conduction Headphone-Integrated Electrodes

Typically, to obtain horizontal EOG signals, electrodes are attached near both eyes and the potential difference is measured and amplified for signal processing. However, it is difficult to use these in practical applications due to the inconvenience of the measurement environment according to the position of the electrodes. To overcome this usability problem, we developed a bio-signal acquisition system that can measure the bio-signals at the electrodes integrated into the bone conduction headphones. The position of the electrodes is shown in Figure 3.
In general, the electrodes used to acquire the bio-signals are wet-type electrodes in which the contact resistance with the skin is lowered by using a conductive gel on the Ag/AgCl electrodes. However, wet-type electrodes are inconvenient to use due to the requirement of conductive gel. In addition, as the electrodes become dry with long use, the impedance of the electrodes can be increased. Therefore, in this study, thin copper (Cu)-film-type dry electrodes were designed and used for signal acquisition. In the case of dry electrodes like copper electrodes, tight adhesion to the skin is very important for accurate signal acquisition. Therefore, in this study, to find the optimal electrode geometry, the impedance and signal distortion ratio values of the electrodes were evaluated according to three sizes of 1 cm × 1 cm, 1 cm × 2 cm, and 2 cm × 2 cm, and three thicknesses of 0.1 mm, 0.2 mm, and 0.4 mm. The method of measuring the impedance of the electrode was to measure the impedance of the electrode itself or measure the impedance of the interface between the electrode and body. As a result of measuring the impedance according to the shape of the electrode in this study, the difference according to the thickness and size of the electrode was not significant. In addition, in order to evaluate the degree of distortion of the measurement signal according to the electrodes, the signal distortion ratio was calculated in the range of 1–10 Hz. All of the target electrodes showed a sufficiently small signal distortion ratio in the corresponding range, but a copper electrode with a size of 2 cm × 1 cm and a thickness of 0.1 mm, showing the smallest signal distortion ratio among them, was determined as the final electrode shape.

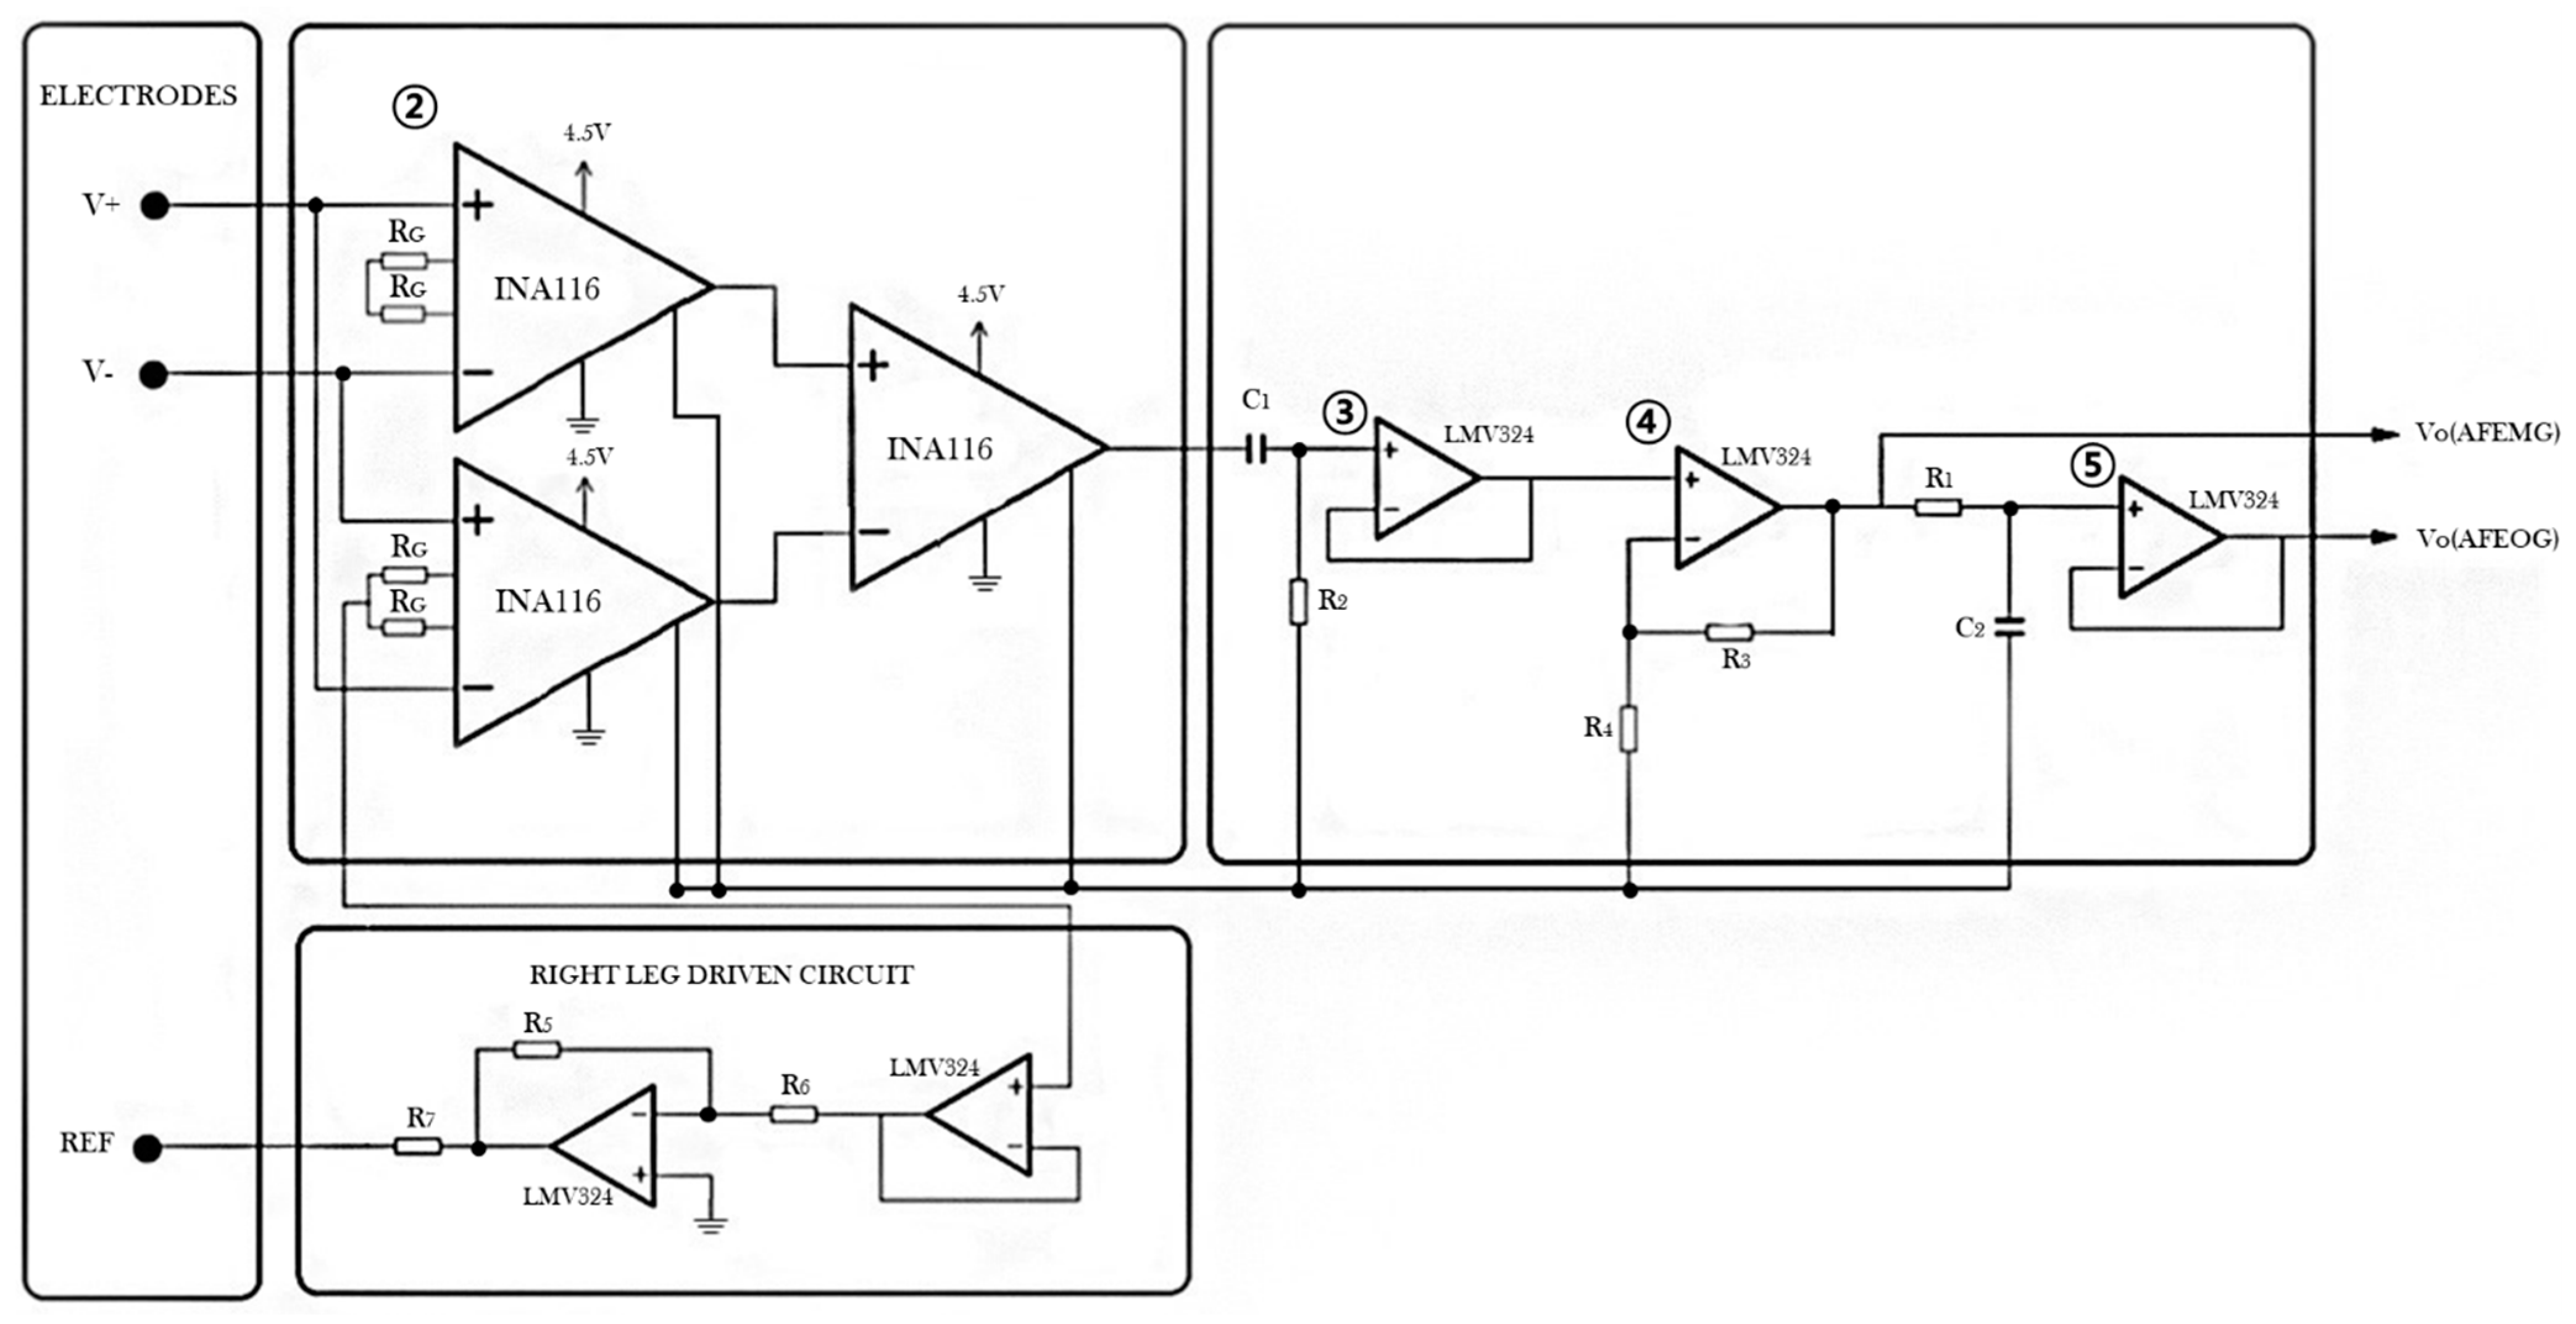
2.2.2. Signal Amplifier and Analog Filters

In general, the amplitude of typical EOG signals measured near the eye is in the range of 0.1 mV to 3.5 mV, whereas the EOG signals measured around the ear where the bone conduction headphones were located showed a smaller size of about one-tenth that value (ranging from 0.025 mV to 0.2 mV). For this reason, higher amplification with high-level noise rejection methods is required to use the near-ear EOG signals.
Figure 4 is the simplified schematic of the designed circuit for bio-signal acquisition. The block with the circled number in Figure 2 corresponds to the block with the same circled number in Figure 4. First, in this circuit, measured bio-signals (EOG or/and EMG) from two electrodes were transmitted to the inputs of the instrumentation amplifiers (InAmp). In this work, we selected INA116 for InAmp since it has a high common-mode rejection ratio (CMRR) with ultra-low input bias current [15]. For bio-signal amplification, it is essential to reduce common-mode interference from the skin and body. The right leg-driven (RLD) circuit is the most common way to reduce the common-mode voltage interference for bio-signal measurements, and we also used the RLD circuit as shown in Figure 4. The signals passing through this first circuit block were converted into 4 times amplified signals with 120 dB of CMRR.
In order to remove noises in amplified signals and to separate EOG and EMG from single channel signals, a high-pass filter (HPF) with a cut-off frequency of 0.1 Hz and a low-pass filter (LPF) with a cut-off frequency of 20 Hz were used. For the determination of cut-off frequency, it is essential not only to consider the theoretical frequency range of bio-signals to use but to minimize the distortion of the signal to ensure the proper feature extraction and classification. In general, HPF is used to remove baseline wandering noise at bio-signal measurement. When the cut-off frequency is relatively high in a HPF, it is shown that EOG signals have peaks only at the time of eye movement. That is, in the case of a HPF with a relatively high cut-off frequency, it quickly returns to the reference voltage even if a large noise or signal drift occurs. Therefore, it is desirable to use a relatively high cut-off signal to identify the exact time of eye movement. However, filtered EOG signals with higher cut-off frequency showed relatively large amplitude fluctuations according to the speed of the eye movement and relatively severe signal distortion and they are disadvantageous in detecting the angle of the small saccade. In contrast, when the cut-off frequency is relatively low, it is advantageous in detecting the angle of the small saccade due to less signal drift and less signal distortion by the filter. However, it is vulnerable to noise caused by body movement during the measurement, and the delay time to return to the reference voltage is relatively longer. Therefore, in this study, the cut-off frequency of HPF was determined empirically at a level so that the effect of a certain level of drift could be removed from the feature extraction and classification part. The signals that eliminate low-frequency noise through HPF were amplified again using an LMV324 low-voltage rail-to-rail output amp with a gain of 120. Since the amplified signal was still a single-channel signal in which EOG and EMG signals were mixed, separation through frequency division was required. In this work, the EMG signals generated from the biting operation used as the interface input had an amplitude range of 1–10 mV, which was much larger than the amplitude of the EOG signals ranging from 0.1 to 3.5 mV. In addition, since the detailed levels of EMG signals were not considered for different interface input in this work, the amplified signal containing both EOG and EMG was used as the EMG signal (AFEMG), and only EOG signals were extracted by passing the LPF with a cut-off frequency of 20 Hz. Then, the filtered and amplified AFEMG and AFEOG signals were input to the MCU for A/D conversion, respectively.

2.2.3. MCU Unit for A/D Conversion and Serial Communication

For A/D conversion and serial communication, NXP’s 32-bit ARM Cortex M0+ core-based NXP FRDM-KL25Z MCU board was used. Using the embedded A/D converter on board, each of the AFEOG and AFEMG signals was digitized with 16-bit resolution, respectively. For additional digital signal processing and HCI application, digitized EOG and EMG signals were transmitted to a personal computer (PC). For signal transmission, we used a USB communication device class (CDC) and the sampling frequency was 2 kHz.

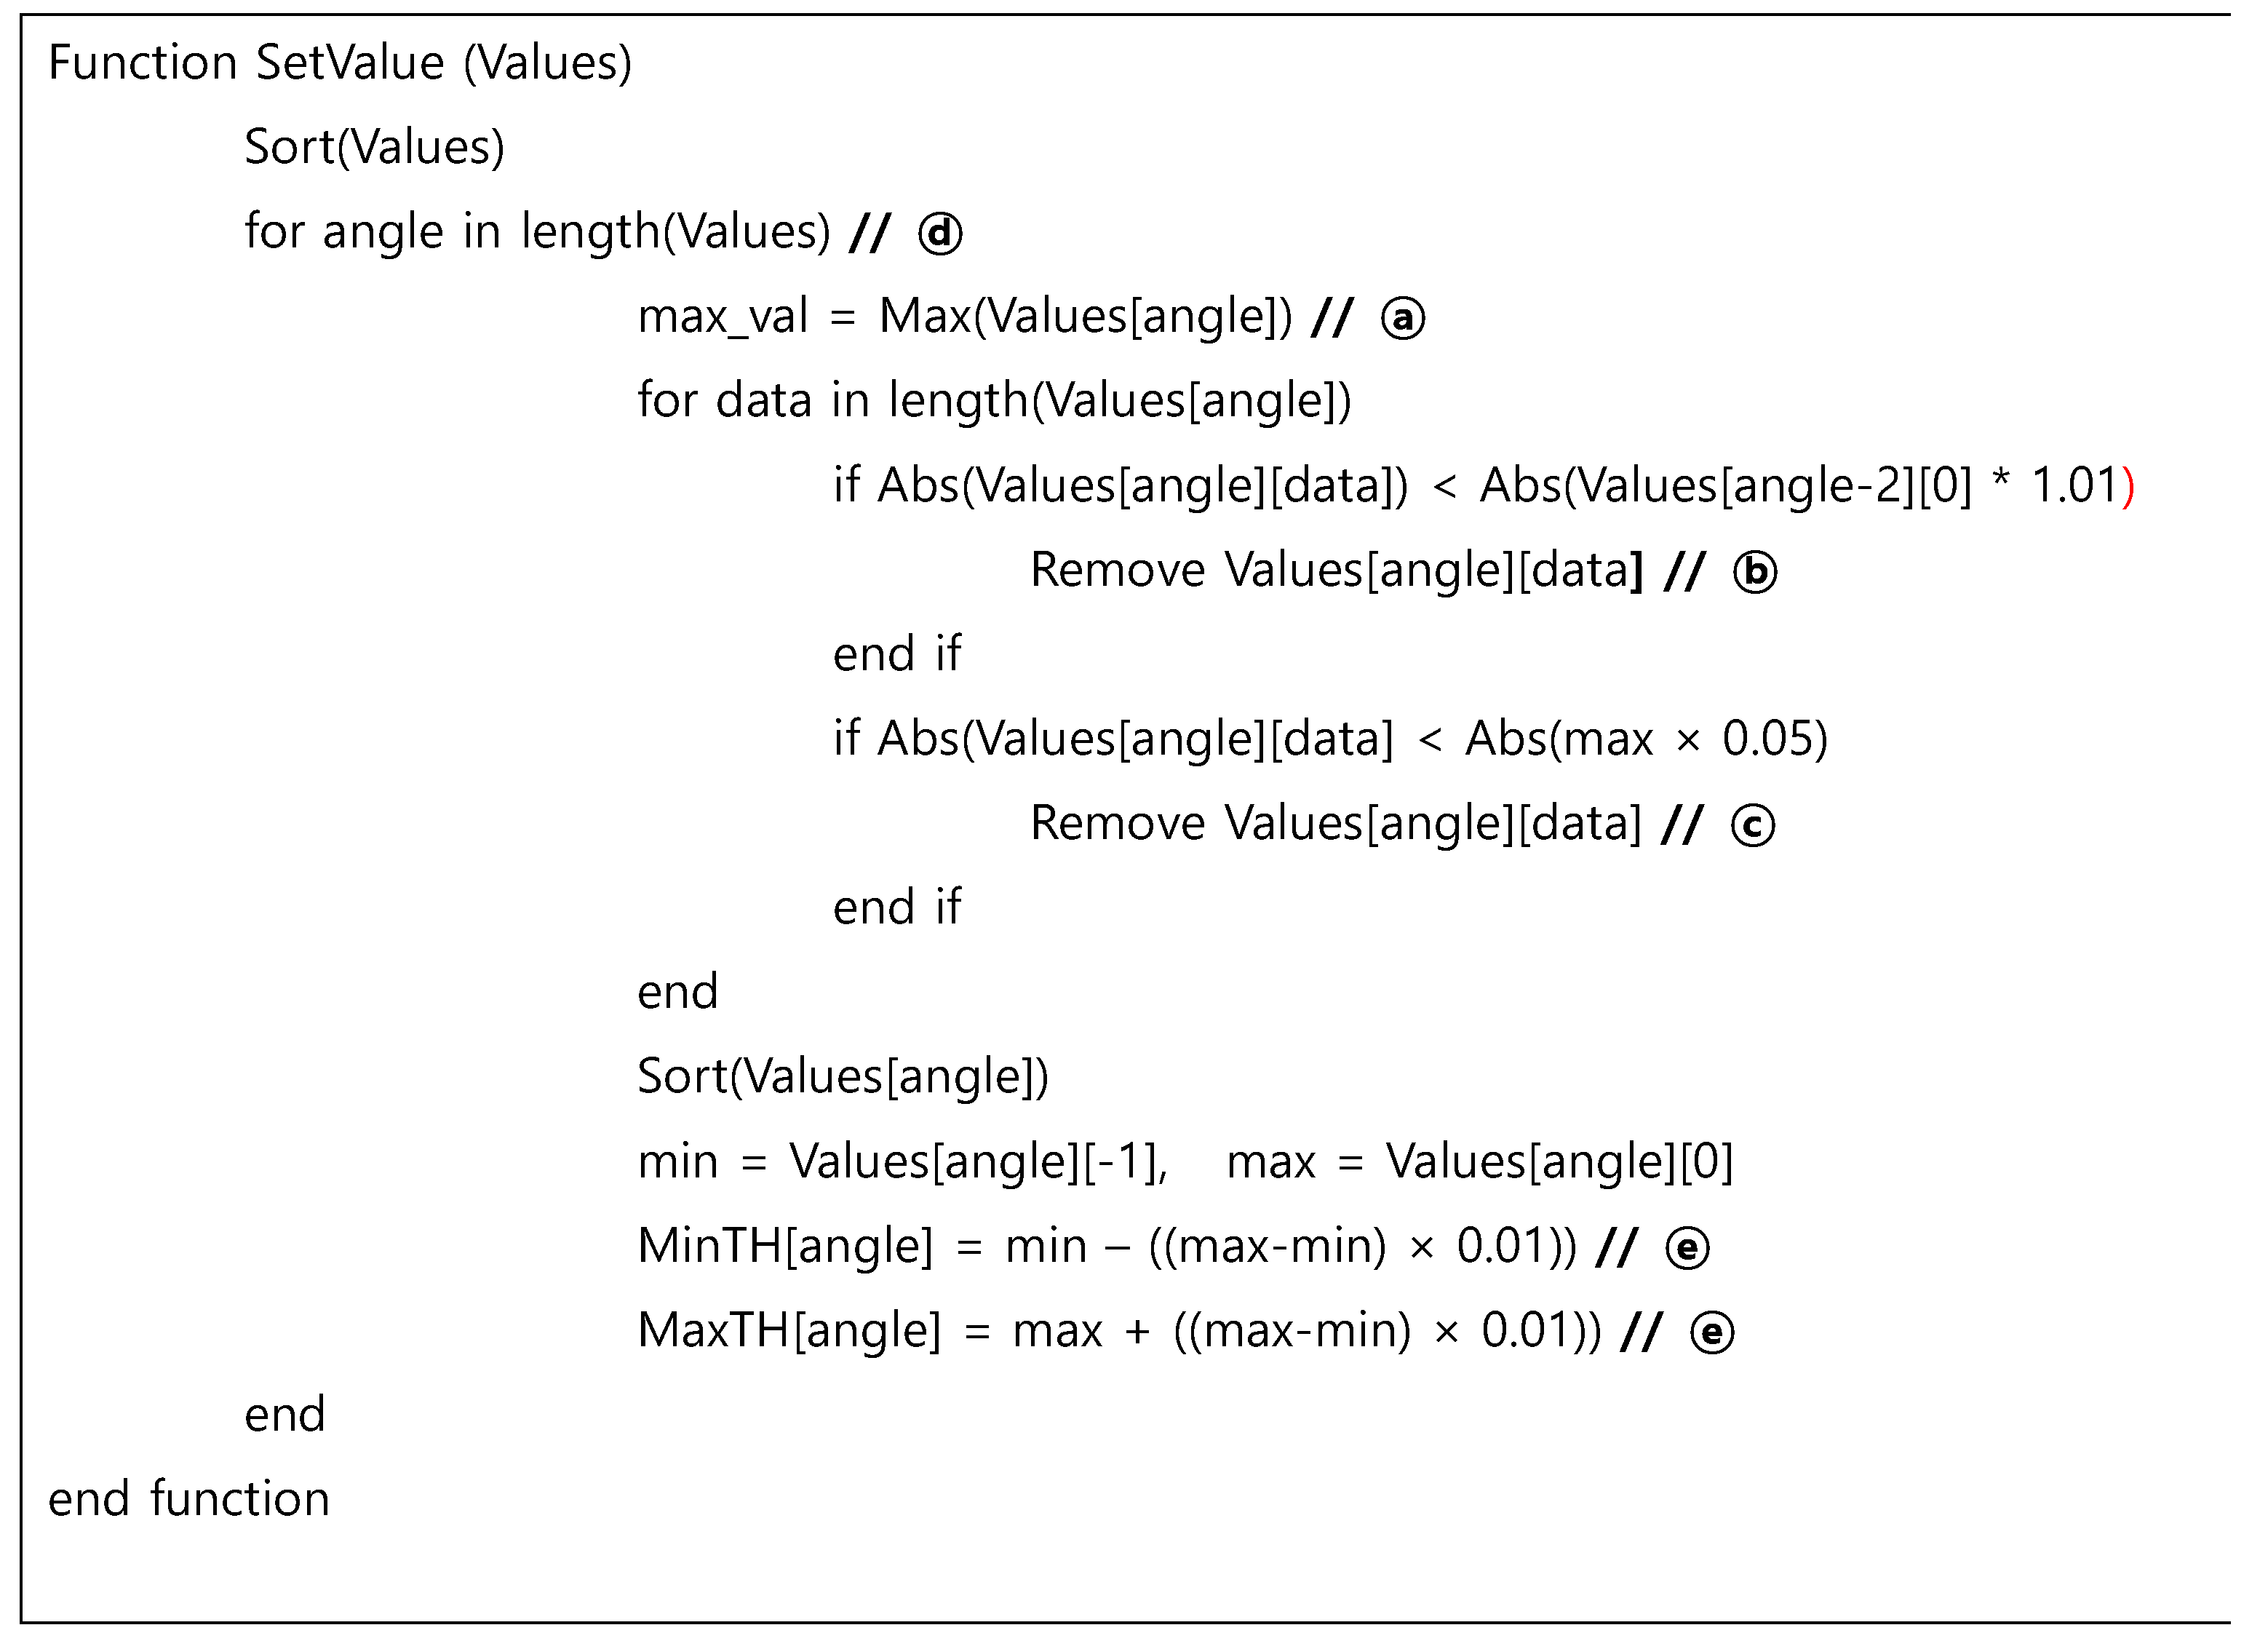
2.3. Moving Average Filtered Deviation of EOG (MFDEOG) Signal for Feature Extraction

The signal transmitted from the MCU was sequentially subjected to the software-level filter unit for noise reduction, feature extraction, and signal classification for use as an interface input, and finally, its performance was evaluated on the virtual keyboard platform. The EOG that had passed through the analog filter circuit (AFEOG) still had a lot of high-frequency noise, as shown in Figure 5a. As shown in Figure 5b, high-frequency noise was removed by using the additional software level LPF with a cut-off frequency of 5 Hz without additional time delay. In this paper, we defined the name of this signal as DFEOG (digital filtered EOG). To implement LPF, a second-order Butterworth-type IIR was designed, and the sampling frequency was defined as 200 Hz.
EOG signals have a positive slope or a negative slope according to the rotational direction of the eyes, and the amplitude of EOG signals tends to increase according to the angle of horizontal eye movement. According to the research results of Kumar and Poole, the amplitude of EOG is linear to the horizontal eye gaze angle range of −45° to 45° [16]. However, the change of signal amplitude is not completely proportional to the rotation angle of the eyes, and the tendency varies slightly from person to person. Additionally, the values of the EOG signal appear differently depending on the measurement equipment and even for the same person, the signals are inconsistent depending on the measurement time and environment. In this work, since the signals were measured near the ear area, relatively farther away than the normal EOG measurement position, the reproducibility of the signal was inevitably degraded because it was relatively vulnerable to noise. In addition, it is necessary to consider the signal processing time to minimize the delay between the eye movement and input recognition time for a prompt interface. For this, in this study, we used the moving average filter to find the features that can recognize the starting time and angle of the eye movement with as small a latency as possible for real-time application. As previously mentioned, the amplitude of EOG signals changed according to the eye movement. When there was no eye movement, the signal changes were very limited compared to eye movement during eye gaze, even considering signal drift error. At this point, the signal deviations were used as a characteristic to estimate the angle of eye movement. In the calculation of the deviation, the time delay is very short if only the deviation from the one preceding signal is considered. For example, only 0.005 s of delay occurs based on the 200 Hz sampling rate used in this study. In this case, the sign and magnitude of the signal may change according to the interference caused by signal noise, so it cannot be used directly for the classification of eye movement. To overcome this, the deviation was calculated based on the signals that passed the moving average filter.
To calculate the moving average-based deviation, the EOG signals were set in a specific period (window) and the average value of the measured EOG signals within the window range was obtained. Then, the deviation was calculated based on this average value. In this case, the deviation of the signal according to the gaze movement is significantly greater than when the gaze is fixed without moving, so it can be used as the basis for detection of the eye movement. Since the noises were distributed intermittently with random amplitudes, their effect on the variation of the deviation is negligible. The moving average-based deviation can be calculated by dividing the EOG signal into specific window ranges as shown in Equation (1). In this case, N, xi, and x-bar represent the number of discrete EOG signals within the window range, EOG signal (DFEOG), and the average value of the signals within the specific window interval, respectively.
d = 1 N i = 1 N ( x i x ¯ ) ,
The sensitivity of the deviation values depends on the size of the window. Larger window sizes are more robust to noise, but delays occurred in recognizing the starting point of eye movement because we needed to wait as long as the window size to calculate the moving average. On the other hand, the smaller the window size, the shorter the delay time required to calculate the deviation, but the effect of noise can be much more critical than a deviation calculation with a bigger window size.
The visual choice reaction time (CRT) is generally distributed between 0.4 and 0.8 s and slows down with age. Subjects in this study in their twenties had the fastest average CRT records, and the value was around 0.5 s [6]. Based on these values, the window size was set so that the maximum delay did not exceed 0.3 s in consideration of the average CRT for the age range of the subjects and the individual differences of CRT. That is, the window size was set to be a maximum of 60 samples based on the sampling frequency of 200 Hz used in this study.
Figure 6a shows the DEFEOG signals for six subjects, and the shape of the MFDEOG signal passing through the filter is shown in Figure 6b. As shown in this figure, when the eyeballs moved to gaze at a new position, the EOG signals of all subjects similarly rapidly changed. However, signal drift occurred even while gazing at the same point, and the signal values tended to be changed. In addition, the shape of the signals was slightly different due to the influence of the subject’s eye movement characteristics or measurement noise. As shown in Figure 6b, most of the signal differences disappeared at the MFDEOG signal passing through the moving average filter. However, there were cases where the peak value of the signal was still different for each subject.
The direction and angle of the eye movement could be determined based on the deviation values of the signal that had passed the moving average filter. In other words, it could be known that eye movement occurred to the right if the value of the deviation was positive and to the left if it was negative. The rotation angle of the eyeball could be determined by comparing the peak value of MFDEOG (p-MFDEOG) generated by eye movement with the threshold value set for each angle. Therefore, it was necessary to find the threshold values of MFDEOG for each angle.

2.4. Classification

2.4.1. Individual Threshold-Based EOG Signal Classification of the Angle of Eye Movement

Through the experiment, it was confirmed that just as the value of the horizontal EOG changed according to the rotation angle of the eyeball, the value of the MFDEOG signal also changed according to the rotation angle of the eyeball. However, similar to EOG, MFDEOG did not show the perfect linearity in the rotation angle of the eyeball, and the value of MFDEOG was slightly different depending on the subject, as shown in Figure 6b. Figure 7 shows the maximum and minimum of the p-MFDEOG of 10 subjects who participated in the first experiment of this study for each position of eye gazing.
When the gaze moved 80° to the right, the largest value of the peak value of p-MFDEOG was expressed as R80Max and the smallest value was named as R80Min, and this test was repeated at intervals of 20° from L80 to R80. Considering that the normal ranges of eye movement were 44.9 ± 7.2° in the abduction and 44.2 ± 6.8° in adduction, the range of horizontal eye movement used was limited from L80 to R80 in this study [17]. The symbol S1 is a notation to classify the subjects according to the experimental period. In this paper, subjects who participated in the first period are classified with letters starting with S1, and those who participated in the second period are classified as S2. All subjects were healthy men or women in their twenties, and this study was conducted after institutional review board (IRB) approval. The p-MFDEOG values of the subjects showed a difference regardless of gender and age. For example, the L80Max value of subject S1-4 was −0.15 mV, which was more than twice as big as the L80Max value of subject S1-9 of −0.07 mV.
Comparing the minimum and maximum of the p-MFDEOG for each gaze angle, there were cases in which the minimum and the maximum values at all angles were clearly distinguished from the p-MFDEOG of the different angles of eye movement, as in S1-1. On the other hand, there were cases where the maximum (or minimum) value of the p-MFDEOG was very similar to the minimum (or maximum) value of the adjacent level of angles, such as R80Min and R60Max in the S1-3 case and L60Max and L80Min in S1-4 case. Therefore, it is impossible to classify the angle of eye gaze with one set of the predetermined threshold values of p-MFDEOG and use it for all subjects. In other words, the tuning process for each user was essential to find the customized threshold values of p-MFDEOG for each gaze angle. Therefore, all users needed a one-time threshold tuning process at the first use of the developed interface method to improve their command recognition rate, and from the next time, the angles of eye movements were classified using the stored individual threshold set without additional threshold calibration process. To set the individual threshold, subjects repeated gazing at targets moving in the same tuning pattern on the monitor twice. The tuning pattern contained targets for 48 eye movements including all eye gaze cases that could occur from −80° to 80° of eye movement at intervals of 20°. The velocity of eye movement varied according to the eye movement direction (horizontal or vertical), age, and measurement method [18,19]. According to Yu et al. [20], the average horizontal saccade speed of an adult is about 292.12 deg/s. Therefore, in this study, the speed of the target pattern on the monitor was set to be 267 deg/s, so that it could be sufficiently tracked with the eye movement of a normal person. The speed of the eyeball also depends on the angle of the eye movement. In general, the relationship between the peak velocity of the eyeball and the saccade angle can be expressed as the following Equation (2) [21].
P e a k   v e l o c i t y = V m a x × ( 1 e ( a n g l e / C ) ) ,
where Vmax and C represent the asymptotic peak velocity and a constant, respectively. According to this equation, the peak velocity increases linearly from 0 to 15°, but above it, the velocity is saturated with a constant value. Therefore, within the range of eye movement targeted in this study, it was not necessary to consider the variation of eye speed according to the angle of saccadic eye movement. Figure 8 shows the pseudo-code of the “SetThValue” function that found the threshold of the p-MDFEOG signal to classify the angle of eye movement for each subject. The calculation process of this function is as follows. ① First, we found the largest value among the p-MDFEOG signals corresponding to a specific angle. ② Then, signals smaller than the maximum p-MFDFEOG with an angle smaller than the corresponding angle among the p-MDFEOGs corresponding to the specific angle for which the threshold value to be found were removed. For example, signals smaller than the maximum value of p-MFDEOG corresponding to R20 among the p-MFDEOG corresponding to R40 needed to be removed. ③ Values smaller than 5% of the maximum value of p-MFDEOG obtained at a specific angle were considered outliers and also removed. ④ Through this, the maximum and minimum values among p-MFDEOGs were obtained, and this was repeated for all angles. In this study, the threshold values were found in the order from smallest to largest. ⑤ Finally, in order to secure a margin on the threshold, the minimum and maximum values of the threshold were obtained by adding a value equivalent to 1% to the difference between the maximum and minimum values obtained at a specific angle.
When the subject’s tuning process was finished, the p-MDFEOG according to the subject’s eye movement and the movement information of the target on the monitor were stored and transferred to the threshold adjustment step for classification.

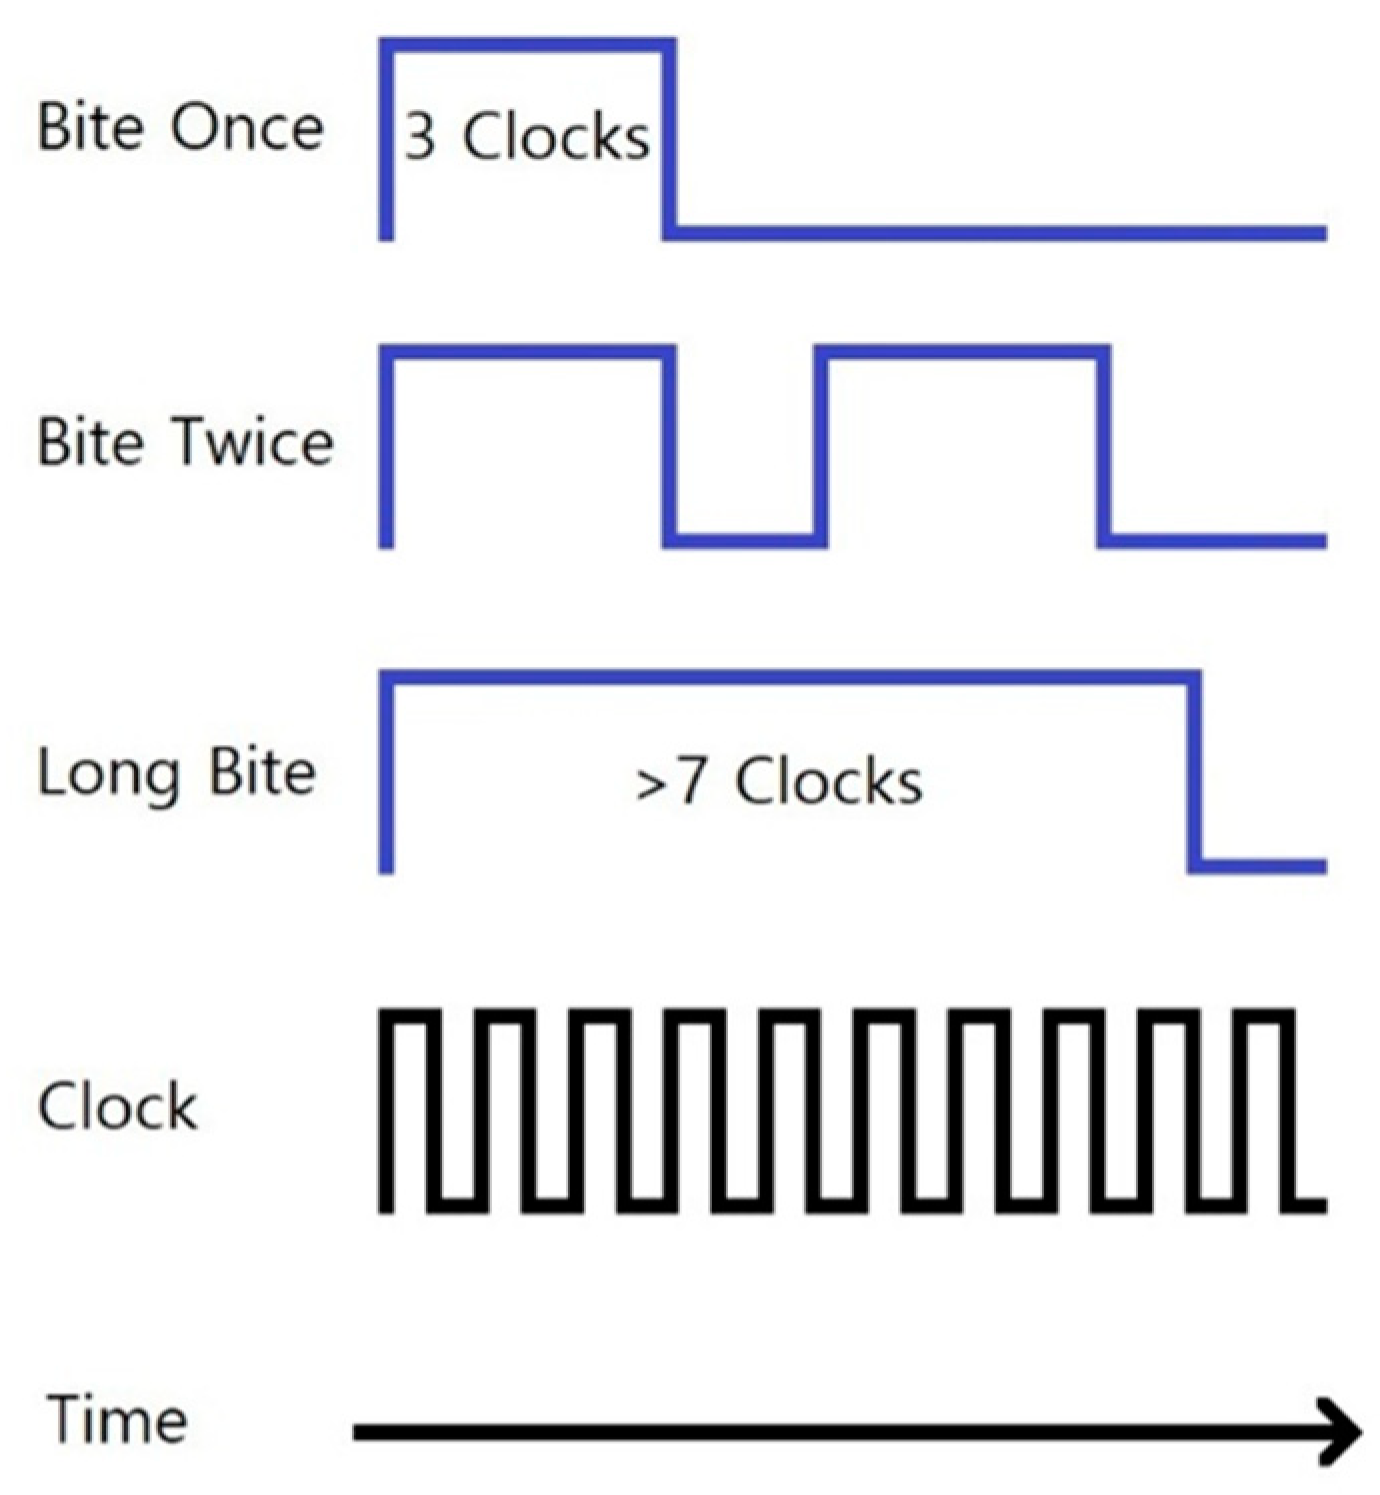
2.4.2. Classification of EMG of the Masseter Muscle

In order to increase the number of available operations on the HCI, biting action-based EMG was used along with EOG as interface inputs, and this interface method was applied to the virtual keyboard application. As previously described in Figure 2, the EMG signal was measured simultaneously with the EOG signal at the single-channel electrode, and they were separated by using the difference in the frequency band. In this study, the biting action was divided into three types for interface inputs: biting once, biting twice, and biting long, and the algorithm that distinguished them is shown as the pseudo code in Figure 9.
The frequency (BiteClock (hertz)) for detecting the biting operation was set to 20 Hz, which was 10% of the sampling frequency of the EOG signal. That is, the LoadData function was called every 20 rising edges per second. At that time, if the magnitude of the sEMG signal exceeded the predetermined threshold value (Th_bite), it was considered that this was the beginning time of the biting operation, and this point was set as the starting point of the window. The size of the window to determine the types of the biting operation was set to 0.5 s, which was the time when the rising edge was called 10 times in the clock signal. As shown in Figure 10, if the biting was ended at the moment when the ClockCount was 3 or more and 7 or less, the BiteCount was increased. At this time, if the BiteCount was 1, it was classified as the ‘bite once’ input and sent to the keyboard, and if the BiteCount was 2, it was classified as the ‘bite twice’ input. If the BiteCount value was more than 7, it was classified as the ‘bite long’ input and transmitted to the keyboard.

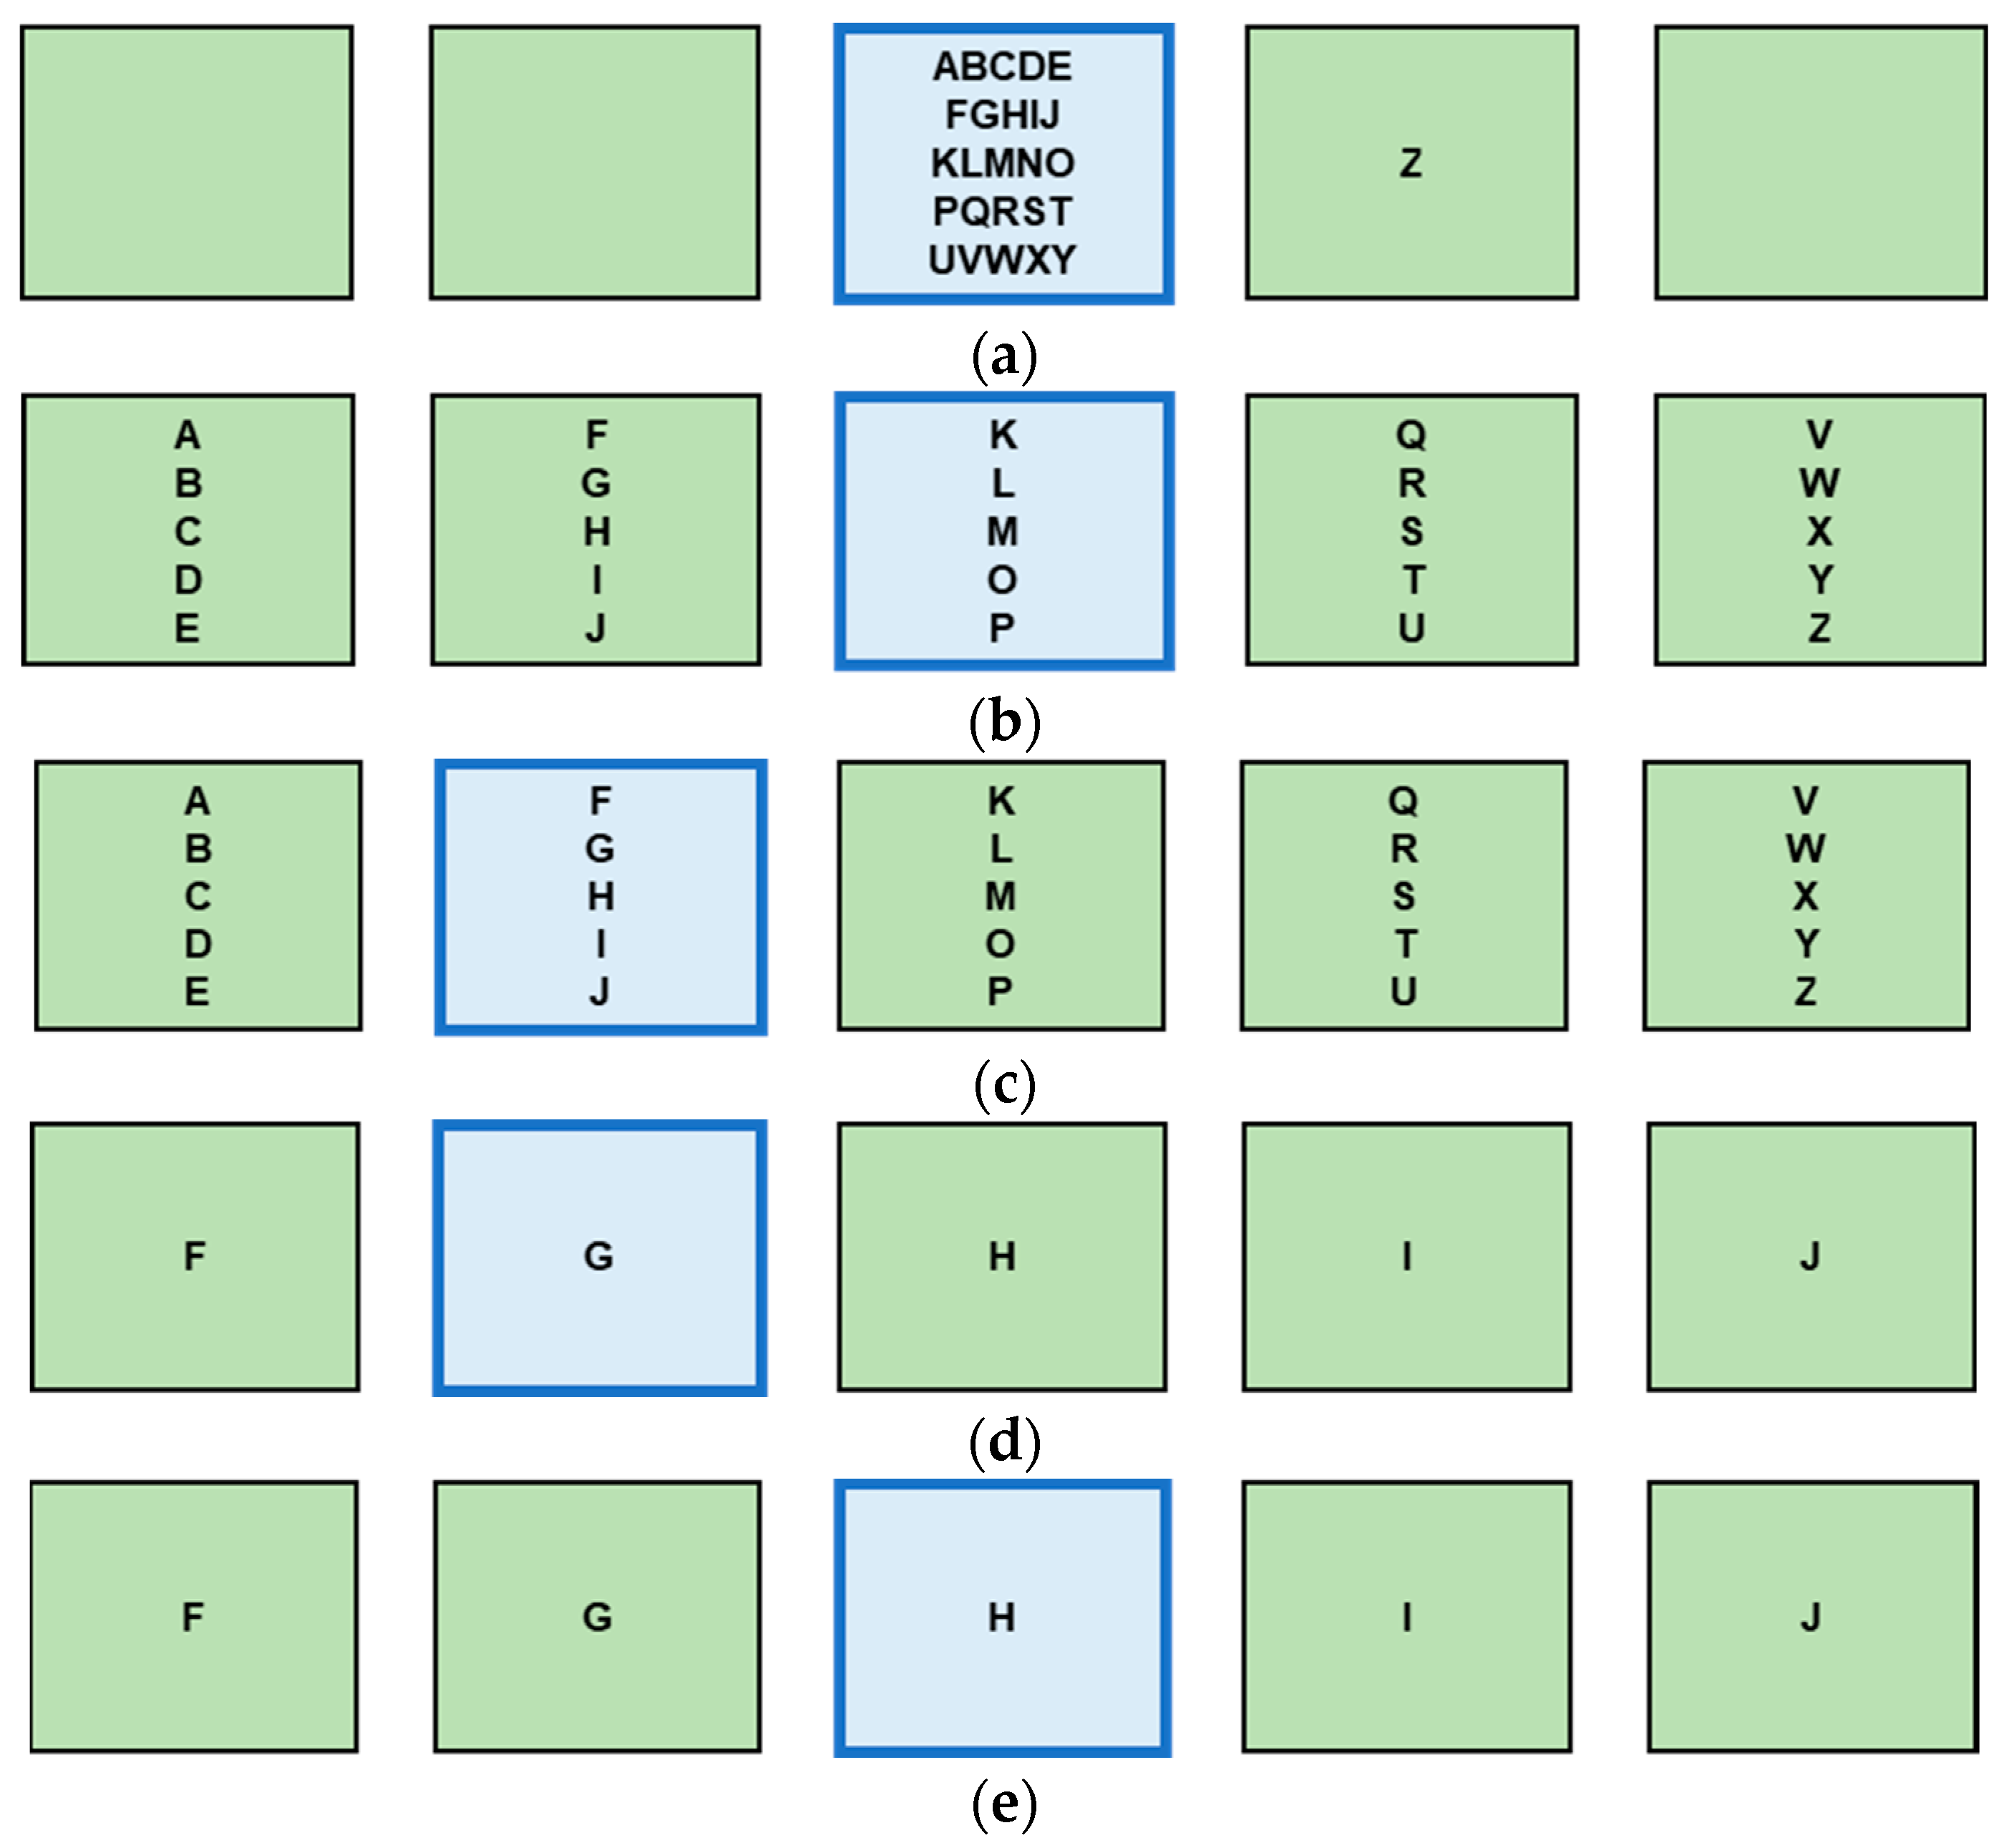
2.5. Design of Virtual Keyboard Interface

For the performance evaluation of the proposed interface method, it was applied to the virtual keyboard interface, which has been typically used for the evaluation of EOG-based HCI. The virtual keyboards used in the previous research have various types depending on the EOG signal acquisition method, classification method, and application target [22]. In this study, we developed the “quinary keyboard” by referring to the design of the “ternary keyboard” known as the “Telepathix” developed by Kherlopian et al. [23]. In contrast to the three-segment Telepathix, the proposed virtual keyboard enables continuous key input on the 5-segment keyboard through the EOG signal by eye movement and the sEMG signal through byte manipulation. In other words, it was possible to move the position by gazing at one of the five alphabet groups located on screen at an interval of 20°. Therefore, compared to the Telepathix, it was possible to type more various keys including delete and backspace keys. In this case, the range of eye movement ranged from a minimum of ±20° (movement between adjacent alphabet blocks) to a maximum of ±80° (eye movement from both ends to the end of alphabet blocks), and there were a total of 9 types of eye movements to distinguish (−80°, −60°, −40°, −20°, 20°, 40°, 60°, 80°, no change). To select a key and correct a typo, the sEMG signal generated by the biting operation was used. In the virtual keyboard, sEMG inputs were recognized as ‘selection’, ‘backspace’, and ‘delete’ for bite once, bite twice, and bite long actions, respectively.
Figure 11 shows an example key typing sequence of a specific character (here ‘H’) using the designed virtual keyboard. Here, when the user was currently looking at a specific block among the five blocks, the corresponding block was displayed in light blue. If the middle block was selected, as shown in Figure 11a, the letters in this block were split into 5 blocks, as shown in Figure 11b. Here, when the user selected a block where the character to be selected was as shown in Figure 11c, they were split again as shown in Figure 11d, and finally one could select the desired block as shown in Figure 11e to select the letter. To type the corresponding letter, you only needed to bite once. After typing of a single character, the interface went back to that shown in Figure 11a. Here, the interface method may be considered complicated by expressing an additional figure to explain the block division process for character selection. However, since these operations were performed continuously, the typing speed was faster than that of a general matrix-type virtual keyboard [11] which used simple up/down/right/left commands. Quick correction was possible through the biting action.

3. Results and Discussion

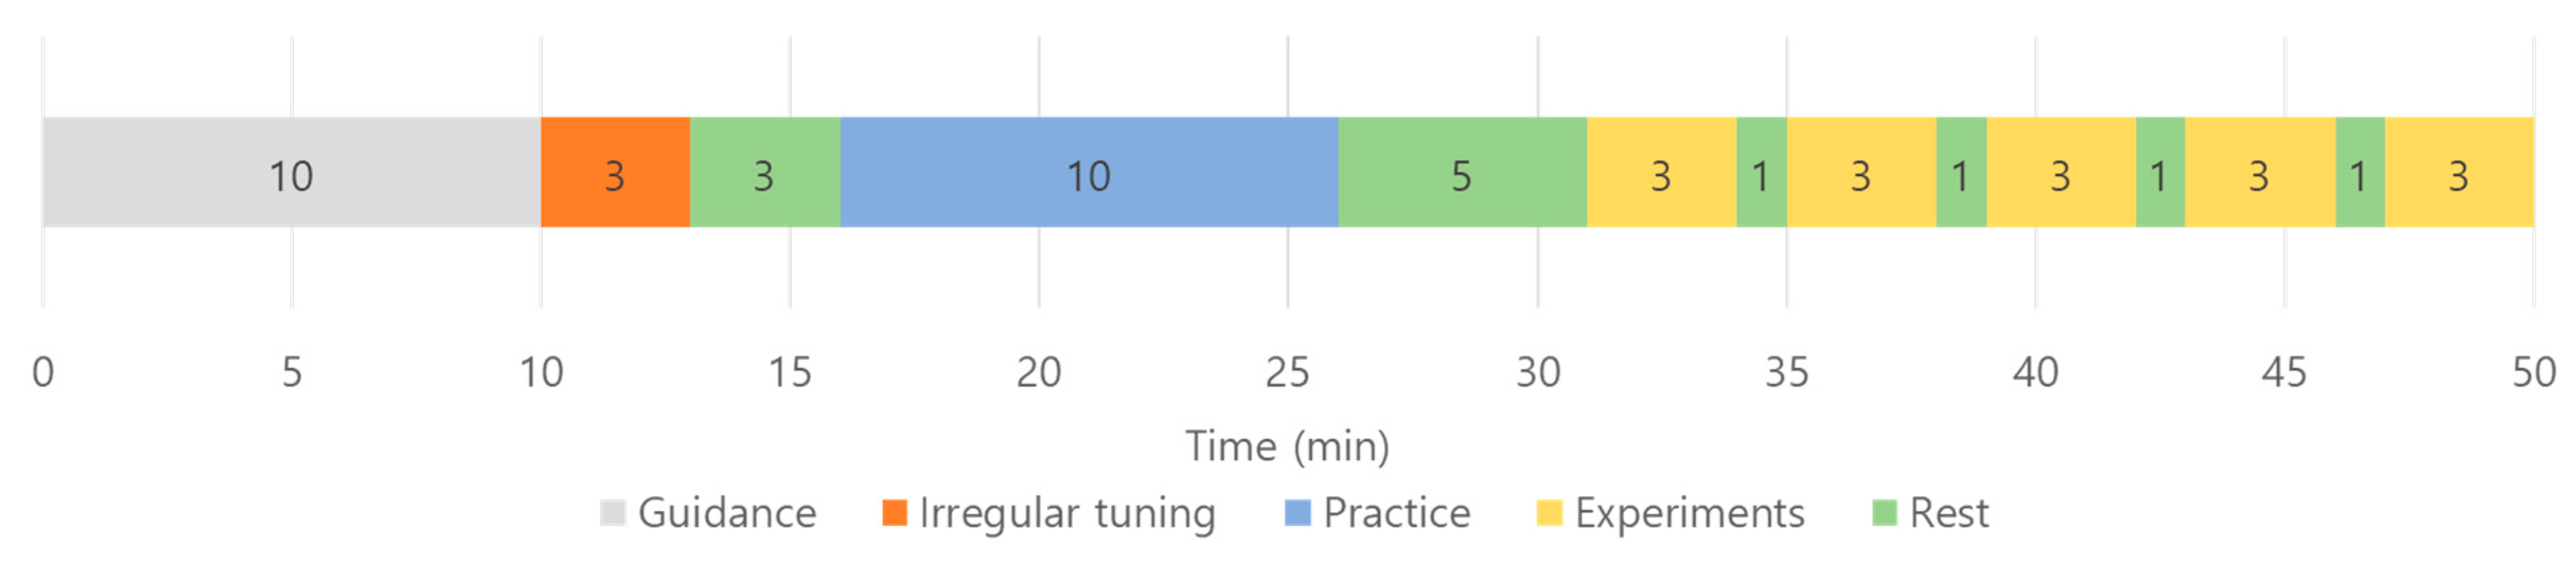
3.1. Experiment Environment and Subject Information

For the virtual keyboard interface test, a curved monitor with a width of 1244.6 mm and a curvature of 1600 was used for key display. The blocks with letters were horizontally located in five positions as shown in Figure 12 (from L40 to R40). The subjects sat 550 mm away from the center of the monitor to conduct the experiment. There was a total of 9 subjects (4 males and 5 females) and they were 20 to 25 years old, all healthy people without any medical history. Since these subjects participated in the experiment in the second period, they are marked S2 to distinguish them from the subjects in the first experiment (as previously described). Some of the S2 subjects also participated in the first experiment (S2-4, S2-6, S2-7, and S2-8). Before the interface performance test, subjects first performed the tuning process for individual threshold settings and practiced typing sentences twice through a developed virtual keyboard interface to learn the keyboard input method. The research experiment facilitator guided the subjects to the actions necessary to input the virtual keyboard, and guided the experimentation notes, processing, and contents of the stored information in accordance with the IRB regulations.
After the practice, the subjects typed the ‘hello world’ sentence (consisting of a total of 11 characters including space) a total of 5 times. At this time, in addition to the subject’s bio-signal, eye movements and biting motions were recorded as images through a camera and used for analysis later. The time required for the experiment varied depending on the subject’s adaptation speed and error rate, and bio-signal data were collected for at least 100 eye movements and 165 biting actions per subject. The typical flow of the experiment is shown in Figure 13. The time required for the sentence input experiment indicated in yellow was approximately 2 to 3 min.
As described above, the user could move to the desired letters block through eye movements, and perform the function of selection, backspace, or delete through the biting operation. Assuming that the subject typed without error, 20 eye movements, 33 single bites, and 0 double and long bite movements were required for typing.

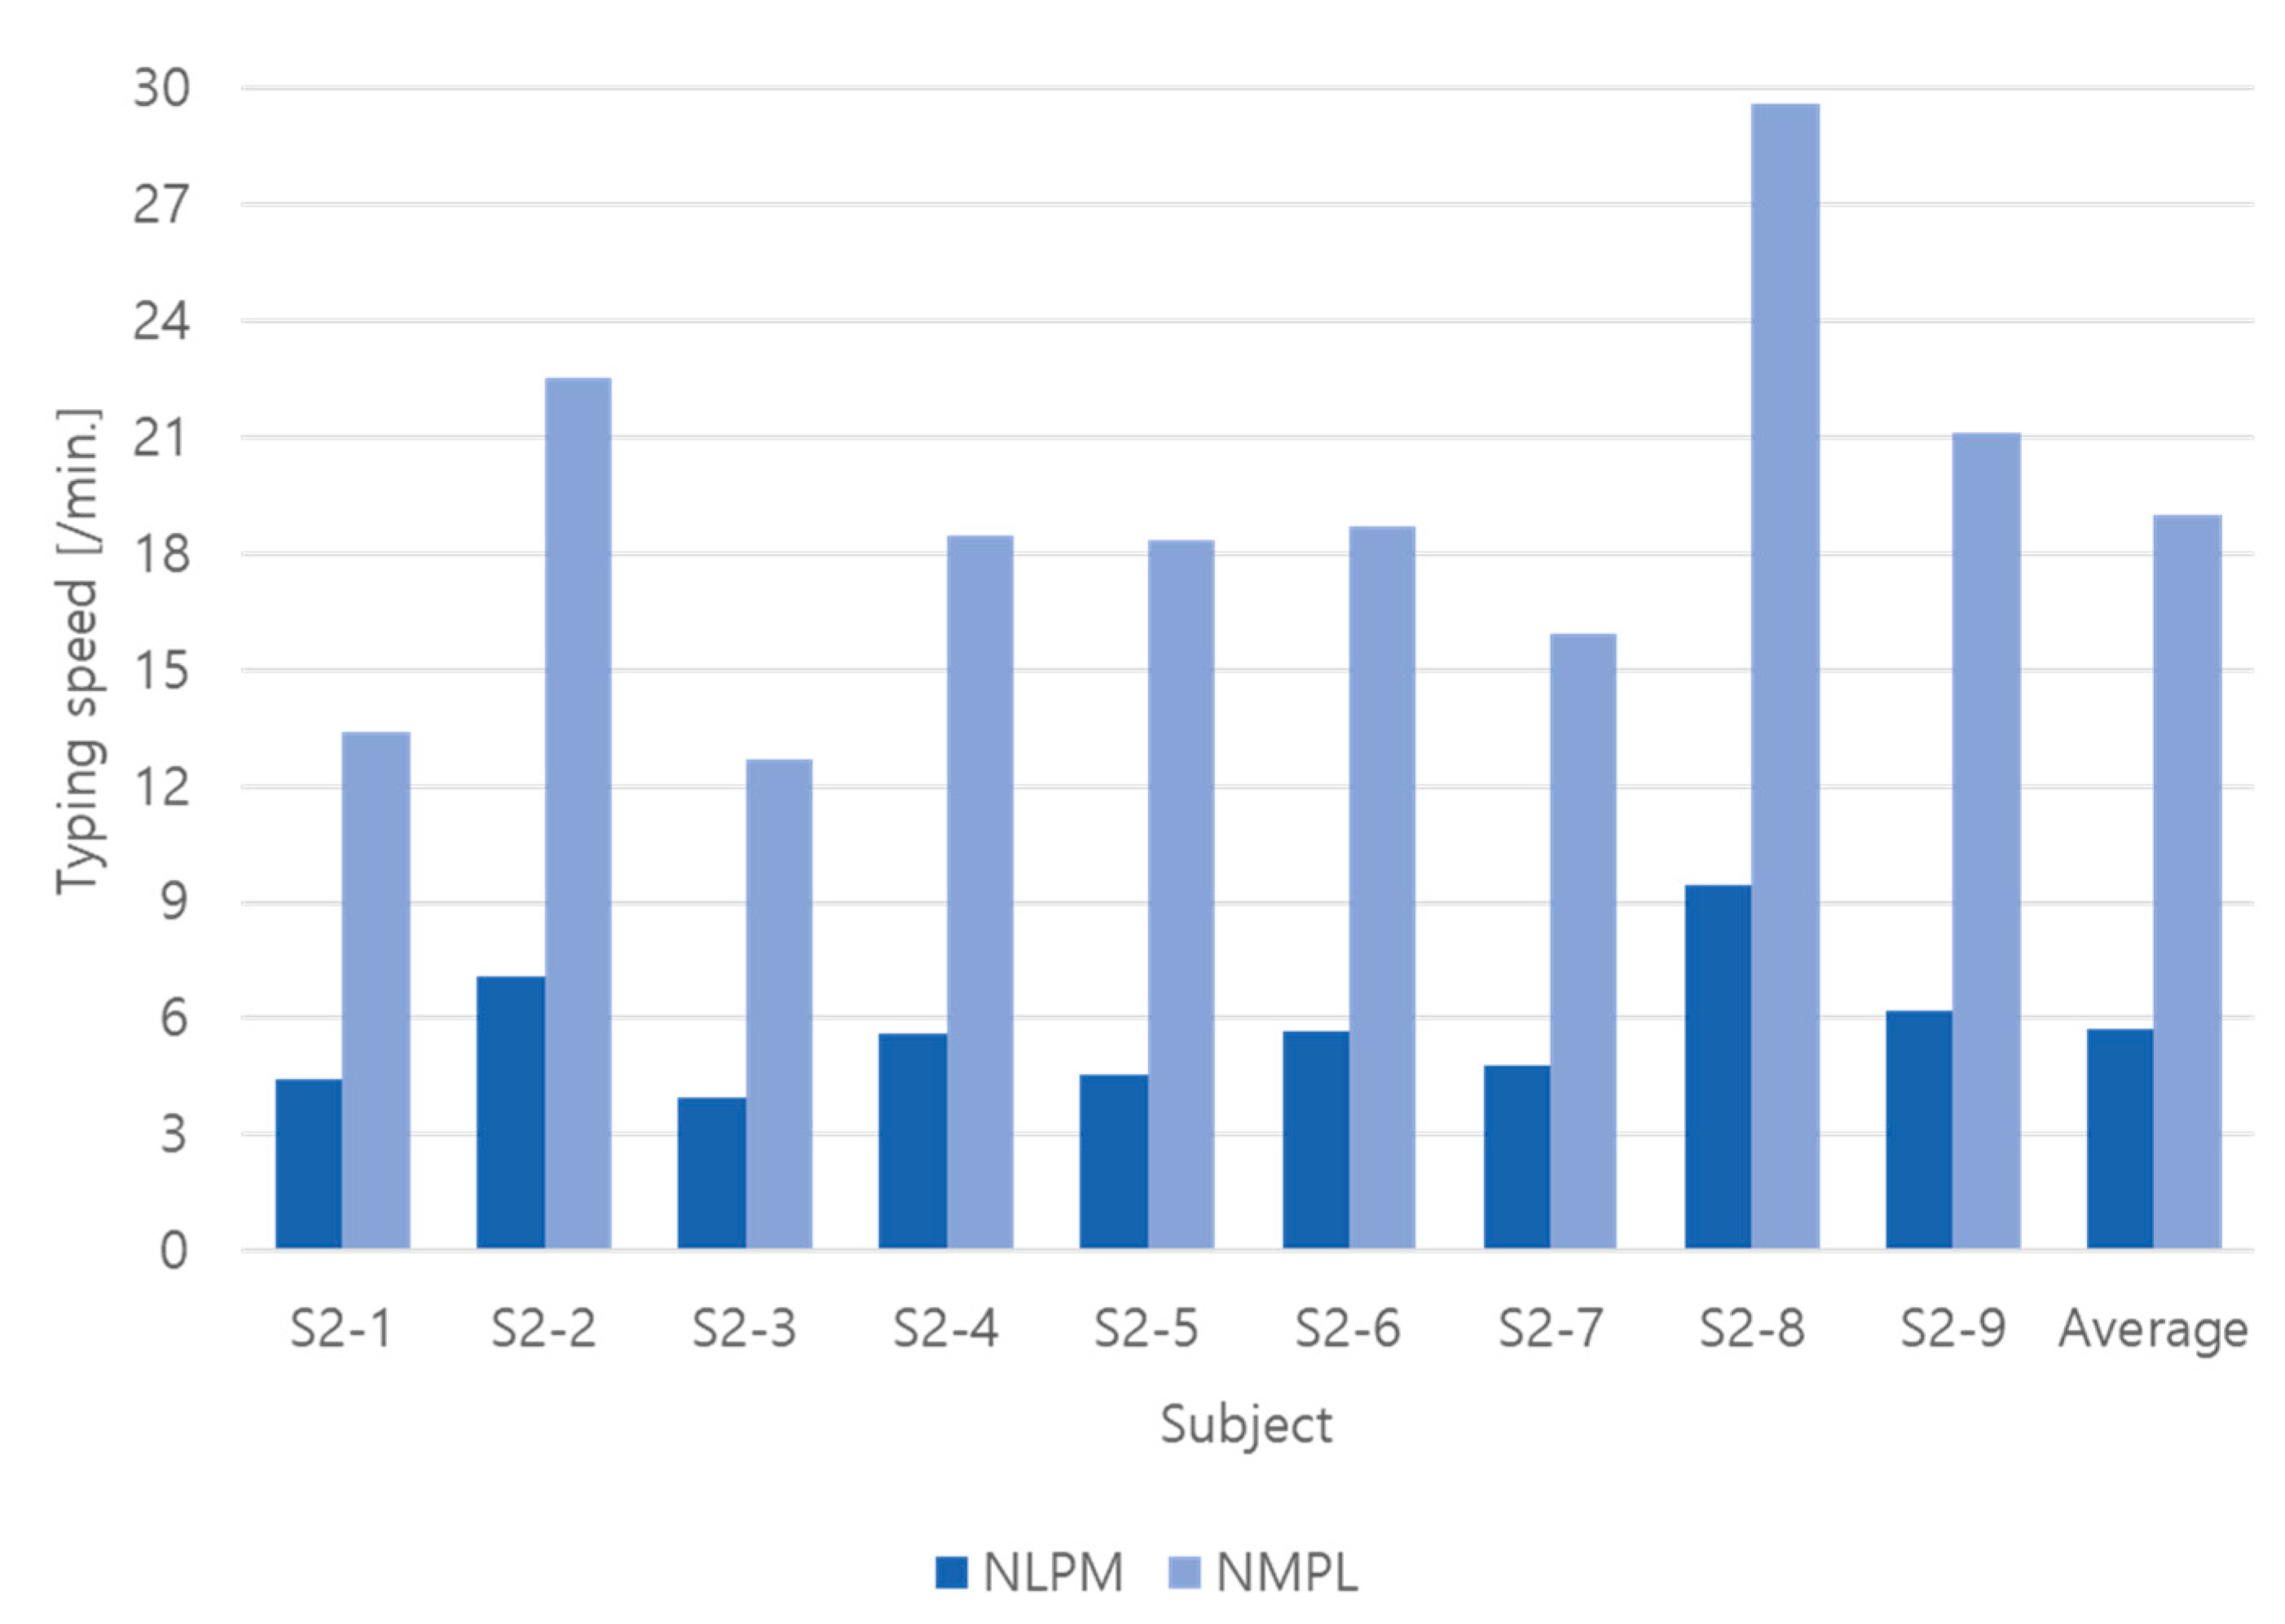
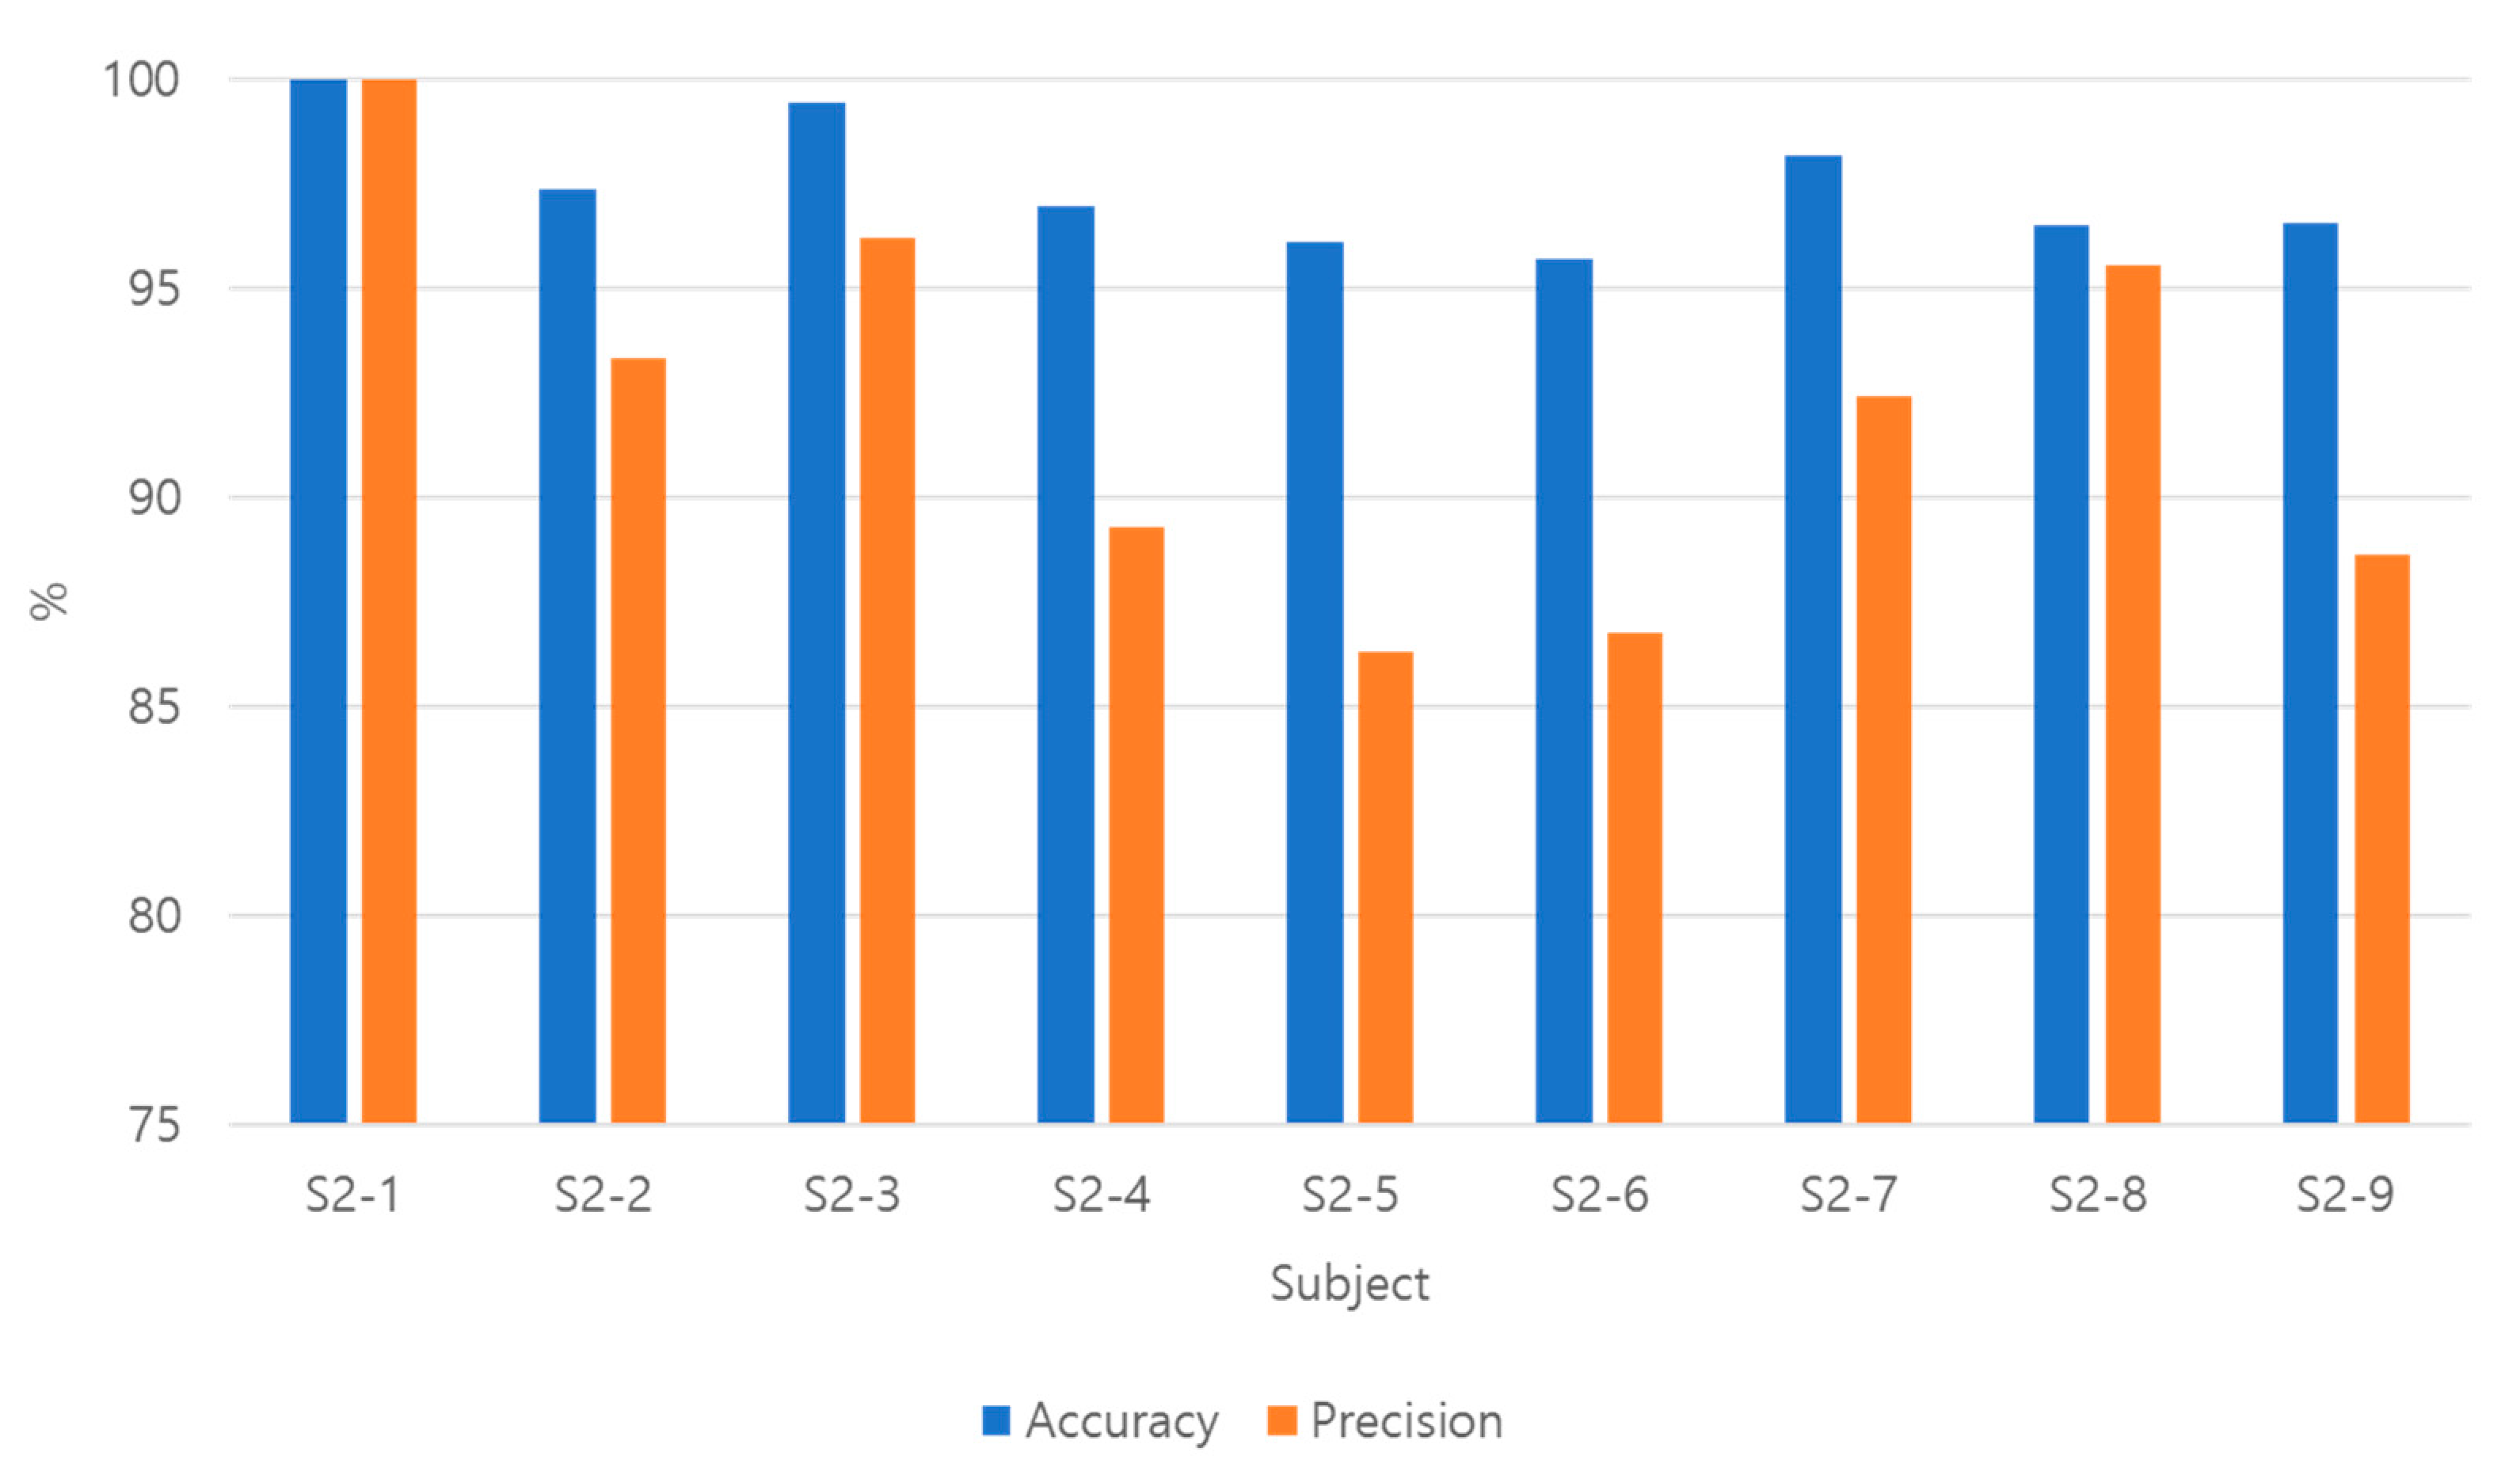
3.2. Experiment Result

For the performance evaluation, the eye gaze position recognition rate through the EOG signal and the click, delete, and backspace command recognition rate through the sEMG were calculated, and are shown in Figure 14 and Table 1. In the accuracy calculation, cases where the eye movement or biting motion occurred but was not recognized for interface input and cases where the input motion was incorrectly recognized as another motions were included in the errors. The recognition accuracy of the EOG signal was at least 86.32% and the maximum was 100%, and the average recognition accuracy was 92.04%. Participation in the first experiment (S1) did not appear to affect the recognition accuracy of this experiment (S2). For example, S2-8, who participated in S1, showed a high recognition accuracy of 95.54%, but S2-4 and S2-6, who also participated in S1, showed a relatively low recognition accuracy. On the other hand, S2-1 and S2-3 participated in the experiment for the first time, but showed very high recognition accuracy of 100% and 96.18%.
It was shown that the subjects with a relatively low accuracy were slower to identify the position of the next character to be input when keying the sentence compared to other subjects. In addition, they showed unclear eye movements several times to find the position of the character to be input.
Figure 15 and Table 2 show the typing speed for each subject in the virtual keyboard interface test. Typing speed was calculated in two ways. First, it was the ‘number of input letters per minute (NLPM)’ that simply evaluated how many letters were typed correctly in 1 min. This was calculated by dividing the number of written letters (here, 11) by the time it took for the subject to type the target sentence as in Equation (3).
NLMP [ / min ] = 11 t i m e [ s ] × 60 [ s / min ] ,
In the NLPM evaluation, if additional keystrokes were required to correct any typo, only the added time was considered, not the actual number of keys entered. Therefore, when a typo occurred, the NLPM was relatively very low.
The second typing speed calculation method used was ‘number of eMg inputs per minute (NMPM)’, which represents the number of command inputs from bite operation by the subject per minute. In the calculation of NLPM, it was effective to figure out how quickly the specified characters are typed, but the key input for correcting typos was not considered as valid typing, so their typing speed cannot be considered. As described before in the virtual keyboard interface, the typing for the function of key selection, backspace, and delete were performed through biting once, biting twice, and biting long operations, respectively. That is, if the EOG signal was used to position the cursor at the location of the desired letter (or letters block) among several letters (or letter blocks), the EMG signal was actually used to select a letter (or letters block) or type a key to correct typos. Therefore, the speed of the sEMG input operation was calculated as the number of biting operations per minute as shown in Equation (4).
NMPM [ / min ] = n u m b e r   o f   b i t e   o p e r a t i o n s t i m e [ s ] × 60 [ s / min ] ,
NMPM showed a higher value than NLPM because the time delay due to typos was not considered in the calculation. In addition, the fact that the biting operation is relatively easy and quick compared to eye movement is also presumed to be the reason for the higher value of NMPM compared to NLPM. When we analyzed the typing speed of the subjects, the subjects with high NLPM showed a high NMPM value as well. The average typing speed of all subjects was 5.75 [/min.] based on NLPM and 18.97 [/min.] based on NMPM. That is, an average of about 19 sEMG-based keys could be input per minute, and about 6 letters could be typed including the time for correcting typos. It was found that the speed difference between the subject with the slowest typing speed and the fastest subject was nearly doubled. As a result of test analysis of the subject S2-3, who had the slowest typing speed, it was found that some subjects had difficulty in finding the position of the alphabet to be typed in the designed virtual keyboard interface.
Table 3 summarizes the experimental results of the virtual keyboard in a confusion matrix. A total of 13,656 data were used for this analysis. In this table, the EOG signals generated from the eye movement and the sEMG signals generated from biting operations for the virtual keyboard interface were regarded as individual inputs, respectively. The confusion matrix-based accuracy and precision were calculated through Equations (5) and (6), respectively, and as a result, the accuracy was 97.19% and the precision was 90.51%.
Accuracy   = True   Positive + True   Negative True   Positive + True   Negative + False   Positive + False   Negative   ,  
Precision   = True   Positive True   Positive + False   Negative   ,
The type I error (false positives) was 13.4% and the type II error (false negatives) was 1.3%, which means that the error rate was different depending on whether the original data were positive or negative. That is, the error of erroneously predicting that there was an input command through eye movement in the case of no eye movement was 1.3%, and the rate of misrecognizing a specific angle of the eyeball through eye movement as another angle was 13.4%. This tendency mainly appeared when the precision of the subject was relatively low, as in subjects S2-4, S2-5, S2-6, and S2-9 of Figure 16. As a result of reviewing the recorded video of their eyes, unlike the eye movements seen during the individual tuning process, they showed a significantly slower eye movement in the process of searching for the alphabet position or checking the next input character for typing with the keyboard.
In this experiment, when the eye movement speed toward the keyboard was lower than the normal eye movement speed (typically less than 5° per second), involuntary eye movement or secondary small saccades occurred to fix the gaze on the target (keyboard) [24,25]. Therefore, when the gaze speed toward the target was slow, the eye movement was not smooth. For this reason, the EOG signal was divided into several steps as shown in Figure 17 because the eyeball movement was stopped at an angle smaller than the target angle and then moved again. Figure 17 shows the results of the four repetitions of three regular eye movements of “left 40° (L40)-right 80° (R80)-left 40° (L40)” and shows the phenomenon that occurs when the speed of the eyeball slowed down in the right 80° of eye movement. In Figure 17a, there are three peak values of MFDEOG corresponding to three eye movements, but Figure 17b–d shows more than three peak values occurred, which caused an error in the classification of the rotation angle of the eyeball. This phenomenon is presumed to be the cause of the difference between the accuracy and precision. That is, it can be explained that the precision was 6.68% lower than the accuracy because the error in the positive condition was larger than in the negative condition due to the error caused by the involuntary eye movement or secondary small saccades, as described above.
Table 4 shows the performance comparison between the proposed method and previous studies related to virtual keyboards using EOG. Each study used a slightly different shape of the virtual keyboard for an interface. Therefore, for more appropriate comparative evaluation, they were divided into three types (type A, B, and C) according to the characteristics of the virtual keyboard. Type A consists of a single screen, in which n horizontal and m vertical keyboards are visible at a glance. In other words, there is no need to change the screen to select a specific key. In this case, the number and arrangement order of the horizontally and vertically arranged keyboards are different. Types B and C are cases in which selectable keys are not included in one screen. That is, screen switching may be required to input the desired key. At this time, the case of using the vertical and horizontal movement of the eyeball and blinking as the interface input was classified into type B, and the case of using the left and right eye movement and other motions was classified into C. The method we propose is also included in type C.
The proposed method used only 3 electrodes, compared to the previous study, which required 4 to 6 electrodes, and user convenience was improved in that the electrode was located near the ear integrated with the bone conduction earphones, not around the eyes. In addition, in contrast to the general conventional interface methods that used the detection of up, down, left, and right eye movements, in this study, seven commands of interfaces were implemented through the classification of the saccadic angle of eye movement. In other words, it can be seen from the table that the proposed method implemented a relatively larger number of command interfaces with the smallest number of electrodes among them. In terms of typing speed, the results of type A were generally excellent. The reason can be presumed to be that, in the case of type A, the selection was possible on one screen without the need to change the screen to select a specific character. In comparison, in the case of our proposed method, similar to type C, space was needed to ensure an angular division of at least 20 degrees between letters, so it was not possible to express all the keys on one screen. Therefore, it was necessary to change the screen to select a specific character, and this became a factor that lowered the typing speed.. However, it was found that the typing speed of the proposed method was not relatively slow when considering the subjects familiar with the interface.

4. Conclusions

In this paper, we propose the new HCI method using a bone conduction integrated bio-signal acquisition system. Instead of the conventional method of attaching electrodes around the eyes to acquire EOG signals, in this study, horizontal EOG signals were acquired through electrodes integrated into the bone conduction headphones to enhance the interface usability. In addition, the sEMG signal generated during the biting operation was simultaneously measured with the same electrode for interface input. That is, it was configured to simultaneously acquire EOG and sEMG signals with only three electrodes, including each electrode located on the left and right of the bone conduction headphones and one reference electrode located on the back of the neck. The performance of the proposed interface method was evaluated by applying it to a virtual keyboard on a personal computer designed as a quinary keyboard type. The proposed interface method can deliver 11 commands by simply using the horizontal eye movement and the biting motion. Therefore, the proposed interface system can be applied to various HCI and HMI fields as well as virtual keyboard applications. In addition, it is expected that the proposed system can be used as an interface method not only for the general public but also for people with severe disabilities such as quadriplegia.

Author Contributions

Conceptualization, T.S.K.; methodology, H.N.J. and T.S.K.; software, H.N.J. and H.G.C.; validation, H.N.J., H.G.C., S.H.H. and T.S.K.; formal analysis, S.W.P. and T.S.K.; writing—original draft preparation, all authors; writing—review and editing, T.S.K.; project administration, T.S.K.; funding acquisition, T.S.K. All authors have read and agreed to the published version of the manuscript.

Funding

This study was supported by the Research Fund, 2020 of The Catholic University of Korea (M-2020-B0002-00122). This research was supported by Basic Science Research Program through the National Research Foundation of Korea (NRF) funded by the Ministry of Education (2018R1D1A1B07042955).

Institutional Review Board Statement

The study was conducted in accordance with the Declaration of Helsinki, and approved by the Institutional Review Board of the Catholic University of Korea (protocol code: 1040395-201806-02 and date of approval: 12 July 2018).

Informed Consent Statement

Informed consent was obtained from all subjects involved in the study.

Conflicts of Interest

The authors declare no conflict of interest.

References

  1. Postelnicu, C.; Girbacia, F.; Talaba, D. EOG-based visual navigation interface development. Expert Syst. Appl. 2012, 39, 10857–10866. [Google Scholar] [CrossRef]
  2. López, A.; Fernández, M.; Rodríguez, H.; Ferrero, F.; Postolache, O. Development of an EOG-based system to control a serious game. Measurement 2018, 127, 481–488. [Google Scholar] [CrossRef]
  3. Ang, A.M.S.; Zhang, Z.G.; Hung, Y.S.; Mak, J.N.F. A User-Friendly Wearable Single-Channel EOG-Based Human-Computer Interface for Cursor Control. In Proceedings of the International IEEE/EMBS Conference on Neural Engineering (NER), Montpellier, France, 22–24 July 2015. [Google Scholar] [CrossRef]
  4. Barbara, N.; Camilleri, T.A.; Camilleri, K.P. Comparative Performance Analysis of a Commercial Wearable EOG Glasses for an Asynchronous Virtual Keyboard. In Proceedings of the International BCS Human Computer Interaction Conference (HCI), Belfast, UK, 4–6 July 2018. [Google Scholar] [CrossRef]
  5. Manabe, H.; Fukumoto, M.; Yagi, T. Conductive rubber electrodes for earphone-based eye gesture input interface. Pers. Ubiquit. Comput. 2015, 19, 143–154. [Google Scholar] [CrossRef]
  6. Hládek, Ľ.; Porr, B.; Brimijoin, W.O. Real-time estimation of horizontal gaze angle by saccade integration using in-ear electrooculography. PLoS ONE 2018, 13, e0190420. [Google Scholar] [CrossRef] [PubMed]
  7. Keskinoğlu, C.; Aydın, A. EOG—Based Computer Control System for People with Mobility Limitations. Eur. J. Sci. Technol. 2021, 26, 256–261. [Google Scholar] [CrossRef]
  8. Yamagishi, K.; Hori, J.; Miyakawa, M. Development of EOG Based Communication System Controlled by Eight Directional Eye Movements. In Proceedings of the 28th IEEE EMBS Annual International Conference, New York, NY, USA, 30 August–3 September 2006. [Google Scholar] [CrossRef]
  9. Sakurai, K.; Yan, M.; Tanno, K.; Tamura, H. Gaze Estimation Method Using Analysis of Electrooculogram Signals and Kinect Sensor. Comput. Intell. Neurosci. 2017, 2017, 2074752. [Google Scholar] [CrossRef] [PubMed]
  10. Dhillon, H.S.; Singla, R.; Rekhi, N.S.; Jha, R. EOG and EMG Based Virtual Keyboard: A Brain-Computer Interface. In Proceedings of the IEEE International Conference on Computer Science and Information Technology, Beijing, China, 8–11 August 2009. [Google Scholar] [CrossRef]
  11. Banerjee, A.; Datta, S.; Pal Konar, A.; Tibarewala, D.N.; Janarthanan, R. Classifying Electrooculogram to Detect Directional Eye Movements. Procedia Technol. 2013, 10, 67–75. [Google Scholar] [CrossRef]
  12. Heide, W.; Koenig, E.; Trillenberg, P.; Kömpf, D.; Zee, D.S. Electrooculography: Technical standards and applications. The Inter-national Federation of Clinical Neurophysiology. Electroencephalogram Clin. Neurophysiol. Suppl. 1999, 52, 223–240. [Google Scholar]
  13. Yang, J.-J.; Gang, G.W.; Kim, T.S. Development of EOG-Based Human Computer Interface (HCI) System Using Piecewise Linear Approximation (PLA) and Support Vector Regression (SVR). Electronics 2018, 7, 38. [Google Scholar] [CrossRef]
  14. Jamal, M. Signal Acquisition Using Surface EMG and Circuit Design Considerations for Robotic Prosthesis. In Computational Intelligence in Electromyography Analysis: A Perspective on Current Applications and Future Challenges; Naik, G., Ed.; IntechOpen: London, UK, 2012. [Google Scholar] [CrossRef]
  15. INA116 Datasheet. Available online: https://www.ti.com/product/INA116 (accessed on 27 July 2022).
  16. Kumar, D.; Poole, E. Classification of EOG for Human Computer Interface. In Proceedings of the Second Joint 24th Annual Conference and the Annual Fall Meeting of the Biomedical Engineering Society, Engineering in Medicine and Biology, Houston, TX, USA, 23–26 October 2002. [Google Scholar] [CrossRef]
  17. Shin, Y.; Lim, H.; Kang, M.; Seong, M.; Cho, H.; Kim, J. Normal range of eye movement and its relationship to age. Acta Ophthalmol. 2016, 94, S256. [Google Scholar] [CrossRef]
  18. Boghen, D.; Troost, B.T.; Daroff, R.B.; Dell’Osso, L.F.; Birkett, J.E. Velocity characteristics of normal human saccades. Invest Ophthalmol. 1974, 13, 619–623. [Google Scholar]
  19. Yee, R.D.; Schiller, V.L.; Lim, V.; Baloh, F.G.; Baloh, R.W.; Honrubia, V. Velocities of vertical saccades with different eye movement recording methods. Invest Ophthalmol Vis Sci. 1985, 26, 938–944. [Google Scholar]
  20. Yu, D.; Cho, H.G.; Kim, S.; Moon, B. Application of eye tracker for assessing saccadic eye movements. J. Korean Ophthalmic Opt. Soc. 2018, 23, 135–141. [Google Scholar] [CrossRef]
  21. Leigh, R.J.; Zee, D.S. The Neurology of Eye Movements, 5th ed.; Oxford University Press: New York, NY, USA, 2015; pp. 189–220. [Google Scholar]
  22. Hosni, S.M.; Shedeed, H.A.; Mabrouk, M.S.; Tolba, M.F. EEG-EOG based Virtual Keyboard: Toward Hybrid Brain Computer Interface. Neuroinformatics 2019, 17, 323–341. [Google Scholar] [CrossRef] [PubMed]
  23. Kherlopian, A.R.; Gerrein, J.P.; Yue, M.; Kim, K.E. Electrooculogram based System for Computer Control using A Multiple Feature Classification Model. In Proceedings of the 28th IEEE EMBS Annual International Conference, New York, NY, USA, 30 August–3 September 2006. [Google Scholar] [CrossRef]
  24. Lee, T.; Sung, K. Basics of Eye Movements and Nystagmus. J. Korean Bal. Soc. 2004, 3, 7–24. [Google Scholar]
  25. Ohl, S.; Brandt, S.A.; Kliegl, R. Secondary (micro-)saccades: The influence of primary saccade end point and target eccentricity on the process of postsaccadic fixation. Vis. Res. 2011, 51, 2340–2347. [Google Scholar] [CrossRef] [PubMed]
  26. Saravanakumar, D.; Vishnupriya, R.; Reddy, M.R. A Novel EOG based Synchronous and Asynchronous Visual Keyboard System. In Proceedings of the IEEE EMBS International Conference on Information Technology Applications in Biomedicine, Chicago, IL, USA, 19–22 September 2019. [Google Scholar] [CrossRef]
  27. Heo, J.; Yoon, H.; Park, K.S. A Novel Wearable Forehead EOG Measurement System for Human Computer Interfaces. Sensors 2017, 17, 1485. [Google Scholar] [CrossRef] [PubMed]
  28. Tangsuksant, W.; Aekmunkhongpaisal, C.; Cambua, P.; Charoenpong, T.; Chanwimalueang, T. Directional Eye Movement Detection System for Virtual Keyboard Controller. In Proceedings of the 5th 2012 Biomedical Engineering International Conference, Muang, Thailand, 5–7 December 2012. [Google Scholar] [CrossRef]
  29. Usakli., A.B.; Gurkan, S.; Aloise, F.; Vecchiato, G.; Babiloni, F. A Hybrid Platform Based on EOG and EEG Signals to Restore Communication for Patients Afflicted with Progressive Motor Neuron Diseases. In Proceedings of the Annual International Conference of the IEEE Engineering in Medicine and Biology Society, Minneapolis, MN, USA, 3–6 September 2009. [Google Scholar] [CrossRef]
  30. López, A.; Ferrero, F.; Yangüela, D.; Álvarez, C.; Postolache, O. Development of a Computer Writing System Based on EOG. Sensors 2017, 17, 1505. [Google Scholar] [CrossRef] [PubMed]
  31. Barbara, N.; Camilleri, T.A. Interfacing with a Speller Using EOG Glasses. In Proceedings of the IEEE International Conference on Systems, Man, and Cybernetics (SMC), Budapest, Hungary, 9–12 October 2016. [Google Scholar] [CrossRef]
Figure 1. The corneo-retinal potential changes according to horizontal eye movement.
Electronics 11 02561 g001
Figure 2. Block diagram of EOG and EMG-based interface system.
Electronics 11 02561 g002
Figure 3. Positions of electrodes for EOG and EMG measurement: (a) side view; (b) rear view.
Electronics 11 02561 g003
Figure 4. Simplified schematic of the designed circuit for bio-signal acquisition.
Electronics 11 02561 g004
Figure 5. Comparison of EOG signals: (a) analog filtered EOG signal (AFEOG); (b) digital filtered EOG signal (DFEOG) using the AFFOG signal.
Electronics 11 02561 g005
Figure 6. Deviation of EOG for feature extraction: (a) DEFEOG for six subjects; (b) MFDEOG for six subjects.
Electronics 11 02561 g006aElectronics 11 02561 g006b
Figure 7. Comparison of the maximum and minimum of p-MFDEOG for 10 subjects.
Electronics 11 02561 g007
Figure 8. Pseudo codes of threshold calculation for each angle of eye movement.
Electronics 11 02561 g008
Figure 9. Pseudo codes for classification of biting inputs.
Electronics 11 02561 g009
Figure 10. Classification of sEMG signals from three types of biting operation.
Electronics 11 02561 g010
Figure 11. Example of key typing sequence of character ‘H’: (a) selection of middle block (light blue block) by gazing operation; (b) split of letters into five blocks; (c) selection of the desired block by moving one’s eye 20° to the left; (d) split of letter box again; (e) typing of letter ‘H’ by biting once action.
Electronics 11 02561 g011
Figure 12. Experiment environment.
Electronics 11 02561 g012
Figure 13. Timetable for virtual keyboard interface test.
Electronics 11 02561 g013
Figure 14. Command recognition accuracy in virtual keyboard interface test.
Electronics 11 02561 g014
Figure 15. Comparison of typing speed per subject.
Electronics 11 02561 g015
Figure 16. Accuracy and precision for each subject.
Electronics 11 02561 g016
Figure 17. Example of repeated eye movements of L40-R80-L40: (a) normal eye movement with three peaks of MFDEOG; (bd) abnormal eye movements with more than three peaks of MFDEOG.
Electronics 11 02561 g017
Table 1. EOG and sEMG signal based command accuracy results in virtual keyboard interface test.
SubjectEOGsEMG
S2-110091.7
S2-293.397.4
S2-396.1897.9
S2-489.2799.4
S2-586.3297.8
S2-686.7695.6
S2-792.495.7
S2-895.5498.4
S2-988.6391
Average92.0496.10
Table 2. Typing speed per subject.
SubjectNLPMNMPM
S2-14.4613.38
S2-27.0822.5
S2-33.9812.7
S2-45.618.48
S2-54.5618.32
S2-65.6618.69
S2-74.8215.94
S2-89.4329.6
S2-96.1821.11
Average5.7518.97
Table 3. Confusion matrix of virtual keyboard experiment.
Total: 13,656Prediction PositivePrediction Negative
Real positive1478 (TP)155 (FN)
Real negative229 (FP)11,794 (TN)
Table 4. Comparison of EOG-based virtual keyboard interfaces with those in previous works.
AuthorTypeActions for Interface (Number of Commands)Total Number of CommandsAccuracy (%)Typing Speed
(Letters/Min)
Number of ElectrodeTest Text
proposedCLeft (4), Right (4), Biting (3)1197.195.75–18.973hello world
[8]AUp, Up-Right, Right, Down-Right, Down, Down-left, Left, Up-left, Blink990.412.14good morning
[23]CLeft, Right, Eyebrow3N/A-3-65zebra, noisy, igloo, input, punch, pixel
[26]AUp, Down, Left, Right, Wink (2), Blink (2)3694.2–98.7812.42–17.145human computer interface
[27]AUp, Down, Left, Right, Blink (2)691.25–91.438.68–10.814Seoul national university
[28]AUp, Down, Left, Right, Blink595.202.376hello
[29]AUp, Down, Left, Right, Blink59512.155water
[30]BUp, Down, Left, Right, Blink5935.885hello world
[31]BUp, Down, Left, Right, Blink590.597.115water, good morning, day 0
Publisher’s Note: MDPI stays neutral with regard to jurisdictional claims in published maps and institutional affiliations.

