Article

An Effective Orchestration for Fingerprint Presentation Attack Detection

1
Department of Computer Engineering, Hongik University, Seoul 04066, Korea
2
Department of Electronic and Electrical Engineering, Hongik University, Seoul 04066, Korea
*
Author to whom correspondence should be addressed.
Electronics 2022, 11(16), 2515; https://doi.org/10.3390/electronics11162515
Submission received: 11 July 2022 / Revised: 8 August 2022 / Accepted: 9 August 2022 / Published: 11 August 2022
(This article belongs to the Special Issue Advanced Security Protection Mechanism in Networks)

Abstract

:
Fingerprint presentation attack detection has become significant due to a wide-spread usage of fingerprint authentication systems. Well-replicated fingerprints easily spoof the authentication systems because their captured images do not differ from those of genuine fingerprints in general. While a number of techniques have focused on fingerprint presentation attack detection, they suffer from inaccuracy in determining the liveness of fingerprints and performance degradation on unknown types of fingerprints. To address existing limitations, we present a robust fingerprint presentation attack detection method that orchestrates different types of neural networks by incorporating a triangular normalization method. Our method has been evaluated on a public benchmark comprising 13,000 images with five different fake materials. The evaluation exhibited our method’s higher accuracy in determining the liveness of fingerprints as well as better generalization performance on different types of fingerprints compared to existing techniques.

1. Introduction

Fingerprint authentication has been widely used in mobile devices, mobile payment systems, and gate access control [1,2]. With the adoption of fingerprint authentication systems, the importance of fingerprint presentation attack detection (PAD) has grown significantly. Recent reports indicate that fake fingerprints crafted from a variety of materials, including paper, silicone, gelatin, wood glue, and play-doh, can readily deceive existing mobile authentication systems [3]. This is due to the fact that well-replicated fake fingerprints appear to be genuine ones when capturing their images via image sensors. Some types of fake fingerprints are even easy to generate. For example, via YouTube, end-users are able to access a variety of instructions for crafting fake fingerprints using easy-to-buy ingredients (e.g., play-doh and wood glue). Considering the widespread usage of fingerprint authentication systems, it is required to develop a robust method for fingerprint PAD.
A large volume of research has focused on fingerprint PAD. Prior methods have mainly leveraged image feature descriptors extracted from target fingerprints, such as brightness, contrast, frequency, or local binary patterns [4,5,6,7,8,9,10,11]. Convolutional neural networks (CNN) have also become popular in fingerprint PAD [12,13,14,15,16]. CNN comprises convolution layers which convolve an input image by general matrix multiplication. When enough data are available, CNN typically outperforms approaches based on feature descriptors in terms of image classification [14]. However, since those methods typically examine fingerprints from a singular perspective, they provide low detection accuracy and performance degradation on unknown types of fingerprints. Recent methods are attempting to fuse different methods by analyzing multiple feature descriptors and incorporating multiple CNN models [5,17,18,19]. However, their fusion performance is still limited in terms of accuracy and generalization performance on unknown types of fingerprints. Therefore, it is required to develop a robust fusion method for fingerprint PAD, which addresses the limitations of existing methods.
To overcome the aforementioned challenges, we designed a new fusion technique that effectively orchestrates CNN and feature-based neural network (FNN). Our method processes an input fingerprint image via two different types of network models: CNN and FNN. After inferencing via each network, the result scores are associated using our score-level orchestration mechanism, and the liveness of the input image is determined. Our technique is distinguished from prior works because it effectively orchestrates multiple PAD methods by incorporating a triangular normalization, which improves detection accuracy and generalization performance. In addition, we designed a set of effective network architectures, each of which is capable of processing in a reasonable amount of time and provides improved detection performance.
This research makes the following contributions: (1) We proposed a novel method that effectively orchestrates different PAD methods for analyzing the liveness of fingerprints. (2) We propose a novel score-level fusion mechanism that successfully associates multiple neural network models for PAD. (3) We developed efficient network architectures, each of which improves fingerprint PAD performance in terms of accuracy and generalization. (4) We developed a prototype tool that actually implements the proposed method. (5) We performed extensive evaluations involving real-world datasets and prior methods, and we systematically analyzed the results.
The rest of this paper is structured as follows. Section 2 provides a discussion of related work, which motivate our research. Section 3 details our approach and Section 4 presents the evaluations of our method. Section 5 discusses the significance of our method and threats to the validity of our study. Section 6 concludes this paper and presents future research directions.

2. Related Work

Fingerprint PAD methods are basically categorized into two types: hardware-based and software-based methods [20]. The hardware-based methods employ extra sensors for obtaining supplementary information, such as blood pressure, blood flow, pulse, or odor. Meanwhile, the software-based methods utilize image features extracted from the captured image of fingerprints, such as ridge continuity, strength, or intensity. In general, the software-based methods are more popular because they are relatively cheaper, faster, and more flexible to employ. The software-based methods basically do not require extra sensors for additional information other than the fingerprint image. Our work has mainly focused on software-based analysis for fingerprint PAD. There exists a large amount of work on software-based approaches for fingerprint PAD. In this section, we introduce the selected existing methods for software-based fingerprint PAD: feature-based, CNN-based, and fusion approaches.

2.1. Feature-Based Approach

Analyzing image feature descriptors can be divided into holistic-based, which analyzes an entire image, and local-based, which analyzes local patches of a target image and combines them into a feature vector. According to the evaluation on public benchmarks [21], in general, the accuracy of PAD by using holistic features is lower than that by using local features [5,8]. In typical methods using feature descriptors, the extracted features are essentially processed via classifiers (e.g., adaboost, support vector machine, and neural network) in order to infer a classification result.
The methods using holistic features are based on the observation of quality differences between live and fake fingerprints. Schuckers et al. utilized the texture coarseness to highlight the differences between live and fake fingerprints [4]. Coli et al. introduced a power spectrum-based method that analyzes the frequencies of fingerprint images by using the Fourier Transform [6]. They presented that live fingerprints show higher frequencies than fake ones. Marasco et al. compared the temporal differences between successively captured fingerprints based on the changes of intensity and texture statistics [7].
Local features are based on the statistics of the local pattern variations, such as Local Binary Pattern (LBP) [22], Weber Local Descriptor (WLD), Local Phase Quantization (LPQ) [23], and Scale-Invariant Feature Transform (SIFT) [11]. Recently, multiple features have been combined in order to compensate for each other in extracting characteristics of fingerprints. Local Contras Phase Descriptor (LCPD) is a joint distribution of WLD and LPQ [5]. Gragnaniello et al. implemented the feature combinations, such as WLD and LPQ [9]. Ghiani et al. reported that a combination of LPQ and LBP showed better accuracy in liveness detection compared to using a single feature [10]. Husseis et al. proposed a novel mechanism that utilizes the dynamic texture of fingerprints as a basis for discrimination [24]. Their approach mainly focused on fingerprint dynamic features in spatio-temporal and spectral domains rather than static fingerprint patterns. In addition to the aforementioned techniques, various types of image pre-processing techniques (e.g., contrast normalization, frequency filtering, and region of interest extraction) have been proposed without notable success [14].

2.2. CNN-Based Approach

Convolutional neural network (CNN) is a class of deep neural networks. CNN has been most commonly used in image classification, face detection, object detection, malware detection, intrusion detection, as well as liveness detection [12,25,26,27,28]. The recent success of CNN in the field of image classification has led researchers to utilize deep neural network architectures for fingerprint PAD [13].
CNN-based fingerprint analysis methods can also be divided into holistic-based [14,29,30], which uses entire images, and local-based, which divides an image into small patches before inferencing via CNN [31,32]. Nogueira et al. and Marasco et al. used general-purpose CNN architectures, VGG-19 [14,29] and GoogLeNet [30], respectively, in identifying fake fingerprints. Nogueira et al. showed that pre-trained CNNs yield better results in fingerprint PAD without particular architecture design or hyper-parameter selection [14]. D. Menotti et al. introduced a new CNN architecture, Spoofnet, which uses optimized hyper-parameters and weights obtained by a back-propagation algorithm [15]. Xu et al. presented a new CNN architecture for spoofing attacks by incorporating a long short-term memory (LSTM) layer over the fully connected layers [33]. However, existing CNN-based methods are still limited in terms of identification accuracy and generalization performance.

2.3. Fusion Approach
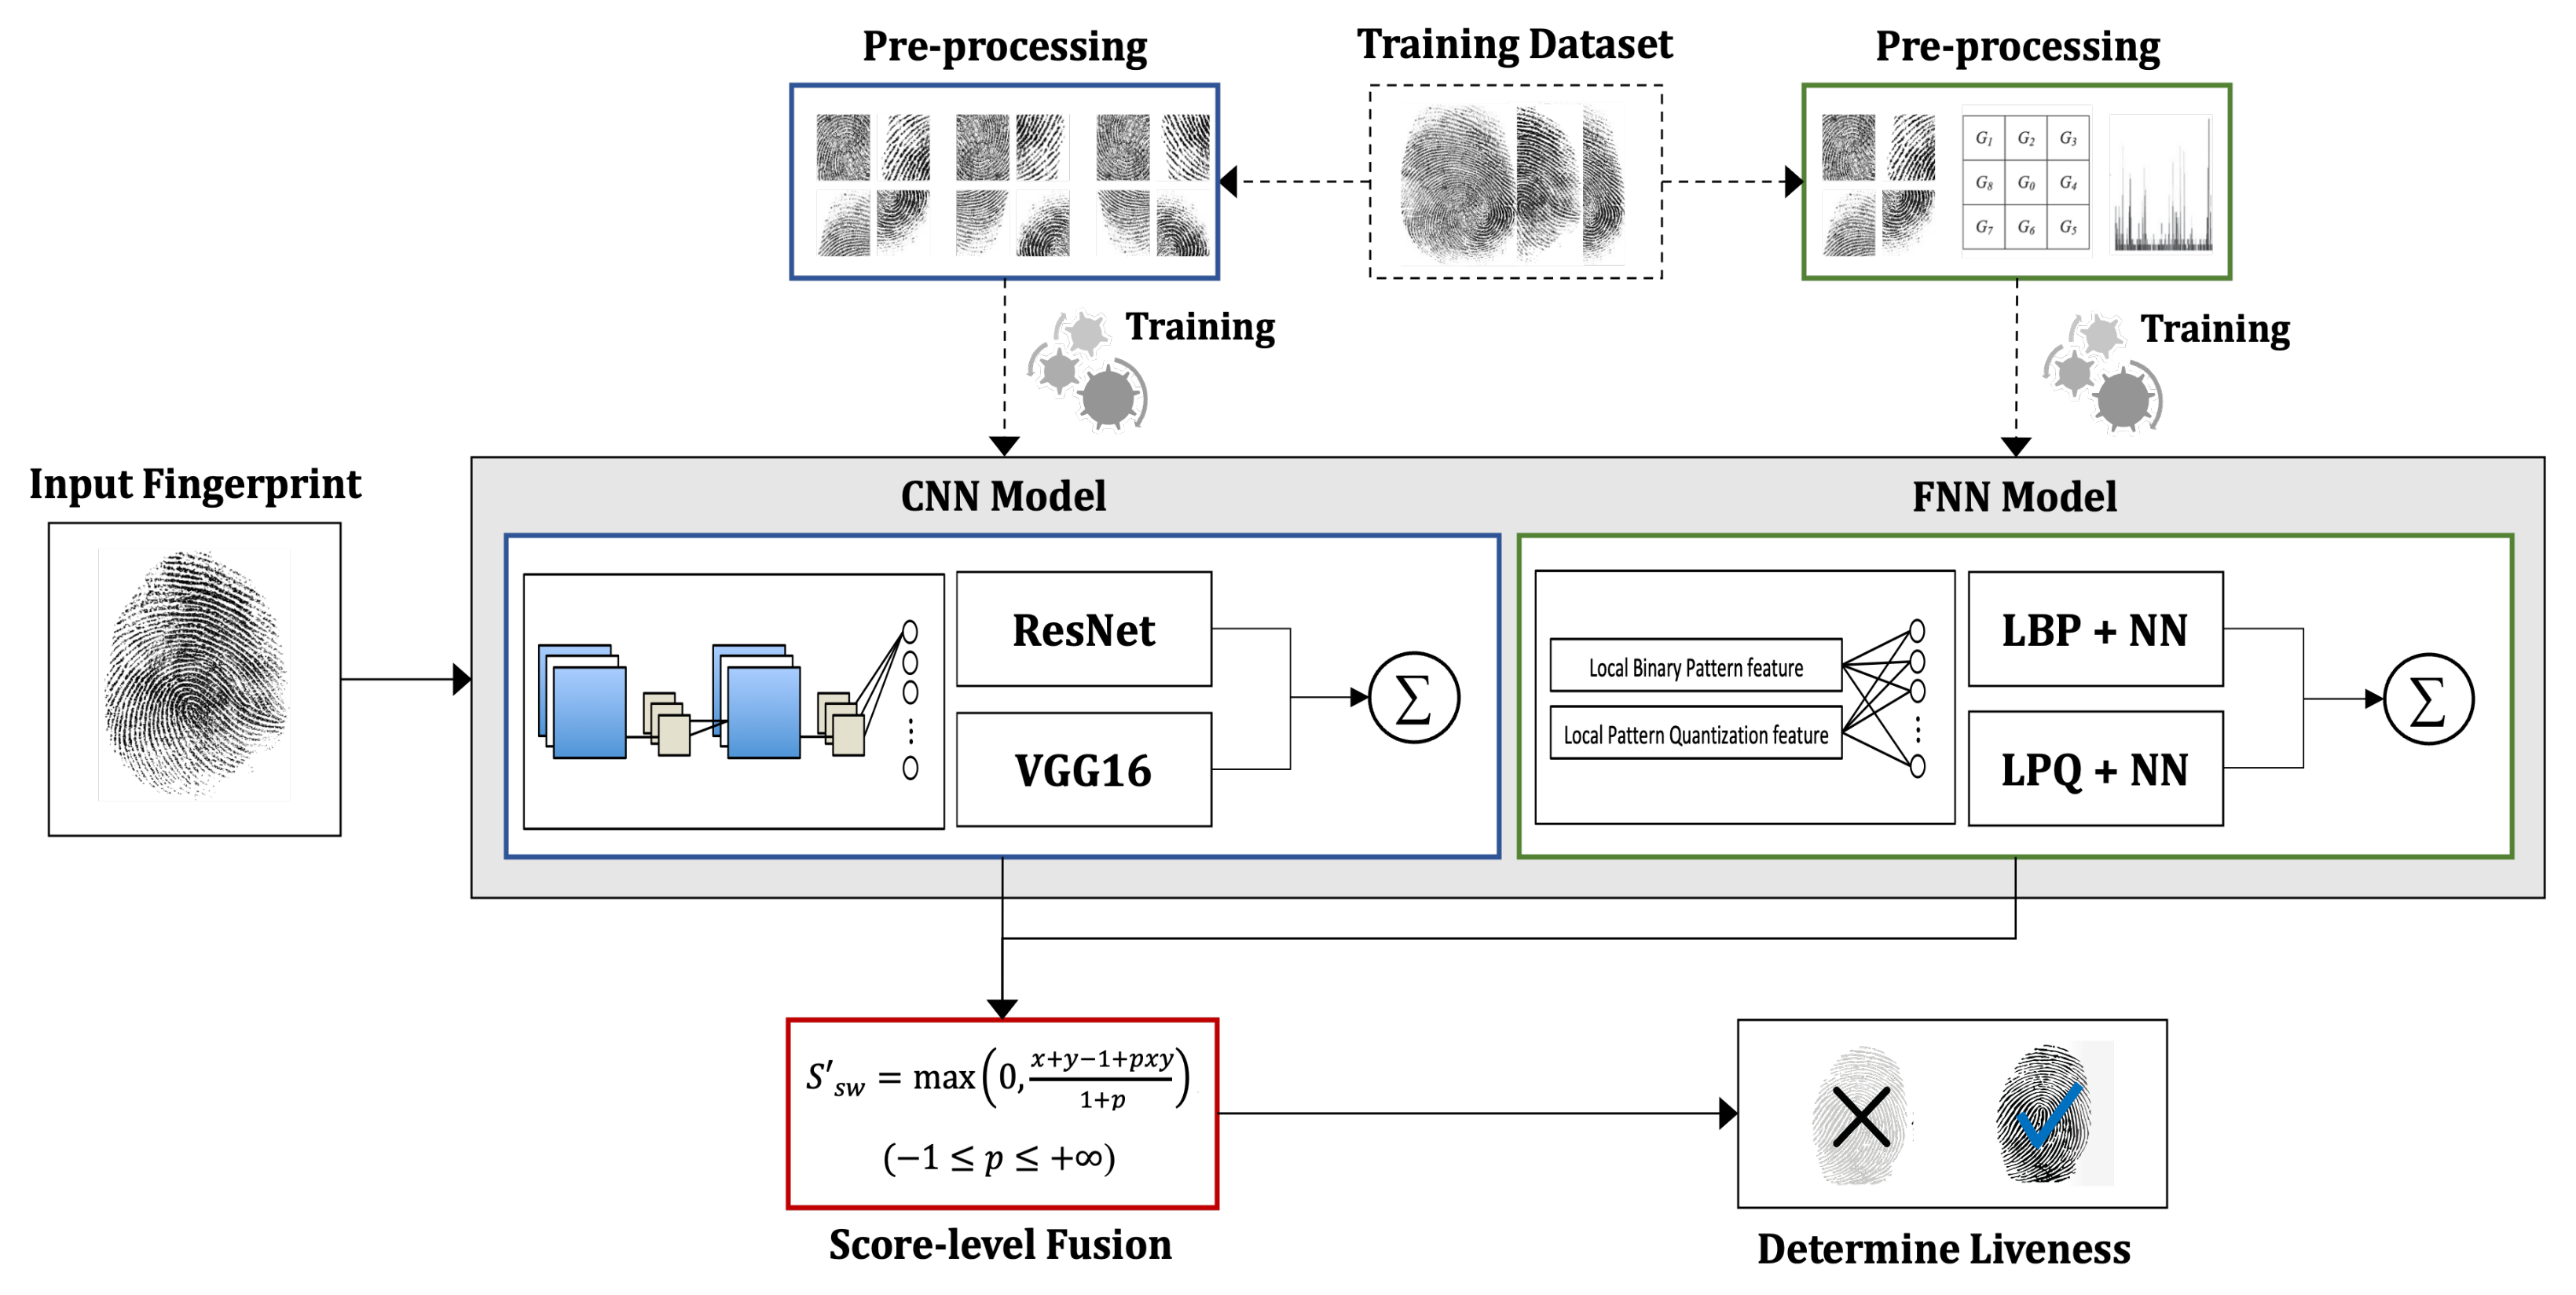
To overcome the aforementioned limitations, hybrid techniques [13,17,18,19,34,35,36,37,38,39,40] combining multiple methods have been studied. For the hybrid techniques, fusion can be implemented at different levels: sensor-level, decision-level, feature-level, and score-level.
For sensor-level fusion [36], images obtained from multiple sensors are fused to determine its liveness. Sajjad et al. introduced a hybrid technique that authenticates via fingerprints, palm and vein prints, and detects spoofing via CNN models [13]. However, multi-sensor data may cause compatibility issues and require a high processing time for fusion. For decision-level fusion [37], decisions passed from multiple modules are combined to determine the liveness. However, decision-level fusion is highly dependent on each module’s performance because decision information is too abstract to fine-tune detection performance. Feature-level fusion [38] provides relatively detailed information of fingerprints, which is based on transformation of features [38], shapes of features [39] or encoded features [40]. However, feature-level fusion requires additional transformation functions and ranking information for feature sets [25,26]. Furthermore, once each module is trained, it is challenging to fine-tune its detection performance, because it may require additional training iterations.
Score-level fusion [18,41] combines the liveness scores obtained from multiple modules and determines the liveness based on the fused score. Score-level fusion is popular because the liveness scores are easy to fuse, and it enables additional accuracy improvement by fine-tuning score-level weights in a common scale. A number of score-level fusion techniques have been studied based on arithmetic operations (i.e., addition, subtraction, maximum, minimum, or median) [18,19]. Chugh et al. proposed a CNN-based approach utilizing centered and aligned patches extracted around fingerprint minutiae [42]. Their approach derives a final decision by averaging the spoof scores over the individual patch outputs of the CNN model. Nogueira et al. reported that combining CNN with random weights and LBP, which is multi-scale variant [34], achieves good results in fingerprint PAD benchmarks [29]. However, existing techniques are too simple to fine-tune the relative importance of each module. Moreover, they have not primarily considered maximizing the performance of individual modules. Therefore, a robust score-level fusion method is required to overcome the limitations of the existing methods.

3. Proposed Method

We propose a new method for fingerprint PAD by effectively orchestrating different network models. Our method is based on static image analysis, which inspects the texture information of the input images. As shown in Figure 1, our method basically combines two types of neural network models: convolutional neural network (CNN) and feature-based neural network (FNN). Each model is trained independently after processing a given training dataset into a trainable form. For an input fingerprint, each trained model processes it and outputs its liveness score, respectively. Then the liveness scores are orchestrated by using a pre-defined equation which is based on the triangular normalization method. With the output of score-level fusion, our method determines the liveness of the input fingerprint. The details of our method are explained in the following subsections.

3.1. Data Augmentation

Considering the fact that fingerprint datasets for training may be taken in limited conditions, it is required to reasonably extend the dataset in order to train our network models to be robust to various conditions. Thus, it is required to examine various conditions of images, such as orientation, location, and scale [43]. In this research, we primarily consider two conditions: orientation and location, because other types of conditions (e.g., noise, scale, and intensity) are basically covered by the feature descriptors our method uses. Our method performs data augmentation on the training dataset as follows. Given a dataset, each image is rotated by 90 increments in the range of 0 to 360 . A single image is then augmented with three rotated images, and each rotated image is randomly cropped to a pre-defined size. The positions of the crops are randomly determined by applying a two-dimensional normal distribution in the segmented fingerprint area. Consequently, a single image generates three rotated images, and a set of cropped images is generated from each rotated image. By considering different rotations and crops, the augmented dataset enables our network models to learn different orientations of the same fingerprints and the characteristics of fingerprint patches at various locations. Existing studies have shown that it is effective to utilize different features obtained from different input images [44]. Hence, to maximize the PAD performance of our method, each network was trained using different random crops.

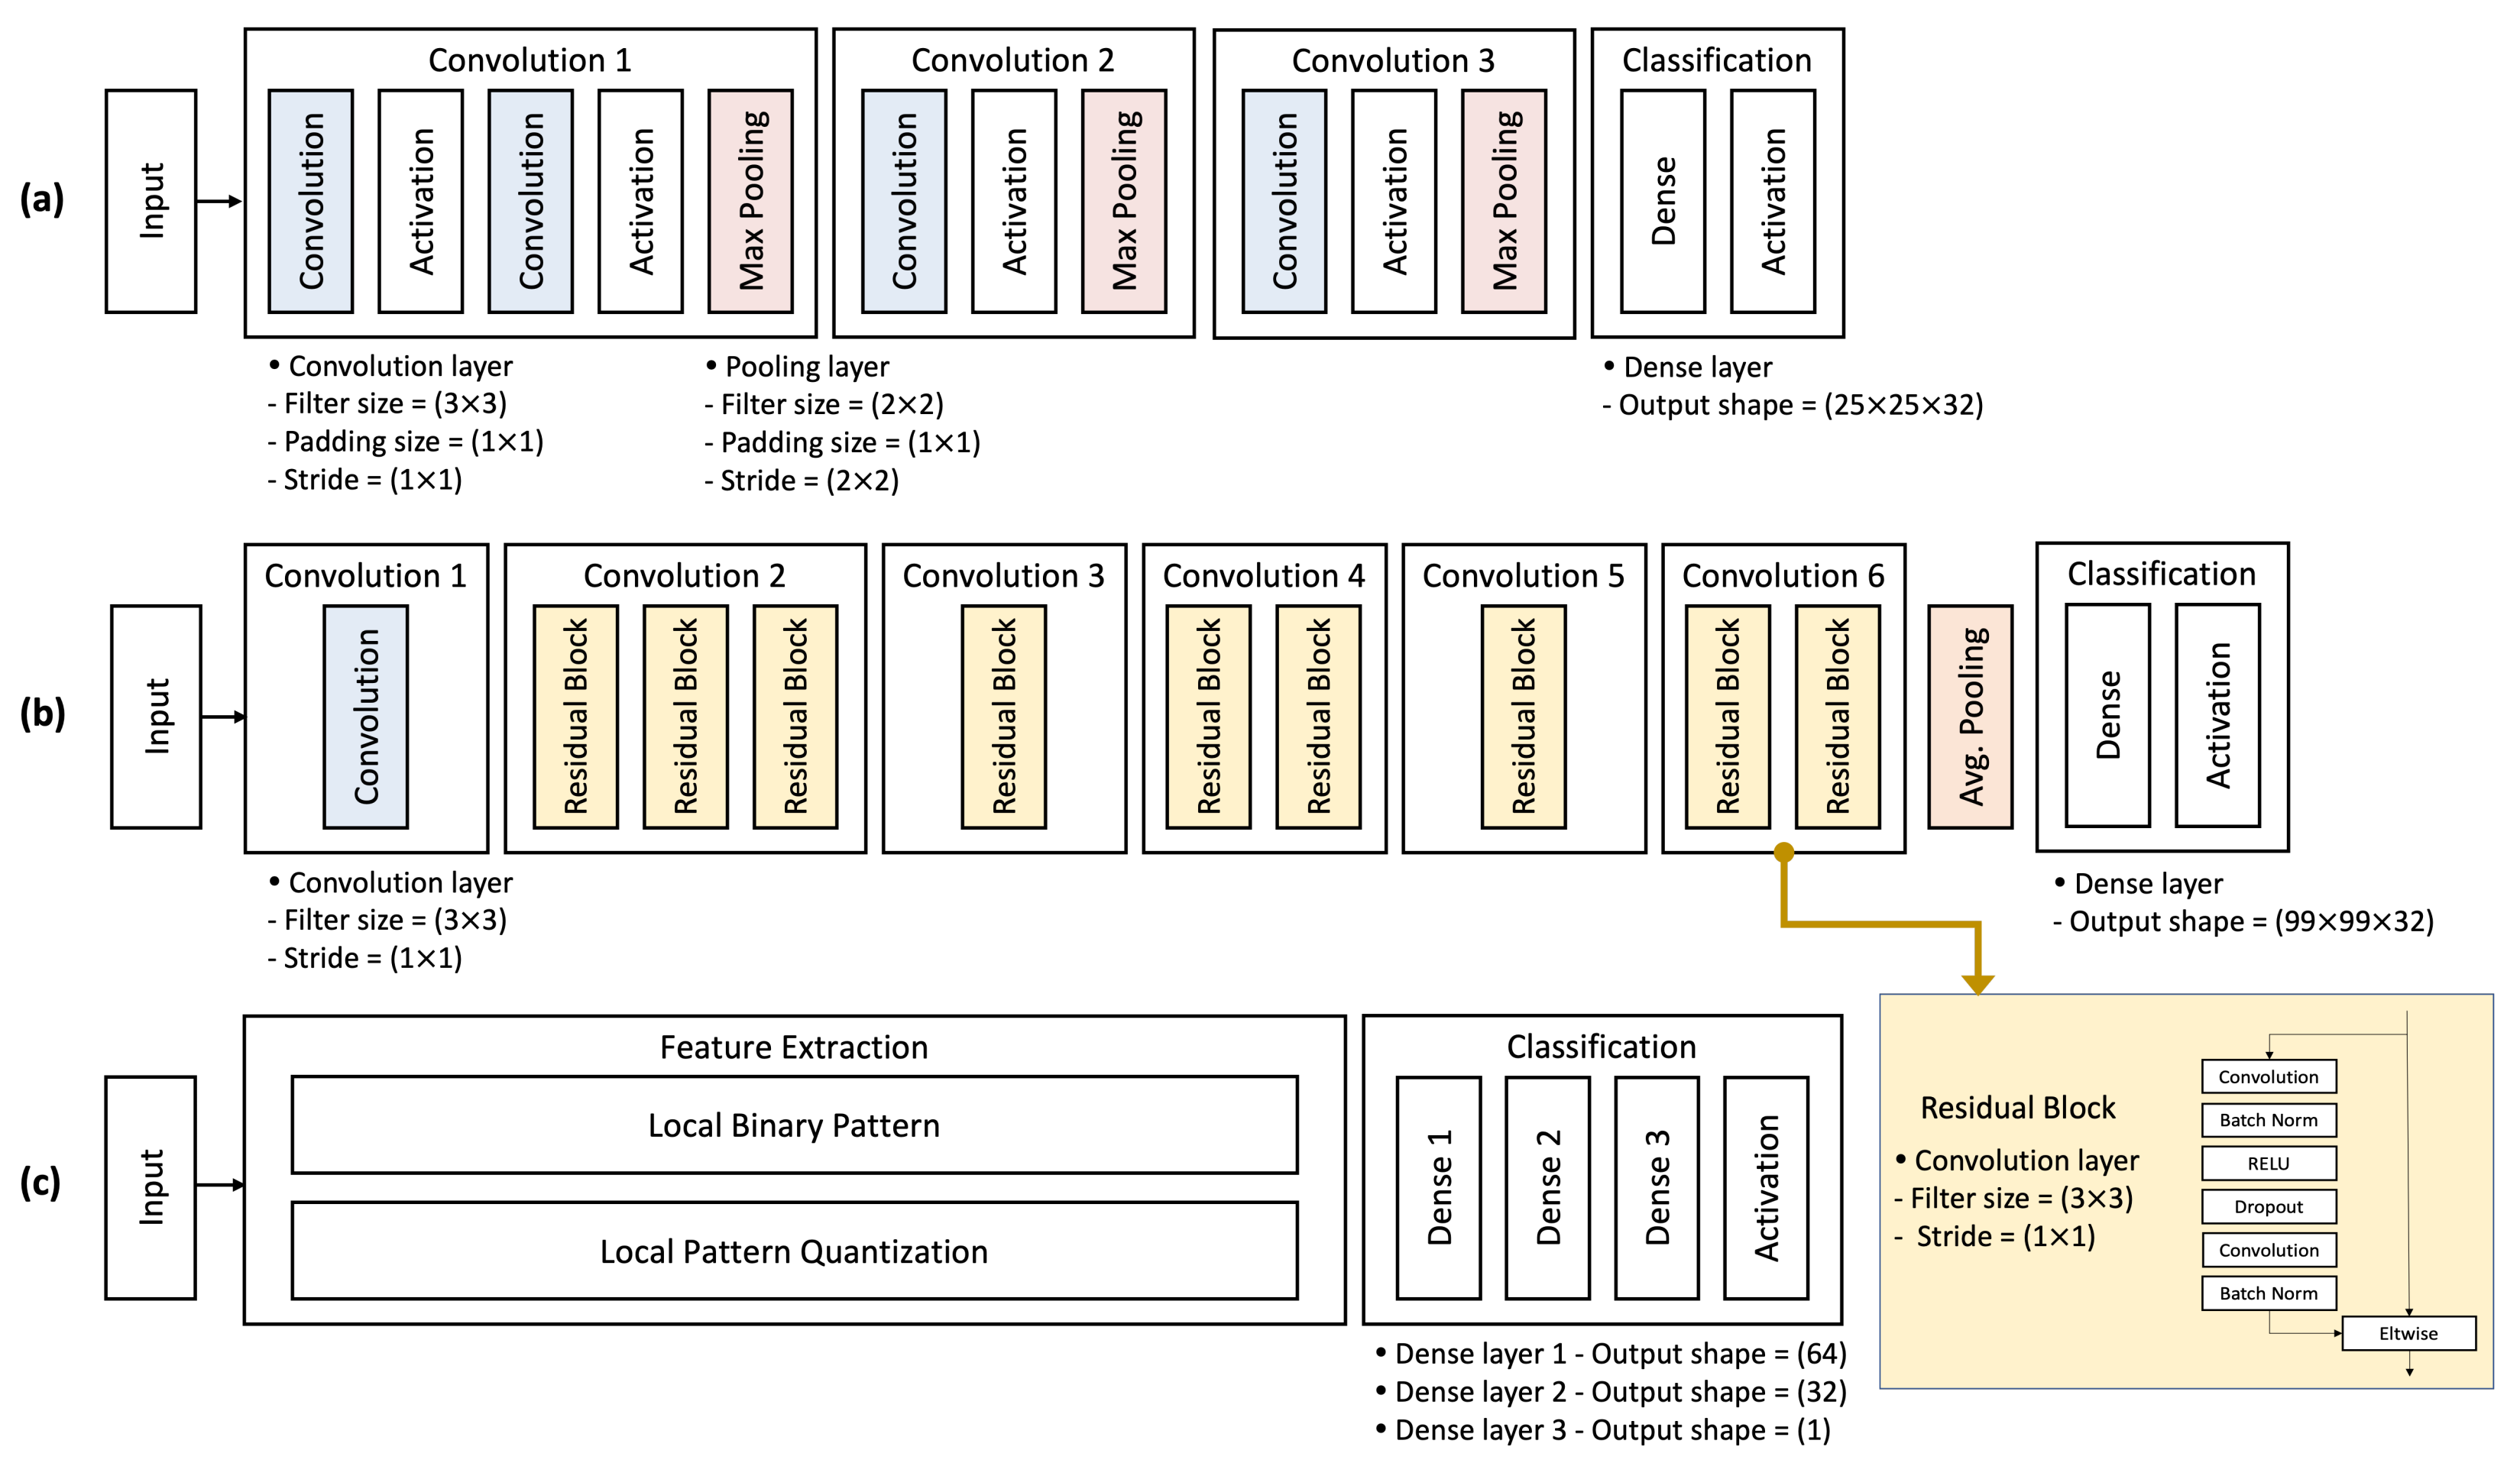
3.2. CNN-Based Model

Given a set of images, CNN-based methods automatically extract discrimination features and train a network model [16]. In fingerprint PAD, CNN-based methods generally outperform FNN-based methods in terms of accuracy [10]. As shown in Figure 1, our CNN-based model employs two different types of CNNs: CNN#1 and CNN#2. In our prior study, various combinations of FNNs and CNNs were evaluated to identify the most optimal combination for our fusion mechanism. Overall, it was observed that the fusion of one FNN and two different CNNs provided superior performance compared to other combinations, such as the fusion of one FNN and one CNN. This implies that different CNNs can complement each other by analyzing different features. We also evaluated combinations of more than two CNNs, but their detection performance did not improve significantly, while their inference time increased dramatically. Hence, to obtain the optimal PAD performance, we designed our method to fuse one FNN and two CNNs.
As shown in Figure 2a, CNN#1 architecture consists of four convolution layers followed by a dense layer. The core layers comprising CNN#1 are as follows: (1) A convolution layer extracts image patterns in the input image by convolving a filter (3 × 3) over the pixels of the input image. For convolution 1, 2, and 3, the number of convolution filters is 32, 64, and 128, respectively; (2) A pooling layer subsamples the small blocks (2 × 2) extracted from the following convolution layers; (3) A dense layer connects all neurons in the previous layers to every single neuron; (4) As activation functions, a rectified linear unit (RELU) layer follows the convolution layers, and a Softmax layer follows the dense layer for final classification. For CNN#1, the number of parameters is 106,048. Meanwhile, as shown in Figure 2b, the CNN#2 architecture consists of nine residual blocks followed by a dense layer. A residual block is formed by combining several convolution layers into a single block, as illustrated in Figure 2b. It enables effective weight optimization by including a shortcut for adding an identity matrix to consecutive convolution layers. The core layers comprising CNN#2 are as follows: convolution layer, pooling layer, batch normalization layer, dense layer, RELU layer, and Softmax layer. The number of convolution filters for all convolution layers is 64. For CNN#2, the number of parameters is 672,032.
Extending network layers or adopting additional types of architectures may improve PAD accuracy. However, according to our evaluation (see Section 4), our CNN architectures showed better performance compared to existing types of CNN architectures in PAD. We also compared our CNN architectures with other ones comprising different numbers of layers. Like FNN, those architectures required much longer inferencing time, while their improvement in PAD accuracy was relatively negligible. Hence, considering both detection performance and processing time, we determined our CNN architectures.
Since each CNN-based method inspects the overall texture of an input image, it essentially analyzes different characteristics of fingerprint images than the FNN-based method. This implies that our orchestration of different network models can compensate for each other’s limitations in PAD.

3.3. Feature-Based Model

As shown in Figure 1, our feature-based model basically employs two image feature descriptors: local binary pattern (LBP) and local phase quantization (LPQ) [22,23]. Although various combinations of feature descriptors have been studied, as mentioned in Section 2, a combination of LBP and LPQ outperforms others in terms of PAD accuracy [10]. LBP is a gray-scale texture descriptor that characterizes the local spatial structure of the image texture. LBP is widely used due to its computational simplicity and robustness against gray-scale changes. Based on a central pixel in the image, a pattern code is calculated by comparing it with its neighbors.
L B P ( P , R ) = p = 0 p 1 f ( g p g c ) 2 p , f ( x ) = 1 , x 0 0 , x < 0
where g c and g p denote the intensity of central and neighbors, respectively. P is the total number of neighboring pixels at a radius of R.
To address sensitivity in blurred images, we incorporated LPQ which basically uses local phase information of the local Fourier transform. LPQ is popular due to its blur-invariant attribute. By observing the signs of the real and imaginary parts of each component, phase information can be counted using a simple scalar quantization:
L P Q ( x ) = p = 1 p = 8 q i ( x ) 2 p 1
where q i is the i-th component of
G ( x ) = [ R e a l ( F ( x ) ) , I m a g i n a r y ( F ( x ) ) ]
given by
q i = 1 , G ( x ) i 0 0 , o t h e r w i s e
LBP is robust to global intensity changes, while LPQ is known to be insensitive to blurred images with noise. These characteristics are important for fingerprint analysis, since the intensity and blur issues are prevalent when capturing fingerprints via sensors. In particular, when capturing fingerprints via optical sensors, one of the popular fingerprint sensors, intensity changes caused by external light may affect the quality of the captured image. Moreover, end-users tend to rub their finger during capturing, which may generate blurred fingerprint images. Our method minimizes these problems by incorporating selected feature descriptors, LBP and LPQ.
Given the augmented dataset, a feature extraction module first extracts the image features from each crop. Specifically, two types of features (i.e., LBP and LPQ, respectively) are extracted and then concatenated into a single vector type in order to generate a feature vector. With the set of feature vectors extracted from the given dataset, a feature-based neural network (FNN) is trained. Our FNN is in the form of a simple architecture comprising three dense layers and one activation layer (i.e., Sigmoid), as shown in Figure 2c. For FNN, the number of parameters is 14,977. Note that extension of layers or parameters may improve liveness detection performance, but also requires higher inferencing time. In our prior study, we evaluated different sizes of dense layers (e.g., 64 × 64, 128 × 128 and 256 × 256). The extended network architectures require much longer inferencing time, while their improvement in PAD accuracy is relatively insignificant. Hence, considering both detection performance and processing time, we determined the current architecture of FNN.

3.4. A Score-Level Fusion for PAD

Our method basically implements a score-level fusion of liveness scores exported from different network models. Compared to the other types of fusion methods (i.e., feature-level and decision-level), the score-level fusion provides better performance in a relatively easy way [45]. To effectively fuse the scores obtained by each model, we adapted a triangular normalization method (t-norm), which enables inducing a larger distribution between two different classes, such as live and fake scores [46].
T-norm method is a kind of binary function which generalizes intersection operations of fuzzy sets in the mathematical fuzzy community [47]. T-norm methods satisfy associative, commutative, and monotonic properties. These properties enable fusion of multiple sources, which is suitable for our proposed architecture. To guarantee a solid fusion, the liveness scores are normalized to the domain [0,1]. In our method, the normalization is calculated as follows:
s = ( s m i n ( s ) ) / ( m a x ( s ) m i n ( s ) )
where s stands for the normalized score and s represents the original liveness score.
While different types of t-norm functions are available for score-level fusion (i.e., min, max, sum, and weighted-sum) [15], Sugeno-Weber (SW) t-norm [48] enables a larger distribution distance between two different classes (i.e., live and fake scores) compared to other functions [46]. This enables a clearer separation between live and fake fingerprints. The fusion score by S S W is calculated as follows:
S S W = m a x 0 , x + y 1 + p x y 1 + p , ( 1 p + )
In SW t-norm, since p spans the space of t-norms, SW is increasing and continuous with respect to p. Therefore, the selection of an appropriate parameter p is required to satisfy its functionality, which can be determined empirically. For example, based on the PAD performance on the training dataset, p that provides the most optimal performance can be selected [15,46,49]. Finally, S S W is calculated based on the scores inferred from the FNN and CNN models.

3.5. Liveness Determination

After a score-level fusion, the fused score S S W is compared with a threshold T H , which determines the class of each cropped image as live if S S W > T H , otherwise fake. Given a set of classes for the crops, a voting strategy can be used to determine the class of the entire image. For example, if the number of fake crops is greater than that of live crops, the fingerprint is classified as fake, otherwise live. Another approach involves averaging the fused scores of different crops and comparing them to T H .

4. Evaluation

This section presents the experimental evaluation of our proposed method. We verified the accuracy and reliability of our method by simulating and comparing it with existing methods. We have implemented the prototype of our method as a stand-alone Python application. The prototype implementation of our solution can be trained with a set of fingerprint images and processes a fingerprint image as an input. We used our prototype for our experimental evaluations. Our evaluation basically addressed the following research questions:
  • RQ1. How well does our orchestration method perform compared to existing fusion methods? (in terms of accuracy and generalization performance)
  • RQ2. How well does our method perform compared to existing PAD methods? (in terms of accuracy and generalization performance)
  • RQ3. How well does our CNN and FNN architecture perform compared to others? (in terms of accuracy and processing time)
  • RQ4. How well does our data augmentation improve overall performance? (in terms of accuracy and generalization performance)

4.1. Experimental Setup

We have implemented the prototype of our method as a stand-alone Python application which combines approximately 2000 newly written SLOC with Keras framework [50], a high-level API for implementing deep learning models. Two independent modules (i.e., FNN and CNN) have been separately implemented and combined. We have also implemented a feature extraction module as a stand-alone C++ application that imports a set of fingerprint images as input in image format and exports a set of feature descriptors in a pre-defined XML format. For training and testing datasets, we used a public benchmark, LivDet2019 [21]. We evaluated three datasets captured by different sensors: Green Bit, Digital Persona, and Orcanthus. Each dataset originally contained 4444, 4278, and 4243 images, respectively, which comprised both training and testing datasets. The prototype was empirically evaluated in terms of its accuracy, generalization performance, and processing time. Note that all experiments were performed on a Tesla 283 V100 GPU with 32 GB of memory. Adam was employed as an optimizer, with a learning rate of 0.01. We trained all deep learning models for a maximum of 30 epochs with a batch size of 128.
Fake fingerprints for training in LivDet2019 datasets were made of different materials (wood glue, ecoflex, body double, latex, and gelatine), and 250–400 images were captured for each material [21]. All training datasets were augmented by 3-way rotations (90 , 180 , and 270 ) and each rotated image was randomly cropped to four patches (200 × 200 pixel). Note that, in our method, each network (CNN#1, CNN#2, and FNN) was trained using different random crops. As a result, Green Bit dataset contained 12,000 live and 14,400 fake image patches, Digital Persona dataset contained 12,000 live and 12,000 fake image patches, and Orcanthus dataset contained 12,000 live and 14,400 fake image patches (see Table 1). Likewise, fake fingerprints for testing were made of different materials (mix1, mix2, and liquid ecoflex), and ∼400 images were captured for each material. In total, for Green Bit dataset, 26,400 and 2244 image patches were used in training and testing, respectively. For Digital Persona dataset, 24,000 and 2243 image patches were used in training and testing, respectively. For Orcanthus dataset, 26,400 and 2078 image patches were used in training and testing, respectively. In our evaluation, we used the following equations for performance measurement: F e r r f a k e = (The Number of Fake Acceptance/Total Number of Fake), F e r r l i v e = (The Number of False Live Acceptance/Total Number of Live), A C C = ( F e r r f a k e + F e r r l i v e )/2. For accurate evaluation, we measured a total of three times for each experiment and calculated the mean values of them.

4.2. Experimental Result

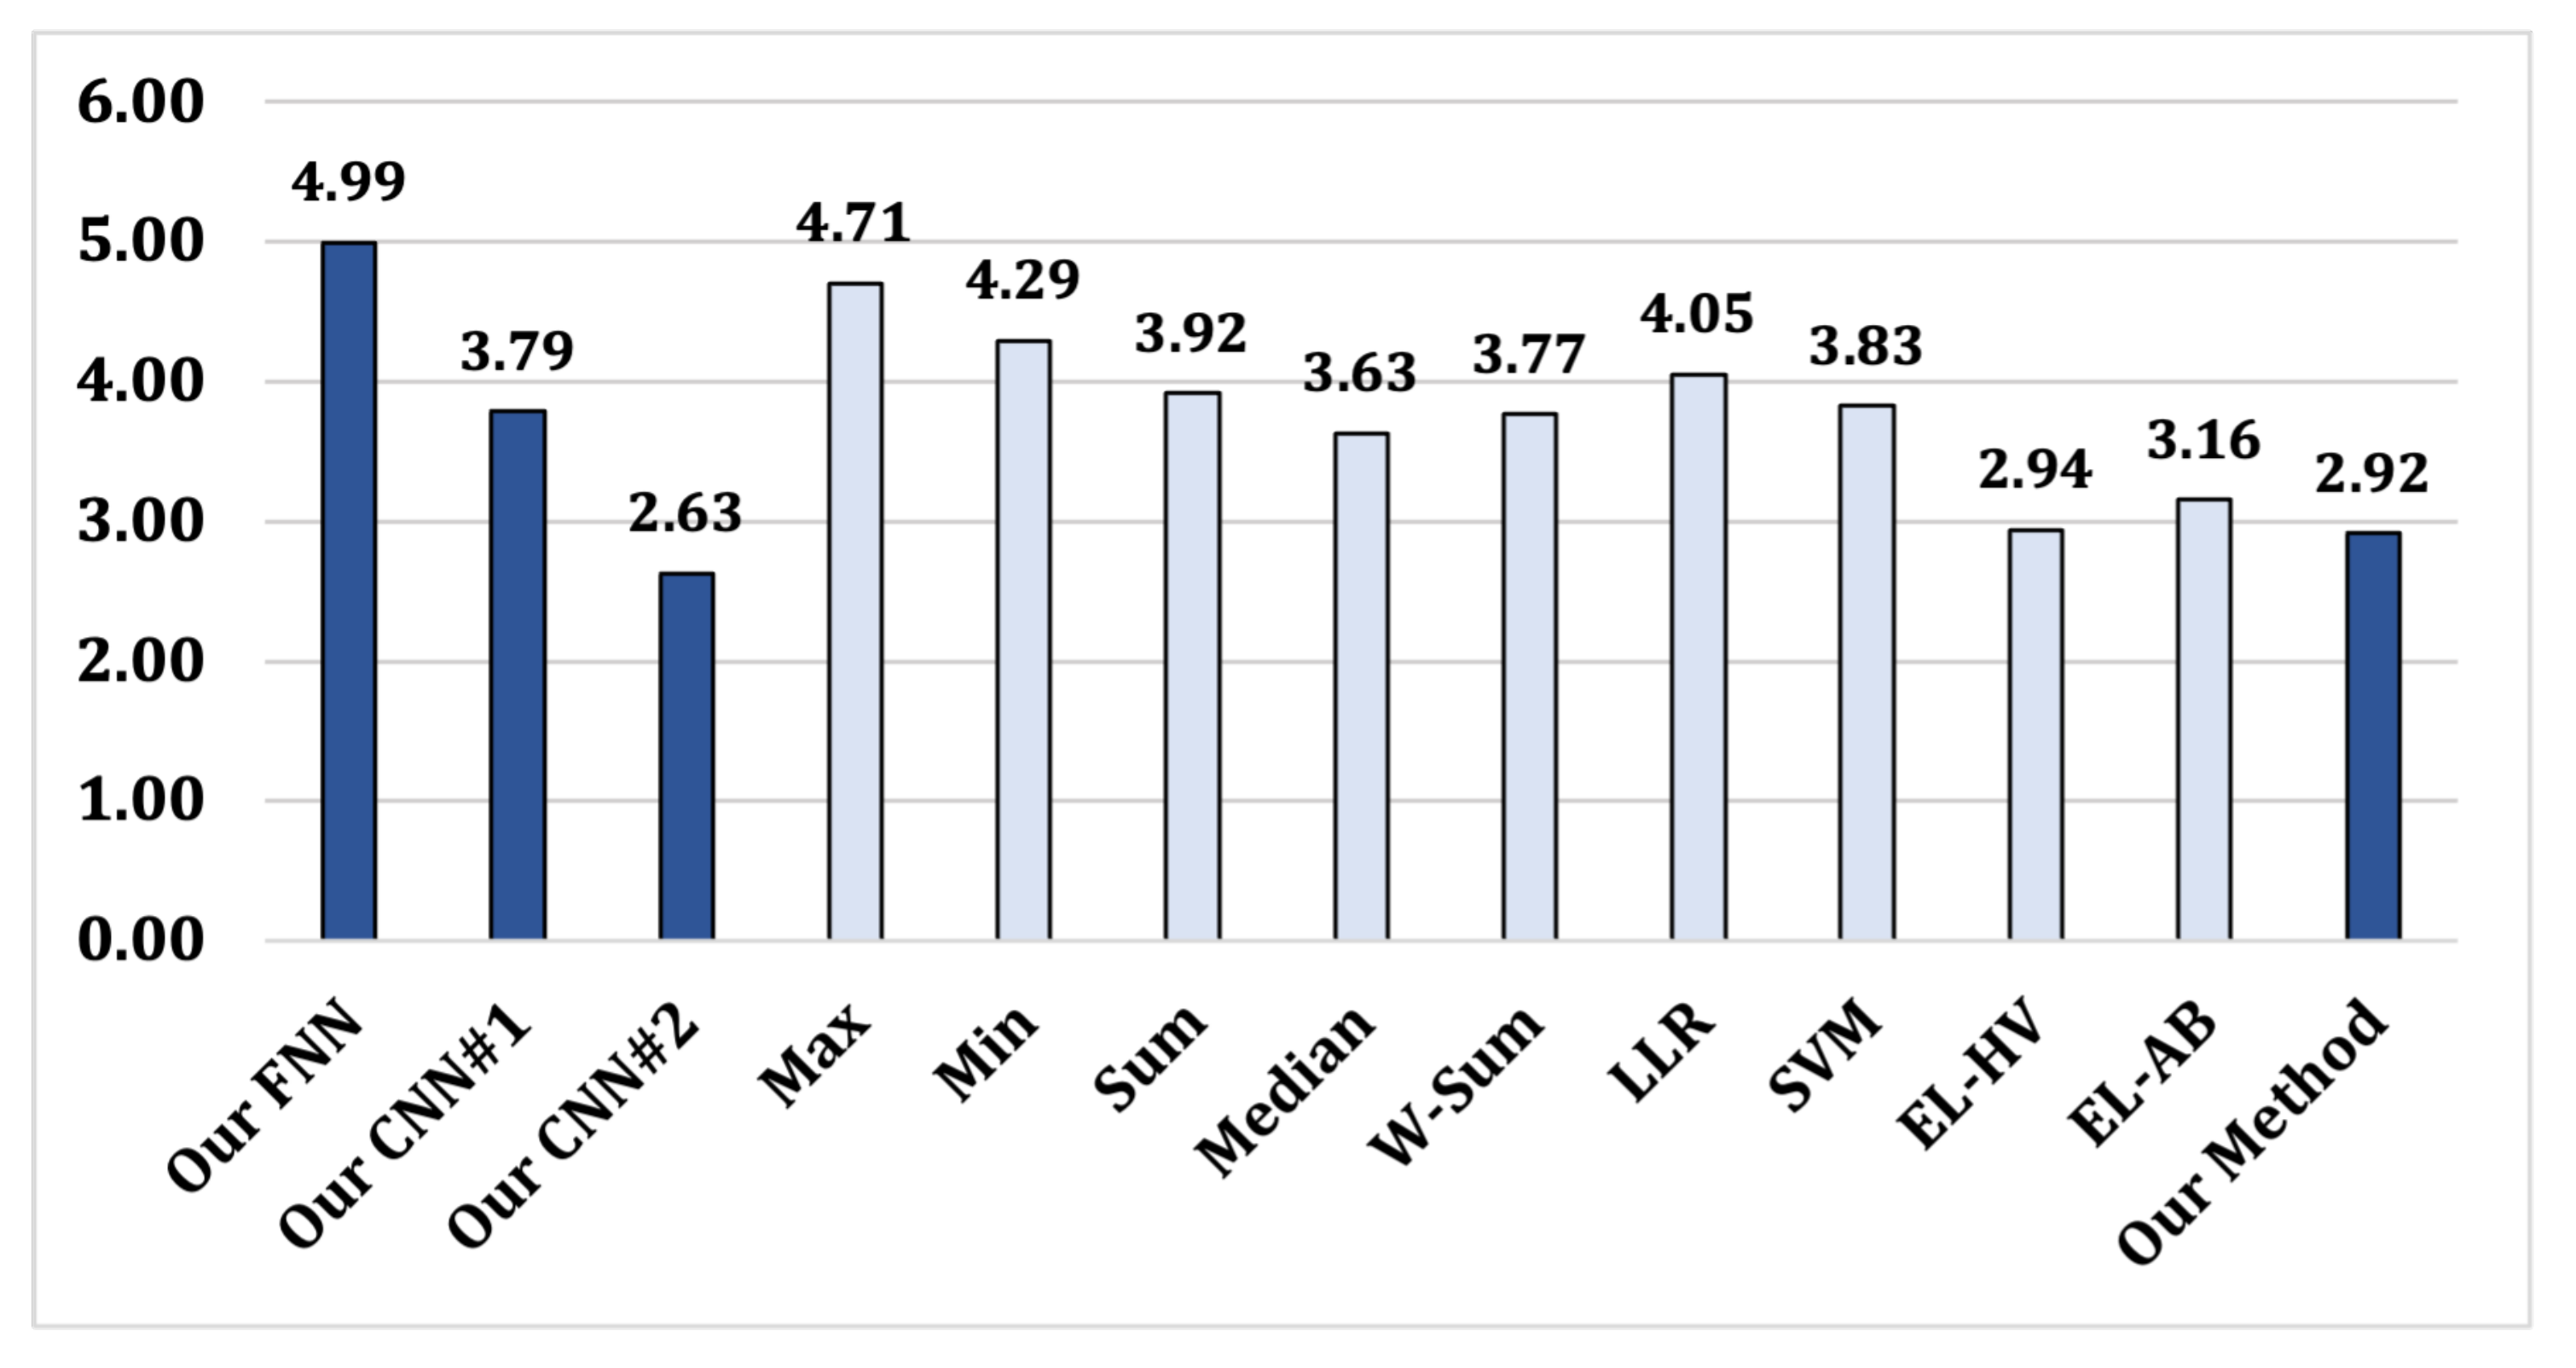
4.2.1. Results for RQ1

To evaluate the performance of our orchestration method and compare it against existing fusion methods, we used three benchmark datasets, Green Bit, Digital Persona, and Orcanthus. Experimental results are shown in Table 2: (1) When testing on Green Bitdataset via FNN, CNN#1, and CNN#2, the accuracy ( A C C ) was 98.91% and 99.39%, and 99.38%, respectively. For FNN, the rate of misclassified fake fingerprints ( F e r r f a k e ) was 1.41% and the rate of misclassified live fingerprints ( F e r r l i v e ) was 0.77%. For CNN#1, F e r r f a k e was 0.93% and F e r r l i v e was 0.30%. For CNN#2, F e r r f a k e was 0.93% and F e r r l i v e was 0.31%. (2) When testing on Digital Personadataset via FNN, CNN#1, and CNN#2, A C C was 93.08% and 94.99%, and 95.93%, respectively. For FNN, F e r r f a k e was 8.32% and F e r r l i v e was 5.53%. For CNN#1, F e r r f a k e was 6.61% and F e r r l i v e was 3.41%. For CNN#2, F e r r f a k e was 4.61% and F e r r l i v e was 3.53%. (3) When testing on Orcanthusdataset via FNN, CNN#1, and CNN#2, A C C was 97.23% and 98.16%, and 97.74%, respectively. For FNN, F e r r f a k e was 0.75% and F e r r l i v e was 4.80%. For CNN#1, F e r r f a k e was 0.48% and F e r r l i v e was 3.21%. For CNN#2, F e r r f a k e was 0.54% and F e r r l i v e was 3.99%.
As shown in Table 2, we performed score-level fusions by using nine different methods: Max, Min, Sum, Median, Weighted-Sum, Logistic Linear Regression (LLR) SVM, Ensemble Learning-Hard Voting (EL-HV), Ensemble Learning-AdaBoost (EL-AB), and our method. For all methods, the score threshold for liveness was set to 0.5. For SVM, the radial basis function was used as the basic kernel function, and the scores were normalized in the range of 0–1 by min-max normalization. For ensemble learning, two representative methods, Hard Voting and AdaBoost, were selected. To implement AdaBoost, FNN, CNN#1, and CNN#2 were defined as weak classifiers, respectively, and each classifier weight parameter was determined by applying AdaBoost algorithm to the training dataset. Note that, for each method, a grid-based search was employed to determine the optimal parameters which provided the highest A C C . Likewise, for our method, p was set to 100,000, which were reasonably determined based on the A C C of each model obtained from the training dataset. Consequently, as shown in Table 2, it was observed that the selected parameters provided the optimal detection performance at the current settings.
The results show that Max, Min, Sum, Median, Weighted-Sum, LLR, SVM, EL-HV, and EL-AB have similar A C C (95.24–97.57%), while our method has the highest A C C (98.05%). This implies that our method, which is based on Sugeno-Weber, induces better accuracy in fingerprint PAD compared to other score-level fusion methods as well as individual neural networks (FNN: 96.40%, CNN#1: 97.51%, and CNN#2: 97.68%). Moreover, as shown in Figure 3, our method provided the lowest A C C difference between three different datasets (i.e., Green Bit, Digital Persona, and Orcanthus), compared to other methods. The mean A C C difference of our method is 2.92%, while our FNN = 4.99%, our CNN#1 = 3.78%, our CNN#2 = 3.78%, Max = 4.71%, Min = 4.29%, Sum = 3.92%, Median = 3.63%, Weighted-Sum = 3.77%, LLR = 4.05%, SVM = 3.83%, EL-HV = 2.94%, and EL-AB = 3.16%. Considering the fact that three datasets comprise different types of fingerprints, fake materials, and sensors, our method provides relatively consistent performance on different types of fingerprints while improving generalization performance.

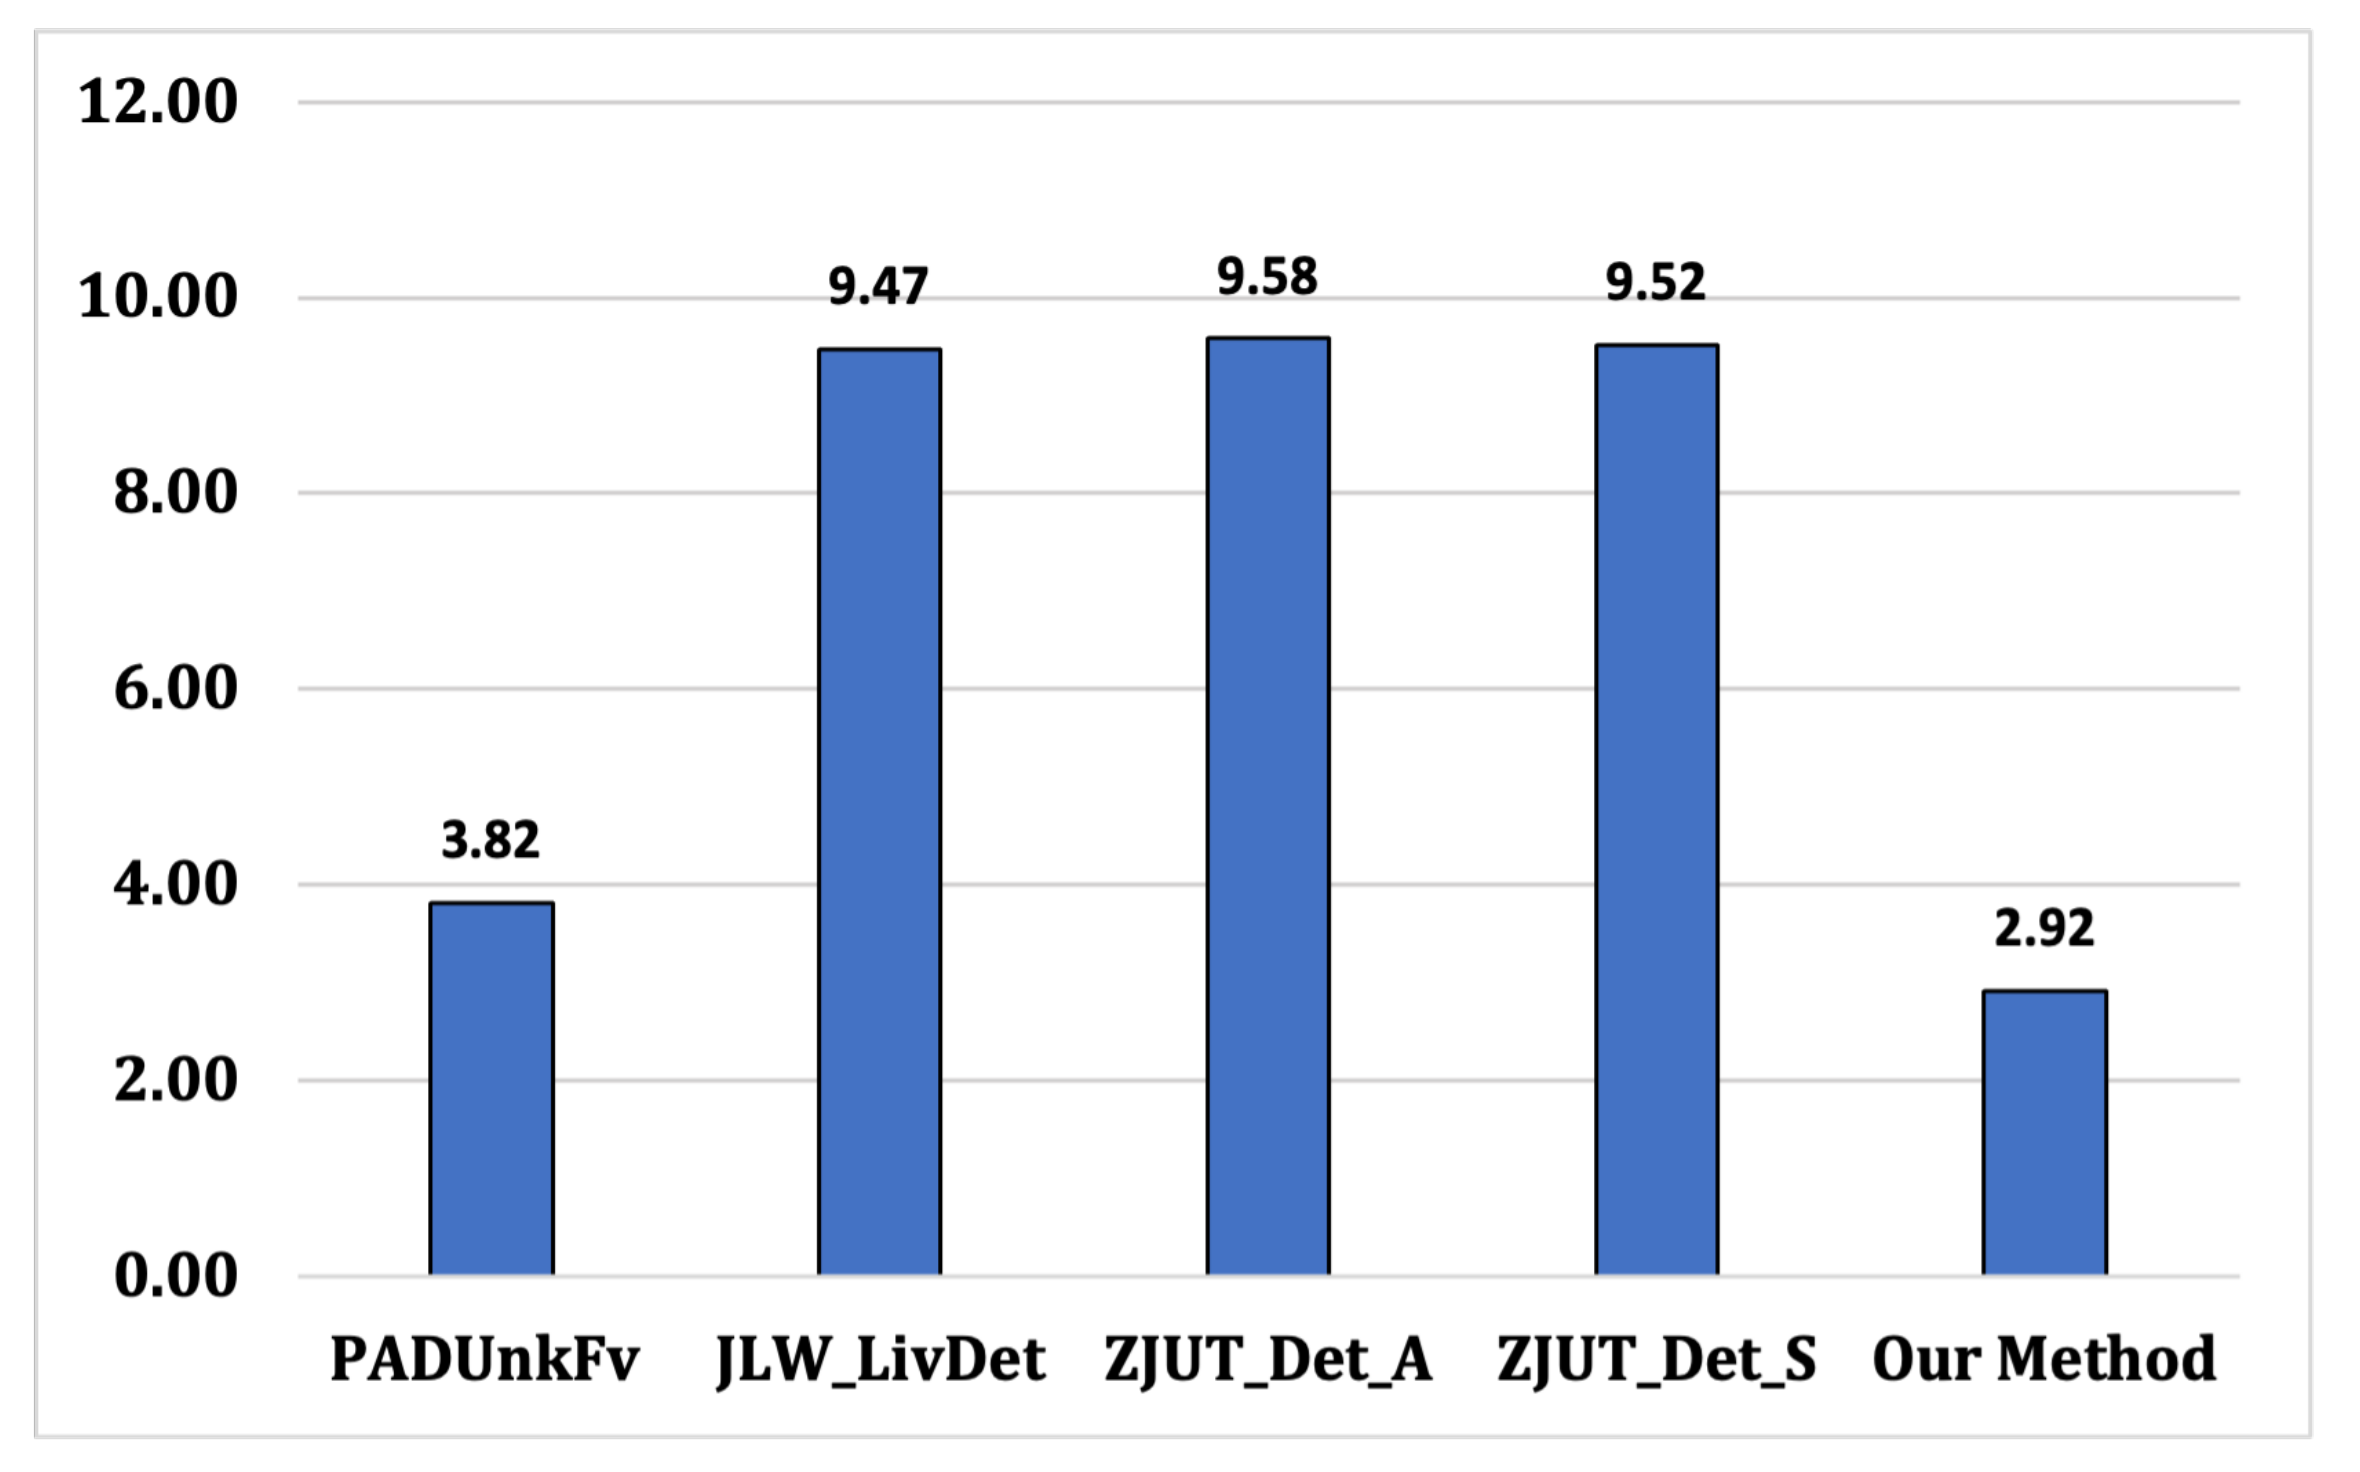
4.2.2. Results for RQ2

To evaluate the performance of our proposed method, we compared it with the performance of the existing PAD methods, especially the top-four-performance methods reported in the LivDet2019 report [21]. We used the same metrics and benchmark datasets as Section 4.2.1. As shown in Table 3, most of the methods tend to be similar in terms of A C C . The overall A C C of all methods on Green Bit and Orcanthus datasets are over 97%, while the overall A C C on Digital Persona dataset are mostly lower than 90%. Specifically, most of the methods show an A C C of ∼99% on Green Bitdataset, but the A C C on Digital Personadataset is largely reduced due to its difficult classification. However, above all, our method shows the highest A C C for all datasets compared to the existing methods. In particular, the sensor-specific A C C of our method (Green Bit: 99.41%, Digital Persona: 96.11%, Orcanthus: 98.65%) is higher than the best sensor-specific A C C of the existing methods (Green Bit: 99.20%, Digital Persona: 93.63%, Orcanthus: 97.45%). These results indicate that our method led to better PAD accuracy for each dataset compared to existing methods.
Moreover, as shown in Figure 4, our method provided the lowest A C C difference between three different datasets (i.e., Green Bit, Digital Persona, and Orcanthus), compared to existing methods. The mean A C C difference of our method is 2.92%, while PADUnkFv = 3.82%, JLW_LivDet = 9.47%, ZJUT_Det_A = 9.58%, and ZJUT_Det_S = 9.52%. Compared to existing PAD methods, our method provides relatively consistent performance on different types of fingerprints while improving generalization performance.

4.2.3. Results for RQ3

To evaluate the performance of our proposed network architectures, we additionally implemented representative types of existing CNN architectures: VGG-16, VGG-19, ResNet, Slim-ResNet, and FNN architectures: LBP + SVM (support vector machine), LPQ + SVM, LBP + LPQ + SVM, LBP + NN (neural network), LPQ + NN, which have been proven to be effective in PAD [10,14,29]. We used the same benchmark datasets as Section 4.2.1. The processing time was calculated by averaging the inferencing time for 100 randomly selected test images (200 × 200 pixel). The results are shown in Table 4 and Table 5.
Overall, as shown in Table 4, our proposed FNN shows similar or slightly better accuracies (96.40%) to the other types of FNN architectures (LBP + SVM: 94.43%, LPQ + SVM: 93.34%, LBP + LPQ + SVM: 93.75%, LBP + NN: 96.29%, LPQ + NN: 96.16%) for all datasets. On the other hand, as shown in Table 5, regarding the processing time, our FNN requires the longest processing time (12 ms) compared to other architectures (8–11 ms). However, the time difference (1–4 ms) is negligible because the threshold at which the end-user detects a slowdown in mobile app response is 100–200 ms [51]. Considering that both LBP and LPQ are being analyzed to improve accuracy, the results demonstrate that our proposed FNN architecture shows a balanced performance in PAD compared to other architecture types.
In addition, as shown in Table 4, the existing CNN architectures (ResNet-34: 97.53%, Slim-ResNet: 97.33%, VGG-16: 97.24%, VGG-19: 97.61%) show similar or slightly inferior accuracies compared to our proposed architectures (our CNN#1: 97.51%, our CNN#2: 97.68%) for all datasets. However, as shown in Table 5, there exists a big difference in processing time. The existing CNN architectures show their processing time of 81–151 ms in overall, whereas our CNN#1 and CNN#2 shows 24 and 49 ms, respectively. Considering that the processing time differs significantly by at least two times, the results indicate that our proposed CNN architectures show the most balanced performance in PAD.

4.2.4. Results for RQ4

To evaluate the effectiveness of our data augmentation approach, we measured the A C C of our method trained with augmented and non-augmented datasets, respectively. As shown in Table 6, when testing each trained model on all datasets (Green Bit, Digital Persona, and Orcanthus), the A C C of the model trained by augmented dataset was 99.41%, 96.11%, and 98.65%, respectively. The A C C of the model trained with the non-augmented dataset, on the other hand, was 94.38%, 82.99%, and 92.34%, respectively, which was lower than the augmented ones. The results demonstrate that our augmented method directly affected the improvement in PAD performance. Furthermore, the mean A C C difference among datasets was 2.92% (augmented) and 10.37% (non-augmented), respectively. This implies that our augmented dataset enables relatively consistent PAD performance across different types of fingerprints compared to the non-augmented dataset.

5. Discussion

In this research, we proposed a novel method that effectively orchestrates different PAD models for analyzing the liveness of fingerprints. Our method can aid engineers in developing fingerprint recognition systems that are robust against presentation attacks. Moreover, this research provides a new mechanism for effectively associating multiple PAD models at the score-level, which can improve existing PAD systems. For example, considering that it is challenging to achieve acceptable accuracy and generalization performance with a single model, our method of effectively associating multiple models can successfully improve the existing single-model PAD systems. In addition, this research established a baseline for future studies on score-level fusion-based PAD by providing a comprehensive analysis of the proposed architectures and methodology.
For comprehensive comparisons with existing approaches, we used the LivDet2019 dataset, which is publicly available. To address any resulting bias, we did not alter the dataset’s characteristics or composition ratio. However, considering the development of new sensor types and materials, it is required to evaluate generalization performance on extensive datasets. Hence, in our future research, we plan to build an extended data set and perform large-scale analyses on it. Additionally, despite integrating multiple models, our method essentially completes inference in an acceptable amount of time, as shown in the evaluation results. However, the PAD performance of our method may be limited in terms of inference time and memory when implemented on a real-time embedded system or a mobile device. Hence, to ensure its on-device performance, we plan to investigate model optimization and quantization for our method.

6. Conclusions

In this paper, we proposed a new score-level orchestration method for fingerprint PAD. We designed distinguished CNN and FNN architectures, each of which is effective for fingerprint PAD. Our method improves detection accuracy and generalization performance in PAD by effectively orchestrating the proposed CNNs and FNN. Our method processes the image crops extracted from an input fingerprint via CNN and FNN models, and identifies their liveness based on a score-level determination algorithm which is based on the Sugeno-Weber t-norm. Our evaluation results on the public benchmark showed that our method completely outperforms existing PAD methods as well as traditional fusion methods (i.e., Min, Max, Sum, Median, and Weighted-Sum) in terms of both accuracy and generalization performance. Moreover, considering both accuracy and processing time, our proposed CNN and FNN architectures demonstrated the most balanced performance in fingerprint PAD compared to other types of architectures. Furthermore, our augmentation approach not only improved fingerprint PAD accuracy but also provided relatively consistent performance on different types of fingerprints.
Future work will involve further experiments on extended datasets while extending the material types of fake fingerprints, types of sensors, environments, and corner cases. In particular, LivDet2021 adopted an additional test set consisting of semi-consensual replicas obtained via ScreenSpoof technology [52]. Since this method uses latent fingerprints left on the screen without the user’s consent, it can be a good benchmark to improve the PAD performance of our proposed method. Additionally, we plan to apply our proposed method to the recognition of faces, iris, and palm prints in order to develop a robust biometric framework.

Author Contributions

Conceptualization, Y.K.L. and J.J.; methodology, J.J.; software, D.K.; validation, D.K. and Y.K.L.; formal analysis, Y.K.L.; investigation, Y.K.L.; resources, D.K.; data curation, J.J.; writing—original draft preparation, Y.K.L.; writing—review and editing, J.J. and D.K.; visualization, Y.K.L.; supervision, D.K.; project administration, Y.K.L.; funding acquisition, Y.K.L. All authors have read and agreed to the published version of the manuscript.

Funding

This work was supported partly by the National Research Foundation of Korea (NRF) grant funded by the Korea government (MSIT) (No. 2022R1G1A1009928) and partly by the Hongik University new faculty research support fund.

Conflicts of Interest

The authors declare no conflict of interest.

References

  1. Markets and Markets. Fingerprint Sensor Market by Type, Technology, Application, and Geography–Global Forecast to 2023. 2018. Available online: https://www.researchandmarkets.com/reports/4542299/ (accessed on 9 October 2020).
  2. Lee, Y.K.; Jeong, J. Securing biometric authentication system using blockchain. ICT Express 2021, 7, 322–326. [Google Scholar] [CrossRef]
  3. Adhikari, S. Galaxy S10’s Ultrasonic Fingerprint Sensor Fooled by a 3D-Printed Fingerprint. 2019. Available online: https://www.sammobile.com/ (accessed on 9 October 2020).
  4. Abhyankar, A.; Schuckers, S.A.C. Fingerprint Liveness Detection Using Local Ridge Frequencies and Multiresolution Texture Analysis Techniques. In Proceedings of the International Conference on Image Processing (ICIP), Atlanta, GA, USA, 8–11 October 2006; pp. 321–324. [Google Scholar] [CrossRef]
  5. Gragnaniello, D.; Poggi, G.; Sansone, C.; Verdoliva, L. Local Contrast Phase Descriptor for Fingerprint Liveness Detection. Pattern Recognit. 2015, 48, 1050–1058. [Google Scholar] [CrossRef]
  6. Coli, P.; Marcialis, G.L.; Roli, F. Power spectrum-based fingerprint vitality detection. In Proceedings of the IEEE Workshop on Automatic Identification Advanced Technologies (AutoID), Alghero, Italy, 7–8 June 2007; pp. 169–173. [Google Scholar] [CrossRef]
  7. Marasco, E.; Sansone, C. Combining perspiration-and morphology-based static features for fingerprint liveness detection. Pattern Recognit. Lett. 2012, 33, 1148–1156. [Google Scholar] [CrossRef]
  8. Gragnaniello, D.; Poggi, G.; Sansone, C.; Verdoliva, L. An Investigation of Local Descriptors for Biometric Spoofing Detection. IEEE Trans. Inf. Forensics Secur. 2015, 10, 849–863. [Google Scholar] [CrossRef]
  9. Gragnaniello, D.; Poggi, G.; Sansone, C.; Verdoliva, L. Fingerprint liveness detection based on weber local image descriptor. In Proceedings of the IEEE Workshop on Biometric Measurements and Systems for Security and Medical Applications (BIOMS), Napoli, Italy, 9 September 2013; pp. 46–50. [Google Scholar]
  10. Ghiani, L.; Marcialis, G.L.; Roli, F. Experimental results on the feature-level fusion of multiple fingerprint liveness detection algorithms. In Proceedings of the Multimedia and Security Workshop (MM & Sec) 2012, Coventry, UK, 6–7 September 2012; pp. 157–164. [Google Scholar] [CrossRef]
  11. Gottschlich, C. Convolution comparison pattern: An efficient local image descriptor for fingerprint liveness detection. PLoS ONE 2016, 11, e0148552. [Google Scholar] [CrossRef] [PubMed]
  12. Kembhavi, A.; Siddiquie, B.; Miezianko, R.; McCloskey, S.; Davis, L.S. Incremental Multiple Kernel Learning for object recognition. In Proceedings of the IEEE 12th International Conference on Computer Vision, (ICCV) 2009, Kyoto, Japan, 27 September–4 October 2009; pp. 638–645. [Google Scholar] [CrossRef]
  13. Sajjad, M.; Khan, S.; Hussain, T.; Muhammad, K.; Sangaiah, A.K.; Castiglione, A.; Esposito, C.; Baik, S.W. CNN-based anti-spoofing two-tier multi-factor authentication system. Pattern Recognit. Lett. 2019, 126, 123–131. [Google Scholar] [CrossRef]
  14. Nogueira, R.F.; de Alencar Lotufo, R.; Machado, R.C. Fingerprint liveness detection using convolutional neural networks. IEEE Trans. Inf. Forensics Secur. 2016, 11, 1206–1213. [Google Scholar] [CrossRef]
  15. Hanmandlu, M.; Grover, J.; Gureja, A.; Gupta, H.M. Score level fusion of multimodal biometrics using triangular norms. Pattern Recognit. Lett. 2011, 32, 1843–1850. [Google Scholar] [CrossRef]
  16. Jeon, W.S.; Rhee, S.Y. Fingerprint pattern classification using convolution neural network. Int. J. Fuzzy Log. Intell. Syst. 2017, 17, 170–176. [Google Scholar] [CrossRef]
  17. Ghiani, L.; Hadid, A.; Marcialis, G.L.; Roli, F. Fingerprint Liveness Detection using Binarized Statistical Image Features. In Proceedings of the IEEE Sixth International Conference on Biometrics: Theory, Applications and Systems (BTAS) 2013, Arlington, VA, USA, 29 September–2 October 2013; pp. 1–6. [Google Scholar] [CrossRef]
  18. Mezai, L.; Hachouf, F. Score-level fusion of face and voice using particle swarm optimization and belief functions. IEEE Trans. Hum. Mach. Syst. 2015, 45, 761–772. [Google Scholar] [CrossRef]
  19. Kabir, W.; Ahmad, M.O.; Swamy, M.N.S. A new anchored normalization technique for score-level fusion in multimodal biometrie systems. In Proceedings of the IEEE International Symposium on Circuits and Systems (ISCAS) 2016, Montréal, QC, Canada, 22–25 May 2016; pp. 93–96. [Google Scholar] [CrossRef]
  20. Menotti, D.; Chiachia, G.; Pinto, A.; Schwartz, W.R.; Pedrini, H.; Falcao, A.X.; Rocha, A. Deep representations for iris, face, and fingerprint spoofing detection. IEEE Trans. Inf. Forensics Secur. 2015, 10, 864–879. [Google Scholar] [CrossRef]
  21. Orrù, G.; Casula, R.; Tuveri, P.; Bazzoni, C.; Dessalvi, G.; Micheletto, M.; Ghiani, L.; Marcialis, G.L. LivDet in Action-Fingerprint Liveness Detection Competition 2019. In Proceedings of the International Conference on Biometrics (ICB) 2019, Crete, Greece, 4–7 June 2019; pp. 1–6. [Google Scholar] [CrossRef]
  22. Ojala, T.; Pietikainen, M.; Maenpaa, T. Multiresolution gray-scale and rotation invariant texture classification with local binary patterns. IEEE Trans. Pattern Anal. Mach. Intell. 2002, 24, 971–987. [Google Scholar] [CrossRef]
  23. Ojansivu, V.; Heikkilä, J. Blur Insensitive Texture Classification Using Local Phase Quantization. In Proceedings of the Image and Signal Processing-3rd International Conference (ICISP) 2008, Cherbourg-Octeville, France, 1–3 July 2008; Volume 5099, pp. 236–243. [Google Scholar] [CrossRef]
  24. Husseis, A.; Liu-Jimenez, J.; Sanchez-Reillo, R. Fingerprint presentation attack detection utilizing spatio-temporal features. Sensors 2021, 21, 2059. [Google Scholar] [CrossRef]
  25. Vinayakumar, R.; Soman, K.P.; Poornachandran, P. Applying convolutional neural network for network intrusion detection. In Proceedings of the International Conference on Advances in Computing, Communications and Informatics, (ICACCI) 2017, Udupi, India, 13–16 September 2017; pp. 1222–1228. [Google Scholar] [CrossRef]
  26. Ravi, V.; Chaganti, R.; Alazab, M. Recurrent deep learning-based feature fusion ensemble meta-classifier approach for intelligent network intrusion detection system. Comput. Electr. Eng. 2022, 102, 108156. [Google Scholar] [CrossRef]
  27. Chaganti, R.; Ravi, V.; Pham, T.D. Deep Learning based Cross Architecture Internet of Things malware Detection and Classification. Comput. Secur. 2022, 120, 102779. [Google Scholar] [CrossRef]
  28. Yadav, P.; Menon, N.; Ravi, V.; Viswanathan, S.; Pham, T.D. EfficientNet convolutional neural networks-based Android malware detection. Comput. Secur. 2022, 115, 102622. [Google Scholar] [CrossRef]
  29. Nogueira, R.F.; de Alencar Lotufo, R.; Machado, R.C. Evaluating software-based fingerprint liveness detection using convolutional networks and local binary patterns. In Proceedings of the IEEE Workshop on Biometric Measurements and Systems for Security and Medical Applications (BIOMS) 2014, Rome, Italy, 17 October 2014; pp. 22–29. [Google Scholar]
  30. Marasco, E.; Wild, P.; Cukic, B. Robust and interoperable fingerprint spoof detection via convolutional neural networks. In Proceedings of the IEEE Symposium on Technologies for Homeland Security (HST) 2016, Waltham, MA, USA, 10–11 May 2016; pp. 1–6. [Google Scholar]
  31. Park, E.; Kim, W.; Li, Q.; Kim, J.; Kim, H. Fingerprint Liveness Detection Using CNN Features of Random Sample Patches. In Proceedings of the 2016 International Conference of the Biometrics Special Interest Group (BIOSIG), Darmstadt, Germany, 21–23 September 2016; pp. 321–328. [Google Scholar] [CrossRef]
  32. Wang, C.; Li, K.; Wu, Z.; Zhao, Q. A DCNN Based Fingerprint Liveness Detection Algorithm with Voting Strategy. In Proceedings of the Biometric Recognition-10th Chinese Conference (CCBR) 2015, Tianjin, China, 13–15 November 2015; Volume 9428, pp. 241–249. [Google Scholar] [CrossRef]
  33. Xu, Z.; Li, S.; Deng, W. Learning temporal features using LSTM-CNN architecture for face anti-spoofing. In Proceedings of the 3rd IAPR Asian Conference on Pattern Recognition (ACPR) 2015, Kuala Lumpur, Malaysia, 3–6 November 2015; pp. 141–145. [Google Scholar] [CrossRef]
  34. Jia, X.; Yang, X.; Cao, K.; Zang, Y.; Zhang, N.; Dai, R.; Zhu, X.; Tian, J. Multi-scale local binary pattern with filters for spoof fingerprint detection. Inf. Sci. 2014, 268, 91–102. [Google Scholar] [CrossRef]
  35. Nikam, S.B.; Agarwal, S. Local binary pattern and wavelet-based spoof fingerprint detection. Int. J. Biom. 2008, 1, 141–159. [Google Scholar] [CrossRef]
  36. Fuster-Garcia, E.; Bresó, A.; Martínez-Miranda, J.; Rosell-Ferrer, J.; Matheson, C.; García-Gómez, J.M. Fusing actigraphy signals for outpatient monitoring. Inf. Fusion 2015, 23, 69–80. [Google Scholar] [CrossRef]
  37. Paul, P.P.; Gavrilova, M.L.; Alhajj, R. Decision fusion for multimodal biometrics using social network analysis. IEEE Trans. Syst. Man, Cybern. Syst. 2014, 44, 1522–1533. [Google Scholar] [CrossRef]
  38. Nagar, A.; Nandakumar, K.; Jain, A.K. Multibiometric cryptosystems based on feature-level fusion. IEEE Trans. Inf. Forensics Secur. 2011, 7, 255–268. [Google Scholar] [CrossRef]
  39. Li, W.; Zhang, D.; Zhang, L.; Lu, G.; Yan, J. 3-D palmprint recognition with joint line and orientation features. IEEE Trans. Syst. Man Cybern. Part C Appl. Rev. 2010, 41, 274–279. [Google Scholar] [CrossRef]
  40. Jeng, R.H.; Chen, W.S. Two feature-level fusion methods with feature scaling and hashing for multimodal biometrics. IETE Tech. Rev. 2017, 34, 91–101. [Google Scholar] [CrossRef]
  41. Alshehri, H.; Hussain, M.; Aboalsamh, H.A.; Al Zuair, M.A. Cross-sensor fingerprint matching method based on orientation, gradient, and Gabor-HoG descriptors with score level fusion. IEEE Access 2018, 6, 28951–28968. [Google Scholar] [CrossRef]
  42. Chugh, T.; Cao, K.; Jain, A.K. Fingerprint spoof buster: Use of minutiae-centered patches. IEEE Trans. Inf. Forensics Secur. 2018, 13, 2190–2202. [Google Scholar] [CrossRef]
  43. Shorten, C.; Khoshgoftaar, T.M. A survey on image data augmentation for deep learning. J. Big Data 2019, 6, 60. [Google Scholar]
  44. Gomez-Barrero, M.; Kolberg, J.; Busch, C. Multi-Modal Fingerprint Presentation Attack Detection: Analysing the Surface and the Inside. In Proceedings of the International Conference on Biometrics (ICB) 2019, Crete, Greece, 4–7 June 2019; pp. 1–8. [Google Scholar] [CrossRef]
  45. Ross, A.A.; Nandakumar, K.; Jain, A.K. Handbook of Multibiometrics, 1st ed.; Springer: Berlin/Heidelberg, Germany, 2011. [Google Scholar]
  46. Peng, J.; Abd El-Latif, A.A.; Li, Q.; Niu, X. Multimodal biometric authentication based on score level fusion of finger biometrics. Optik 2014, 125, 6891–6897. [Google Scholar] [CrossRef]
  47. Gottwald, S. Local and relativized local finiteness in t-norm based structures. Inf. Sci. 2013, 228, 26–36. [Google Scholar] [CrossRef]
  48. Weber, S. A general concept of fuzzy connectives, negations and implications based on t-norms and t-conorms. Fuzzy Sets Syst. 1983, 11, 115–134. [Google Scholar] [CrossRef]
  49. Hanmandlu, M.; Grover, J.; Madasu, V.K.; Vasirkala, S. Score level fusion of hand based biometrics using t-norms. In Proceedings of the IEEE International Conference on Technologies for Homeland Security (HST) 2010, Waltham, MA, USA, 8–10 November 2010; pp. 70–76. [Google Scholar]
  50. Keras. Keras: The Python Deep Learning API. 2020. Available online: https://keras.io (accessed on 9 October 2020).
  51. Developers, G. Keeping Your App Responsive|Android Developers. 2015. Available online: https://developer.android.com/training/articles/perf-anr.html (accessed on 16 August 2016).
  52. Casula, R.; Micheletto, M.; Orrù, G.; Delussu, R.; Concas, S.; Panzino, A.; Marcialis, G.L. LivDet 2021 Fingerprint Liveness Detection Competition–Into the unknown. In Proceedings of the International IEEE Joint Conference on Biometrics (IJCB) 2021, Shenzhen, China, 4–7 August 2021; pp. 1–6. [Google Scholar] [CrossRef]
Figure 1. An overview of proposed method.
Electronics 11 02515 g001
Figure 2. The proposed architecture of CNN#1 (a), CNN#2 (b), and FNN (c).
Electronics 11 02515 g002
Figure 3. Fusion methods: The mean A C C differences between datasets.
Electronics 11 02515 g003
Figure 4. PAD methods: The mean A C C differences between datasets.
Electronics 11 02515 g004
Table 1. The dataset structure for evaluation.
DatasetTrain (Original)Train (Augmented)Test
LiveFakeLiveFakeLiveFake
Green Bit1000120012,00014,40010201224
Digital Persona1000100012,00012,00010191224
Orcanthus1000120012,00014,4009901088
Table 2. The performance comparison between fusion methods.
MethodGreen Bit Digital PersonaOrchantusOverall
FerrliveFerrfakeACCFerrliveFerrfakeACCFerrliveFerrfakeACC
Our FNN0.771.4198.915.538.3293.084.800.7597.2396.40
Our CNN#10.300.9399.393.416.6194.993.210.4898.1697.51
Our CNN#20.310.9399.383.534.6195.933.990.5497.7497.68
Max0.651.1199.125.117.6693.624.310.6597.5296.75
Min0.641.0199.184.947.0194.034.420.6697.4696.89
Sum0.441.0199.284.936.2194.434.520.6597.4297.04
Median0.491.0199.254.366.2294.714.480.6597.4497.13
W-Sum0.270.9499.404.356.0194.823.920.5397.7897.33
LLR0.651.5998.884.737.9193.684.461.1897.1896.58
SVM0.623.4397.986.457.9992.784.375.7194.9695.24
EL-HV0.391.1799.223.245.9495.413.760.6497.8097.48
EL-AB0.580.6299.403.465.8895.333.420.6297.9897.57
Our Method0.360.8399.413.424.3696.112.230.4898.6598.05
Table 3. The performance comparison between existing PAD methods.
MethodGreen BitDigital PersonaOrchantusOverall
FerrliveFerrfakeACCFerrliveFerrfakeACCFerrliveFerrfakeACC
PADUnkFv3.241.5597.684.87.6793.633.642.0297.2196.17
JLW_LivDet0.391.1499.27.7513.9688.864.750.5597.4595.17
ZJUT_Det_A0.391.1499.27.7514.1588.774.650.5597.595.16
ZJUT_Det_S0.391.1499.27.7514.0688.814.750.5597.4595.15
Our Method0.360.8399.413.424.3696.112.230.4898.6598.05
Table 4. The performance comparison between different architectures: accuracy.
ArchitectureGreen BitDigital PersonaOrchantusOverall
FerrliveFerrfakeACCFerrliveFerrfakeACCFerrliveFerrfakeACC
LBP+SVM2.242.0797.856.7416.2588.515.111.0396.9394.43
LPQ+SVM5.111.4596.727.2218.0387.386.931.2595.9193.34
LBP+LPQ+SVM5.091.3896.777.0916.2588.336.651.0496.1693.75
LBP+NN0.671.6398.855.618.1293.145.241.0296.8796.29
LPQ+NN0.881.2998.925.539.4492.524.930.9997.0496.16
Our FNN0.771.4198.915.538.3293.084.800.7597.2396.40
ResNet-340.421.2599.173.914.5795.763.930.7397.6797.53
Slim-ResNet0.591.2599.084.165.1195.374.050.8997.5397.33
VGG-160.511.299.155.774.3894.934.150.5397.6697.24
VGG-190.391.1199.254.034.3195.8340.5397.7497.61
Our CNN#10.300.9399.393.416.6194.993.210.4898.1697.51
Our CNN#20.310.9399.383.534.6195.933.990.5497.7497.68
Table 5. The performance comparison of different architectures: processing time.
FNN
Architecture
Processing
Time
CNN
Architecture
Processing
Time
LBP+SVM8 msResNet-34151 ms
LPQ+SVM8 msSlim-ResNet92 ms
LBP+LPQ+SVM9 msVGG-1681 ms
LBP+NN11 msVGG-19105 ms
LPQ+NN11 msOur CNN#124 ms
Our FNN12 msOur CNN#249 ms
Table 6. The performance comparison between augmented and non-augmented dataset.
TypeGreen BitDigital PersonaOrchantusDifference
ACCACCACC
Augmented99.4196.1198.652.92
Non-Augmented94.3882.9992.3410.37
Publisher’s Note: MDPI stays neutral with regard to jurisdictional claims in published maps and institutional affiliations.

