1. Background
As industrial technology is rapidly evolving, cyberattack methods and types are becoming diversified. In a network with high traffic, it is critical to distinguish between normal and malicious behavior quickly and accurately. Network traffic analysts assess suspicious data and take action to prevent it; however, there is a limit to how much traffic volume humans can handle in real life. To handle this issue, an AI system is introduced for quick and efficient detection based on attack type. It is now feasible to respond swiftly and precisely to known attacks, as well as foresee and prepare for unknown attacks, thanks to the development of AI systems. In addition, the biggest advantage of AI system is automation. Research on and implementation of AI systems are critical in light of the benefits of lowering the labor that people must undertake in a variety of industries. Many studies on designing an intrusion prevention system in combination with an AI model have been conducted in order to develop and improve this environment [
1,
2,
3]. Most works aim to improve the performance of the system by building various machine learning and deep learning models and building new access systems. However, the biggest challenge of performance-oriented research is that complex performance models are often composed of black boxes, so there is a limit to interpreting the results of the class predicted by the AI model and the class probability. Consequently, no matter how good the model is, it cannot be put to immediate use. As a result, for the development of contemporary real-world intrusion detection systems, it is critical to understand the process inside the system and build a verified system by securing its reliability.
AI systems are unquestionably necessary in many industries. However, few AI models can explain how they arrive at their decisions; most models merely provide the prediction result and the probability result for prediction. As a result, analysts have little choice but to trust the AI-predicted outcomes. In the field, even a security control center with a high-performing IDS system eventually requires validation by a human analyst. The results detected by the network intrusion detection system are determined and acted upon by the analyst based on the log information of the traffic. However, analysts who do not know the inside of the AI model cannot interpret and explain the results. In order for users to make final labeling through interpretation, they must provide reliable detection results and a description of the results from input to prediction. Interpretability is an essential element of a model that can explain and interpret predictive results. Prior to the introduction of the AI system, the initial IDS can directly create rules based on malicious data processing experience and expertise, and can quickly detect malicious traffic based on the rules. However, the rules generated based on expertise have the drawback of being diverse in structure and reducing readability. A rule-based learning approach can complement this and is good in terms of interpretability [
4]. A rule in the form of an If-Then conditional expression can be defined and implemented. Rules are useful because they conditionally define previously unclear ideas. Analysis using rule-based learning is easy for analysts to access and understand, so it is possible to easily understand AI judgments that could not be understood before during analysis by linking with the prediction results of the AI model.
Even when using a high-performance model with proven performance, false positives and false negatives inevitably occur, so all prediction results cannot be unconditionally trusted. Therefore, similar to understanding and explaining the results predicted by the AI model, the process of finding data that needs re-examination among the prediction results of the model is also important. This process is used to identify and classify data that falls outside of a statistically acceptable range of predictions in order to evaluate if it requires further re-examination. The process of screening suspicious data is a series of procedures for accurate interpretation, and all processes of the AI model can be understood and expanded.
In the existing artificial intelligence system environment, a widely used rule-based learning method was adopted to solve the absence of an explanation of judgment results. Furthermore, the purpose was to provide a reliable explanation through the process of classifying suspicious data among AI judgments that were not introduced in the past. Proposed method provides a strategy that takes into account analysts’ viewpoints in addition to performance in order to reach beyond the shortcomings of performance-driven approaches that have been examined to effectively discriminate between legitimate and malicious traffic.
The rest of this research is organized as follows.
Section 2 describes the interpretability and the reliability research of the model.
Section 3 presents a proposed method that considers both interpretability and reliability, such as an analyst who analyzes the predicted results of an intrusion detection system.
Section 4 describes the experimental process and results to verify the method proposed in
Section 3. The final section presents conclusions about the proposed method.
2. Related Works
2.1. Improving the Performance of Intrusion Detection Systems
Traffic passing in real time in cyberspace contains some malicious activity. Vamvakas, P. et al. proposed two different communication alternatives to recognize normal and malicious user behavior for network protection [
5]. Malicious behavior evades detection through technology that hides identity and data. In order to track and detect malicious behavior in the field, an intrusion detection system has been built and used as a security solution. Existing intrusion detection systems are divided into two categories: Signature Intrusion Detection Systems (SIDS) and Anomaly-based Intrusion Detection Systems (AIDS) [
6]. SIDS is a knowledge-based detection method that immediately detects if an attack matches a previous attack [
7,
8] SIDS is vulnerable to unknown attacks. Recently, attacks have changed to be more intelligent, and variants have increased, showing a more helpless appearance. To deal with such attacks, AIDS often uses machine learning to detect behavior that deviates from established standards, which can detect zero-day attacks through anomalies. However, AIDS has the disadvantage of many false positives. Anomaly scores can be malignant but are often normal [
9,
10,
11].
2.2. Research in Developing an Explainable Model
The requirement to quickly and accurately differentiate between normal and malicious traffic is ultimately the most crucial factor in a control center’s ability to detect anomalies contained in massive amounts of data in real-time. Therefore, efforts to overcome restrictions such as human resources, time, and costs incurred, and to perform efficient detection are the goals of the action detection task beyond the present. The most effective approach out of the numerous available methods is establishing an AI-based detection environment. Shang, Y. tried to solve the problem through a consensus algorithm in a control system to find the consensus of ambiguous boundaries such as normal and malignant [
12]. However, as a result, human intervention is required in the final decision interval. Therefore, it is necessary to be able to interpret the prediction results of the system in the process of detecting malicious intrusions using AI in the network environment and interpreting the detection results by the final decision-maker. When a system provides interpretability, it is possible to understand its judgment process. Existing systems mostly consist of black box models, so the classification criteria are unknown, but transparent models such as Decision Tree and KNN clearly present data classification criteria and intuitively understand by users, making them easy to interpret [
13,
14]. However, a transparent model is less accurate than black box models. High-performance models, such as ensembles, cannot provide explanations on their own, so they need to provide interpretability through other mediums. Methods that can provide explanations for models can be divided into increasing interpretability through post-hoc explainable models and creating direct explainable models. Ribeiro, M.T, et al. proposed an algorithm called LIME, one of the representative methods of post-hoc explainable models, to provide an internal explanation for the prediction of classification models [
15]. It was used as the goal of local analysis for individual instance analysis through the contribution of features. Another method, SHAP, attempted to provide an interpretation by generating an explanatory model based on Shapley values [
16]. These post-interpretable models attempt to measure the influence of features on the prediction process or account for feature interactions.
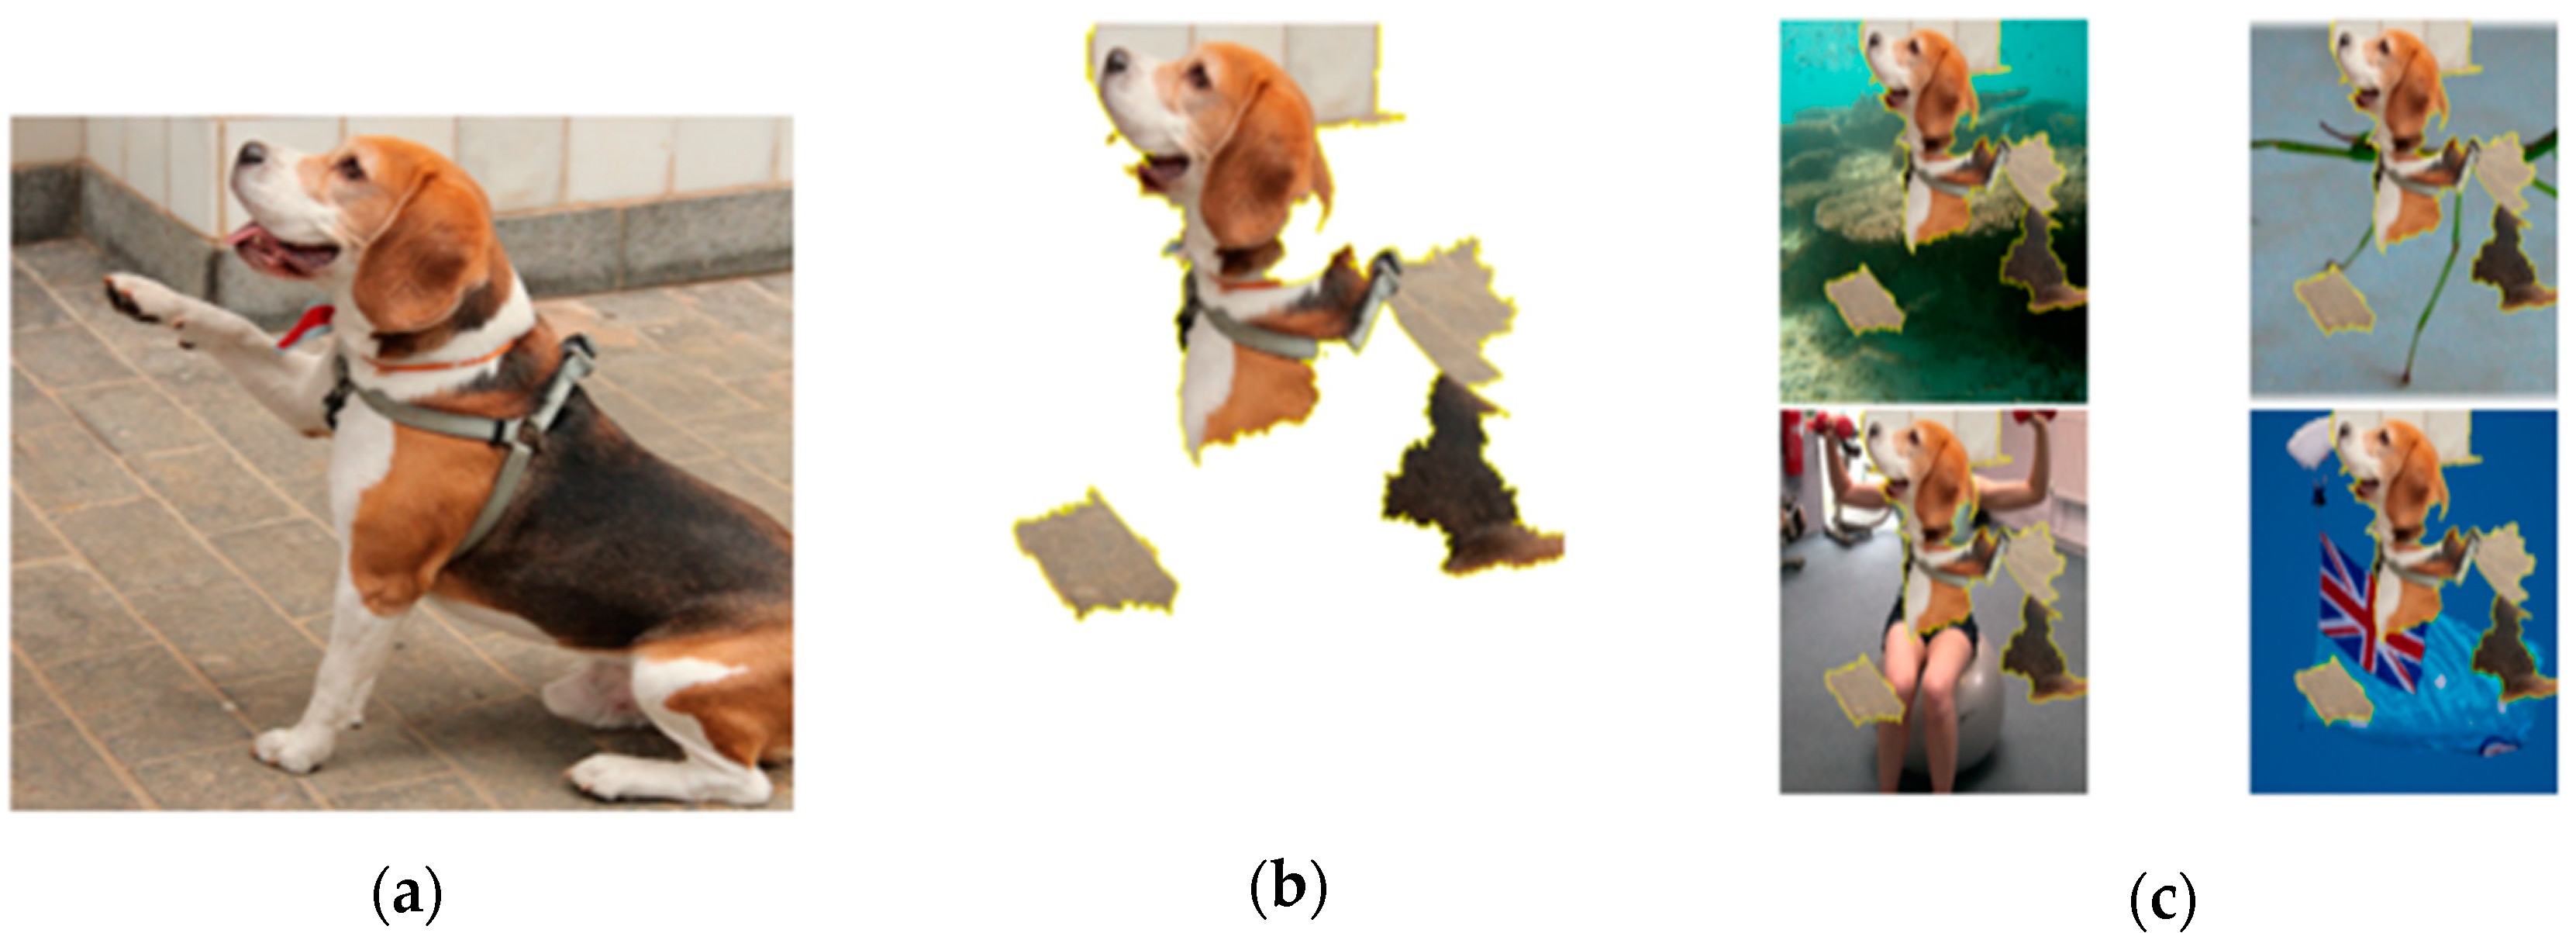
Among the post-analysis model-based methods, LIME provides analysis on the analysis target instance, but the scope other than the analysis target instance is not clear, so the subject of analysis is limited. To overcome this issue, the LIME developers proposed a concept called Anchor [
17]. Being model-agnostic, the scope of this application is clear, so the use value is high. Anchor enhances the user’s understanding by creating an intuitive expression that includes key elements that can be interpreted.
Figure 1 explains the image of a dog as a Rule. Recognize the key element,
Figure 1b, as a dog in any background, as in
Figure 1c. The key is that the Anchor does not require additional information to describe that object by providing the key elements, as shown in
Figure 1b. The majority of approaches that construct explainable models provide analysis through rules. Anchor expresses key elements in the form of rules. Rules created in separate models should be self-explanatory, such as anchors, and should have a clear scope of application. Núñez et al. proposed an approach to express the classification criteria of the high-dimensional region of SVM, which is an internal unknown and complicated model, in text that is easy for humans to understand, and to extract rules so that they can be interpreted and understood [
18]. As such, rules enable analysts in the field of network intrusion detection to understand traffic. When used in the field of network intrusion detection, this rule-based description supports a complex process knowledge, which makes it simpler for analysts to understand traffic.
Nam, S.M. proposed a fuzzy rule-based custom scenario generation system to solve the limitations of the current system [
19]. It was made possible to build an efficient system with fuzzy rules for ambiguous conditions. Rule has a function to make it possible to infer the result by expressing it by the belonging value for the object whose boundary is ambiguous. For a long time, rule-based learning models have been utilized to understand the internal structure of various black box models, and more research is being undertaken to expand the interpretability. Research in the field of deep learning, which has been in the limelight recently, is being actively conducted, and research on rule-based explanatory functions is being actively conducted in order to understand the inside of deep learning consisting of complex connections. Bologna, G. et al. proposed a method of extracting a rule from a decision tree obtained from a deep learning model [
20]. Although deep learning models do not present an explanation on their own, we can show that by building alternative explainable models and extracting rules, we may deduce the output of the prediction model. As such, the decision tree is mainly built as an explanatory model. Mahbooba, B. et al. analyzed the rule created in the Decision Tree, an analysis model, for traffic analysis in connection with the attack class, and presented the possibility of efficient interpretability by the analyst through the rule [
21]. It is strategically structured to induce more efficient analysis by providing additional explanations to the existing system.
2.3. Methodology for Selecting Optimal Rules
The rule-based explanation technique that describes the internal decision rule of the black box model has varied accuracy and coverage for each extracted rule. The rule centered on accuracy increases the number of conditions, which increases the length and lowers readability. If used without considering the coverage of the rule, incorrect interpretation may occur. Therefore, when providing a rule-based explanation function, it is important to properly maintain the performance and interpretability of the trade-off relationship. In order to select a rule considering the interpretability and accuracy relationship, there are various research cases to select a suitable rule using a multi-objective evolutionary algorithm (MOEA) [
22,
23]. Although MOEA cannot obtain the best solution that can achieve all goals concurrently, it was introduced to find the optimal rule through the fit function between interpretability and accuracy. MOEA is a kind that evolved from genetic algorithms to determine the best solution that conflicts with user requirements among many objectives. It is useful for determining the best rule in a situation where accuracy and interpretability must be balanced. Rey, M.I et al. Suggested a way to find trade-offs with a multi-objective evolutionary algorithm that iterates over pareto-optimal front composed of unaffected vectors to find the optimal rule. Thi, KPL. et al. proposed a method of selecting a rule that satisfies the target performance according to Rule Ranking by assigning weights to the rule set extracted by separating individual DT from the Random Forest [
24]. Two methods were used to select the Rule suitable for the target performance. A refined rule was extracted by selecting the top-down method of finding the target performance at the upper level and the bottom-up method of selecting the rule that matches the goal by removing the lower-level rule. Doshi-Velez, F., et al. define interpretability as results being explained or presented in terms that humans can understand [
25]. Selecting rules with acceptable compromises in a human-centered approach is critical.
2.4. Detecting Suspicious Data Statistically
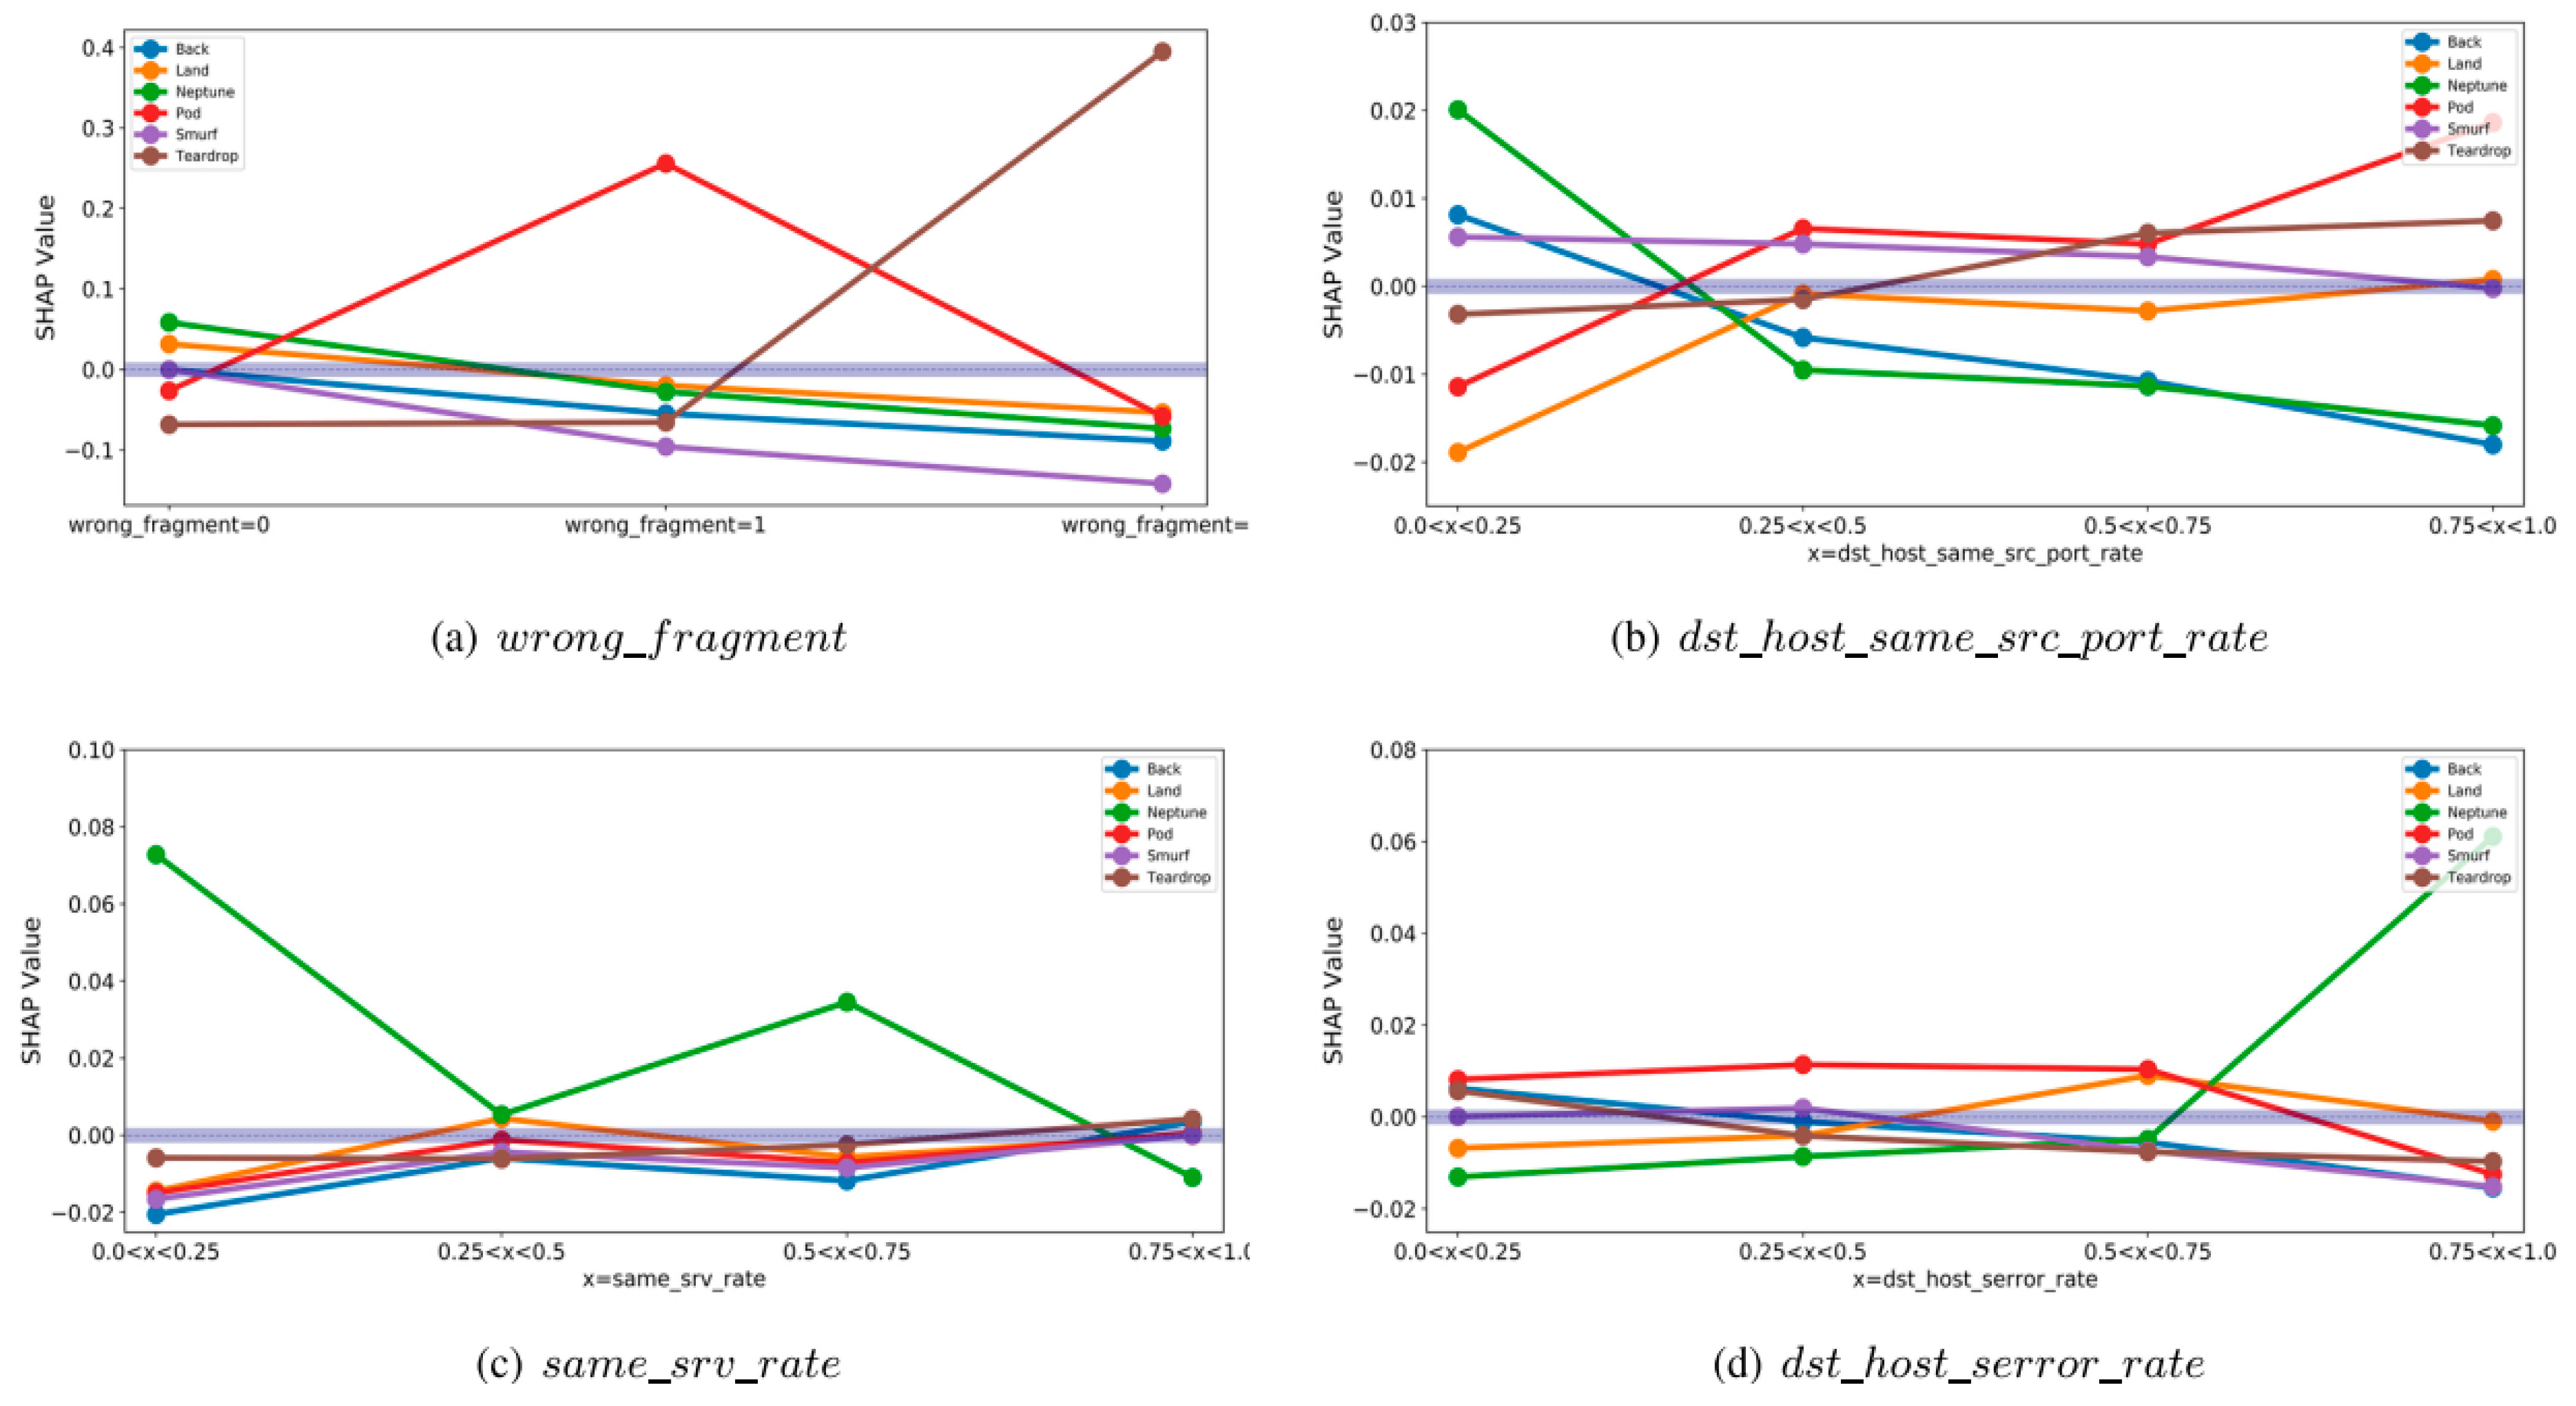
As a field that has been actively researched recently, eXplainable Artificial Intelligence (XAI) provides explanations using artificial intelligence technology that can explain the predictions of AI models. Wang, M. et al. proposed a SHAP-based framework among XAI to explain the IDS results. SHAP value enables interpretation of the result of selecting Class by the value that numerically expresses the contribution of the feature [
26]. As shown in
Figure 2, when the real value and SHAP value are analyzed in association, it shows that a meaningful interpretation is possible in a specific range. Through SHAP, we tried to describe the model in a local and global approach with visual as well as numerical representations inside the model. Similarly, we proposed a mechanism that can confirm abnormal alarms for the results by utilizing SHAP [
27]. This notion, known as Feature Outlier Score (FOS), allows you to verify whether the prediction of AI is trustworthy by calculating the contribution score of the input data using the fact that the SHAP value represents the contribution of each feature. If the prediction result of AI is measured through FOS, it is possible to check the reliability of the prediction model because it measures whether there is any doubt about the result and displays it numerically.
Table 1 summarizes the existing approaches.
3. Proposed Method
Existing systems provide limited information about the results, which is insufficient for analysts to interpret. In order to correctly interpret and understand the internal processes, the system must provide an explanation. Therefore, this research describes internal decision-making as an easy-to-understand rule to address the problem of insufficient information provision in existing systems and proposes a method for efficient interpretation by reexamining statistically suspicious data and classifying reliable data.
3.1. Overview
The overall configuration of the proposed method is shown in
Figure 3. The method proposed in this research comprises three main processes. The AI model generation is the first step. There are two models that need to be generated. This is a procedure for generating a data prediction model and a rule extraction model. After the Pre-Processing process of Train Dataset required for training for model generation, each model is trained, and a model is generated. The second procedure is the representative rule extraction step. As a step to extract the representative rule, first, the rule generated in the tree model classification process is extracted, and the filtering step is executed according to the specified conditions in consideration of accuracy and interpretability. Then, considering the analysis aspect, the remaining rules are used with the child nodes removed from the filtered rules. Finally, the suspicion score is calculated to statistically find the suspicious data. Based on the predictive model of the train dataset and SHAP values, the FOS of the test dataset is calculated, the suspected features are screened, and the data to be statistically reviewed are presented.
3.2. Model Generation for System Construction
Existing monitoring systems provide only vague results. To improve this, this method builds a separate model to provide a description for a model that does not provide a sufficient description. This approach generates models specialized in prediction and description. For proper training, the training data for the model must be preprocessed and trained. First, the predictive model is created by selecting a model suitable for the purpose regardless of the type. The prediction model can be used regardless of the model type. Therefore, a model suitable for the use environment and purpose is selected and generated. Next, the main purpose of creating an explainable model is interpretation. A process of removing unnecessary elements is required for interpretation. The proposed method when generating an explainable model reduces the complexity of analysis by proceeding with a feature selection process that selects upper features through information gain during the process by Mahbooba, B. et al. The explainable transparent model is trained upon a dataset of selected features to provide an efficient explanation.
3.3. Rule Extraction
Rules are extracted from the explainable model. The following is the entire Rule extraction procedure.
Connect nodes within DT to create all possible combinations
Set the criteria for user purpose (Accuracy, Coverage, Length)
Filter the entire Rule Set by criteria
Remove the Rule corresponding to the lower node in the Rule Set
Extract the final Representative Rules
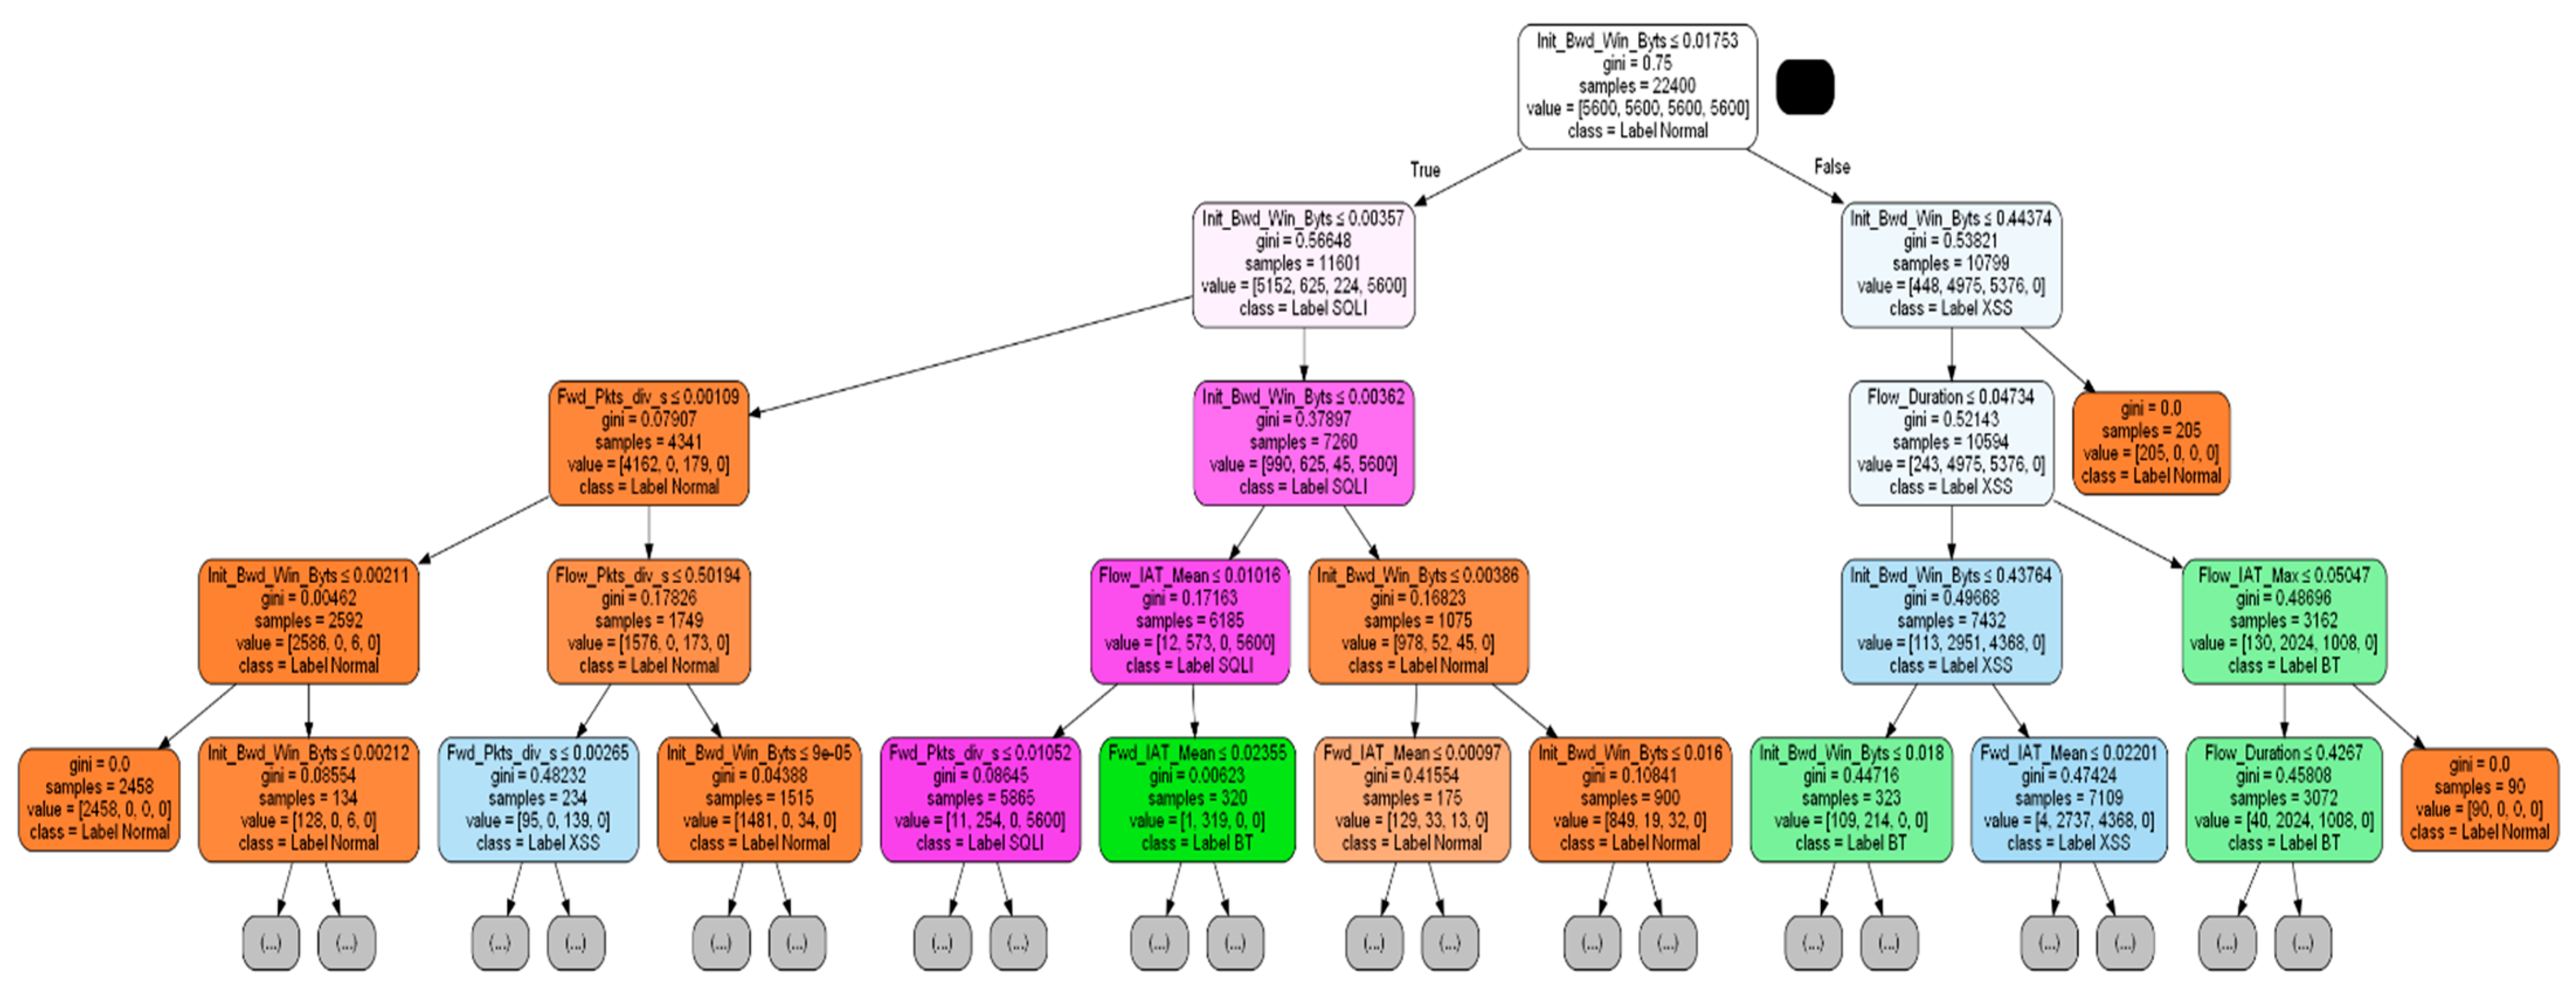
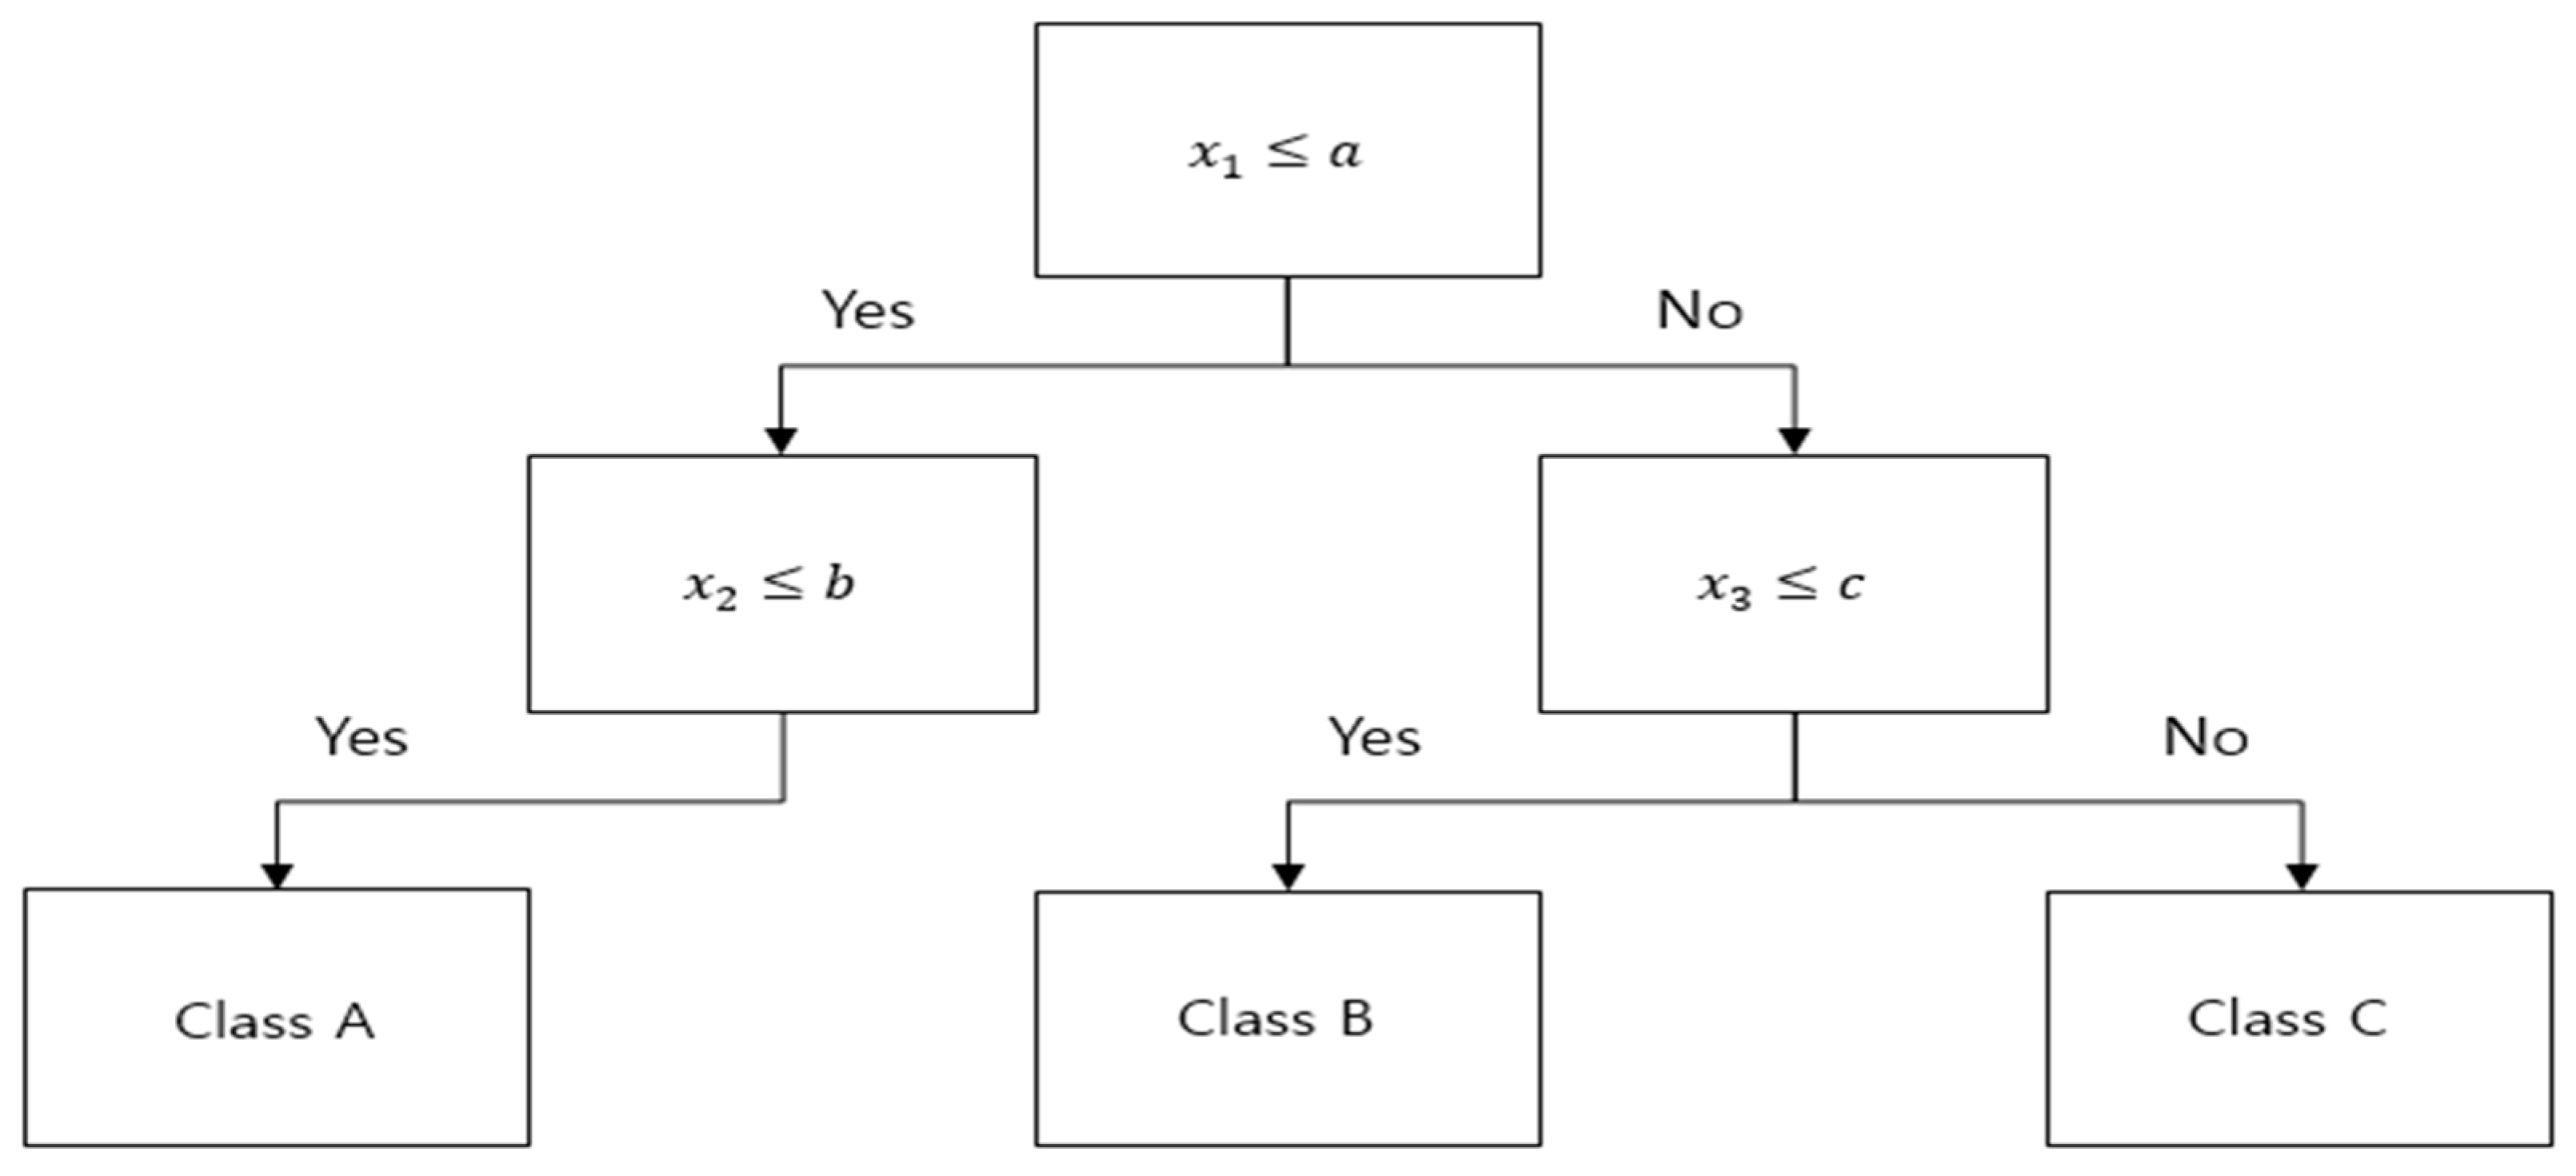
In each node of the generated decision tree, a conditional expression for classifying data is stored as shown in
Figure 4. When the rules classified into class A are inferred in the IF-THEN format, they are expressed in the form of “IF
AND
THEN Class A”. This Rule explains the conditions classified as Class A in the prediction process and serves as a medium to help understanding. Multiple rules can be extracted by inferring all combinations of conditional expressions from the DT model. It should be noted that the reason we use rules is for explanation and interpretation purposes. However, because coverage and performance differ depending on the data, even though the rule is the same, only rules that can be used to explain the data should be chosen. Accuracy and Coverage, which are classified into Classes for each rule, are thus the selection criteria. Accuracy and coverage are regarded as performance conditions, and the length of the conditional expression is included in the selection criteria in consideration of interpretability. As is shown in Algorithm 1, the user sets three condition criteria: Accuracy, Coverage, and Rule Length. With the entire rule set extracted based on the set conditions, rule mining work that matches the conditions required by the user is advanced, and the rules are filtered. The final step is to increase interpretability. Among the filtered rule sets, the class described is the same and the rule existing as a sub-node is removed. A rule that describes the same class but contains child nodes is useful for analysts because it can be fully explained as a parent node and is short in length. Analysts understand and interpret the decision of AI using the finally extracted rule cogently.
| Algorithm 1 Rule Set Filtering |
1: Input: Rule Instance—, Condition of Rule set (Acc, Cov, Rule Length)
2: for in Total Rule set do
3: if & &
4: Rule set based on Condition
5. Output: Rule set based on Condition |
3.4. Calculation of Suspicious Scores
The next step is to verify the reliability of predictive model decisions before analysts analyze the data instance. FOS is a score indicating the degree of anomaly of features that contributed to prediction of model [
27]. FOS is extracted based on SHAP values, which indicate the extent to which features related to the prediction of the model are affected. In the process of extracting the rule, only the important features selected through the feature selection process are used. In the process of deriving the suspicion score as a result of the prediction model judging the instance, the range interval is set based on the training data and the SHAP value, and the FOS is calculated using the CDF of the prediction data. The formula for FOS is:
FOS for each feature of the analysis target instance is extracted. The corresponding value determines if there is any confidence or suspicion according to the criteria for the specified Threshold. Measured FOS can tell you which features you should suspect in your analytical data. The proportion of features that are suspicious among the selected ten features is calculated. Depending on the suspicion rate calculated in this way, analysts are guided to determine whether the results predicted by the AI model are suspicious. Therefore, as suspicious data can be filtered, it is possible to review the data that needs re-interpretation, and it helps to proceed with the interpretation of reliable data.
3.5. Complexity and Applicability of the Proposed Algorithm
This study proposes a process of
Section 3.3 and
Section 3.4 to overcome the limitations of existing systems. Finding malicious activity when there is a lot of traffic requires quick and accurate detection. Therefore, this section intends to discuss the different complexity and implementation possibilities when the proposed method is applied to the existing environment. The computational complexity from the process of extracting the entire rule from the Decision Tree to the process of searching for the final rule set that meets the conditions and the process of searching for suspicious data through FOS appears as O(n). Such a result falls under the quick type of computational cost. From the results, it can be concluded that there is no significant change in computational complexity when applied to the existing system. In addition, since both models generated can be applied regardless of the type of AI model used in the real environment, it is an algorithm that is sufficiently applicable in terms of complexity and applicability.
3.6. Proposal for a New Interpretive Perspective
The results presented by the current system only provide prediction results and prediction probabilities, and analysts face challenges because they lack interpretable information. Therefore, this research tried to improve the analysis environment by addressing the issue of the present system’s limited information and providing the analyst with information helpful for analysis. The proposed method presents two aspects that present not only the result but also an explanation of the result. The first solves the absence of explanations for the internal processes of the AI model. It helps to understand judgment of AI easily by providing an explanation as a rule. The second statistically classifies data that needs to be reviewed. In the process of processing the detected data, judgment errors of AI can be detected.
Table 2 compares the current system and the system to which the proposed method is applied. The only information provided by the current system is data values and prediction results. Interpretations that analysts can glean through this information are limited. The proposed system provides information on the corresponding rule among the extracted representative rules along with the existing information and an explanation indicating the elements that need to be reviewed. As the information of the Rule that each instance is included in is also provided, the analyst can easily understand and analyze the result of judgment through the corresponding explanation. In addition, including information that needs review, it detects prediction errors and induces accurate analysis through re-examination.
4. Experiment
Based on the method proposed in
Section 3, the most recent IDS Dataset is used, and an explanatory function is added from the perspective of a real analyst to understand and interpret the system results.
4.1. Applicability in a Real-Time Environment
The proposed method has a process of extracting rules and a process of calculating suspicious prediction results. The rule extraction process generates rules from another model, and the process of extracting suspicious scores is applicable without model constraints. Therefore, the advantage and essential feature of the suggested approach is that it may be used in a variety of operating situations without incurring large computational costs due to the application of algorithms with no high complexity.
Section 4 aims to verify the proposed method through the implementation process by selecting commonly used models and datasets.
4.2. Model Generation
The proposed method generates two different models. The two models are created using the same dataset for different purposes.
4.2.1. Dataset
One of the most crucial aspects of creating a high-performing model is the selection of training data. Among the datasets used for IDS construction, the CIC-IDS2017 dataset created relatively recently is used. CIC-IDS 2017 provides a variety of attacks by creating and collecting scenarios from the Canadian Institute for Cybersecurity [
28]. This dataset satisfies all of the reliable criteria provided by the dataset evaluation framework. It is network data labeled as ‘attack’ and ‘normal’ by extracting more than 80 network features using CICFlowMeter from traffic in various environments. The dataset is extracted as per day of the week and consists of various attacks from Monday to Friday. This research uses Thursday-morning, which consists of web attacks that are part of a dataset. The data structure is the same as in
Table 3.
4.2.2. Pre-Processing
The data is pre-processed before building the model. The first step is to reorganize the dataset. CICIDS-2017 has many features that are unnecessary or inappropriate for training the model. Features that are meaningless and useless for training are removed. “Flow ID”, “Src IP”, “Src Port”, “Dst IP”, “Dst Port”, “Protocol”, and “Timestamp” are included in the removal target as information that simply identifies the connection. Next to “Bwd PSH Flags”, “Fwd URG Flags”, “Fwd Header Len”, “CWE Flag Count”, “Fwd Bytes/b Avg”, “Fwd Pkts/b Avg”, “Fwd Blk Rate Avg”, “Bwd Bytes/b Avg”, “Bwd Pkts/b Avg”, and “Bwd Blk Rate Avg” were included in the removal target because they had a single value and were meaningless for training. Therefore, a total of 18 features, including class labels, have been removed. The next step is to perform Min–Max Scaling on the remaining features to unify the range of data values, and then split them at a ratio of 7:3 for training and testing. Finally, as can be seen in
Table 3, CICIDS-2017 is an unbalanced dataset with an extremely large number of Normal Classes. Therefore, random under-sampling is performed for Normal, which accounts for a large proportion of the training data, and SMOTE method oversampling is performed for the remaining unbalanced classes. This experiment proportioned each class using under-sampling and oversampling to balance the unbalanced training dataset.
4.2.3. Generating Two Models
Among numerous candidate models, this experiment used XGBoost as a predictive model to predict normal traffic and malicious traffic. XGBoost is an ensemble model made by combining multiple DTs to make up for the shortcomings of DTs with low accuracy and biased learnability in a single Tree model. This model is known as a model that calculates high accuracy with multiple trees, but it is a suitable algorithm for the proposed method as a black box model that does not explain the entire process. The parameters for learning XGBoost are the same as in
Table 4. After training with Train Dataset, the result verified with Test Dataset is the same as in
Table 5.
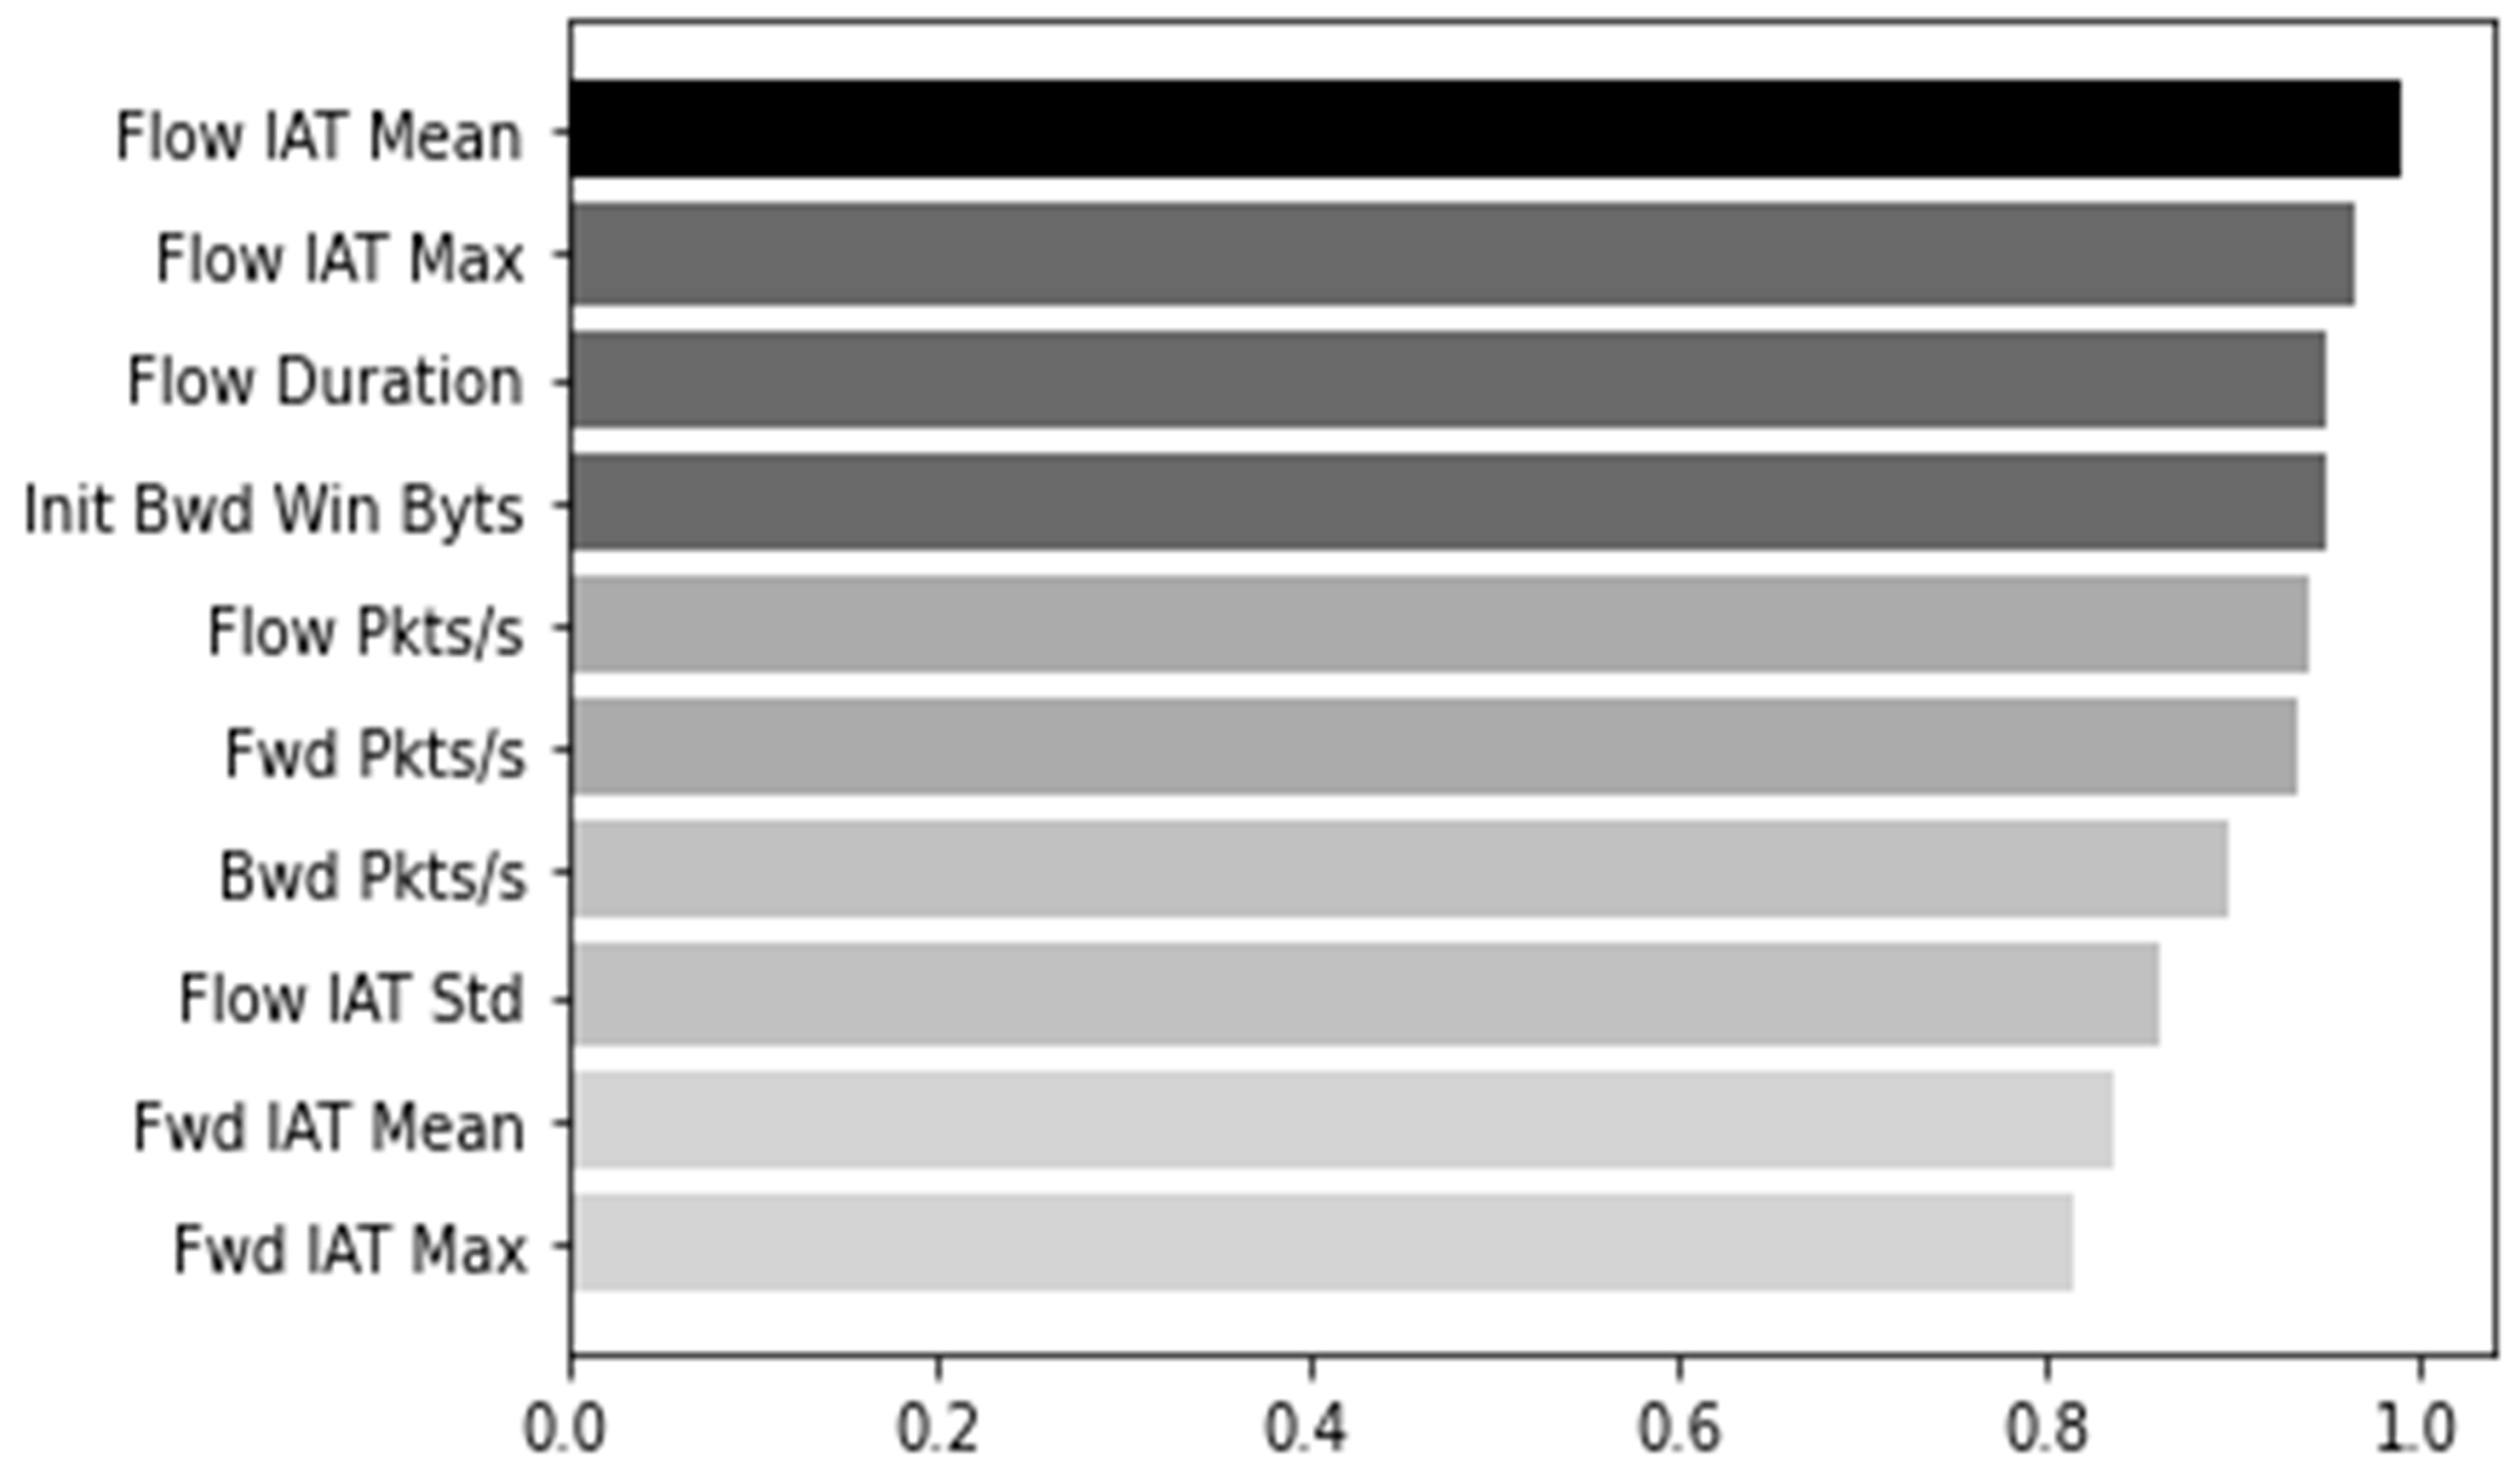
As the internal process from the input to the prediction result is unknown in the prediction result obtained using the black-box model XGBoost, a transparent model DT is generated to provide an explanatory function to extract the rule. Many features were removed and reconstructed from the dataset, while many others remained. The DT model is trained by selecting features for efficient analysis during the generation phase. Feature Selection is conducted to select a feature that has higher interpretation power than other features. As shown in
Figure 5, the top ten features were selected from the existing 66 features by measuring the information gain weight, a method for evaluating high influence. The selected features are “Flow IAT Mean”, “Flow IAT Max”, “Flow Duration”, “Init Bwd Win Bytes”, “Flow Pkts/s”, “Fwd Pkts/s”, “Bwd Pkts/s”, “ Flow IAT Std”, “Fwd IAT Mean”, and “Fwd IAT Max”. A DT model trained on the Train Dataset is generated by including only the corresponding feature and setting the parameters as
Table 6.
Figure 6 is the result of visualizing the results up to Depth 4 among the generated DT models.
4.3. Tools to Explain the Result of the Model
Node combinations are extracted from the generated DT model. As shown in
Figure 6, in each node in DT, the number of samples, classification results, and classification conditions are stored as they expand from the root node to the child node. All possible rule combinations are extracted by combining these conditions. As a result, 170 Rule Set combinations were created. Each rule consists of a logical expression that combines node conditions and contains the class and rule information (Acc, Cov, rule length) to describe. In order to select the rule with high interpretability from the 170 rules, we set the user criteria as listed in
Table 7 and proceeded with filtering. Among 170 rules, 21 rules were filtered by the Rule set condition. Finally, as presented in
Table 8, three representative rule sets were created by removing rules containing child nodes to increase interpretability. As representative rules account for more than half of the total training data, it is obvious that they can provide meaningful explanations and be interpreted efficiently.
Next, indicators are provided to identify suspicious prediction results in the data before analyzing it. The FOS of each feature of the data is calculated, and the suspicion rate is calculated through the ratio of the suspicious features among ten features based on threshold 0.5.
Table 9 shows the results of the suspicious features in the particular instance. Instances with a suspicion rate higher than the threshold can be classified as data requiring review. In this process, it is possible to identify suspicious data to reduce throughput and to re-examine the data that needs to be reviewed, enabling accurate analysis.
4.4. Verfication
This part proves through real examples that the proposed method can provide a better explanation and improve interpretation compared to the existing system.
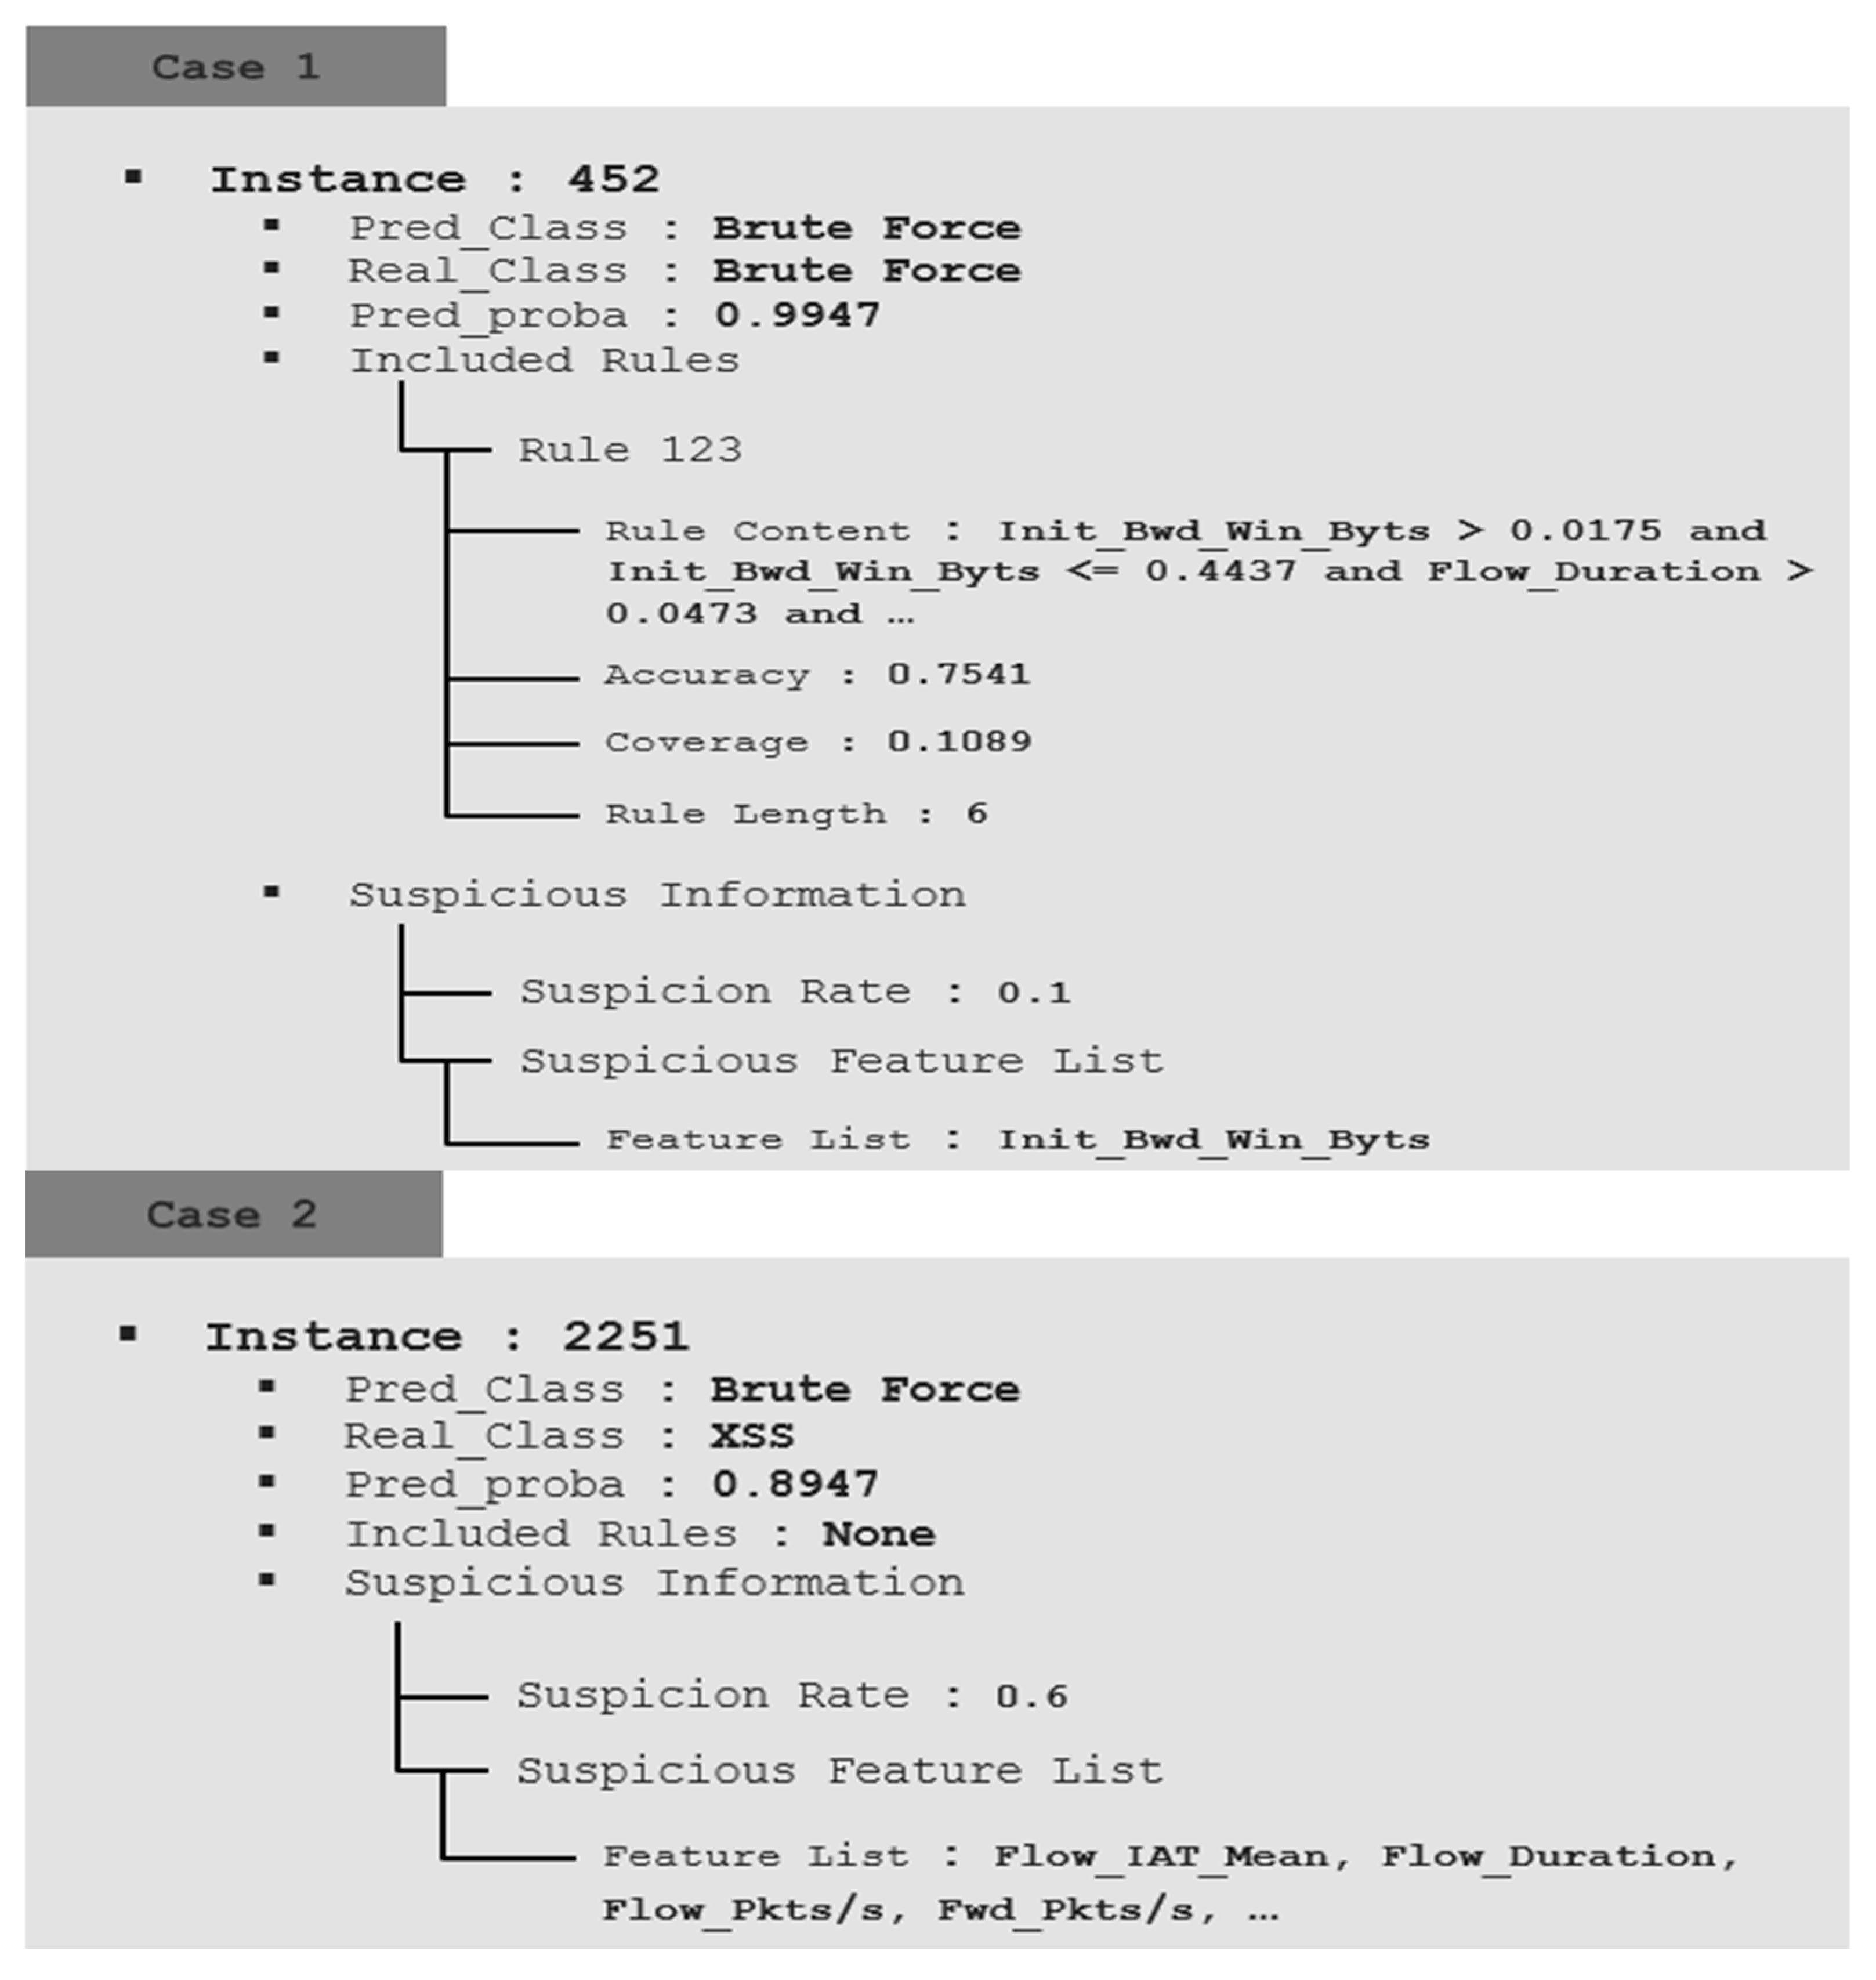
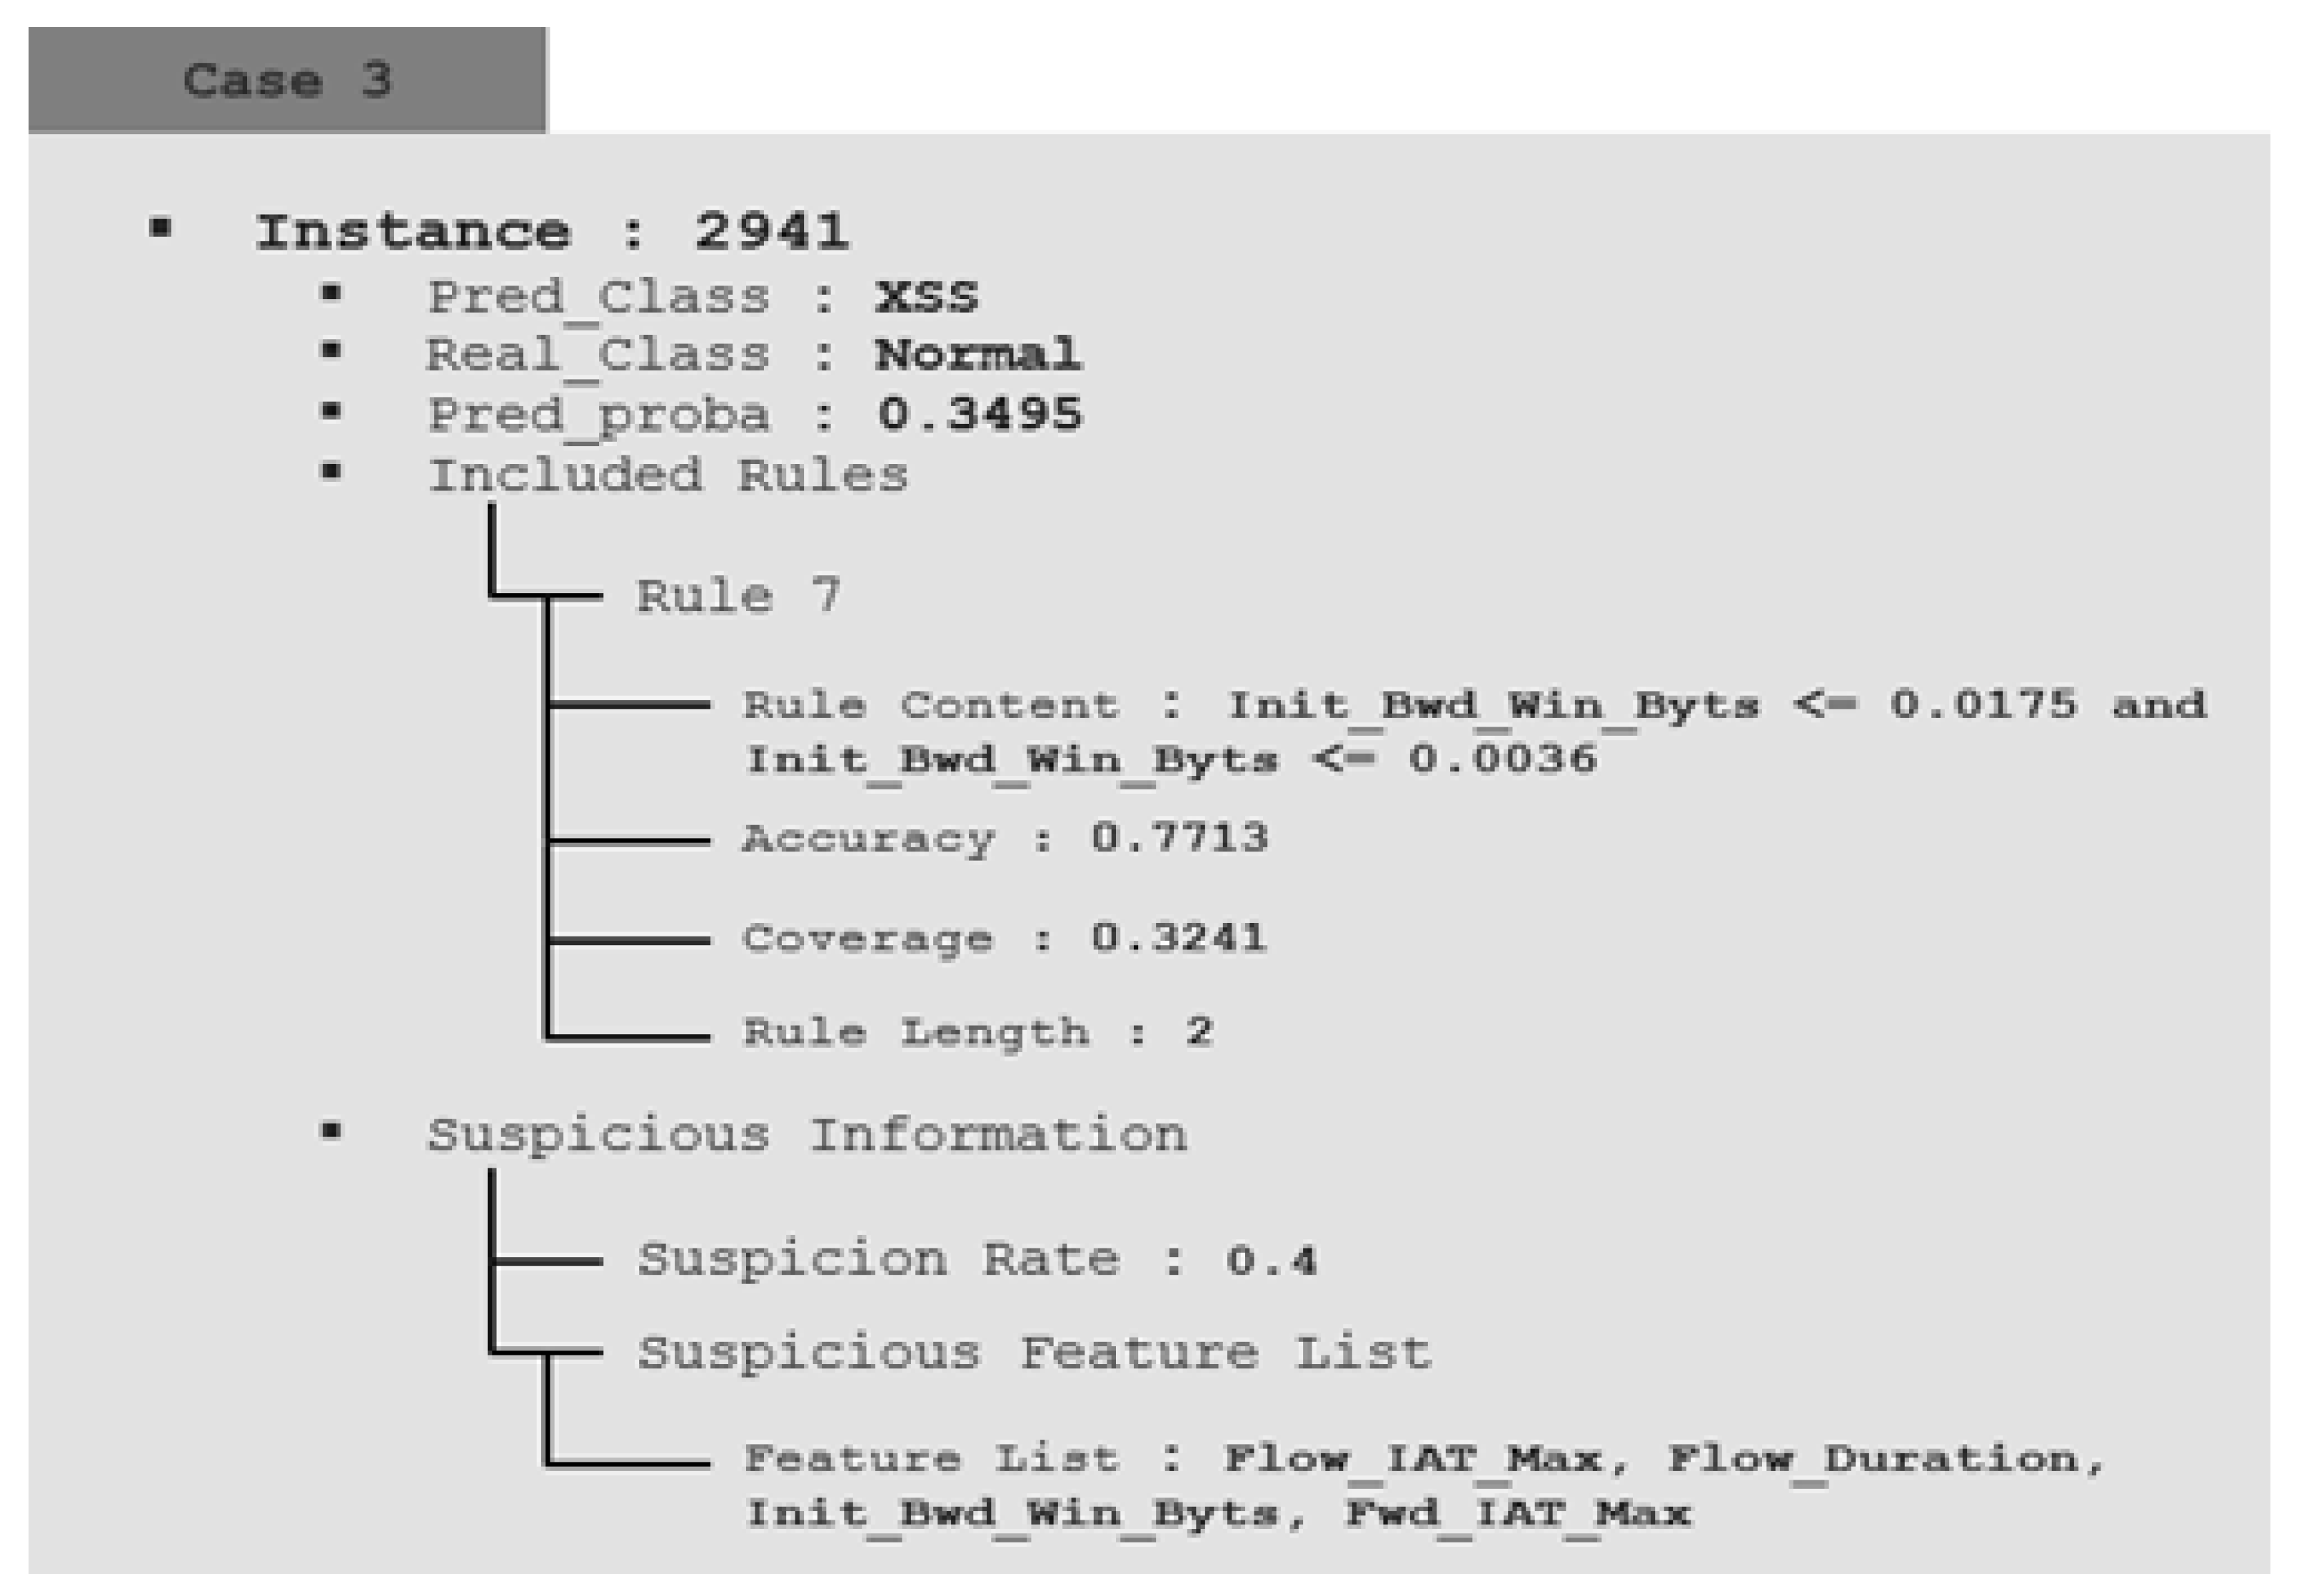
Figure 7 provides information and explanation functions for detection data by applying the proposed method. It provides a new interpretation perspective that includes the two explanations above. As the actual monitoring environment is an unlabeled environment, it is interpreted without considering the actual results. Case 1 was not statistically suspicious, and the system predicted brute force with a probability of 0.9947. It also describes the consequences of system prediction, including rule 123, which accounts for brute force. Through analysis by the analyst using such information, it is finally determined that the behavior of the instance is a brute force attack. This is interpreted in relation to the predicted probability and provides the foundation for the final labeling in this process. Case 2 predicted a brute force attack with a high probability of 0.8947. However, as the suspicion rate is calculated as high as 0.6 without any rule explaining the internal process, the analyst can determine that the prediction of the AI is wrong and can track the error of the AI. Case 3 is an instance that needs review because the suspicion rate is calculated as 0.4, and the prediction probability is also low at 0.3495, so it can be predicted that there was an AI judgment error. However, Case 3, in contrast with Case 2, includes one of the representative rules. When analyzed in detail referring to the included Rule, it corresponds to the condition of the Rule that describes the normal characteristics of the training data. Therefore, the analyst expects it to be a normal class and reviews its instance.
Additional functions, different from existing systems, are provided. First, information is provided on rules that explain internal decisions easily. It can be understood under what conditions the class is judged, and when judgment of the system is wrong, it can be used as a clue to guess the correct class through the rule. Second, the approach provides insights into whether or not to doubt the judgment of AI. By calculating a score, it can identify suspicious circumstances and classify suspicious data, enabling efficient interpretation and tracking of errors. By adding these explanatory features, analysts can understand the system and make final decisions, making it richer and easier to analyze than traditional systems.
5. Conclusions
In order to deal with rapid variations in network attacks, It improves the existing IDS and provides an AI system that can efficiently identify such assaults in order to deal with rapid alterations in network attacks. In general, the better the performance of the AI system, the more complicated it becomes, which causes a fundamental problem of reduced reliability. Correspondingly, in recent years, the applicable range of systems that are not guaranteed to be reliable is decreasing. Ultimately, the final label decision is made by a person, but the only information provided to that person is the value of the detection data and the prediction result. What the analyst needs is an explanatory function that underpins the prediction, not the outcome and probability. In contrast to the current system, it is urgent to give explanation and interpretation of the results, as well as to build a reliable system.
This research intends to provide reliable results and explanations of detection results to analysts who monitor and analyze intrusion detection systems to which AI systems are applied. It is necessary to analyze the detected data in an exponentially large amount of data, but the amount that an analyst can process is limited. In addition, the information provided by the current system cannot be understood because the internal process of the system is unknown, and the contents that can be interpreted are limited. The proposed system aims to overcome the issue of limited interpretation due to the lack of information in the current system. The current system suffers from the lack of explanation of the results and the explanation of whether the detection results are reliable. The proposed method provides two explanations. The first expresses the internal decision-making conditions of the AI system as rules. Analyzing the results and rules together helps to easily understand the judgment results of AI. Second, among the prediction results, the errors in AI judgment can be tracked by classifying the instances that need to be reviewed as thresholds. In addition, the overall system performance can be improved by correcting errors by reinterpretation.
The proposed method was studied to improve the existing system. Of the two aspects, SHAP, which is used in the process of extracting suspicious data, represents the limits of this research. The process of calculating FOS extracts statistical outliers from SHAP values. Therefore, the proportion of SHAP in the suspicion rate is very high. However, different evaluation outcomes are achieved for each of the many evaluation methods that exist at the SHAP verification step. An unverified SHAP-based extraction method serves as a weakness in our approach. In the future, we intend to do further research in order to develop an assessment approach for XAI in order to overcome this constraint and obtain accurate findings.
Author Contributions
Conceptualization, Y.L., E.L. and T.L.; methodology, Y.L. and T.L.; software, Y.L. and E.L.; validation, Y.L. and T.L.; formal analysis, Y.L.; investigation, Y.L. and E.L.; resources, E.L.; data curation, Y.L.; writing—original draft preparation, Y.L. and T.L.; writing—review and editing, Y.L. and T.L.; visualization, Y.L. and E.L.; supervision, T.L.; project administration, T.L. All authors have read and agreed to the published version of the manuscript.
Funding
This work was supported by Institute of Information and communications Technology Planning and Evaluation (IITP) grant funded by the Korea government (MSIT) (No. 2022-0-00089, Development of clustering and analysis technology to identify cyber attack groups based on life-cycle).
Conflicts of Interest
The author declares no conflict of interest.
References
- Kim, A.C.; Park, M.H.; Lee, D.H. AI-IDS: Application of deep learning to real-time Web intrusion detection. IEEE Access 2020, 8, 70245–70261. [Google Scholar] [CrossRef]
- Deore, B.; Bhosale, S. A Decisive Approach to Intrusion Detection System using Machine Learning Model. WEENTECH Proc. Energy 2021, 143–154. [Google Scholar] [CrossRef]
- Zhang, X.; Ran, J.; Mi, J. An intrusion detection system based on convolutional neural network for imbalanced network traffic. In Proceedings of the 2019 IEEE 7th International Conference on Computer Science and Network Technology (ICCSNT), Dalian, China, 19–20 October 2019; pp. 456–460. [Google Scholar] [CrossRef]
- Zhang, X.; Pan, X.; Wang, S. Fuzzy DBN with rule-based knowledge representation and high interpretability. In Proceedings of the 2017 12th International Conference on Intelligent Systems and Knowledge Engineering (ISKE), Nanjing, China, 24–26 November 2017; pp. 1–7. [Google Scholar] [CrossRef]
- Vamvakas, P.; Tsiropoulou, E.E.; Papavassiliou, S. Exploiting prospect theory and risk-awareness to protect UAV-assisted network operation. EURASIP J. Wirel. Commun. Netw. 2019, 2019, 286. [Google Scholar] [CrossRef]
- Khraisat, A.; Gondal, I.; Vamplew, P.; Kamruzzaman, J. Survey of intrusion detection systems: Techniques, datasets and challenges. Cybersecurity 2019, 2, 1–22. [Google Scholar] [CrossRef]
- Kumar, V.; Sangwan, O.P. Signature based intrusion detection system using SNORT. Int. J. Comput. Appl. Inf. Technol. 2012, 1, 35–41. [Google Scholar]
- Hubballi, N.; Suryanarayanan, V. False alarm minimization techniques in signature-based intrusion detection systems: A survey. Comput. Commun. 2014, 49, 1–17. [Google Scholar] [CrossRef] [Green Version]
- Jyothsna, V.; Prasad, R.; Prasad, K.M. A review of anomaly based intrusion detection systems. Int. J. Comput. Appl. 2011, 28, 26–35. [Google Scholar] [CrossRef]
- Aljawarneh, S.; Aldwairi, M.; Yassein, M.B. Anomaly-based intrusion detection system through feature selection analysis and building hybrid efficient model. J. Comput. Sci. 2018, 25, 152–160. [Google Scholar] [CrossRef]
- Maseer, Z.K.; Yusof, R.; Bahaman, N.; Mostafa, S.A.; Foozy, C.F.M. Benchmarking of machine learning for anomaly based intrusion detection systems in the CICIDS2017 dataset. IEEE Access 2021, 9, 22351–22370. [Google Scholar] [CrossRef]
- Shang, Y. Resilient consensus for robust multiplex networks with asymmetric confidence intervals. IEEE Trans. Netw. Sci. Eng. 2020, 8, 65–74. [Google Scholar] [CrossRef]
- Rovnyak, S.; Kretsinger, S.; Thorp, J.; Brown, D. Decision trees for real-time transient stability prediction. IEEE Trans. Power Syst. 1994, 9, 1417–1426. [Google Scholar] [CrossRef] [Green Version]
- Imandoust, S.B.; Bolandraftar, M. Application of k-nearest neighbor (knn) approach for predicting economic events: Theoretical background. Int. J. Eng. Res. Appl. 2013, 3, 605–610. [Google Scholar]
- Ribeiro, M.T.; Singh, S.; Guestrin, C. “Why should I trust you?” Explaining the predictions of any classifier. In Proceedings of the 22nd ACM SIGKDD International Conference on Knowledge Discovery and Data Mining, San Francisco, CA, USA, 13–17 August 2016; pp. 1135–1144. [Google Scholar] [CrossRef]
- Lundberg, S.M.; Lee, S.I. A unified approach to interpreting model predictions. In Advances in Neural Information Processing Systems; MIT Press: Cambridge, MA, USA, 2017; pp. 4765–4774. [Google Scholar] [CrossRef]
- Ribeiro, M.T.; Singh, S.; Guestrin, C. Anchors: High-precision model-agnostic explanations. In Proceedings of the AAAI Conference on Artificial Intelligence (AAAI), New Orleans, LA, USA, 2–7 February 2018. [Google Scholar] [CrossRef]
- Núñez, H.; Angulo, C.; Català, A. Rule extraction from support vector machines. In Proceedings of the 10th European Symposium on Artificial Neural Networks (ESANN’02), Bruges, Belgium, 24–26 April 2002; pp. 107–112. [Google Scholar]
- Nam, S.M. A Fuzzy Rule-based System for Automatically Generating Customized Training Scenarios in Cyber Security. J. Korea Soc. Comput. Inf. 2020, 25, 39–45. [Google Scholar] [CrossRef]
- Bologna, G.; Hayashi, Y. A rule extraction study on a neural network trained by deep learning. In Proceedings of the 2016 International Joint Conference on Neural Networks (IJCNN), Vancouver, BC, Canada, 24–29 July 2016; pp. 668–675. [Google Scholar] [CrossRef]
- Mahbooba, B.; Timilsina, M.; Sahal, R.; Serrano, M. Explainable artificial intelligence (xai) to enhance trust management in intrusion detection systems using decision tree model. Complexity 2021, 2021, 6634811. [Google Scholar] [CrossRef]
- Rey, M.I.; Galende, M.; Fuente, M.J.; Sainz-Palmero, G.I. Multi-objective based Fuzzy Rule Based Systems (FRBSs) for trade-off improvement in accuracy and interpretability: A rule relevance point of view. Knowl.-Based Syst. 2017, 127, 67–84. [Google Scholar] [CrossRef] [Green Version]
- Márquez, A.A.; Márquez, F.A.; Peregrín, A. A Mechanism to Improve the Interpretability of Linguistic Fuzzy Systems with Adaptive Defuzzification based on the use of a Multi-objective Evolutionary Algorithm. Int. J. Comput. Intell. Syst. 2012, 5, 297–321. [Google Scholar] [CrossRef] [Green Version]
- Thi, K.P.L.; Thi, N.C.V.; Phung, N.H. Extracting rule RF in educational data classification: From a random forest to interpretable refined rules. In Proceedings of the 2015 International Conference on Advanced Computing and Applications (ACOMP), Ho Chi Minh City, Vietnam, 23–25 November 2015; pp. 20–27. [Google Scholar]
- Doshi-Velez, F.; Kim, B. Towards a rigorous science of interpretable machine learning. arXiv 2017, arXiv:1702.08608. [Google Scholar]
- Wang, M.; Zheng, K.; Yang, Y.; Wang, X. An explainable machine learning framework for intrusion detection systems. IEEE Access 2020, 8, 73127–73141. [Google Scholar] [CrossRef]
- Kim, H.; Lee, Y.; Lee, E.; Lee, T. Cost-effective valuable data detection based on the reliability of artificial intelligence. IEEE Access 2021, 9, 108959–108974. [Google Scholar] [CrossRef]
- Panigrahi, R.; Borah, S. A detailed analysis of CICIDS2017 dataset for designing Intrusion Detection Systems. Int. J. Eng. Technol. 2018, 7, 479–482. [Google Scholar]
| Publisher’s Note: MDPI stays neutral with regard to jurisdictional claims in published maps and institutional affiliations. |
© 2022 by the authors. Licensee MDPI, Basel, Switzerland. This article is an open access article distributed under the terms and conditions of the Creative Commons Attribution (CC BY) license (https://creativecommons.org/licenses/by/4.0/).


