Abstract
One of the most impressive applications of the combined use of natural language processing (NLP), classical machine learning, and deep learning (DL) approaches is the estimation of demographic traits from the text. Author Profiling (AP) is the analysis of a text to identify the demographics or characteristics of its author. So far, most researchers in this field have focused on using social media data in the English language. This article aims to expand the predictive potential of demographic traits by focusing on a more diverse dataset and language. Knowing the background of deputies is essential for citizens, political scientists and policymakers. In this study, we present the application of NLP and machine learning (ML) approaches to Turkish parliamentary debates to estimate the demographic traits of the deputies. Seven traits were determined: gender, age, education, occupation, election region, party, and party status. As a first step, a corpus was compiled from Turkish parliamentary debates between 2012 and 2020. Document representations (feature extraction) were performed using various NLP techniques. Then, we created sub-datasets containing the extracted features from the corpus. These sub-datasets were used by different ML classification algorithms. The best classification accuracy rates were more than 31%, 27%, 35%, 41%, 29%, 59%, and 32% according to the majority baseline for gender, age, education, occupation, election region, party, and party status, respectively. The experimental results show that the demographics of deputies can be estimated effectively using NLP, classical ML, and DL approaches.
1. Introduction
The estimation of demographic traits focuses on the demographics of text owners, such as age, gender, education, occupation, opinion, political view, and personality. The estimation of demographic or personal traits from text is called as Author Profiling (AP). The combined use of natural language processing (NLP), classical machine learning (ML) and deep learning (DL) approaches offers an unprecedented opportunity to estimate demographic traits from the text. Most of the studies in this field approach the problem as supervised text classification, in which text owners’ traits are pre-defined classes.
The estimation of demographic traits can be crucial for forensics, marketing, and other fields [1]. In forensics, characteristics of text owners such as gender and age can be evidence for an investigation. Regarding marketing, knowing the demographic of the customer can determine the marketing policies of the companies. For politicians, forecasting public opinion on specific issues guides government policies or election campaigns.
Studied data and language are not versatile in the AP. Most studies rely on social media data and use corpora in English. In this work, we investigated the demographic traits of deputies through the Turkish parliamentary debates. Firstly, a corpus was created that includes the transcription of the individual speeches of the members of parliament (MPs) in plenary sessions at the Grand National Assembly of Turkey (GNAT) from the period of 2012–2020. Gender, age, education, occupation, party affiliation, party status affiliation, and election region were determined as the demographic traits of MPs. For document representations (feature extraction), we used different NLP methods such as Bag of Words (BoW), Term Frequency–Inverse Document Frequency (TF-IDF), Low Dimensionality Statistical Embedding (LDSE), Paragraph Vectors (PV) and pre-trained word vectors. Then, we created sub-datasets containing the extracted features from the corpus. These sub-datasets were used in training and testing ML and DL classification algorithms such as Logistic Regression (LR), Support Vector Machine (SVM), Feed Forward Neural Network (FFNN), and the BERT model.
The parliament debates were analysed with seven demographic traits. We predicted the gender of MPs in the first task. In age classification, MPs were categorised into under 40, 40–50, 50–60 and above 60 age groups. The educational status prediction was in terms of professor or associate professor, PhD, graduate, or undergraduate. By occupation classification, MPs were classified based on their occupations or professions. Law, economics and finances, medicine, and engineering are categories of the task. We converted eighty-one election provinces of the MPs to seven geographical regions to obtain the election region’s demographic traits. For party affiliation classification, MPs were classified into four political parties that have existed in parliament throughout 2012–2020. Party status prediction is the binary classification of documents to determine whether debates belong to the government or the opposition party. In all tasks, classification accuracy is an evaluation of the models. We examined the relationships between the classes by assuming that a misclassified instance is close to the classified category. We investigated the most important terms of categories of each traits using feature selection and the distribution of TF-IDF values over classes.
This paper is organised as follows: Section 2 reviews related works in the estimation of demographic traits regarding social media, Turkish texts, and parliamentary data. Section 3 describes the materials and methods of the study. Datasets, features, and classifiers are described in this section. In Section 4, we investigated the results of experiments and discussed our observations. We concluded the paper by summarising our works in Section 6.
2. Related Works
Automatically determining demographic traits of the unknown owner of a text is a common problem attracting many researchers. The analysed corpora, approaches to document representation (feature extraction), and techniques for classification such as classical machine learning and deep learning models diversify studies in the field.
In the estimation of demographic traits, the content of the text and the writing style of the author are outstanding points. Herring and Paolillo [2] investigated gender and genre variations in blogs and concluded that the owners’ traits depend on two main extents: stylometry and content of the text.
Previous studies on Authorship Analysis classified the writing style features of the author [3,4,5,6,7,8]. These features are called style markers. Style markers can be categorised as lexical features, character-based features, and syntactic features. In the lexical features, the text is considered as a sequence of tokens such as words. The total number of words, average word length, sentence length count, word length count, most frequent words in the corpus, word n-grams, vocabulary richness, and Hapax legomenon are kinds of lexical features. The text is viewed as a sequence of characters in the character-based features. Character n-grams, digits, capital letters, white spaces, tab spaces, and other special characters compose the character-based features. Syntactic patterns of sentences can identify the style of an author in the text. Part-of-Speech (POS) n-gram, punctuation mark frequency, and function word frequency can be categorised under the syntactic features. Author Profiling studies in the literature show that optimal feature sets can vary according to different domains, authors, or corpora [8,9].
The words used determine the topic or content of the text. Thus, word n-grams constitute content-based features. The profile of the author can depend on topics such as sports, economics, wedding, and lifestyle. Gender differences can be the result of the written topic. Janssen and Murachver Janssen and Murachver [10] demonstrated a close relationship between gender and topics.
PAN (https://pan.webis.de, accessed on 27 July 2022) is a series of scientific events and shared tasks on digital text forensics and stylometry to research the Authorship Analysis, originality, and computational ethics. Since 2007, PAN has hosted 22 shared tasks at 21 different events [11]. Lim, Goh et al. [12] predicted the gender and age of authors from the given corpus at PAN 2013. They observed that content-based features are more discriminative than style-based features. Rangel, Rosso, Potthast, Stein and Daelemans [1] concluded that most of the studies at PAN 2015 have better performance by using content-based features (words) than style-based ones (sentence length, POS n-gram, char n-grams, etc.). In classical text classification studies such as topic classification and information retrieval, removing stop words makes sense because these words have no impact on predicting the topic of a text. However, every word can be an element of the writing style of the author. For example, function words are among the potent features in the Turkish Author Attribution study of Agun, Volkan and Yilmazel [13].
The lack of standard evaluation sources is a challenge of benchmarking methods for Author Profiling. PAN Author Profiling competitions give way to the studies in the field. Most of the studies in Author Profiling have been carried out in the English language and on social media data. Koppel, Argamon and Shimoni [14] used lexical and syntactic features to predict gender from the British National Corpus. Mukherjee and Liu [15] used blogs to classify the author’s gender with classical machine learning algorithms and obtained 89% accuracy. Bartle and Zheng [16] used a windowed Recurrent Convolution Neural Network (WRCNN) deep learning technique in the same dataset with 86% accuracy. Predictions of gender and age have been conducted in the literature through several domains. Lin [17] predicted gender and age with online chat logs and Estival, Gaustad, Pham, Radford and Hutchinson [18] used e-mails in English. Fatima et al. [19] analysed SMS messages for age, gender, education, native language, and occupation prediction. Fatima et al. [20] used Facebook data for multilingual author profiling. Boulis and Ostendorf [21] studied gender classification for 12000 transcribed telephone conversations with 93% accuracy. Nguyen, Smith and Rosé [22] predicted the age of the author from breast cancer forums, telephone conversations, and user blogs using linear regression. Dwi and Hauff [23] used Twitter messages for forecasting elections by classical machine learning techniques. Kaati et al. [24] predicted gender and age from Google blogs and LinkedIn. They obtained accuracies of 83% by SVM and 77% by CNN for gender, and 34% by CNN and 44% by SVM for age. Kapočiute-Dzikienė, Utka and Šarkutė [25] studied the Lithuanian literary texts and parliamentary scripts to predict gender and age. They reached higher accuracies with literary texts than with parliamentary scripts. Conover, Gonçalves, Ratkiewicz, Flammini and Menczer [26] predicted the political party alignment of Twitter users using SVM. In addition to stop words, they also removed hashtags, mentions, and URLs from the tweets and reached 79.2% accuracy. Flores, Pavan, and Paraboni [27] used request texts of citizen information service provided by the Brazilian government. They achieved 67% for age, 69% for education, 87% for gender, and 0.63 for the profession with Long Short-Term Memory (LSTM). García-Díaz, Colomo-Palacios, and Valencia-García [28] used tweets of Spanish politicians during 2020 for gender, age, and ideology prediction. The best macro F1-scores were 72.022% with pretrained word vectors using Bidirectional Gated Recurrent Units (BiGRU) in gender. In age, the best macro F1-score was 46.687% with the same feature set and clasifier of gender. Regarding binary political spectrum (left–right), pretrained word vectors with multilayer perceptrons achieved the best result with a macro F1-score of 98.036%.
Few researchers have studied Author Profiling on Turkish texts. Amasyalı and Diri [29] categorised Turkish daily newspaper articles in terms of author, genre, and gender. They applied character-level n-gram models to 140 documents for female and 490 documents for male authors and obtained an accuracy of 96% with SVM. Deniz and Kiziloz [30] applied the n-gram model for the text classification of Turkish documents in terms of author, genre, and gender. They used 300 Turkish daily newspaper articles written by 30 authors. In gender classification, they used five male and five female authors. In classification tasks, SVM outperformed Naive Bayes and Random Forests. Kucukyilmaz et al. [31] predicted gender from online peer-to-peer Turkish chat messages belonging to 200 male and 200 female users. They obtained 81.5% accuracy by the NB classifier. Türkmen et al. [32] predicted age group, gender, marital status, and educational level from public interviews held by the students of the psychology department. Classification is based on stems of words and 2-gram words, carried out by k-Nearest Neighbours (k-NN), Naive Bayes (NB), and SVM machine learning algorithms. They reached accuracies of 78.1% for gender by kNN, 86.1% for marital status by SVM, 95.2% for educational level by NB, and 87.3% for age group by SVM. Ciot, Sonderegger and Ruths [33] predicted gender from Twitter text data in non-English contexts by SVM. They used French, Indonesian, Turkish, and Japanese languages for analysis and found comparable results with the English language. The accuracy of Turkish is the highest (87%) among the other four languages. They stated that “among all languages, the Turkish language is the highest accuracy achieved in the entire Twitter gender inference literature on a dataset drawn from the Twitter general population”. Yilmaz and Abul [34] predicted political alignments of Twitter users on the 2017 Turkish constitutional referendum with SVM, Decision Tree, and Random Forests. They reported the best classification accuracy of 89.9% with linear SVM.
Several studies have been carried out to estimate traits of deputies on parliamentary data, especially on parliament debates. Dahllöf [35] predicted the age, gender, and political affiliation of MPs based on the speeches held in the Swedish parliament for seven annual sessions from 2003 to 2010. Dahllöf analysed different cohorts by SVM and reached the accuracy of 81.2% for gender, 89.4% for political affiliation, and 78.9% for age. Przybyła and Teisseyre [36] analysed speeches in the Polish parliament to predict speaker’s traits, which are gender, education, party affiliation, and birth year. The best accuracy (97%) was obtained by Random Forest in gender classification. They used regression analysis when analysing birth year and got 6.48 squared error with Nearest Neighbour regression. Dunn, Argamon, Rasooli and Kumar [37] developed a profile-based estimation of demographic traits using speeches of the US House and Senate from 1995 to 2013. They analysed the gender, age, military service, geographic location, race, and religion of MPs. They also performed the estimation of parliamentary-specific traits such as party affiliation, institutions, and chambers from congress speeches. Høyland et al. [38] predicted party affiliations for five parties from European Parliament debates using SVM and obtained 55% overall accuracy. Yu, Kaufmann and Diermeier [39] used SVM to classify party affiliation and ideologies on US House and Senate speeches and obtained accuracies of 80% on the House and 86% on the Senate. Hirst et al. [40] identified ideology by distinguishing liberals from conservatives using transcripts of Canadian parliamentary debates by classical machine learning algorithms. Investigating the party status affiliation of MPs, they concluded that parliamentary speech was more sensitive to party status than ideology. Lapponi et al. [41] introduced the ToN (Talk of Norway) parliament debates dataset and developed party affiliation classification using SVM. Peterson and Spirling [42] measured the polarisation between parties using British Parliament debates. A low accuracy rate means low polarisation in their party affiliation classification task. Yu [43] examined congressional speeches between 1989 and 2008 to specify how language differs according to the gender of the MPs with statistical effect size using Cohen’s d [44]. In the studies of gender profiling [14,43,45], it was seen that female legislators use more emotional words and fewer articles, whereas male legislators use more nouns and long words as well as fewer personal pronouns, as expected.
Table 1 provides a summary of the selected studies in the field of Author Profiling.

Table 1.
Selected Author Profiling studies (G = gender, A = age, O = opinion, party affiliation, ideology, E = Education, P = Profession, np = newspaper articals, tc = telephone conversations, pd = parliament debates, s = stylometry, stylistic, character n-gram, linguistic features, w = BoW, TF-IDF, pwd = pretrained word vectors).
3. Material and Methods
The dataset contains individual speeches of MPs in the Turkish Parliament plenary sessions. It covers 65,570 plenary session discourses from 2012 to 2020.
In the estimation of demographic traits studies, features can be style-based features such as character n-grams, character frequencies, length of sentences, parts-of-speech, punctuation marks, function words, and content-based features such as word n-grams, term frequency-inverse document frequency (TF-IDF), or a combination of both. Rangel et al. [46] and Rangel et al. [47] evaluated features and classifiers in PAN Author Profiling competitions. They reported the superiority of content-based features over style-based ones and classical machine learning algorithms over deep learning techniques. In our work, we used TF-IDF, LDSE, Bag of Words (BoW), pretrained Word Vectors, and Paragraph Vectors (PV) for document representation. Logistic Regression (LR), Support Vector Machine (SVM), and Feed Forward Neural Network (FFNN) were used as classifiers.
3.1. Datasets
The Turkish parliament debate dataset comprises 65,570 stenographic transcripts of individual speeches of 1024 MPs in plenary sessions during 2012–2020. In the Turkish Parliament, as in other world parliaments, speeches are written in the minutes after the revision procedure. Misspelt words are corrected and severely disturbing words are removed from the minutes. Thus, documents have already undergone some pre-processing as a part of the parliamentary minutes writing procedure. As speeches are written into minutes, some notes such as “(applause)”, ”(laughs)”, ”(applause from X party seats)”, ”(noises)” are added to documents. We cleaned all added notes in pre-processing to analyse documents with only MPs’ own utterances. The surnames of MPs, party names, and province names frequently exist in the document, but these words make little sense when analysing demographic traits such as age, gender, or occupation. Therefore, these words were removed from the documents.
We constructed sub-datasets for each classification task from 65,570 documents. Every dataset was balanced as under sampling to minority classes. Then, each class has almost an equal number of documents.
Age interval categories in the age sub-dataset are under 40, 40–50, 50–60 and above 60. They were constructed according to the age of the deputy at the time of the speech. Categories of education and professions sub-datasets were constructed according to their resumes on the GNAT website. For the deputies whose occupation information was not specified in the resumes, the occupation was labelled according to their university major. For example, law school graduates were labelled as law even though we did not know their current occupation.
For profession, education, and party affiliation tasks, we ignored some categories because of the limited number of documents that belong to these categories. For example, we ignored pharmacists, journalists, theologians and some other professions in the occupation classification. Thus, the number of documents was reduced from 65,570 to 45,556. We used five categories in the task and the minority class, medicine has 6873 documents. After under-sampling to the minority class, the sub-dataset of the profession classification was downcasted from 45,556 to 27,492.
Document word lengths vary between 20 and 800. The average length of documents is 480 words. Table 2 shows the traits of MPs and the classes of each one. The number of documents per class and the total number of unigram, bigram and trigram are stated in the table.
Table 2.
Datasets for estimation of demographic traits.
3.2. Features
In the transformation phase of text classification, the text is represented with features. The vector form of the features eases computational processes. We used different NLP methods such as BoW, TF-IDF, LDSE, pre-trained Word Vectors, and Paragraph Vectors for the representation of documents.
- Bag of Words (BoW): Bag of Words is one of the most frequently used methods in the representation of the text. In BoW representation, every dimension of the vector shows the count of a word in the document.
- Term Frequency-Inverse Document Frequency (TF-IDF): Another frequently used method for text representation, especially in classical machine learning algorithms, is TF-IDF. TF shows the frequency of a word in a document and demonstrates the importance of words for the document. Frequently used terms in all texts reduce the distinctiveness of the word. Consequently, the inverse of the document frequency of a term (IDF) is used for text classification. In BoW and TF-IDF representation, the order of words is ignored and can lead to the loss of semantics.We used words (1-3)-grams for the content and characters (2-6)-grams for the style. The most frequent 300,000 character n-grams were used for stylometry. In the study, traits estimation tasks were based on the content (TF-IDFword) and the combination of the content and stylometry (TF-IDFword and char).The documents have been represented with TF-IDF values of the combination of word unigram, bigram, and trigram.
- Low-Dimensionality Statistical Embedding (LDSE): Rangel, Franco-Salvador and Rosso [48] have explained the approach in detail in the language-variety author profiling task. The main philosophy is that the distribution of weights for a given text should be closer to its corresponding category. In LDSE, the weights of each one of the classes are computed from weights of documents belonging to this class. Each one of the term weights of the classes is the ratio between the sum of class-dependent weights and the sum of all weights of the term. This weight metric for classes is called a class-dependent weight matrix. The final representation of the documents for both train and test sets is extracted from these class-dependent weights by applying functions such as average, standard deviation, minimum, maximum, probability, and the proportion for each of the classes. Thus, we can represent a document by a few numbers of weights (count of categories multiplying by the count of functions). These few but very descriptive weights can be used to represent documents. LDSE has also the advantage that it regards all the terms in the dataset and therefore represents all the applied features. However, widely used dimensionality reduction techniques of PCA or LSA remove terms that contribute less and do not represent all features in the dataset.In our study, unigram and bigram TF-IDF weights were used to obtain the LDSE representation. We used six aggregate functions over the class-dependent weight matrix to obtain the final representation of documents. These functions were average, standard deviation, minimum, maximum, probability, and proportion functions.
- Pretrained Word Vectors: Harris [49] indicated that semantically similar words have a similar distribution. Word embedding and word vectors represent words in a vector space with semantic meaning. The most used models for word embedding are Word2vec [50], GloVe [51], fastText [52], ELMo [53], and BERT (Bidirectional Encoder Representations from Transformers) [54].Mikolov et al. used Artificial Neural Networks (ANN) in the Word2vec model. The Word2vec model is based on the prediction of a word from surrounding words (Continuous Bag-Of-Words, CBOW) or prediction of surrounding words from a given word (Skip-gram). In Word2vec, ANN accepts the sequence of words, and at the end of the training, it produces word vectors.In our previous work [55], we used a vector space model that places similar concepts close to each other. We constructed a training corpus as concatenating transcripts of 2800 plenary meetings from 1996 to 2017. A meeting has an average of 72 pages, and each page has an average of 570 words. We trained the corpus with the Word2vec CBOW model to obtain word vectors. Due to the training corpus, pretrained word vectors are domain-specific for Turkish parliament debates. We used the same domain-specific word vectors in our current demographic trait estimation study. The vocabulary size and dimensionality of the word vectors are 440,705 and 100 in order.Although word vectors obtained by Word2Vec, GloVe and fastText bear semantics between words, they have only a single global representation for each word. The single representation leads to the word not representing its meaning in context. In addition to context-free word vectors, it has models that represent the word with its contexts, such as ELMo and BERT. The ELMo encodes the left and right contexts by using bidirectional LSTM. BERT employs the Transformer [56] model instead of LSTM. The transformer is an encoder–decoder architecture with attention mechanisms. BERT uses only the encoder side of the transformer to build a language representation model. Prediction tasks of BERT during the pretraining are Masked Language Modelling (MLM) and Next Sentence Prediction (NSP). The MLM allows the representation to combine the left and right context. The other task of the pretraining, the NSP, learns the relationship between two sentences, which is necessary for sentence pair downstream tasks. In the fine-tuning phase, BERT models many downstream tasks because of the self-attention mechanism in the Transformer.Schweter [57] introduced BERTurk, which is a Turkish BERT model. The model was pretrained on a Turkish corpus with a size of 35 GB and 4,404,976,662 tokens. In the trait estimation tasks, we fine-tuned the uncased 128,000 vocabulary size version of BERTurk.
- Paragraph Vectors (PV): In PV, each vector represents the word sequence. The sequence can be a sentence or a paragraph. Doc2vec [58] and Skip-Thought [59] are the most used models for sentence embedding. Doc2vec is an extension of Word2vec, and it concatenates a paragraph token (paragraph vector) to word vectors and makes a prediction task. The authors called the output of the Doc2vec model Paragraph Vectors (PV). A word sequence is randomly sampled from a paragraph and predicts the word in the centre of the sample. They stated that the “paragraph token acts as memory to show what is missing in the current context or topic of the paragraph”. The model is called the Distributed Memory Model of Paragraph Vectors (PV-DM). Another approach of the paragraph vector is Distributed Bag of Words (DBOW) version. PV-DBOW takes a paragraph vector as input and predicts words randomly sampled from the paragraph.We used PV-DBOW in our study among PV-DBOW, PV-DM and the concatenation of both models due to the best accuracy score. The dimensionality of the feature vectors is 100 and negative sampling is 5.
3.3. Employed ML and DL Models
We employed classical machine learning algorithms and deep learning techniques with TF-ID, BoW, LDSE, pretrained word vectors, and paragraph vector document representations to identify traits of MPs. In the study, model names were given as document representation_classifier.
- TF-IDF-SVM: SVM creates different hyper-planes to divide the data into different categories. SVM has been thought of as the best machine learning algorithm for text classification [60]. We used TF-IDF values for document representation and Support Vector Machines as a classifier.
- TF-IDF_LR: Logistic Regression is a linear classifier with a decision boundary. A logistic function determines the probability of an instance belonging to the class. We used TF-IDF values for document representation and Logistic Regression as a classifier in the model.
- LDSE_LR: We used LDSE representation of documents. LDSE weights were extracted from TF-IDF values of documents. Logistic Regression was used as a classifier.
- PV_LR: Paragraph vectors are used when representing the documents. We chose the Logistic Regression algorithm as a classifier after comparing SVM according to accuracy measures.
- BERT: We fine-tuned the Turkish BERT model, BERTurk for text classification in demographic trait estimation tasks. The BERTurk base model has 128k pretrained representation (https://huggingface.co/dbmdz/bert-base-turkish-128k-uncased, accessed on 2 July 2022), twelve transformer encoder blocks, 768 hidden size, twelve self-attention heads, and 110M parameters.
- BoW_FFNN and Word2vec_FFNN: We used BoW representation and Word2vec word vectors for document representation. The pretrained word vectors are domain-specific to Turkish parliament debates. We used Artificial Neural Networks as the classifier. After text classification experiments with Convolution Neural Network (CNN) [61], Recurrent Neural Network (RNN) [62], and Feed Forward Neural Network (FFNN) topologies, we chose FFNN due to it having the best accuracy. The topology of the network is 512 neurons in the hidden layer, the activation function is Relu, the dropout rate is 0.5, and the optimiser is Adam.
Feature selection is a process of selecting the most relevant features for the classification task. Therefore, we use feature selection techniques to determine the most important terms of the demographic trait categories. The most relevant words that reflect the topic of the text are adjectives and nouns. In order to investigate the variance of topics according to the traits of MPs, we used the stem of topic words, nouns and adjectives, in the analysis.
The most effective terms were obtained in three steps on two sub-datasets for each trait. First, the feature selection algorithm was used, and as a second step, the distribution of TF-IDF values on the categories were computed. The class-dependent matrix in the study of Rangel, Franco-Salvador and Rosso [48] was used to obtain TF-IDF distribution. Then, we assigned the terms to the categories according to the highest TF-IDF distribution in the second step. Finally, we selected the terms with the highest fifty scores for each category. The most important terms are the intersection of obtained words from two sub-datasets.
3.4. Baseline
For each classification task, we used three baseline methods to assess the models.
Baseline-majority: A statistical baseline that always predicts the majority class. We used LR as the classifier in the study.
Baseline-VecAvg: Socher et al. [63] used an average of word vectors to represent documents. We used the VecAvg model as a baseline for the estimation of demographic traits tasks. In the baseline, word vectors were obtained from the Word2vec, and LR was used as a classifier.
4. Results
In the estimation of demographic traits, we employed cross-validation to evaluate models. First, two separate balanced sub-datasets were randomly generated from the unbalanced corpus. Then, text classification was performed on these two sub-datasets with 4-fold cross-validation. We used the average of the accuracy values when comparing the models. In the deep learning models, each fold of the cross-validation was split into a validation and test set. Thus, the validation set is 12.5%, the test set is 12.5%, and the training set is 75%. We applied grid search to the classical machine learning algorithms and random search to the deep learning algorithms when tuning hyperparameters. We also used this experimental setup of the classical machine learning algorithms in Section 4.8 with LR.
We identified the significance level between model pairs by McNemar’s [64] test with a significance threshold ( = 0.05). It is used for pairwise comparisons in Statistics. The final values of the contingency table were computed by averaging the contingency table values of each fold of cross-validation. The reproducibility of the experimental setup was provided within each classification task selecting the same sub-datasets and hyperparameters. Relationships between the classes were examined by error analysis on the confusion matrix for all trait estimation tasks. A misclassified sample was assumed to be close to the predicted category.
Table 3 shows the accuracy values from used models in trait estimation tasks for characteristics of deputies. The classical machine learning models with TF-IDF features gave the highest accuracies in all trait estimation tasks. In TF-IDF_LR and TF-IDF_SVM models, the combination of the content-based (word n-grams) and style-based (character n-grams) features improved the accuracies of the classification in gender and profession demographic traits according to accuracies and McNemar’s test. The age, education, party, region and party status traits remained the same for both TF-IDFword and TF-IDFword and char features.
Table 3.
Classification accuracies of estimation of demographic traits tasks.
SVM and LR had the same accuracies in five out of seven classifications: 82% for gender, 52% for age, 60% for education, 84% for party and 92% for party status. TF-IDF_LR has one higher than TF-IDF_SVM only in occupation (67%) and the election region (54%). The significant difference occured only in the election region trait between these two models when McNemar’s test was applied.
Only BERT can compete with classical machine learning models for just one task, party status affiliation. BERT estimated the party status of MPs with 91% accuracy, which was 1% lower than TF-IDF_LR and TF-IDF_SVM. It had the same proportion of errors with both models according to McNemar’s test. It had the highest performance after classical machine learning algorithms with 80% in party affiliation.
Although LDSE had accuracy above the baselines used in the study, it performed below classical machine learning models with TF-IDF features. Yet LDSE gave the most successful result after TF-IDF_LR and TF-IDF_SVM in occupation (61%) and region (49%) classification tasks. LDSE also followed BERT in part status classification with 88% accuracy.
PV_LR was the second-best model in terms of accuracy values in gender demographic trait with 78. It also had only one lower accuracy (79%) than BERT in party classification. BERT and PV_LR had a significant difference according to McNemar’s test. On the other hand, PV could not generalise in the region demographic trait with 19%. It had below accuracy from Baseline-VecAvg (30%) and was close to the majority baseline (14%).
As for FFNN, word2vec_FFNN could not achieve a performance above the baseline value in any task. It could not even generalise in party affiliation (26) with close to majority baseline accuracy.
BoW_FFNN had accuracy under the baseline in party affiliation. Comparing FFNN with another deep learning model, BERT, BoW_FFNN gave the same accuracy in gender (77) and region (46), one high in age (44), education (53), and two high in occupation (58). BoW_FFNN and BERT had no significant difference in gender demographic trait when applying McNemar’s test.
TF-IDF(word and char)-based models had higher accuracy than TF-IDF(word) models for gender and occupation. It can be concluded that the author’s style has an effect on the discrimination of speeches.
The trait estimation tasks with the higher accuracy value can be said to be the most prominent trait in the speeches. Table 3 shows that the deputies mostly reflect their party status and party affiliation in their debates. Gender is also an outstanding trait in the speeches.
4.1. Gender Classification
The confusion between genders is shown in Figure 1a. According to the confusion matrix, gender is slightly more predictable for male MPs (81.87%) than female MPs (81.23%) with only a 0.0064 difference. The results of our study demonstrate that debates of male and female MPs are highly distinguishable (with 82% accuracy) in the Turkish parliament.
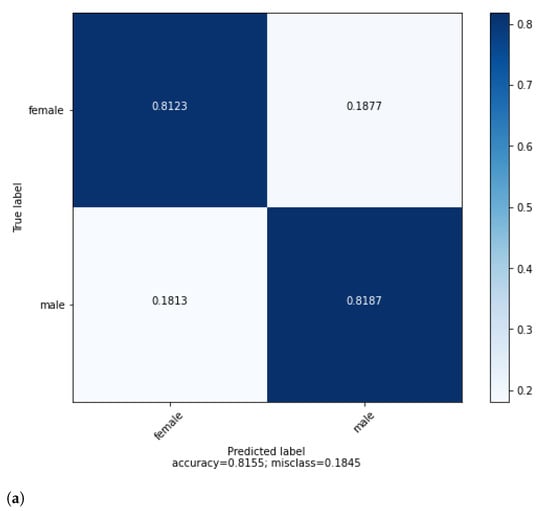
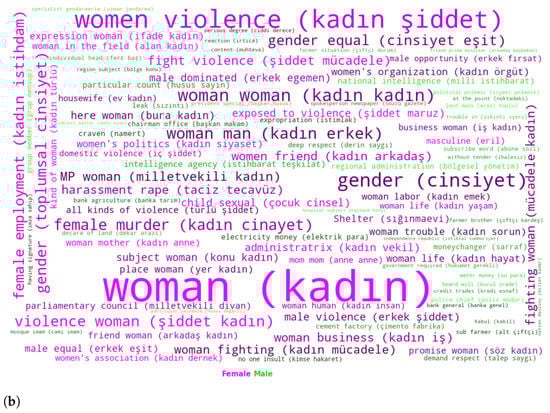
Figure 1.
(a) Confusion matrix for gender classification with TF-IDF(word and char)_LR. (b) Best terms of gender trait of deputies.
Femicide, violence against women and children are the most obvious findings from the terms of female MPs in Figure Figure 1b. Terms such as violence against women, female murder, child abuse, fight violence, harassment rape, child sexual, male violence and exposed to violence are indicative of serious crimes against women in the country. Terms related to gender mainstreaming are also listed in Figure Figure 1b. Women’s rights, female employment, social gender, gender equality, women business, male-dominated, women’s organisation, and women’s politics are the words of gender mainstreaming.
As for the male MPs, they are interested in more diverse topics instead. Polemic, NATO, polemic, price, intelligence agency, subject, electricity money, bank agriculture, bribe corrupt, expropriation, and decare of land are among the terms of the males. Agriculture, economy and finance, army and intelligence domains are the areas of interest of male MPs in the Grand National Assembly of Turkey (GNAT).
4.2. Age Classification
In age demographic trait, age interval classes are naturally ordered in a row. In Figure 2a, the confusion matrix reflects the order of age intervals. Closer age intervals come together with significant rates as expected, and this status can be considered as validation of a classification task. The Under 40 age group is less difficult to be predicted (62.91%) whereas 50–60 (42.55%) is the most difficult. Age groups on edges, under 40 (62.91%) and above 60 (56.12%) are more predictable than inner age groups, 40–50 (46.61%) and 50–60 (42.55%). The confusion matrix shows that speeches of younger and older MPs are more distinctive than those in the middle-age groups.
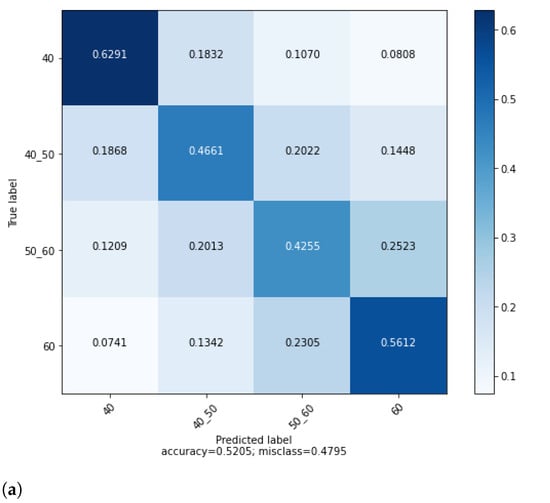
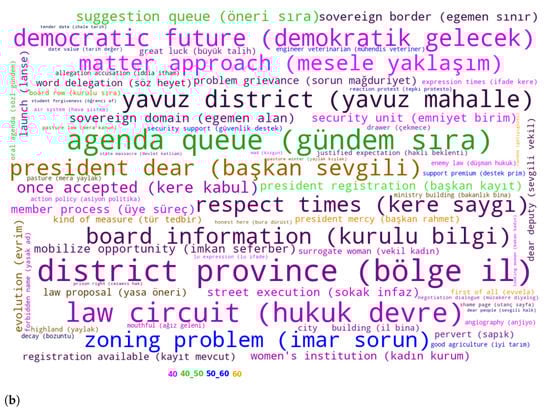
Figure 2.
(a) Confusion matrix for age classification with TF-IDF(word)_SVM., (b) Best terms of age trait of deputies.
We could not find any pattern in the distribution of features by age categories in Figure Figure 2b. However, when all categories and features were taken into account, it was observed that the feature importance of the terms belonging to the youngest category was higher. This situation can be interpreted as the speech content of the under 40 category reflecting the age status more.
4.3. Education Classification
Since education status follows each other, it can be expected that education statuses close to each other will converge in the confusion matrix in Figure 3a. However, we did not have an obvious observation about this situation as in the age classification. For example, assoc. prof. or prof. is closer to undergraduate (15.76%) than PhD (09.71%) and graduate (11.89%). Professors or Associate Professors spend much more time teaching undergraduate students than graduate or doctoral students. It can be the reason for the closeness of the assoc. prof. or prof. and the undergraduate.
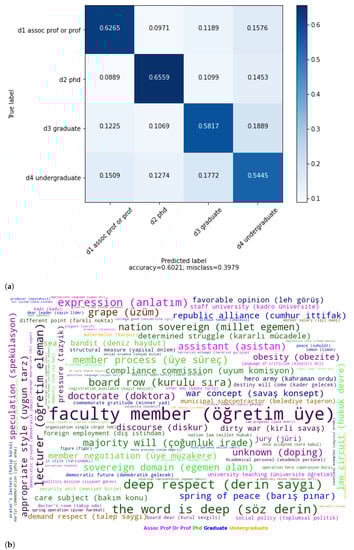
Figure 3.
(a) Confusion matrix for education classification with TF-IDF(word)_LR. (b) Best terms of education trait of deputies.
Phd and assoc. prof. or prof. are straightforward to be identified with 65.59% and 62.65% accuracies. On the contrary, undergraduate is difficult to identify with 54.45%.
The terms related to higher education have emerged in the assoc. prof. or prof. category in the Figure 3b. Instruction, associate professor, lecturer, higher education, faculty, instructor, course, university, foundation university, rector, PhD, course, doctorate, school education and education director are among the best features of assoc. prof. or prof. The category represents the highest educational status in the dataset. In accordance with this situation, higher educational institutions and their subjects have been in the majority. The terms of the PhD, graduate and undergraduate categories have not focused on a particular subject.
4.4. Occupation Classification
Figure 4a shows the confusion matrix for occupation classification. Economics and finances (70.76%) seem to be the most straightforward to be identified. On the contrary, engineering (64.16%) and law (64.56%) are the most difficult instances. According to results, the highest value of the error is (14.51%) from medicine to engineering. It indicates that these two professions are closer at GNAT. Being inclined toward positive sciences in both occupational categories can be a reason for their closeness. The lowest error rate (6.62%), from economics and finances to medicine, indicates that these two categories are very distinguishable among themselves.
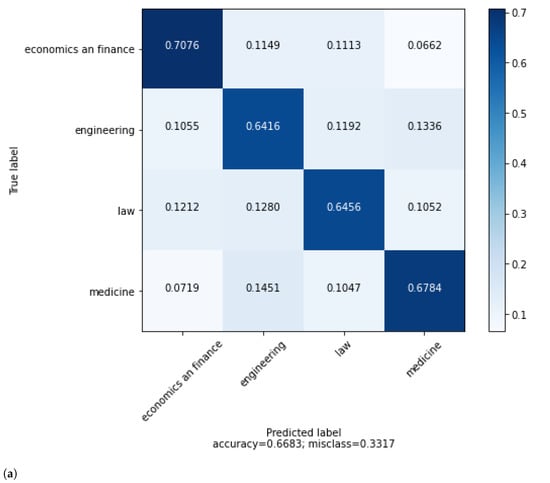
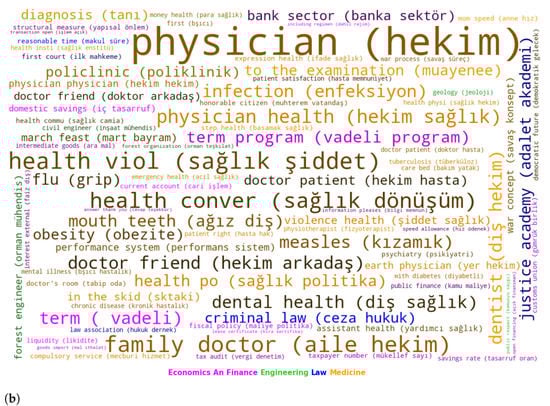
Figure 4.
(a) Confusion matrix for profession classification with TF-IDF(word and char)_LR. (b) Best terms of occupation trait of deputies.
When the most prominent terms of occupational classification are examined in Figure Figure 4b, it seems that the deputies reflected their professional fields in their speeches. The terms involving economics, finance, tax, finance, and budget strictly distinguish the content of economics and finance from other categories. The most effective features of the category are growth, bank, under development, income, finance, inflation, and tax.
The branches of engineering determined the terms of the engineering category. Forest engineering (forest, forest fire, forest organisation, forest region, village forest), agricultural engineering (potato, decare, decare of land, seed, cotton dam, world farmer, tangerine, litre diesel and country farmer), and civil engineering (civil engineer, building control) were the most prominent terms. Terms related to other engineering branches such as megawatt, geology and food have also emerged. There is only one term (professional chamber) that concerns all branches of engineering.
Terms related to the judicial process, judicial institutions, courts, penal law, the lawyer profession and bar associations constitute the leading features of the law category. Judgment, verdict, trial, crime, punishment, execution, lawyer, and bar association are prominent terms of the law.
Issues such as health services, health transformation, health domain employees, and the violence to which health employees are exposed are the prominent terms of the medicine category. Doctor, physician, patient, health, ambulance, medical, medicament, cancer, and preventive health are the features for medicine.
4.5. Election Region Classification
At the first Geographic Congress held in 1941, provinces were grouped into seven geographic regions according to their location, climate, topography, population, agricultural diversities, and so on [65]. In our study, the election region defines the geographical region of the province of which an MP is a representative. We converted eighty-one election provinces of the MPs to seven election geographical regions to obtain the coarse-grained classes. The classes are Aegean, Black Sea, Central Anatolia, Eastern Anatolia, Marmara, Mediterranean, and Southeastern Anatolia.
According to the confusion matrix in Figure 5a, Eastern Anatolia (63.70%), Southeastern Anatolia (60.40%) and Black Sea (59.50%) are less difficult to identify, whereas Marmara (41.32%) and Mediterranean (48.41%) are the most difficult regions. The highest error is from Marmara to Aegean (12.78%), whereas the lowest error rate is from Black Sea to Eastern Anatolia with 3.63%. Examining the errors from one region to other regions, a relationship can be identified between regions. Aegean has the highest error for Marmara (11.39%), and Marmara has the highest error for Aegean (12.78%). The same status also is valid for Eastern Anatolia and South-eastern Anatolia. The highest error from Eastern Anatolia is for Southeastern Anatolia with 10.78%, and Southeastern Anatolia has the highest error for Eastern Anatolia (10.71%). These errors can demonstrate consequences of the geographical, cultural, or economic closeness between Aegean and Marmara; and Eastern Anatolia and Southeastern Anatolia. Although the Black Sea is bordered by Eastern Anatolia, they emerge as one of the most distant region pairs in Figure 5a. This situation can result from political or ideological differences. While the Black Sea is considered a nationalist region, the Eastern Anatolia and Southeastern Anatolia regions are focal regions for HDP, which is the Kurdish niche party.
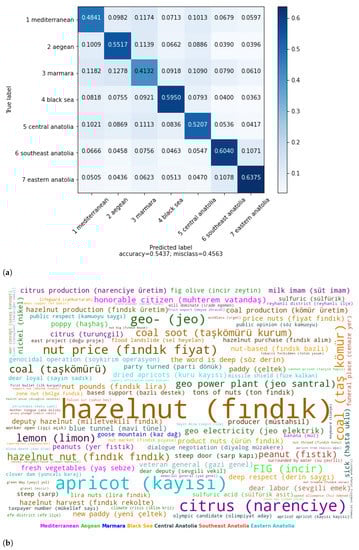
Figure 5.
(a) Confusion matrix for region classification with TF-IDF(word)_LR. (b) Best terms of election region trait of deputies.
In the election region classification, products of economic structures of the regions, especially products of agriculture, are among the most important features. The features that are related to regional issues come forth rather than the style of the regional speaking in Figure 5b. For the Mediterranean Region, citrus, cotton, vegetables, fruit, tomatoes, agriculture, farming, and farmer are the most important features. As the tourism region of the country, tourism is also among the most important features. Olive is the main farming product of the Aegean Region and among the most important features in both test weights of classifications. Grape is also one of the most effective features. Geothermal is an identifying term for the region because of rich hot groundwater sources due to the geography of the region and among the most important features. Since the largest metropolitan city of the country, Istanbul, is in the Marmara Region, terms related to urban life such as urban, residence, urban transformation, zoning, and real estate are among the most important features. Pervasive wind of the region, southwester, is also an important feature for the region. For the Black Sea Region, tea, nuget hazelnut and coal are among the most important features. In the Eastern Anatolia Region, East Express, dadaş (naming for public of Erzurum province of the region) and apricot are among the strongest terms. In Southeastern Anatolia, the GAP dam, pistachio, and Dicle river are among the most important features. In the Southeastern and Eastern Anatolia regions, the regional issue is terrorism. Features related to security and terrorism such as prison, savagery, and ISIS are highlighted terms for the regions.
4.6. Party Affiliation Classification
The speeches belong to MPs of four parties that have existed in the parliament since 2012. The AK Party has been a ruling party in Turkey since 2002. It can be defined as a conservative-right party. The Republican People’s Party (CHP) is the main opposition party in this period. It is a social-democratic left party of Turkey. The Nationalist Movement Party (MHP) is a right-oriented nationalist party in the country. The People’s Democratic Party (HDP) is a left-leaning pro-Kurdish party of the country. It can be thought of as a niche party for the Southeastern and Eastern regions of Turkey and has conflict with the Turkish nationalist movement.
Examining the error from MHP to HDP (1.61%) and error from HDP to MHP in Figure 6a, the MPs of these parties are the most distant from each other. The real political life of Turkey validates this situation because of the conflict between them. The Ak Party (87.79%) and HDP (87.51%) are the most predictable from speeches, whereas CHP (78.82%) is the least predictable.
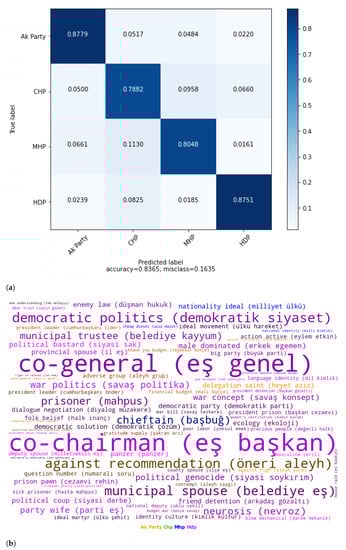
Figure 6.
(a) Confusion matrix for party classification with TF-IDF(word)_SVM. (b) Best terms of political party affiliation of deputies.
When we investigate the best features in the party affiliation task in Figure 6b, we found features that are related to the ideological origins and the status of the parties. In party classification, the ruling AK Party has discriminative words which have a possessive suffix for the first-person plural with the minister, prime minister, or president such as our minister (bakanımız), our prime minister (başbakanımız), our president (cumhurbaşkanımız), and our government (iktidarımız). These words are also discriminative words for opposition parties without a possessive suffix such as minister (bakan), prime minister (başbakan), president (cumhurbaşkanı), and government (iktidar).
The main opposition party, CHP, emphasises secularism and was founded by the founder of the Turkish Republic, Mustafa Kemal Atatürk. Secularism and Atatürk are among the discriminative features. The social democratic left origins of the party are also present in the features such as labour (emekçi), fellow (yurttaş), and labour strike (grev), which are mostly used by leftists in the country. The best features of MHP reflect its nationalist ideology. Idea (ülkü) has a special meaning implying the target of the nationalists in Turkey. Idealist (ülkücü), Turkish Nation, great Turkish Nation, Başbuğ, which refers to the legendary leader of the nationalists, martyr, and war veteran (gazi) are the most important features for MHP. Kurdish, war, prisoner, peace, woman, and mother tongue in education are the main features to identify the HDP. Leftist terms such as fellow countryman (yurttaş) and labour (emekçi) are also the best features of the party.
4.7. Party Status Classification
Figure 7a shows that government (91.98%) is more predictable than opposition (90.13%). The accuracy of 92% shows that the party status of MPs is highly distinguishable according to their speeches in the Turkish parliament.
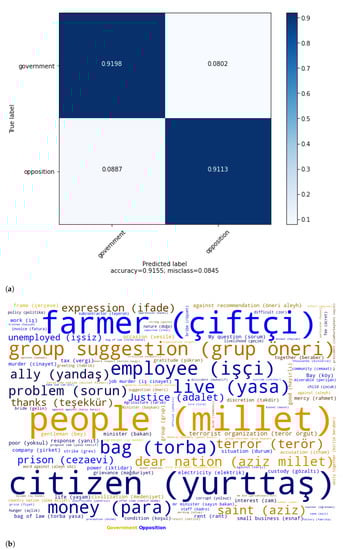
Figure 7.
(a) Confusion matrix for party status classification with TF-IDF(word)_SVM. (b) Best terms of party status affiliation of deputies.
The same pattern as in party affiliation classification also exists in party status affiliation. The government has discriminative words that have a possessive suffix for the first-person plural with our minister, our prime minister, or our president, whereas the opposition has these terms without the possessive suffix.
We analysed government and opposition parties according to the most effective features of speeches of MPs to investigate the variance of topics with respect to party status in Figure 7b. The best features of governing MPs are nation, terror, terror organisation, civilisation (medeniyet), together, service, powerful, martyr, country nation, world, appreciate, fellow, mister president, endeavour, heart, facility, support, project, sense, success, criticism, unity and togetherness, possibility (imkan), blame, wish, consequence, ancestry, pride, contribution, national authority (milli irade), authority of nation, conquest, hero, direction (istikamet), innocent (mazlum), reform, gratitude, target, style, export, traitor, decision, future (istiklal), leader, and effective. As for the opposition, one of the most leftist terms, countryman (yurttaş) is the most important feature in opposition MPs. Workers (işçi), farmers (çiftçi), artisan (esnaf) and villager (köylü) are also the concerns of opposition parties. The opposition parties seemed to emphasise economic problems more. Money, tax, subcontractor, invoice, strike, syndicate, wage, factory, diesel fuel, import, livelihood are economic terms. Export is among the governing terms whereas import is one of the opposition. It can be extracted that exports are accepted as an indicator of economic success or independence and imports as an indicator of economic failure at GNAT. There exist many more negative meaningful terms in opposition compared to the government MPs. Some of them are related to the economy such as unemployed, poor, price raise, rent and starvation. Negative language use by the opposition is also seen in other terms. Problem, proponent, victimisation, murder, corrupt, bribe, oppression, miserable, suicide, ban and dire are also negative meaningful terms of opposition.
The language of the ideology seems reflected in the findings since the ruling and the main opposition party have not changed. The ruling party is the right conservative Ak party, and the main opposition party is the centre-left, social-democratic CHP. The government MPs mostly opted for more traditional, conservative words from one of the synonyms. If we represent the term as “English meaning” (preferred conservative terms—widely used synonym), there exist the most effective features of governing MPs such as “civilisation” (medeniyet-uygarlık), “sense” (mana-anlam), “heart” (gönül-kalp), “facility” (imkan-olanak), “future” (istiklal-gelecek), “valuable” (kıymetli-değerli), “consequence” (netice-sonuç), “ancestry” (ecdat-ata), “wish” (temenni-arzu, istek), “direction” (istikmet-yön), gratitude (şükran-teşekkür), and “decision, opinion” (kanaat-karar, fikir). “Reform” (reform-ınkilap, ıslahat, değişim), “aim” (hedef-amaç), and “style” (üslup-tarz) are exceptions of this template for the governing MPs. Oppositon MPs, on the other hand, preferred less conservative ones from the synonyms. They used yanıt and olanak to cevap and imkan among “answer” (cevap-yanıt), facility (imkan-olanak) terms.
Terror, terror organisation and martyr terms show that one of the most prominent issues is terrorism for the government at GNAT. There exist positive words such as fellow, together, unity and togetherness, powerful, hero, heart, success, reform, and effective in a majority at the speech of governing MPs. However, on the other hand, one of the most negative terms, a traitor, is also among the most effective feature for governing MPs.
4.8. Pairwise Analysis of the Traits of MPs
We examined the impact of one trait on another one through four trait estimation tasks. We conducted gender and educational status classification within each age group. Predicting the gender of MPs within each political party was also part of the analysis. Lastly, we used party affiliation within each educational status cohort for the pairwise analysis.
A Logistic Regression algorithm was used with unigram, bigram and trigram TF-IDF features. We used the same experimental setup of the classical machine learning algorithms in Section 4. Table 4, Table 5, Table 6 and Table 7 shows the accuracies of the classification task.
Table 4.
Impact of the age groups on the occupation classification.
Table 5.
Impact of the education status on the party affiliation classification.
Table 6.
Impact of the age on the gender classification.
Table 7.
Impact of the party affiliation on the gender classification.
According to Table 4, under 40 has 10% higher than 40–50, 9% higher than above 60 and 8% higher than 50–60. These results show that the youngest age group has been more reflecting on their occupation or profession than the older age groups. In addition, the speech contents of 50–60, above 60 and 40–50 have been classified with 71%, 70% and 69%. The difference among these age groups has not been as significant as the 50–60 cohort.
Table 5 indicates party affiliation estimations in each occupation group. According to Table 5, party membership is the precise affiliation for graduate (89%). Assoc. Prof. or prof. (87%) deputies also show their party affiliation strongly. Estimating the party membership of the PhD (72%) deputies is not easy compared to others.
In gender trait estimation, under 40 has 85%, above 60 has 84% whereas 50–60 has 82% and 40–50 has 81% accuracies in Table 6. The oldest and youngest age groups reflect gender characteristics more than the middle age groups.
Gender is more predictable for MHP and HDP considering party affiliation in Table 7. Turkish nationalist, right-wing MHP and pro-kurdish, leftist HDP are the two parties with the most conflicts. On the other hand, AK Party and CHP are more central parties of both right-wing and left-wing. MHP (90%) and HDP (89%) have higher accuracy than Ak Party (80%) and CHP (78%) in the gender demographic trait. These findings of the study show that gender in parties close to the center is less significant than for GNAT.
5. Discussion
In the study, we analysed Turkish parliament debates by trait estimation tasks for seven traits of deputies. Deep learning methods can be thought as the best performing for text classification since they are new and trendy approaches. However, in our trait estimation tasks, SVM and LR with n-gram TF-IDF values gave higher accuracy than deep learning methods, BoW_FFNN and BERT. In the current study, the achievement of BERT in party status affiliation can be considered an exception to this conclusion. BERT has 91% accuracy in party status affiliation. Although classical machine learning methods were more successful in our study, the success of the approaches can be variable when comparing classical machine learning and deep learning methods. In PAN 2019, gender profiling was investigated on Twitter data in English and Spanish. In English, the best result (84.32%) has been obtained with n-grams and Logistic Regression [66]. In Spanish, Pizarro [67] has obtained the best result (81.72%) with word n-grams, character n-grams, and SVM. In PAN 2019, SVM was the most used one among the classical machine learning algorithms. Few participants used deep learning techniques such as CNN, RNN, and FFNN. According to the results, classical machine learning approaches obtained higher accuracies than deep learning ones [68]. According to the overview of PAN 2018 [47], one of the shared tasks is gender identification. Gender prediction depends on a textual approach, an image-based approach, and a combination of both approaches. Regarding text-only features, the participants used classical machine learning and deep learning approaches. In the textual subtask of PAN 2018, the best results have been obtained with combinations of different types of n-grams and classical machine learning algorithms such as SVM and Logistic Regression. The only model of Veenhoven et al. [69], considering the success of deep learning approaches, is bi-LSTM (bidirectional Long Short-Term Memory) with pretrained word embedding as the second-highest accuracy (80.36%) for Spanish. In PAN 2017 [46], shared tasks include identifying gender and language variety from Twitter authors collected in four different languages: Arabic, English, Portuguese, and Spanish. In gender identification, the most successful approaches for Arabic, English, and Spanish are based on classical machine learning models whereas deep learning techniques have the highest result in Portuguese. Miura et al. [70] used word and character embedding with CNN, RNN, attention mechanism, max-pooling layer, and fully connected layer while obtaining the best result in Portuguese. In PAN 2021 [71], participants were supposed to identify whether the Twitter user spread hate speech or not. The most successful models were based on deep learning techniques. The best result was obtained in English (75%) with BERT [72] and in Spanish (85%) with CNN [73].
The success of LDSE can be variable according to the trait estimation task. According to Rangel et al. [46], in language variety identification, it has outperformed all other approaches, but in gender identification, it is not promising as much as language variety. We also have variable results for trait estimation tasks with the LDSE_LR model. It is very promising for gender identification and party status identification, but for other tasks, it is not compatible with TF-IDF_SVM and TF-IDF_LR.
The findings of this study have to be seen in the light of some limitations. Under-sampling leads to significant data loss. For example, in the profession demographic trait, 45,556 documents were reduced to 27,492. Although under-sampling leads to data loss, we carried out it to ensure equal participation of all categories in the best feature analysis and the error analysis.
We excluded some categories from the data set because of the limitation of data. Associate degree and high school categories were not included in the educational status classification. For the same reason, we did not use pharmacists, teachers, political scientists and other professions in the occupation demographic trait. In the party affiliation classification, we did not include the IYI Party, because it was not at GNAT during the corpus span.
The number of authors involved in the analysis in an AP task, or the fact that one author is involved in too many documents compared to other authors, may shift the AP task to the Authorship Attribution (AA) task.
In the parliamentary domain, spokespersons of political parties take the floor in large numbers. For example, in the occupation demographic trait, an MP in medicine has 1102 speeches, while there are also MPs with only one speech in the category. During the under-sampling process, this situation was taken into consideration to reduce the impact of the limitation. Using sampling without replacement, we iteratively added one speech per deputy to the dataset until we reached the number of documents of the minority class. Thus, we sampled the number of speeches for a deputy to be as few as possible.
Blaxill and Beelen [74] investigated the representation of women at Westminster. They also examined the importance of the term in the speeches of male and female MPs. A comparison of the use of language by women MPs shows that health is much more prominent in education in Westminster and the Turkish Grand National Assembly, although women MPs in both parliaments emphasise education and health. Gendered terms, family, children and care domains have great importance for both parliaments. According to the result of the current study, femicide is a troubling problem in Turkey. Female MPs intensively spoke of GNAT woman’s rights and children’s rights. The terms of femicide did not come forth at Westminster. The interest of male MPs in both parliaments shows similarities. There are common terms such as nuclear, interest, force, corporation, and land at both parliaments. Economy, finance, foreign policy and army are discriminating fields for male MPs from female ones at GNAT and Westminster. The terms that are related to agriculture ha more importance at GNAT than at Westminster.
Naderi and Hirst [75] identified the language of face-saving in Canadian parliament analysing the oral question period of parliament sessions. They accepted the questions asked by opposition members as reputation threats and questions asked by government MPs as friendly non-threats. They used Linguistic Inquiry and Word Count (LIWC) [76] in their analysis. Threats and non-threats questions scaled into anger, negative and positive emotions, achievement, and cognitive processes. They found that anger and negative emotions were used in reputation treats (opposition), whereas positive emotions were used more in non-reputation threats (government). We also found these findings from the best feature analysis at GNAT. These results are already expected at parliaments and harmonious with our findings. Achievements were used more in government, whereas cognitive processes were used more in opposition to their study. Powerful, pride and success are the prominent features of the governing party at GNAT and they imply achievement. Therefore, these findings of the current study are also in line with their study.
Dahllöf [35] investigated the impact of age and party affiliation on gender at Swedish parliament. Gender is more predictable in the older group than in the younger group. He also found that identifying the gender of right-wing MPs is more straightforward than for left-wing MPs. He suggested that older groups and left-wing politicians had more gender-equal vocabulary usage. It can be expressed that the lower accuracy rate can show that the MPs use a more gender-equal language, such as in the study of Dahllöf. On the other hand, it can also be interpreted that one of the dominant personality traits, gender, is not revealed sufficiently in their speeches when expressed from a different perspective. In contrast to the Canadian parliament, gender is more predictable for the youngest cohort in the Turkish parliament. As for party affiliation, the more centre parties have lower predictability of gender at GNAT, whereas this is true for the left-wing group of the Canadian parliament.
6. Conclusions
The estimation of demographic traits studies has been extensively examined in the English language using social media data; however, there are limited studies in the Turkish language using parliamentary data. In this study, we introduced a Turkish parliament debates corpus which is believed to diversify trait estimation studies. We carried out seven trait estimation tasks in the Turkish language and parliament debates. The accuracy of 82% demonstrates that the gender of MP has an effect on the content and style of debates. The age interval of MPs can also be determined with accuracy (52%) from documents. The spoken language and content of the document reflect the age of the MPs. In our study, the educational level of MPs can be determined with 60% accuracy. We examined the order of classes in age and education level prediction. Closer age intervals come together with significant rates in age classification. In the classification of education level, the order of classes was observed to have some inconsistencies: for example, assoc. prof. or prof. is closer to undergraduate than PhD, or graduate. It can be inferred from our study that the speech style and content of closer age groups precede each other. The accuracy of 67% in our experiment demonstrates a correlation between the occupation or profession of MPs and their speeches. The confusions of occupation classification show that the profession of political sciences is the least difficult to identify, whereas engineering is the most difficult. The election regions of MPs can be determined with 54% accuracy on Turkish parliament debates. According to the confusions of classes, there has been a closeness between Aegean and Marmara as well as the Eastern Anatolia and Southeastern Anatolia regions of Turkey.
Party affiliation (84%) and party status affiliation (92%) demonstrate the close relevance between their speeches and parliamentary attributes. According to these accuracies, the two highest accuracies of trait estimation tasks belong to the parliamentary domain rather than demographic ones.
We investigated the impact of one trait of the MPs on the other one from pairwise classification. The young MPs have been more reflecting their occupation or profession than the above age groups. The young deputies also tend to show their gender characteristics more precisely. In the pairwise classification of party affiliation and gender, the deputies of the central parties use more gender-equal vocabulary in their speeches. After analysis among the education status, party membership is reflected decisively by graduate education level MPs.
We also analysed the most discriminative terms from topic words, adjectives, and nouns. There exist concrete consequences for gender and party status. Femicide and violence against woman and children were the most troubling problems that can be extracted from the speeches of the MPs. Occupation classification shows that MPs prefer to use terms that related to their professions when speaking in GNAT. The social and economic structure of the geographical regions and regional issues can be extracted from the strongest terms of the election region classification. The terms that are related to ideologies and government or opposition status of the parties is essential to distinguish the party affiliation of the MPs. The governing MPs uses more traditional word in their speeches according to the topic words analysis.
It can be thought that deep learning methods have superiority over classical machine learning algorithms since they are state-of-the-art results in most of the NLP tasks. However, in our study, classical machine learning algorithms have outperformed deep learning techniques such as FFNN and BERT. When comparing accuracies of the models, TF-IDF_SVM and TF-IDF_LR have the highest accurracies for all trait estimation tasks. We also used the combination of style-based features (character n-grams) and content-based features (word n-grams) in SVM and LR algorithms. Only gender and occupation estimation task improved their accuracies. It can be said that the style of the author has an effect only on the gender and occupation prediction.
Our extensive empirical evaluation shows that (1) classical machine learning methods are more successful than deep learning techniques in trait estimation tasks when using Turkish parliament debates, (2) deputies show parliamentary characteristics more than their demographic characteristics and (3) violence against women and gender mainstreaming is a prominent issue in Turkey.
Author Contributions
Conceptualization, H.P. and M.K.; Data curation, M.K.; Formal analysis, H.P. and M.K.; Investigation, H.P. and M.K.; Methodology, H.P. and M.K.; software, M.K.; Supervision, H.P.; Visualization, M.K.; Writing—review & editing, H.P.and M.K. All authors have read and agreed to the published version of the manuscript.
Funding
This research received no external funding.
Conflicts of Interest
The authors declare no conflict of interest.
References
- Rangel, F.; Rosso, P.; Potthast, M.; Stein, B.; Daelemans, W. Overview of the 3rd Author Profiling Task at PAN 2015. In Proceedings of the CLEF 2015 Evaluation Labs and Workshop, Toulouse, France, 8–11 September 2015; pp. 1–8. [Google Scholar]
- Herring, S.C.; Paolillo, J.C. Gender and genre variation in weblogs. J. Socioling. 2006, 10, 439–459. [Google Scholar] [CrossRef]
- Holmes, D.I. Authorship attribution. Comput. Humanit. 1994, 28, 87–106. [Google Scholar] [CrossRef]
- Stamatatos, E.; Fakotakis, N.; Kokkinakis, G. Computer-based authorship attribution without lexical measures. Comput. Humanit. 2001, 35, 193–214. [Google Scholar] [CrossRef]
- Stamatatos, E. A survey of modern authorship attribution methods. J. Am. Soc. Inf. Sci. Technol. 2009, 60, 538–556. [Google Scholar] [CrossRef] [Green Version]
- Zheng, R.; Li, J.; Chen, H.; Huang, Z. A framework for authorship identification of online messages: Writing-style features and classification techniques. J. Am. Soc. Inf. Sci. Technol. 2006, 57, 378–393. [Google Scholar] [CrossRef]
- El Bouanani, S.E.M.; Kassou, I. Authorship analysis studies: A survey. Int. J. Comput. Appl. 2014, 86, 12. [Google Scholar]
- Reddy, T.R.; Vardhan, B.V.; Reddy, P.V. A survey on authorship profiling techniques. Int. J. Appl. Eng. Res. 2016, 11, 3092–3102. [Google Scholar]
- Iqbal, F.; Binsalleeh, H.; Fung, B.C.; Debbabi, M. Mining writeprints from anonymous e-mails for forensic investigation. Digit. Investig. 2010, 7, 56–64. [Google Scholar] [CrossRef] [Green Version]
- Janssen, A.; Murachver, T. The relationship between gender and topic in gender-preferential language use. Writ. Commun. 2004, 21, 344–367. [Google Scholar] [CrossRef]
- Bevendorff, J.; Ghanem, B.; Giachanou, A.; Kestemont, M.; Manjavacas, E.; Potthast, M.; Rangel, F.; Rosso, P.; Specht, G.; Stamatatos, E.; et al. Shared Tasks on Authorship Analysis at PAN 2020. In Proceedings of the European Conference on Information Retrieval, Lisbon, Portugal, 14–17 April 2020; pp. 508–516. [Google Scholar]
- Lim, W.Y.; Goh, J.; Thing, V.L. Content-centric age and gender profiling. In Proceedings of the Notebook for PAN at CLEF, Valencia, Spain, 23–26 September 2013; pp. 130–138. [Google Scholar]
- Agun, H.V.; Yilmazel, S.; Yilmazel, O. Effects of language processing in Turkish authorship attribution. In Proceedings of the 2017 IEEE International Conference on Big Data (Big Data), Boston, MA, USA, 11–14 December 2017; pp. 1876–1881. [Google Scholar]
- Koppel, M.; Argamon, S.; Shimoni, A.R. Automatically categorizing written texts by author gender. Lit. Linguist. Comput. 2002, 17, 401–412. [Google Scholar] [CrossRef]
- Mukherjee, A.; Liu, B. Improving gender classification of blog authors. In Proceedings of the 2010 Conference on Empirical Methods in Natural Language Processing, Association for Computational Linguistics, Cambridge, MA, USA, 9–11 October 2010; pp. 207–217. [Google Scholar]
- Bartle, A.; Zheng, J. Gender Classification with Deep Learning; 224d Course Project Report; The Stanford NLP Group: Stanford, CA, USA, 2015; pp. 1–7. [Google Scholar]
- Lin, J. Automatic Author Profiling of Online Chat Logs; Naval Postgraduate School: Monterey, CA, USA, 2007. [Google Scholar]
- Estival, D.; Gaustad, T.; Pham, S.B.; Radford, W.; Hutchinson, B. AP for English emails. In Proceedings of the 10th Conference of the Pacific Association for Computational Linguistics, Melbourne, Australia, 19–21 September 2007; pp. 263–272. [Google Scholar]
- Fatima, M.; Anwar, S.; Naveed, A.; Arshad, W.; Nawab, R.M.A.; Iqbal, M.; Masood, A. SMS-based author profiling: Data and methods. Nat. Lang. Eng. 2018, 24, 695–724. [Google Scholar] [CrossRef]
- Fatima, M.; Hasan, K.; Anwar, S.; Nawab, R.M.A. Multilingual author profiling on Facebook. Inf. Process. Manag. 2017, 53, 886–904. [Google Scholar] [CrossRef]
- Boulis, C.; Ostendorf, M. A quantitative analysis of lexical differences between genders in telephone conversations. In Proceedings of the 43rd Annual Meeting on Association for Computational Linguistics, Association for Computational Linguistics, Stroudsburg, PA, USA, 25–30 June 2005; pp. 435–442. [Google Scholar]
- Nguyen, D.; Smith, N.A.; Rose, C. Author age prediction from text using linear regression. In Proceedings of the 5th ACL-HLT Workshop on Language Technology for Cultural Heritage, Social Sciences, and Humanities, Association for Computational Linguistics, Portland, OR, USA, 24 June 2011; pp. 115–123. [Google Scholar]
- Prasetyo, N.D.; Hauff, C. Twitter-based election prediction in the developing world. In Proceedings of the 26th ACM Conference on Hypertext & Social Media, Guzelyurt, Turkey, 1–4 September 2015; pp. 149–158. [Google Scholar]
- Kaati, L.; Lundeqvist, E.; Shrestha, A.; Svensson, M. Author Profiling in the Wild. In Proceedings of the 2017 European Intelligence and Security Informatics Conference (EISIC), Athens, Greece, 11–13 September 2017; pp. 155–158. [Google Scholar]
- Kapočiūtė-Dzikienė, J.; Utka, A.; Šarkutė, L. Authorship attribution and author profiling of Lithuanian literary texts. In Proceedings of the 5th Workshop on Balto-Slavic Natural Language Processing, Hissar, Bulgaria, 10–11 September 2015; pp. 96–105. [Google Scholar]
- Conover, M.D.; Gonçalves, B.; Ratkiewicz, J.; Flammini, A.; Menczer, F. Predicting the political alignment of Twitter users. In Proceedings of the 2011 IEEE Third International Conference on Privacy, Security, Risk and Trust and 2011 IEEE Third International Conference on Social Computing, Boston, MA, USA, 9–11 October 2011; pp. 192–199. [Google Scholar]
- Flores, A.M.; Pavan, M.C.; Paraboni, I. Detection of hate speech spreaders using convolutional neural networks. J. Intell. Inf. Syst. 2022, 58, 67–89. [Google Scholar] [CrossRef]
- García-Díaz, J.A.; Colomo-Palacios, R.; Valencia-García, R. Psychographic traits identification based on political ideology: An author analysis study on spanish politicians’ tweets posted in 2020. Future Gener. Comput. Syst. 2022, 130, 59–74. [Google Scholar] [CrossRef]
- Amasyalı, M.F.; Diri, B. Automatic Turkish text categorization in terms of author, genre and gender. In Proceedings of the International Conference on Application of Natural Language to Information Systems, Klagenfurt, Austria, 31 May–2 June 2006; pp. 221–226. [Google Scholar]
- Deniz, A.; Kiziloz, H.E. Effects of various preprocessing techniques to Turkish text categorization using n-gram features. In Proceedings of the 2017 International Conference on Computer Science and Engineering (UBMK), Antalya, Turkey, 5–8 October 2017; pp. 655–660. [Google Scholar]
- Kucukyilmaz, T.; Cambazoglu, B.; Aykanat, C.; Can, F. Chat mining for gender prediction. In Proceedings of the International Conference on Advances in Information Systems, Izmir, Turkey, 18–20 October 2006; pp. 274–283. [Google Scholar]
- Türkmen, H.; Diri, B.; Biricik, G.; Doğan, R. Demographic information classification exploiting spoken language. In Proceedings of the IEEE 19th Signal Processing and Communications Applications Conference (SIU), Antalya, Turkey, 20–22 April 2011; pp. 13–16. [Google Scholar]
- Ciot, M.; Sonderegger, M.; Ruths, D. Gender inference of Twitter users in non-English contexts. In Proceedings of the 2013 Conference on Empirical Methods in Natural Language Processing, Grand Hyatt Seattle, Seattle, WA, USA, 18–21 October 2013; pp. 1136–1145. [Google Scholar]
- Yilmaz, K.E.; Abul, O. Inferring Political Alignments of Twitter Users. In Proceedings of the 2018 International Symposium on Networks, Computers and Communications (ISNCC), Rome, Italy, 19–21 June 2018; pp. 1–6. [Google Scholar]
- Dahllöf, M. Automatic prediction of gender, political affiliation, and age in Swedish politicians from the wording of their speeches? A comparative study of classifiability. Lit. Linguist. Comput. 2012, 27, 139–153. [Google Scholar] [CrossRef]
- Przybyła, P.; Teisseyre, P. Analysing utterances in polish parliament to predict speaker’s background. J. Quant. Linguist. 2014, 21, 350–376. [Google Scholar] [CrossRef]
- Dunn, J.; Argamon, S.; Rasooli, A.; Kumar, G. Profile-based authorship analysis. Digit. Scholarsh. Humanit. 2015, 31, 689–710. [Google Scholar] [CrossRef]
- Høyland, B.; Godbout, J.; Lapponi, E.; Velldal, E. Predicting party affiliations from European Parliament debates. In Proceedings of the ACL 2014 Workshop on Language Technologies and Computational Social Science, Baltimore, MD, USA, 26 June 2014; pp. 56–60. [Google Scholar]
- Yu, B.; Kaufmann, S.; Diermeier, D. Classifying party affiliation from political speech. J. Inf. Technol. Politics 2008, 5, 33–48. [Google Scholar] [CrossRef]
- Hirst, G.; Riabinin, Y.; Graham, J.; Boizot-Roche, M.; Morris, C. Text to Ideology or Text to Party Status? In From Text to Political Positions: Text Analysis across Disciplines; Kaal, B., Maks, E.I., van Elfrinkhof, A.M.E., Eds.; John Benjamins: Amsterdam, The Netherlands, 2014; pp. 93–115. [Google Scholar]
- Lapponi, E.; Søyland, M.G.; Velldal, E.; Oepen, S. The Talk of Norway: A richly annotated corpus of the Norwegian parliament, 1998–2016. Lang. Resour. Eval. 2018, 52, 873–893. [Google Scholar] [CrossRef] [Green Version]
- Peterson, A.; Spirling, A. Classification accuracy as a substantive quantity of interest: Measuring polarization in Westminster systems. Political Anal. 2018, 26, 120–128. [Google Scholar] [CrossRef] [Green Version]
- Yu, B. Language and gender in Congressional speech. Lit. Linguist. Comput. 2013, 29, 118–132. [Google Scholar] [CrossRef]
- Cohen, J. Statistical Power Analysis for the Behavioral Sciences; Routledge: London, UK, 2013. [Google Scholar]
- Newman, M.L.; Groom, C.J.; Handelman, L.D.; Pennebaker, J.W. Gender differences in language use: An analysis of 14,000 text samples. Discourse Process. 2008, 45, 211–236. [Google Scholar] [CrossRef]
- Rangel, F.; Rosso, P.; Potthast, M.; Stein, B. Overview of the 5th author profiling task at pan 2017: Gender and language variety identification in twitter. In Proceedings of the CLEF 2017—Conference and Labs of the Evaluation Forum, Dublin, Ireland, 11–14 September 2017; pp. 1613–1673. [Google Scholar]
- Rangel, F.; Rosso, P.; Montes-y-Gómez, M.; Potthast, M.; Stein, B. Overview of the 6th author profiling task at pan 2018: Multimodal gender identification in Twitter. In Proceedings of the CLEF 2018—Conference and Labs of the Evaluation Forum, Avignon, France, 10–14 September 2018; pp. 1–38. [Google Scholar]
- Rangel, F.; Franco-Salvador, M.; Rosso, P. A low dimensionality representation for language variety identification. In Proceedings of the International Conference on Intelligent Text Processing and Computational Linguistics, Konya, Turkey, 3–9 April 2016; pp. 156–169. [Google Scholar]
- Harris, Z.S. Distributional structure. Word 1954, 10, 146–162. [Google Scholar] [CrossRef]
- Mikolov, T.; Chen, K.; Corrado, G.; Dean, J. Efficient estimation of word representations in vector space. arXiv 2013, arXiv:1301.3781. [Google Scholar]
- Pennington, J.; Socher, R.; Manning, C. Glove: Global vectors for word representation. In Proceedings of the 2014 Conference on Empirical Methods in Natural Language Processing (EMNLP), Doha, Qatar, 25–29 October 2014; pp. 1532–1543. [Google Scholar]
- Bojanowski, P.; Grave, E.; Joulin, A.; Mikolov, T. Enriching word vectors with subword information. Trans. Assoc. Comput. Linguist. 2017, 5, 135–146. [Google Scholar] [CrossRef] [Green Version]
- Peters, M.; Neumann, M.; Iyyer, M.; Gardner, M.; Clark, C.; Lee, K.; Zettlemoyer, L. Deep contextualized word representations. arXiv 2018, arXiv:1802.05365. [Google Scholar]
- Devlin, J.; Chang, M.; Lee, K.; Toutanova, K. Bert: Pre-training of deep bidirectional transformers for language understanding. arXiv 2018, arXiv:1810.04805. [Google Scholar]
- Polat, H.; Körpe, M. TBMM Genel Kurul Tutanaklarından Yakın Anlamlı Kavramların Çıkarılması. BilişIm Teknol. Derg. 2018, 11, 235–244. [Google Scholar] [CrossRef] [Green Version]
- Vaswani, A.; Shazeer, N.; Parmar, N.; Uszkoreit, J.; Jones, L.; Gomez, A.N.; Kaiser, Ł.; Polosukhin, I. Attention is all you need. Adv. Neural Inf. Process. Syst. 2017, 30, 5998–6008. [Google Scholar]
- Schweter, S. BERTurk—BERT Models for Turkish; Zenodo: Geneva, Switzerland, 2020. [Google Scholar] [CrossRef]
- Le, Q.; Mikolov, T. Distributed representations of sentences and documents. In Proceedings of the International Conference on Machine Learning, Beijing, China, 21–26 June 2014; pp. 1188–1196. [Google Scholar]
- Kiros, R.; Zhu, Y.; Salakhutdinov, R.R.; Zemel, R.; Urtasun, R.; Torralba, A.; Fidler, S. Skip-thought vectors. Adv. Neural Inf. Process. Syst. 2015, 28, 3294–3302. [Google Scholar]
- Joachims, T. Text categorization with support vector machines: Learning with many relevant features. In Machine Learning: ECML-98. ECML 1998; Springer: Berlin/Heidelberg, Germany, 1998; pp. 137–142. [Google Scholar]
- Kim, Y. Convolutional neural networks for sentence classification. arXiv 2014, arXiv:1408.5882. [Google Scholar]
- Graves, A. Generating sequences with recurrent neural networks. arXiv 2013, arXiv:1308.0850. [Google Scholar]
- Socher, R.; Perelygin, A.; Wu, J.; Chuang, J.; Manning, C.D.; Ng, A.Y.; Potts, C. Recursive deep models for semantic compositionality over a sentiment treebank. In Proceedings of the 2013 Conference on Empirical Methods in Natural Language Processing, Grand Hyatt, Seattle, Seattle, WA, USA, 18–21 October 2013; pp. 1631–1642. [Google Scholar]
- McNemar, Q. Note on the sampling error of the difference between correlated proportions ortages. Psychometrika 1947, 12, 153–157. [Google Scholar] [CrossRef] [PubMed]
- Ertek, T. Hasan Ali Yücel ve Birinci Coğrafya Kongresi (1941). Türk Coğrafya Dergisi 2012, 57, 11–19. [Google Scholar]
- Valencia, A.I.V.; Adorno, H.G.; Rhodes, C.S.; Pineda, G.F. Bots and Gender Identification Based on Stylometry of Tweet Minimal Structure and n-grams Model. In Proceedings of the Working Notes of CLEF 2019—Conference and Labs of the Evaluation Forum, Lugano, Switzerland, 9–12 September 2019. [Google Scholar]
- Pizarro, J. Using N-grams to detect Bots on Twitter. In Proceedings of the 10th International Conference of the CLEF Association, CLEF 2019, Lugano, Switzerland, 9–12 September 2019. [Google Scholar]
- Rangel, F.; Rosso, P. Overview of the 7th author profiling task at PAN 2019: Bots and gender profiling in Twitter. In Proceedings of the CEUR Workshop, Lugano, Switzerland, 9–12 September 2019; pp. 1–36. [Google Scholar]
- Veenhoven, R.; Snijders, S.; van der Hall, D.; van Noord, R. Using translated data to improve deep learning author profiling models. In Proceedings of the Ninth International Conference of the CLEF Association (CLEF 2018), Avignon, France, 10–14 September 2018. [Google Scholar]
- Miura, Y.; Taniguchi, T.; Taniguchi, M.; Ohkuma, T. Author Profiling with Word+ Character Neural Attention Network. In Proceedings of the CLEF 2017 Evaluation Labs and Workshop, Dublin, Ireland, 11–14 September 2017; pp. 11–14. [Google Scholar]
- Rangel, F.; De la Peña Sarracén, G.L.; Chulvi, B.; Fersini, E.; Rosso, P. Profiling Hate Speech Spreaders on Twitter Task at PAN 2021. In Proceedings of the CLEF (Working Notes), Bucharest, Romania, 21–24 September 2021; pp. 1772–1789. [Google Scholar]
- Dukic, D.; Krzic, A.S. Detection of Hate Speech Spreaders with BERT. In Proceedings of the CLEF 2021—Conference and Labs of the Evaluation Forum, Bucharest, Romania, 21–24 September 2021; pp. 1910–1919. [Google Scholar]
- Siino, M.; Di Nuovo, E.; Tinnirello, I.; La Cascia, M. Detection of hate speech spreaders using convolutional neural networks. In Proceedings of the CLEF 2021—Conference and Labs of the Evaluation Forum, Bucharest, Romania, 21–24 September 2021; pp. 2126–2136. [Google Scholar]
- Blaxill, L.; Beelen, K. A feminized language of democracy? The representation of women at Westminster since 1945. Twent. Century Br. Hist. 2016, 27, 412–449. [Google Scholar] [CrossRef]
- Naderi, N.; Hirst, G. Using context to identify the language of face-saving. In Proceedings of the 5th Workshop on Argument Mining, Brussels, Belgium, 1 November 2018; pp. 111–120. [Google Scholar]
- Tausczik, Y.R.; Pennebaker, J.W. The psychological meaning of words: LIWC and computerized text analysis methods. J. Lang. Soc. Psychol. 2010, 29, 24–54. [Google Scholar] [CrossRef]
Publisher’s Note: MDPI stays neutral with regard to jurisdictional claims in published maps and institutional affiliations. |
© 2022 by the authors. Licensee MDPI, Basel, Switzerland. This article is an open access article distributed under the terms and conditions of the Creative Commons Attribution (CC BY) license (https://creativecommons.org/licenses/by/4.0/).