1. Introduction and Related Work
The Transmission Control Program was first introduced by Cerf and Kahn [
1] as a networking model to share resources among connected nodes in packet-switching networks. TCP has undergone modification, refinement, improvement, and fine-tuning. The original control program incorporated both connection-oriented links and a connection-less approach (i.e., datagram) between the nodes. Soon after its introduction, it was divided into Transmission Control Protocol (TCP) at the transport layer and Internet Protocol (IP) at the network layer [
2,
3]. The pivotal idea of TCP is to provide a connection-oriented, reliable, ordered, and error-checked transmission between applications running on the sender and the receiver nodes over a packet-switching network [
2]. On the other hand, the purpose of IP is to relay the actual data across networks [
3]. Its routing capabilities empower internetworking and eventually become the backbone of the Internet.
TCP mitigates the applications and users from the underlying details of communication techniques and works as a facilitator for them to easily use the communication services without any hassle. TCP runs under the assumption that packet loss and unexpectedly prolonged delay are mainly because of congestion in the network, and tries to adapt itself to the changing conditions of the network with congestion control mechanisms [
2,
4,
5,
6]. There are various congestion control algorithms such as slow start, congestion avoidance, fast retransmission, and fast recovery [
5,
6]. Based on different techniques and ways to handle and avoid the network congestion problem, TCP has many variants. The original congestion avoidance algorithm is known as TCP Tahoe [
5,
7], and some other variants are TCP Reno, TCP Vegas [
8], FAST TCP [
9,
10], TCP New Reno [
11], among others. TCP Tahoe was named after the 4.3BSD operating system (in which it appeared the first time) that was itself named after Lake Tahoe. TCP Reno is a modification of TCP Tahoe and is named after the 4.3BSD operating system where it appeared the first time, and named after the city of Reno, Nevada, NV, USA.
It should be noted that TCP was originally designed to work over wired networks with a low bit error rate (BER). However, TCP is being used for many wireless communication services such as mobile data services, wireless local area, wide area networks, and wireless communication in data centers with higher BERs. The wireless channels are inherently lossy and are subject to higher BER. There are many comparative studies on TCP variants in various network settings and scenarios [
12,
13,
14,
15,
16,
17,
18,
19,
20,
21,
22]. Numerous research works on improving the performance of TCP are reported in the network literature (see, for example, [
23,
24,
25,
26,
27,
28,
29,
30,
31,
32,
33,
34,
35,
36,
37,
38,
39,
40,
41,
42,
43,
44,
45]). This paper addresses the following research question.
What impact do high BERs have on TCP Reno performance for FTP download response time, packet retransmission attempt, and mean throughput?
To answer the research question posed, we carry out an extensive analysis of simulation and modelling.
The main contributions of this paper are summarized as follows.
We analyze the performance of TCP Reno in high BERs over a wireless network environment using simulation and modelling. The effect of BERs on system performance is also investigated.
We derive (analytically) the key performance metrics, such as expected throughput TTCP over a 10 Mbit/s Ethernet connection, FTP Download response time, packet drops and retransmission, and TCP congestion avoidance mechanism to estimate the system performance. We then perform an extensive simulation using Riverbed Modeler (formerly OPNET Modeler) to validate analytical models.
We implement TCP Reno (in C++) and the corresponding process models in the Riverbed Modeler to study and analyze the system performance. We record various statistics for system analysis, such as FTP Download response time, network load, TCP Retransmission count, sent segment ACK number, traffic received, congestion window size, and remote receiver window size. This is a significant piece of work contributing towards the implementation of TCP in wireless and mobile networks.
We validate simulation results by cross-checking through analysis, as well as using a testbed. To this end, we set up a virtualized testbed using two Linux hosts and a Linux router. The Linux router was configured to achieve the desired performance testing (see
Section 4—FTP Download Response Time).
The rest of the paper is organized as follows. The network model and simulation scenarios are laid down in
Section 2. Simulation results are presented in
Section 3.
Section 4 is dedicated to results validation and verification. In
Section 5, we present the TCP Reno retransmission algorithm and results. Finally, the paper is concluded with recommendations for practitioners in
Section 6.
2. Modelling the Network
A network channel is a physical medium in which a signal can travel. The medium can be guided (e.g., wired medium) or unguided (i.e., wireless). A noise in networks is a disturbance in the transmission medium that affects the characteristics of the signal and its quality. Thus, a noisy channel is a medium of transmission with disturbances. Independent of the source of disturbance, a random disturbance in a transmission channel results in random bit errors. The amount of noise can be expressed as the number of bit errors it introduces. A higher BER means more noises in the channel. We use the packet dropping capabilities of the Riverbed Modeler simulation tool to simulate the consequence of different BERs on system performance.
2.1. Bit Error Rate and Packet Error Rate
A bit error is defined as the total number of bits of a data stream over a communication channel that is affected by the noise. Bit error rate (
BER) is defined as the number of bit errors divided by the total number of transferred bits [
46].
The packet error rate (
PER) is defined as the number of packets with errors divided by the number of packets transmitted.
The relation between
BER and
PER depends on the average packet length
L. Assuming BER is evenly distributed,
PER is the probability that there is a bit error in the packet with length
L.
Table 1 shows the relationship between
BER and
PER for two different packet lengths. Column 1 shows
BER. The corresponding
PER for packet lengths of 1250 bytes and 1500 bytes are shown in Columns 2 and 3, respectively.
The first packet length (i.e., frame length) was chosen due to the simplicity of the relation it creates between BER and PER. The packet length of 1250 bytes leads to a 10
−4 factor between BER and PER, and the average Ethernet packet length is likely a bit smaller than the maximum packet length. The second packet length (1500 bytes) was selected because it is the average size of an Ethernet frame. The average frame length heavily depends on the network environment (corporate or internet service provider) and the traffic direction (up- or down-stream) [
6]. The Riverbed simulation in this study consists of one large file transfer from a server node to a client node. Because our simulation transfers the one file over the link from the server to the client with a maximum transmission unit (MTU) of length 1500 bytes, an average frame size of 1500 bytes is a realistic assumption.
We observe that a high BER (10−4) leads to a PER of 1 or more. This means that every packet is dropped out and it is impossible to transfer data over the link. With an evenly distributed BER, only frames smaller than 1250 bytes have a chance to get sporadically through.
2.2. Packet Error Rate and Packet Drop Probability
Random bit errors in the link-layer frame will lead to errors in the Ethernet frame check sequence (FCS, also known as cyclic redundancy check) or in the IP header checksum or the TCP checksum. If a destination node receives an Ethernet frame with a wrong checksum, the destination node drops the frame immediately. In rare cases, the destination node does not detect the error in the Ethernet frame or the IP header, or in the TCP header in the very improbable case where several bit errors lead to the same cyclic redundancy check (CRC) code. The first router receiving the faulty packet will discard the packet after verifying its checksum [
46]. The router will not inform the sender about discarding the packet. If the bit error occurs in the TCP segment, the receiver will detect it while verifying the TCP checksum. If the checksum does not match, the receiver will discard the segment and will not acknowledge receiving it [
47]. Because a bit error in a packet will always lead to a silent packet drop (the sender is not informed about the packet drop), a noisy channel can be simulated by a network that drops packets with a certain probability
. In the simulation,
PER is simulated by the packet dropping probability
, i.e.,
2.3. Simulation Model
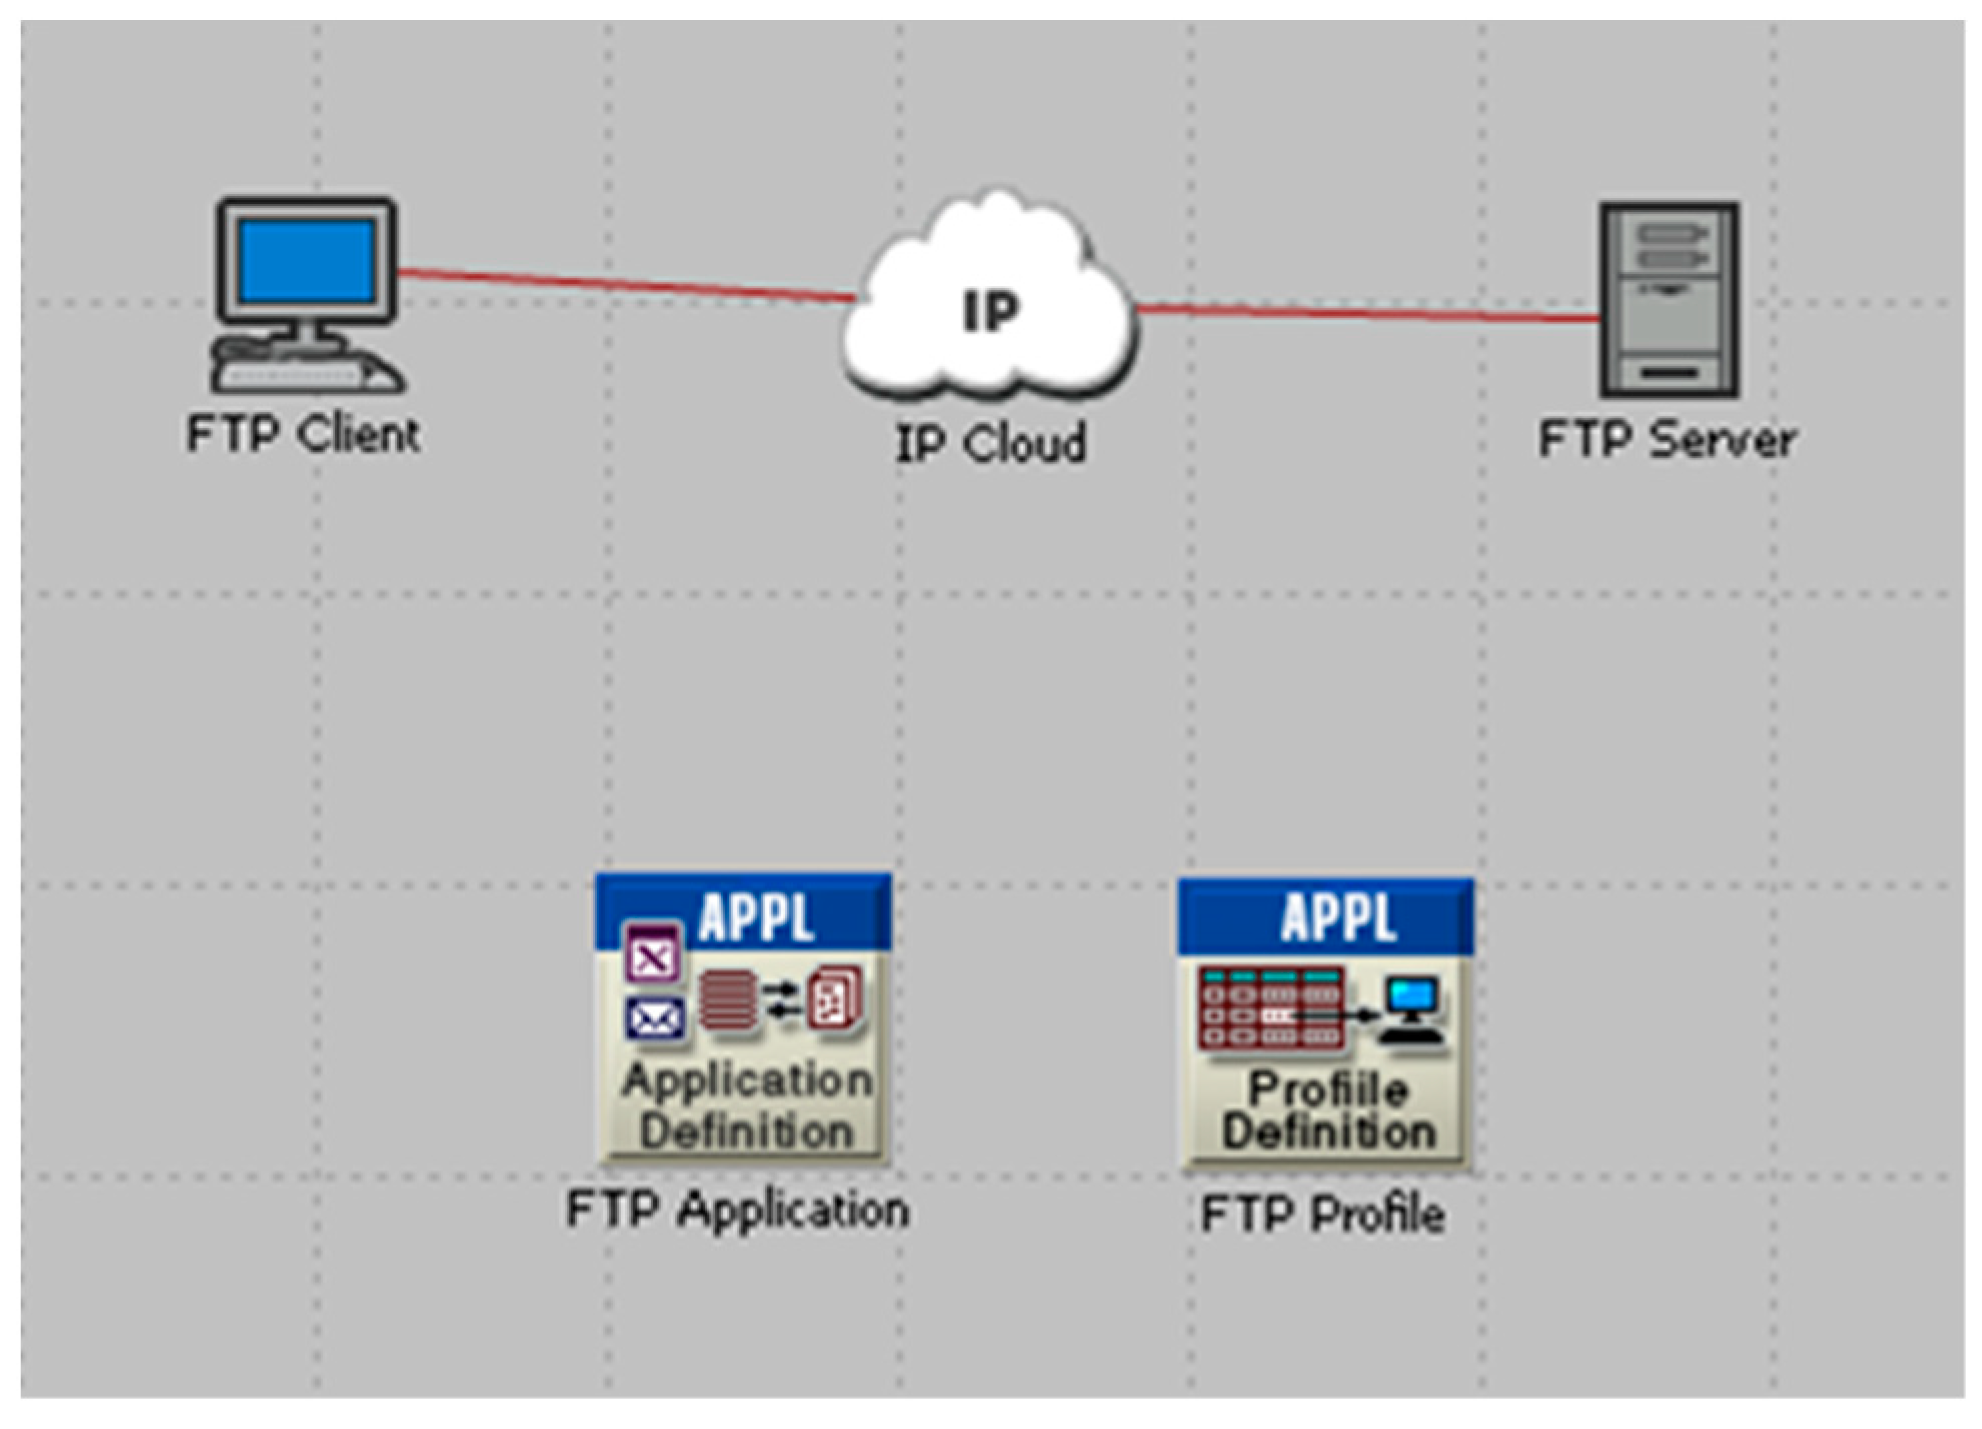
The simulation was carried out using Riverbed Modeler version 16.0.A. The model is simplified to minimize the effect of other parameters on system performance. A File Transfer Protocol (FTP) server and an FTP client were set up to simulate network traffic.
Figure 1 shows the simulated network model.
FTP Client: The FTP client uses the Riverbed simulation module “ethernet_wkstn_adv” for client functionality. It connects to the IP cloud using an Ethernet cable. The FTP client uses the default TCP parameters, as shown in
Table 2. The client supports the FTP Profile (bottom right box in
Figure 1).
FTP Server: The FTP server uses the Riverbed module “ethernet_server_adv” for setting up server functionality. The server is linked to the IP cloud using an Ethernet cable. The FTP server also uses the simulator default TCP parameters (
Table 2), and it supports the FTP application, as shown in
Figure 1 (bottom left icon).
IP Cloud: The IP cloud uses the simulator module “ether-net4_slip8_cloud_adv” to set up its functionality. It is used to simulate an IP network. The Packet Latency was set to 0.02 s and the Packet Discard Ratio was set to different values depending on the scenarios studied.
FTP Application: The application simulates FTP traffic. The FTP parameters are set to:
Command Mix (Get/Total): 100%
Inter-Request Time (seconds): constant (3600)
File Size (bytes): constant (10,000,000)
Symbolic Server Name: FTP Server
Type of Service: Best Effort (0)
RSVP Parameters: None
Back-End Custom Application: Not Used
FTP Profile: The FTP profile uses the FTP application and runs it once.
2.4. Simulation Scenarios
We simulated five selected scenarios (
Table 3) based on the packet drop probability (PDP) of 0, 0.01, 0.1, 1, and 10%. Column 1 lists the five scenarios of PDP. The corresponding PDP, BER, and the channel conditions are shown in Columns 2, 3, and 4, respectively.
2.5. Simulation Parameters and Statistics
The simulation runtime was set to 45 min (2700 s) and 2700 sets of values (various statistics) were collected during the simulation. We have recorded the following seven statistics.
Global Statistics—FTP Download Response Time (s)
Server Node Statistics—TCP Connection—Retransmission Count (Packets)
Server Node Statistics—Traffic Load (packets)
Server Node Statistics—TCP Connection—Congestion Window Size (bytes)
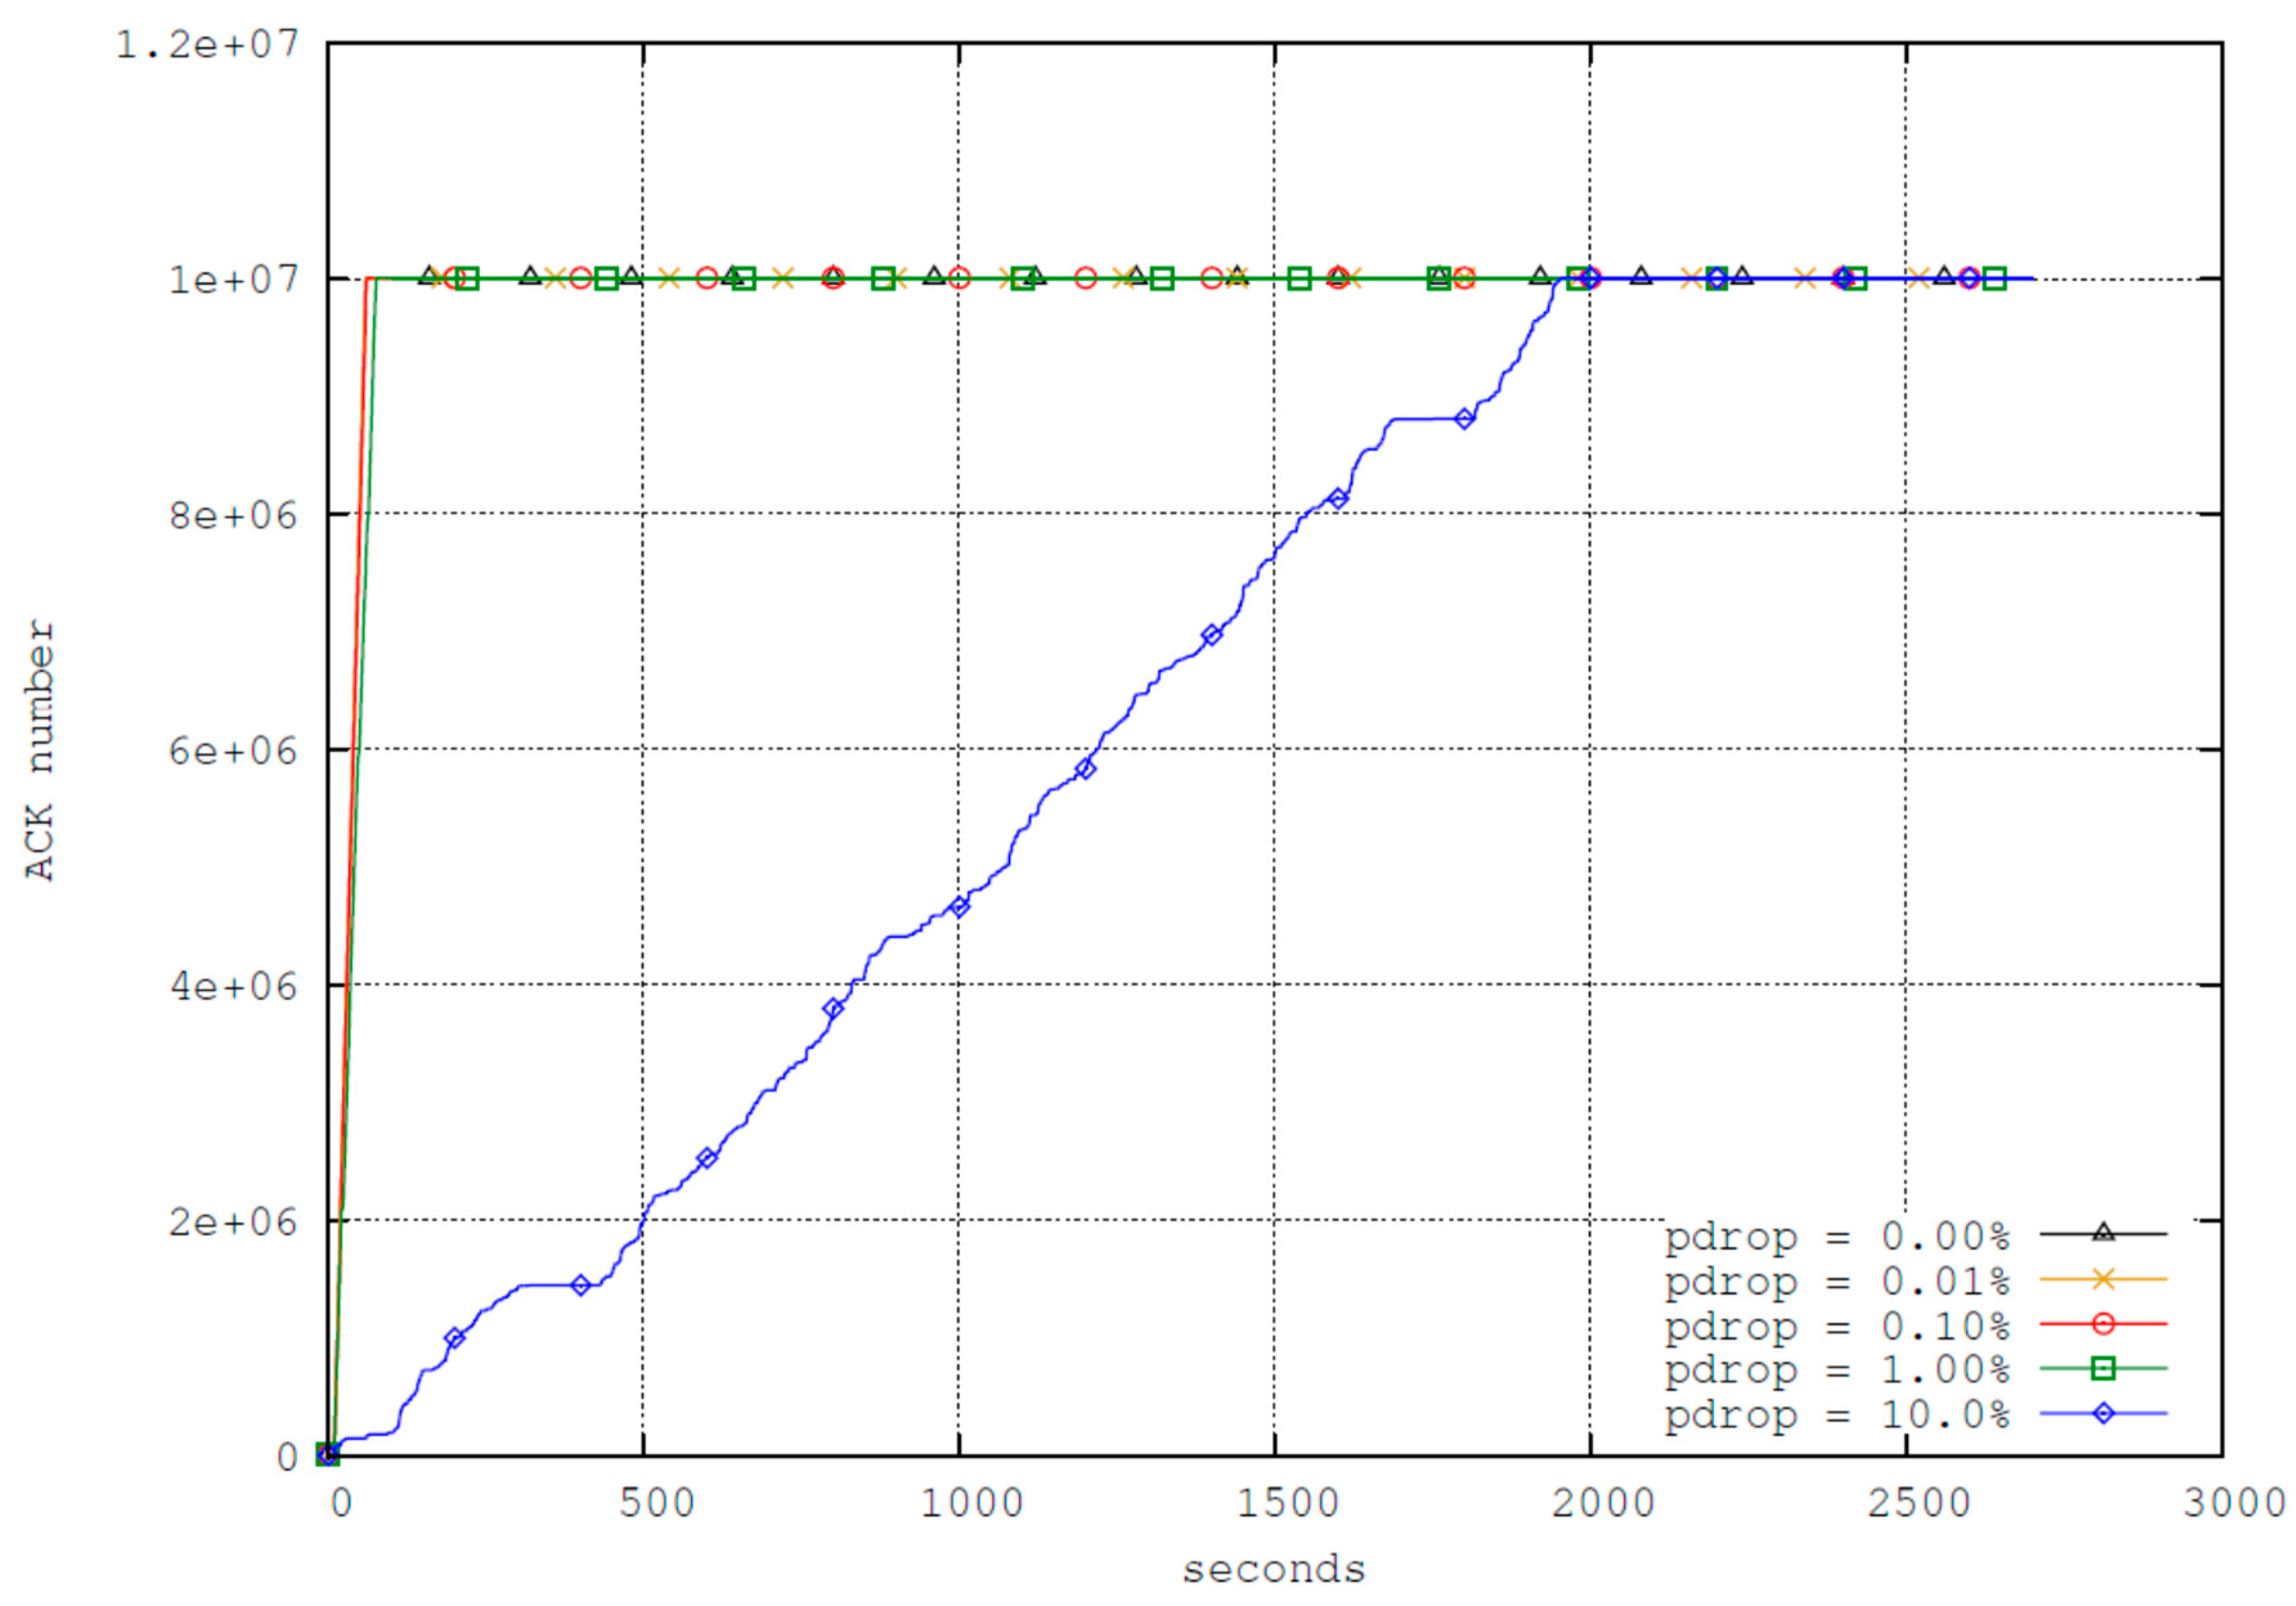
Client Node Statistics—TCP Connection—Sent Segment ACK Number
Client Node Statistics—TCP Connection—Throughput (bytes/s)
Client Node Statistics—TCP Connection—Receiver Window Size (bytes)
4. Analysis and Validation of Results
Several aspects of the simulation are verified either by calculating the result based on the protocol behavior or by rerunning the tests in a virtualized network environment.
4.1. Amount of Datagram Sent
This section verifies that the number of datagrams necessary to transport the file corresponds with the number of datagrams sent by OPNET. The size of the transferred file in the OPNET simulation is 10,000,000 bytes. The standard Ethernet maximum transmission unit (MTU) is 1500 bytes. When the IP header without any options (20 bytes) and the TCP header without any options are removed (20 bytes), the TCP maximum segment size (
MSS) is 1460 bytes. The number of datagrams n required to transport the file is given by
Thus, about 6850 datagrams are required to transfer the file from
FTP server to the
FTP client. The Riverbed Modeler simulator recorded 6854 frames sent by the
FTP server for the scenario
(
Table 6).
The difference between the four packets can be explained as follows. The first packet is related to the TCP handshake. It is the answer (TCP SYN/ACK) to the TCP connection request of the FTP client. The next two frames are related to the TCP teardown. One is the TCP FIN and the other one is the TCP ACK. Both are sent from the server to the client. The last frame is related to the link-layer address resolution. The server needs to determine the link-layer address of the next-hop and sends, therefore, an Address Resolution Protocol (ARP) request. This adds up to the four frames, the difference between the calculated and the recorded value. Thus, the number of datagrams sent during the simulation are the same as the calculated expected number of datagrams necessary to transfer the file of size s = 10,000,000 bytes with MSS = 1460 bytes.
To conclude, the simulation matches the amount of datagram (packets) expected.
4.2. Amount of Packet Retransmitted
It is expected that a link with a packet drop probability
pdrop will retransmit at least
n ×
pdrop packets. This assumes that only the dropped packets need to be retransmitted.
Table 7 shows the calculated number of packets drops and the actual retransmissions sent by the
FTP server from
Table 5.
The packet retransmissions should be at least as high as the number of calculated packet drops. A packet dropped because of a bit error needs to be retransmitted to finally transmit the whole file. Thus, at least the dropped packets need to be retransmitted. A higher amount of retransmission might be because of protocol mechanisms.
While the
Table 7 shows that the retransmission count is within the range of the expected packet drops, it also shows that the observed retransmission count is higher, and in one case lower, than the calculated value. We expect that the reason for the difference is in the implementation of the dropping algorithm in Riverbed Modeler and how it tries to achieve a certain drop probability. This assumption is based on the observation that a modification of the
FTP download offset (when the download should start relative to the simulation start) also changed the amount of retransmission the
FTP server sends.
4.3. Theoretical Maximum Throughput
This section compares the theoretical maximal throughput obtained from TCP protocol window size with the achieved throughput in the simulation.
4.3.1. Simulation
For the duration of the simulation run, Riverbed Modeler recorded the bytes received by the FTP client. For the scenario
pdrop = 0.00%, the first value was recorded at
and the last value at
. The throughput
is the transferred file size
divided by the time that was needed to transfer the file:
This calculation contains a small error as the simulation just records the values every second. Therefore, is not exactly 10 s, but between 9 s and 10 s, and is between 59 s and 60 s. For the order of the throughput, however, it does not have a significant impact.
4.3.2. Medium (Ethernet) Limitation
Each TCP segment sent over an Ethernet connection will have some overhead because of the lower layer protocols involved in the communication [
46]. Different protocol layers include additional headers (see below).
TCP header (20 byte): TCP header without options
IP header (20 byte): IP header without options
Ethernet overhead (38 byte), preamble (8 byte), CRC (18 byte), inter-packet gab (12 byte)
Thus, a TCP segment has an overhead of 78 bytes. The expected throughput
over a
Ethernet connection will be:
This is significantly higher than the throughput achieved in the simulation because most TCP feathers, such as timeout, acknowledgement mechanism and retransmission, are ignored and only the protocol overhead is considered.
4.3.3. TCP Window Size
TCP throughput T_TCP depends on the round-trip time (
RTT) and the TCP receiver window (
rwnd). It is not possible to go any faster than the window size offered by the receiver, divided by the RTT [
46].
Thus, with an
RTT of 0.04 s (as used in the simulation) and
rwnd of six MSS (8760, see
Table 2, Receive Buffer).
This correlates well with the throughput of 200,000 bytes/s (see Equation (7)), as recorded by the Riverbed Modeler. RTT in the simulation is expected to be slightly higher because of the processing delays on the end systems.
4.4. FTP Download Response Time
The download response time, which is the time to download the file over FTP client, is verified in two ways. First, the duration is calculated based on the theoretical throughput (see Equation (11)). The expected response time for the scenario
is the size of the transferred file
divided by the theoretical throughput
.
This does not correlate very well with the 60.21 s obtained with OPNET. Furthermore, it also does not correlate well with the graphs in
Figure 3,
Figure 5 and
Figure 8. They all suggest that traffic gets sent from around
to
, which would mean roughly 50 s for the scenario
.
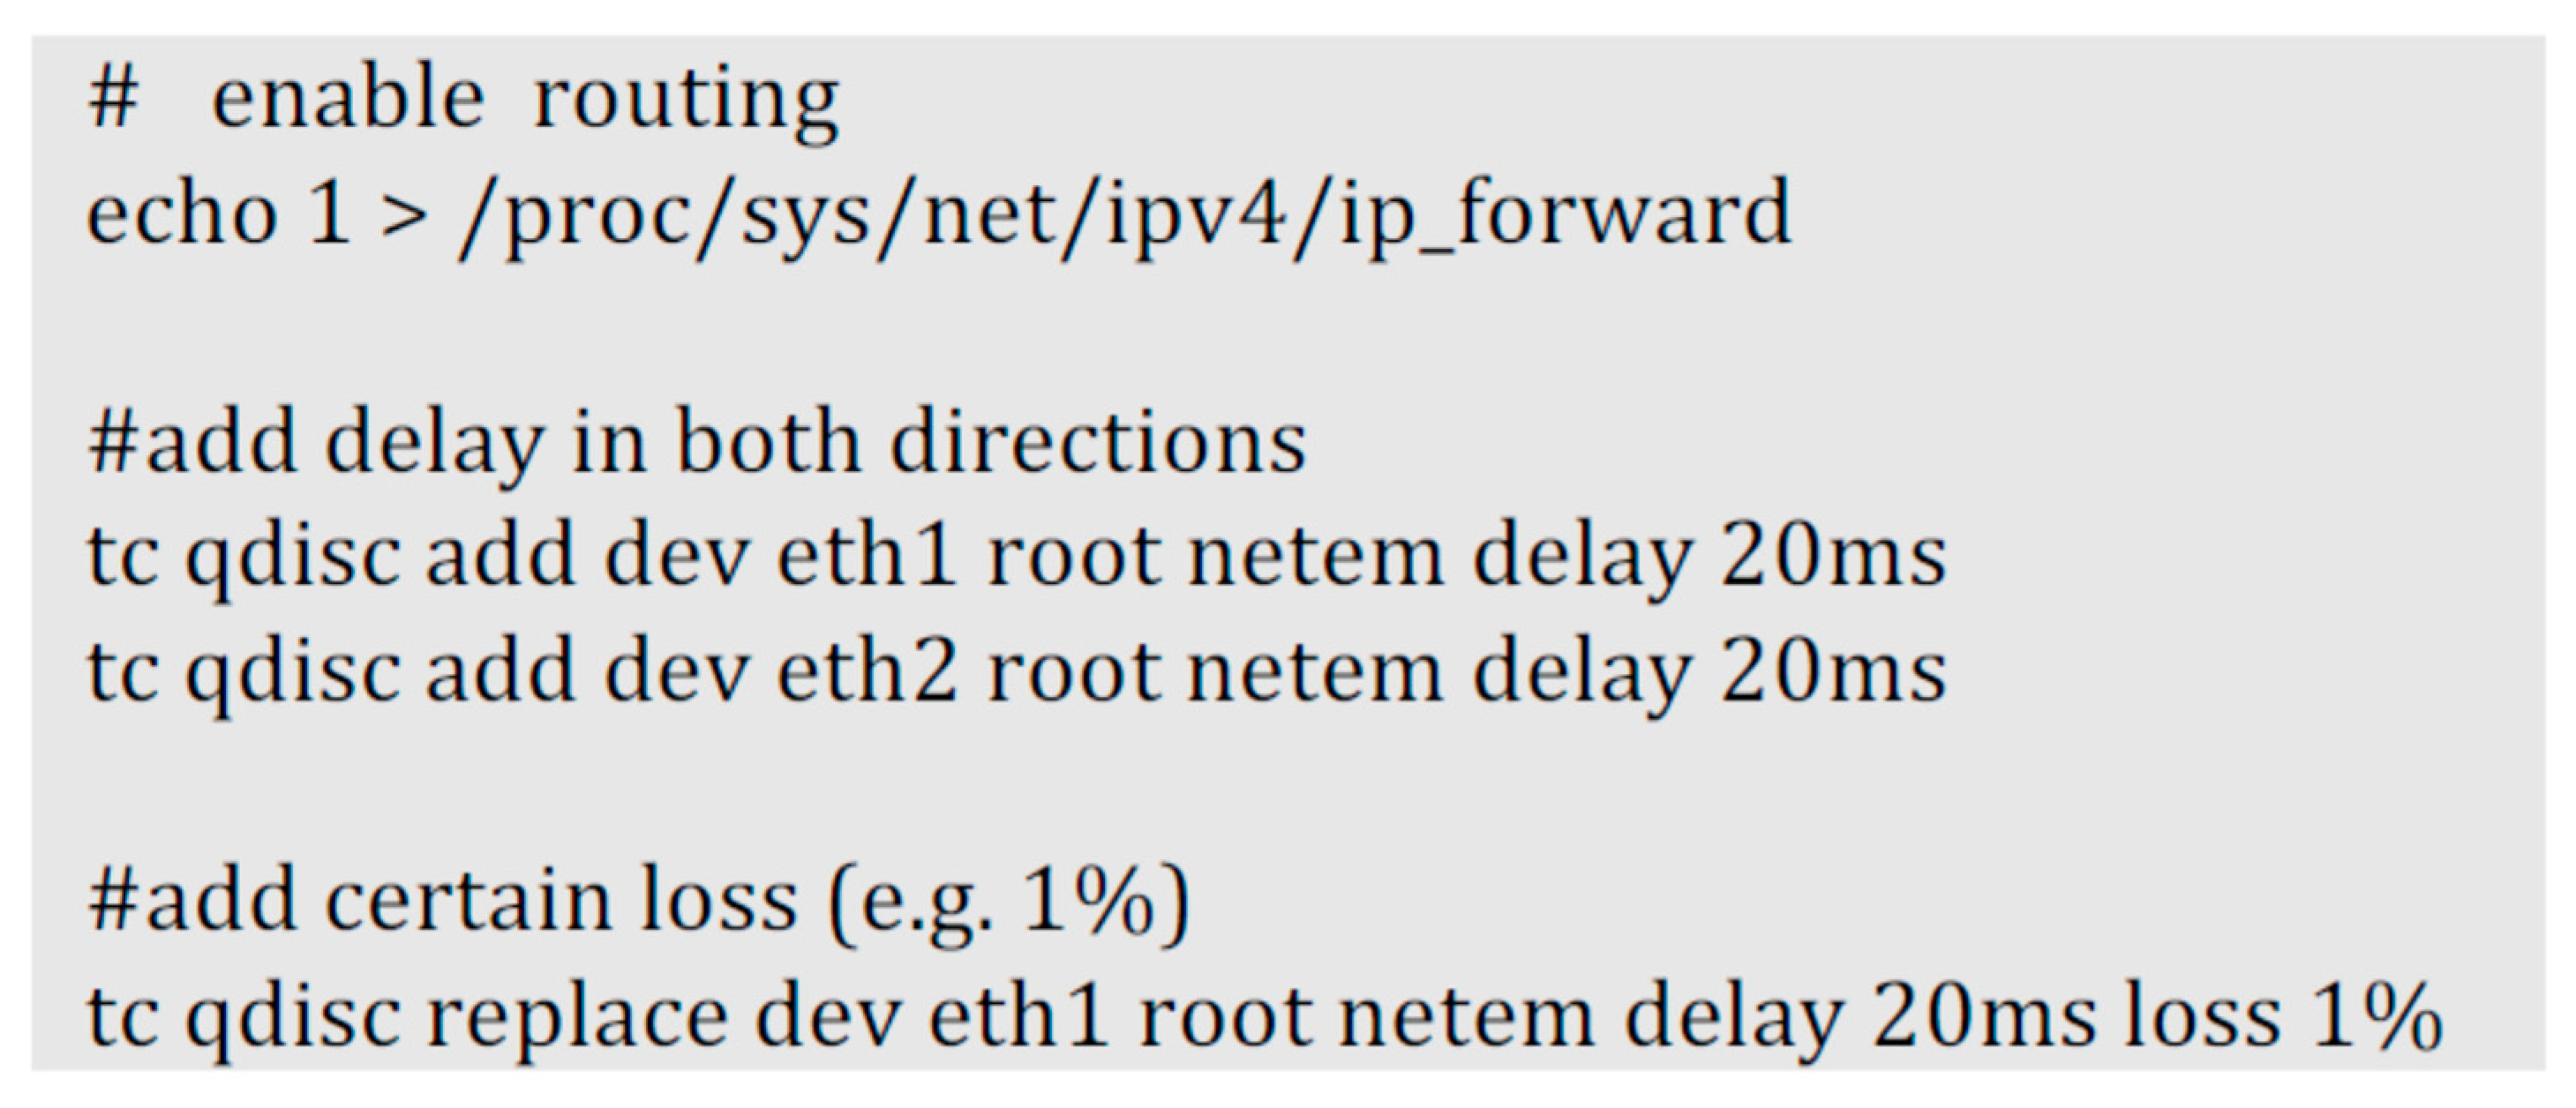
Second, a small, virtualized network was setup to verify the download response time with an experiment. The setup consists of two Linux hosts and a Linux router. The Linux router runs netem (part of the Linux kernel for network emulation) to introduce a 20 milli-seconds delay in each direction and a certain drop probability
. The Linux router was configured with the commands as shown in
Figure 9.
Table 8 shows the measured TCP download response time for various scenarios. A reevaluation of the simulation model revealed a 5 s start time in the FTP profile and another 5 s start time offset in the FTP application settings. Unfortunately, removing these two offsets did not change the results of the FTP download response time but merely moved the previously mentioned
Figure 10 to the left. The authors believe that the error originates from a setting within the Riverbed Modeler simulator but were not able to determine the setting responsible for this offset.
Assuming the response times in
Table 4 are 10 s shorter, the virtualized setup shows the same behavior as the Riverbed Modeler. A low
does not influence the download time significantly. A drop probability of 1% increases the download time significantly, and a drop probability of 10% leads to an immensely longer download time.
The authors believe that the difference in the scenarios with and comes from the difference in the number of packets dropped in the simulation and the virtualized network environments. In the scenario with , the simulation drops fewer packets than expected based on the calculations. In addition, the simulation is about 9 s faster with the file download than in the virtualized environment. In the scenario with , the file download is significantly slower, but the number of dropped packets is also drastically higher than the expected number of dropped packets based on the probability.
5. Discussion and Interpretation of Results
Anyone unfamiliar with TCP could assume that in the case of a packet drop, TCP would just need an additional
RTT to retransmit the packet. The average packet rate for
is:
Thus, if 1% of the packets are dropped, that would mean that about 68.54 packets need to be retransmitted.
With the above-average packet rate, that would add:
Adding 0.602 s to the transfer time of
would result in 60.82 s. This is still far less than the simulated transfer time of 66.83 s (
, 10 s subtracted from simulation result, see
Table 4). This indicates that other factors need to be considered to explain the observed behavior.
5.1. Packet Drop and Retransmission
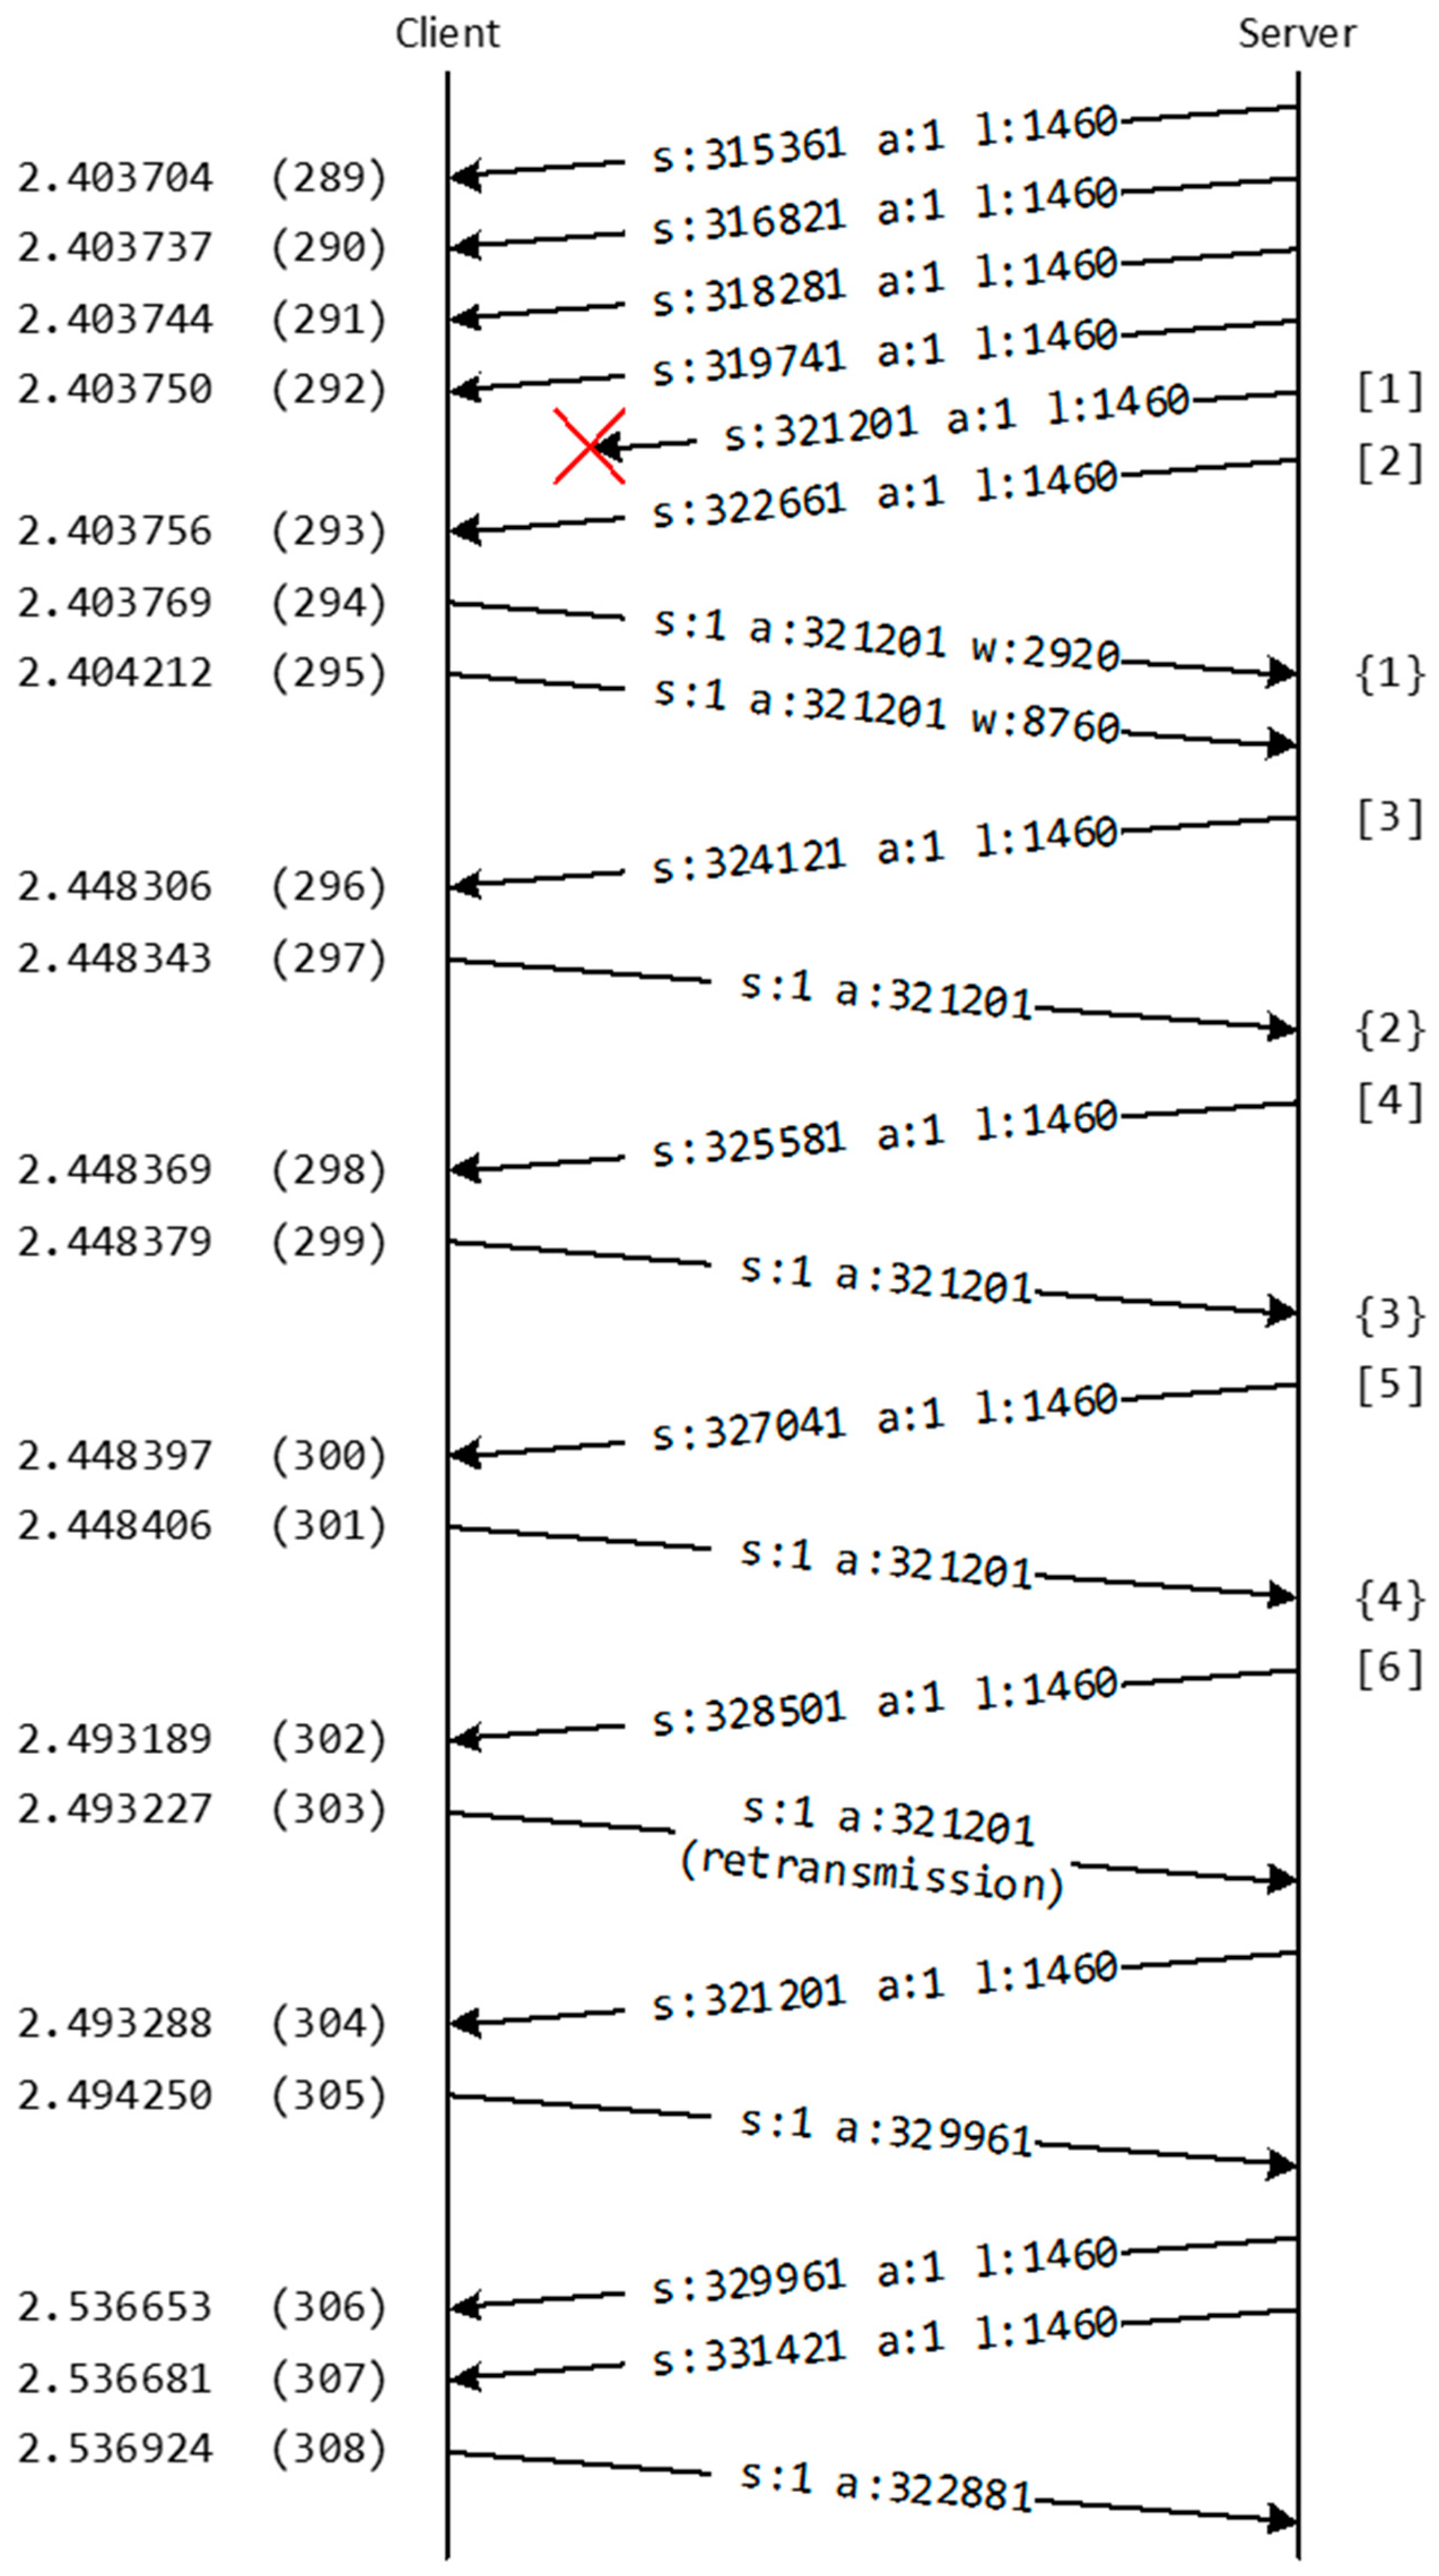
Figure 10 shows the packet exchange for the scenario
around the first packet loss until the packet is retransmitted. The graph is based on traffic captured in the
virtualized network environment, used to verify the results, and not on the Riverbed simulation. It was captured on the client-side. Therefore, the packet order on the server side does not necessarily represent the correct sequence.
In
Figure 10, the numbers on the left-hand side are timestamps in seconds. Numbers on the left-hand side in round brackets are frame numbers as they were recorded. Numbers on the right-hand side in square brackets count the segments sent without an ACK received, and in curly brackets are the numbers of ACKs received for the same sequence number.
Before the first segment was lost, the server reached the receiver’s advertised window (
rwnd) of 8760 bytes (six segments’ of 1460 bytes) with a slow start. The server was sending six segments when the fifth segment (between 292 and 293) was dropped. The client immediately replied with an ACK (294) as defined in RFC 5681 [
6]. Because the FTP client did not have a chance to read the data from the TCP receiving buffer (289–292), the client set the receiving window to 2920 bytes. Shortly after, the FTP clients read the data and the client sent a TCP window adjustment (295) to open the window again.
After receiving the ACK (294), the server sent another four segments to the client and filled the window with six segments 1–6. The first three segments 3 to 5 were sent almost at the same time. The figure might be a bit misleading here. For easier reading, the figure has been stretched to avoid overlapping arrows. Many packets were sent almost simultaneously. The packets sent from the server and the client crossed each other somewhere between the two systems.
Because the client was missing the segment with sequence number 321,201, the client kept sending ACKs for sequence numbers 1–4. When the server received the fourth ACK (or the third duplicated ACK), it went into fast retransmission [
6] and retransmitted the segment (303). Again, the figure might be misleading. The third duplicated ACK was received by the server around 2.468 (sent time plus half of RTT), and the packet was retransmitted around 2.473 (arrival time minus half RTT).
When the next (new) ACK (305) was received, the congestion window (cwnd) was set to slow start threshold (ssthresh). In this case, it is set to three MSS or 4380 bytes. The server then sent two additional segments (306, 307) and the client acknowledged them (308).
Between the first segment (280) arriving at the client and the last segment (307) arriving at the client, 0.132977 s passed, which is roughly three RTTs (0.042 s). During this period, 12 segments were sent to the client. Without a packet drop, 18 packets would have been sent to the client (three times the full window size) at the same time. In other words, each packet drop led to a delay of one RTT. This is exactly what anyone unfamiliar with TCP would expect. Unfortunately, it does not account for all the additional delays observed in the scenario .
5.2. Congestion Avoidance
The previous section explained that the file transfer needed a longer time because of the retransmission of the dropped packets. It also showed that the retransmission only accounts for a small amount of the additional time the file transfer needed in the scenario compared to the scenario . This section focuses on the TCP congestion avoidance mechanism and shows how the mechanism is responsible for the rest of the additional time needed in the scenario .
With segment (309), the server enters the congestion avoidance phase. RFC 5681 [
6] defines two possibilities of fast expansion of
cwnd for a TCP host. The first option is to expand
cwnd by byte-acknowledged
or by one
MSS.
The second expansion option is:
Both formulas can be used by a TCP implementation.
Table 9 shows the theoretical increase with a start value of three
MSS based on (17). The second column shows the results in bytes, and the third column shows results in the number of
MSS.
After 14 RTTs, the cwnd should again reach rwnd (8760 bytes or six MSS). The actual traffic capture shows a slightly different image. During 15 RTTs, the server keeps sending three segments, and the client replies with an ACK. Following that, the server sends nine times alternately four and five segments, which are acknowledged by the client. Then the server starts again by sending the full rwnd of six MSSs.
Overall, the TCP connection in the virtualized environment needs 27 RTTs to recover from one packet drop. In these 27 RTTs, only 98 segments are transmitted. With a cwnd equal to the rwnd (which would be the case without packet drops), the server would have sent 162 segments at the same time. Consequently, the server must transmit the other 64 segments later. The server transmits six segments per RTT. Accordingly, the server will need 10.67 RTTs or, based on an RTT of 0.04 s, 0.4268 s longer because of the one packet drop.
In the scenario
, 68 segments should have been retransmitted. This adds up to 29.02 s, which is the additional time overhead required by the server to transfer the file to the client because of the packet drops. This is in the same range of time as the FTP download in the scenario
(see
Table 4) in the Riverbed simulation.
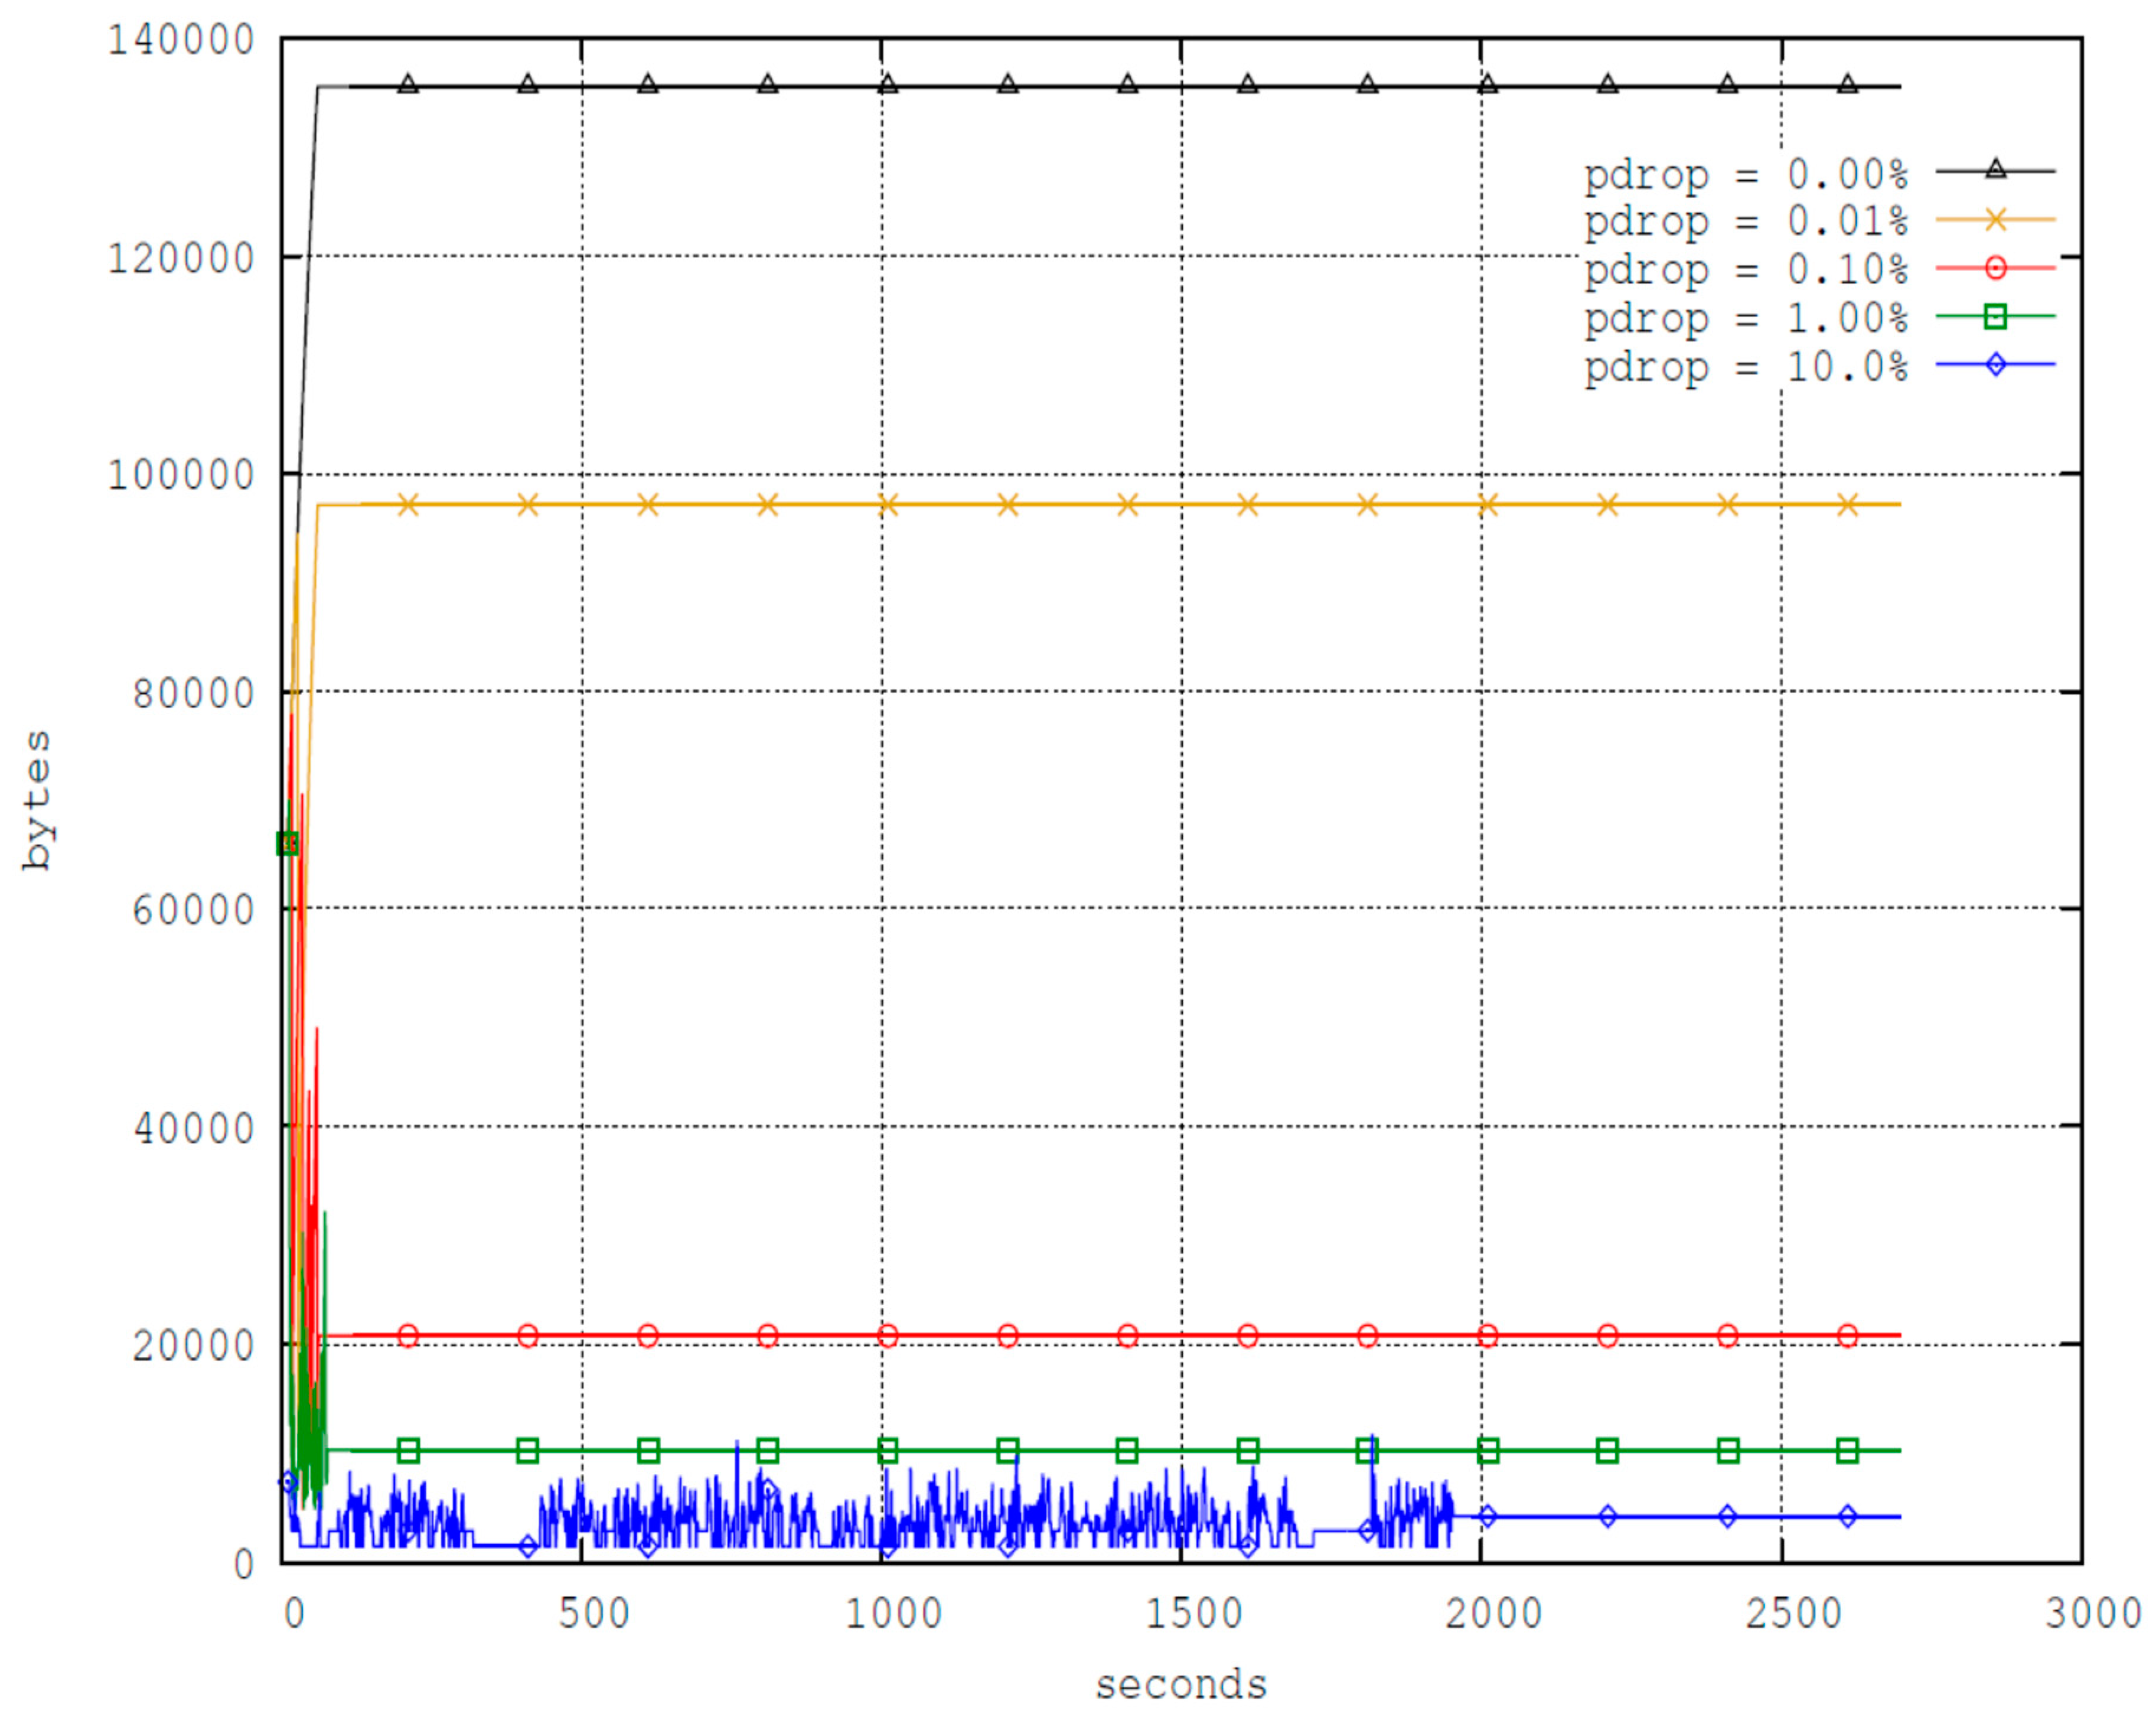
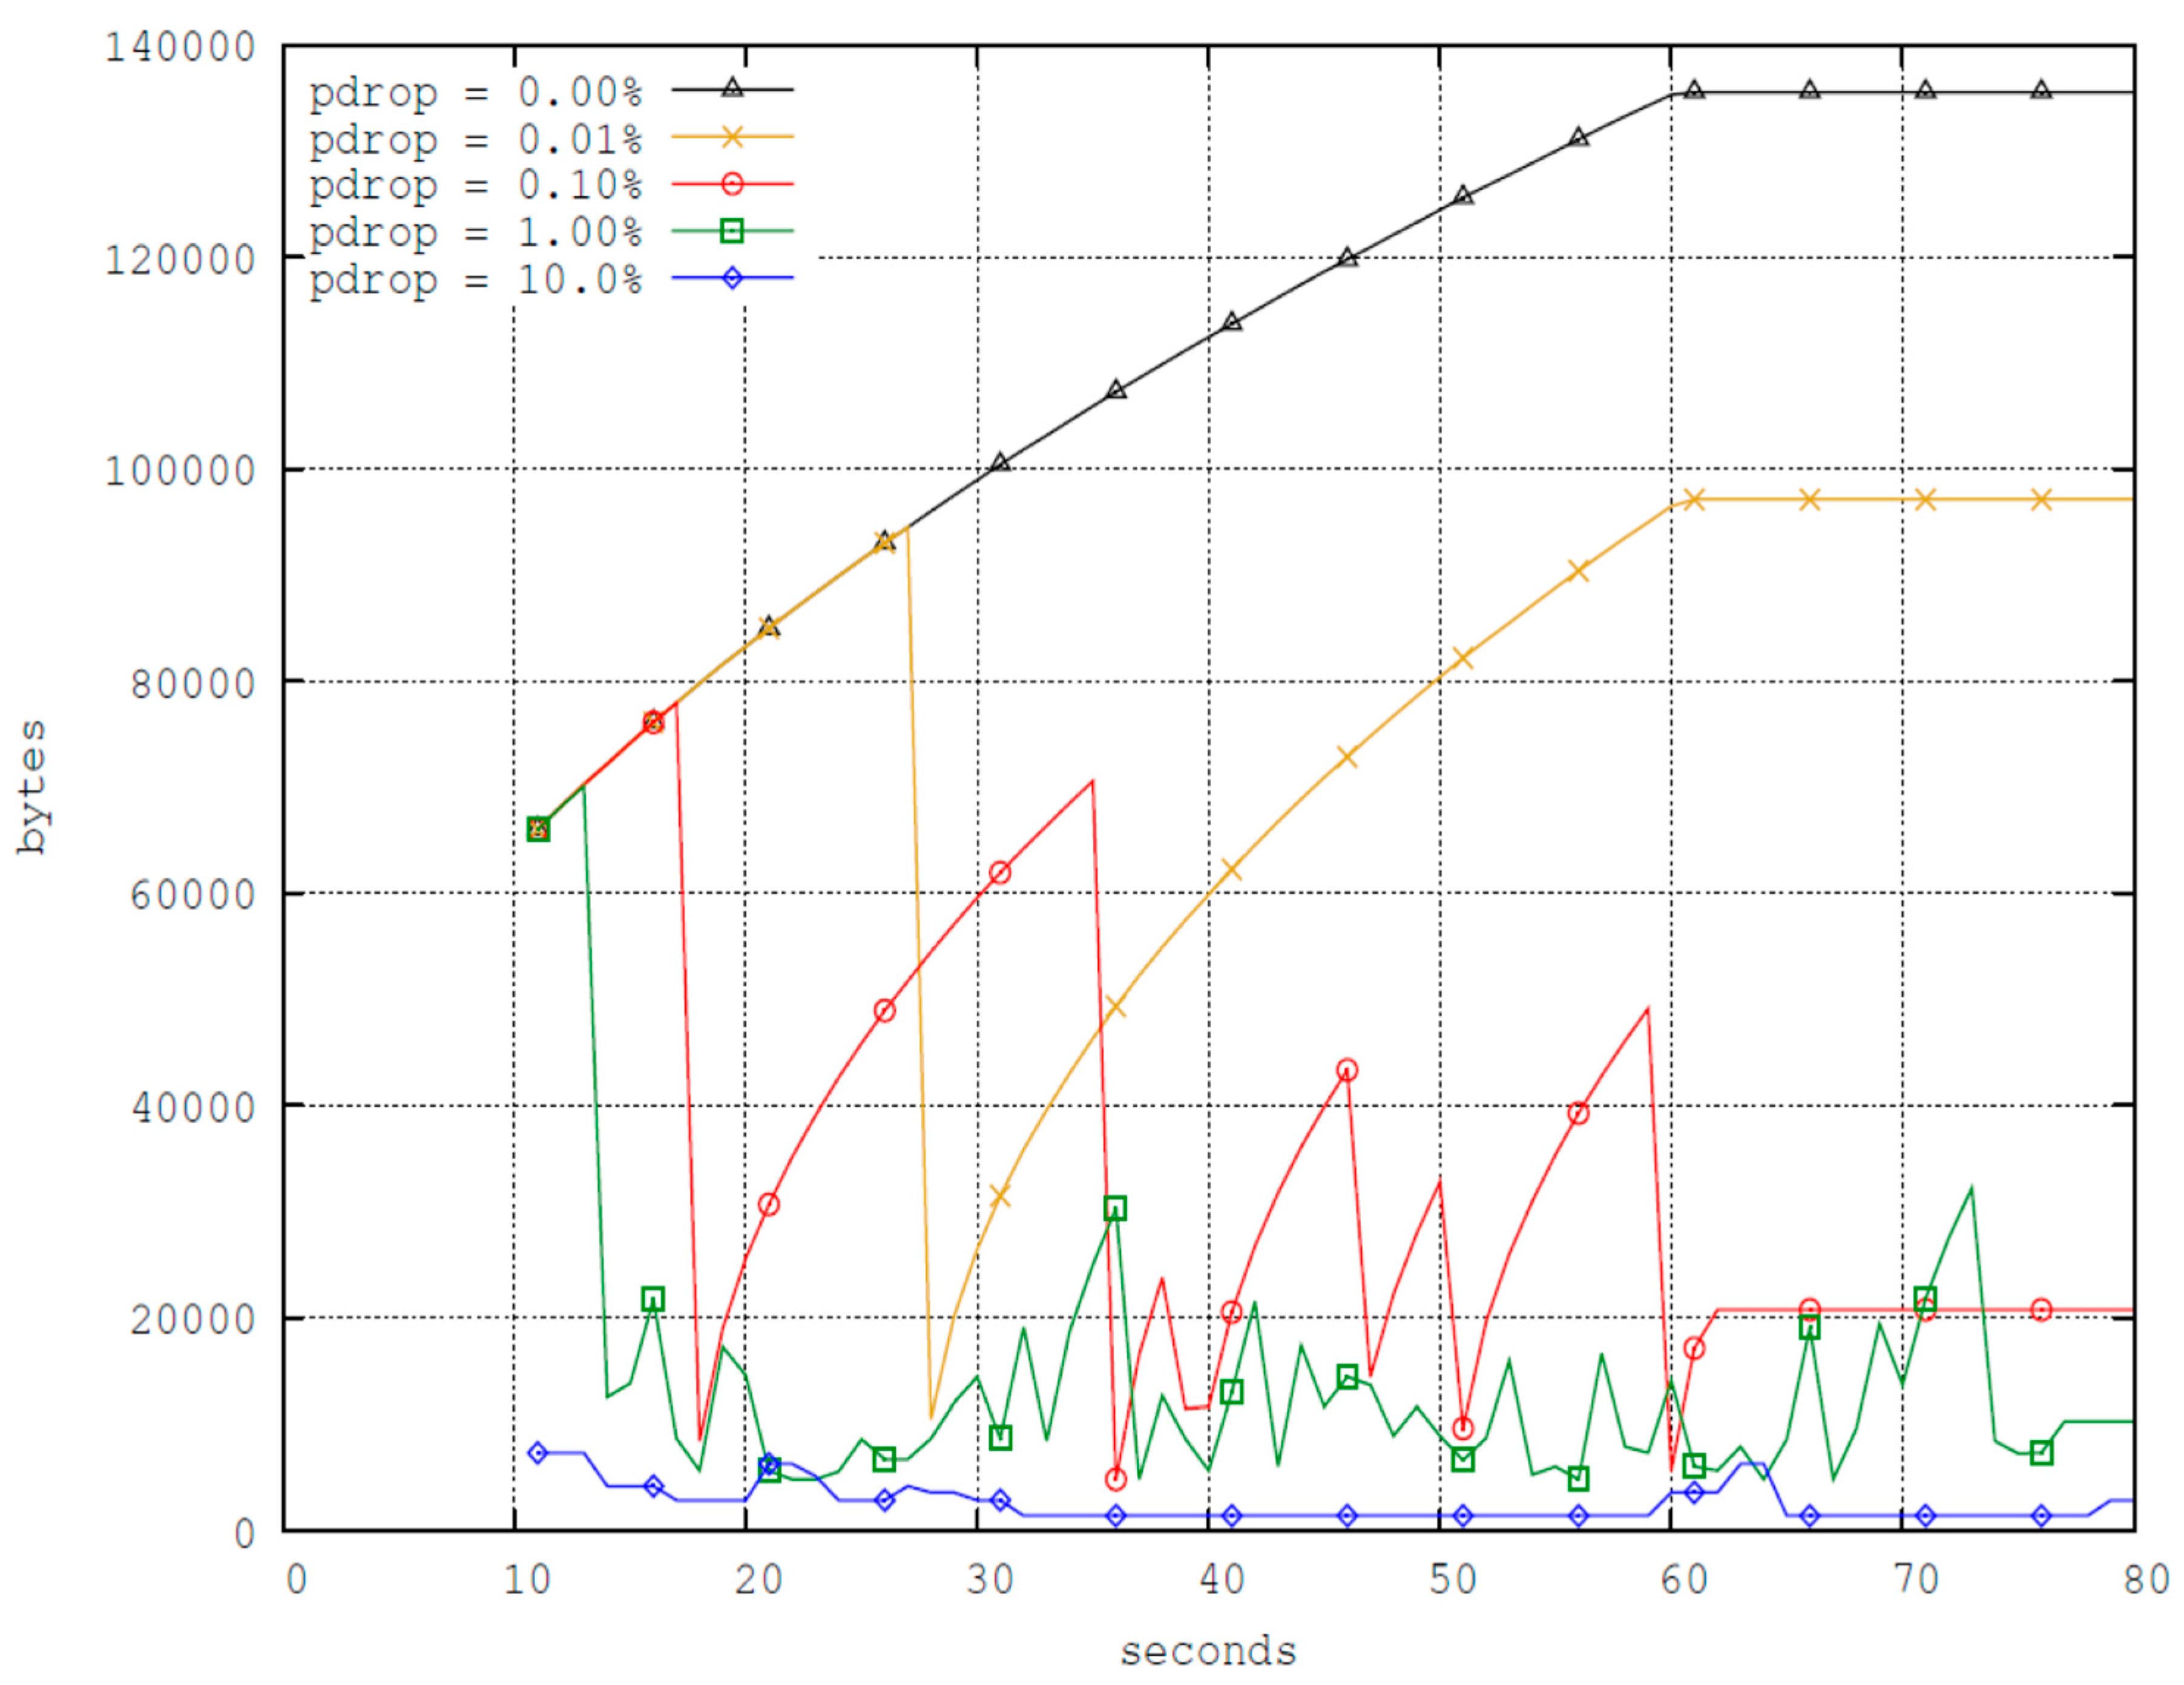
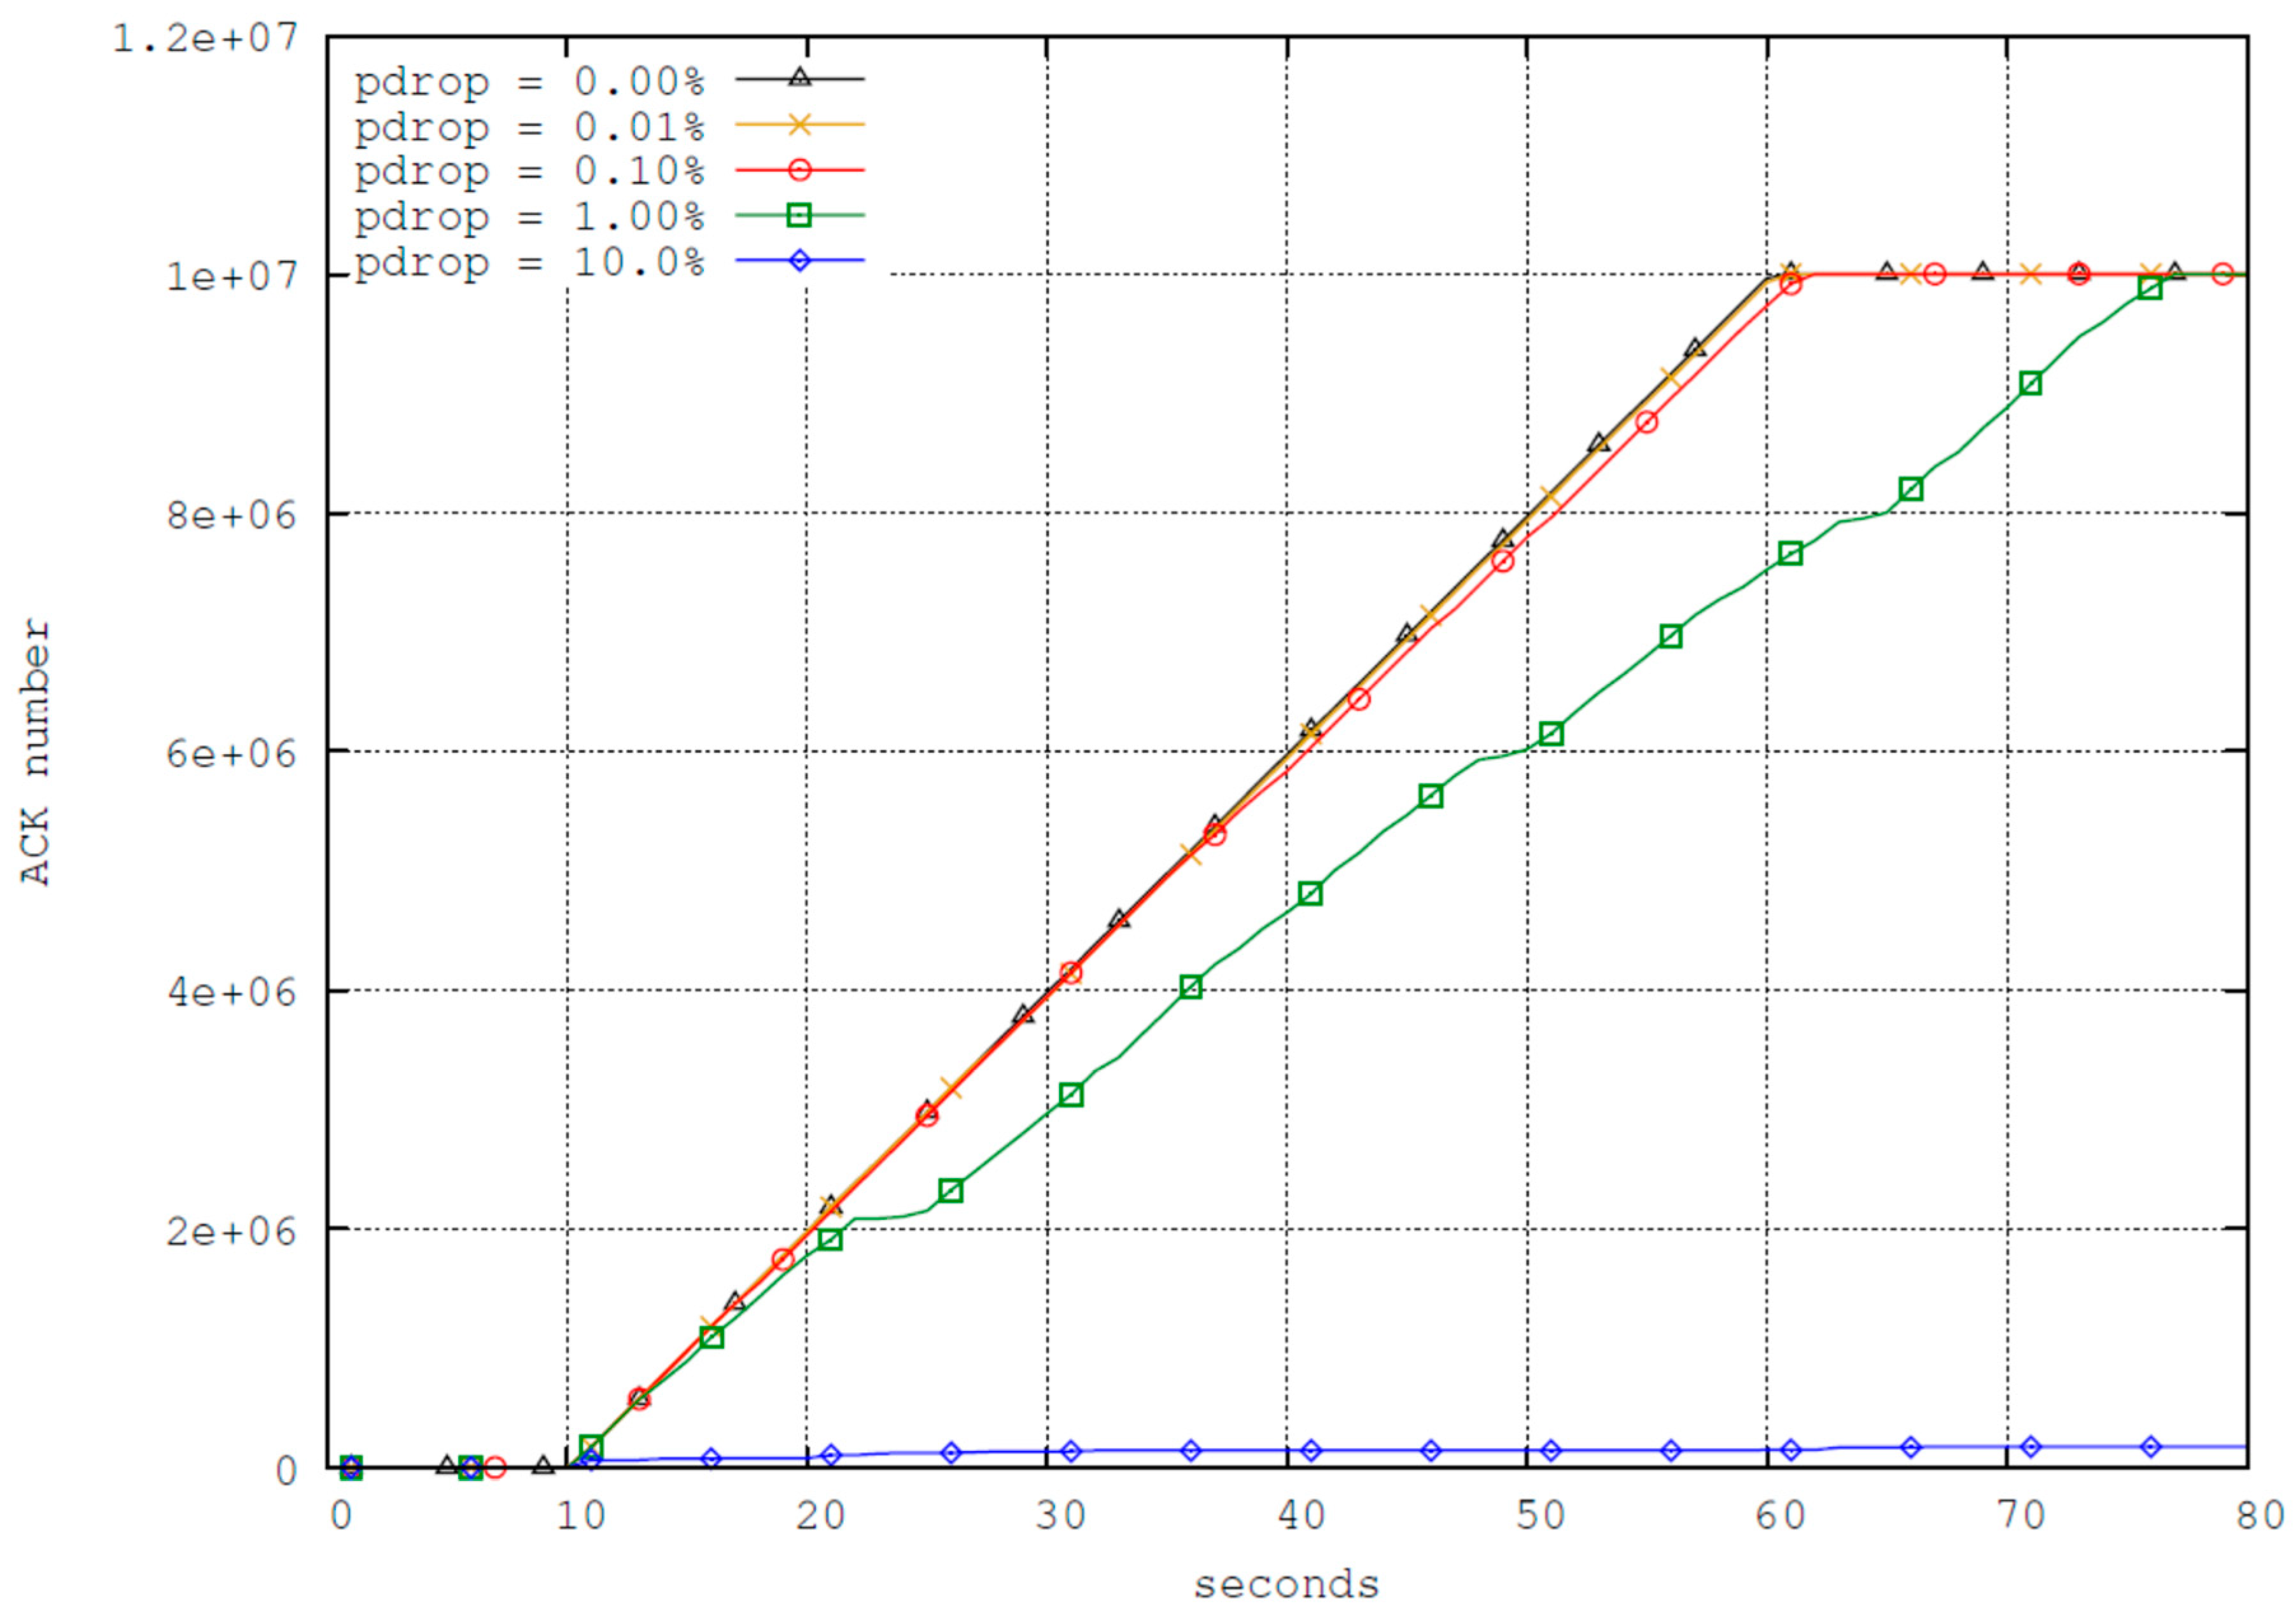
Figure 3 shows that the server is not able to scale-up the congestion window because of the dropped packets. This indicates that the issue is not only related to the number of dropped packets, but it is also an important issue the way TCP handles packet drops and scales down the window.
6. Conclusions and Recommendations
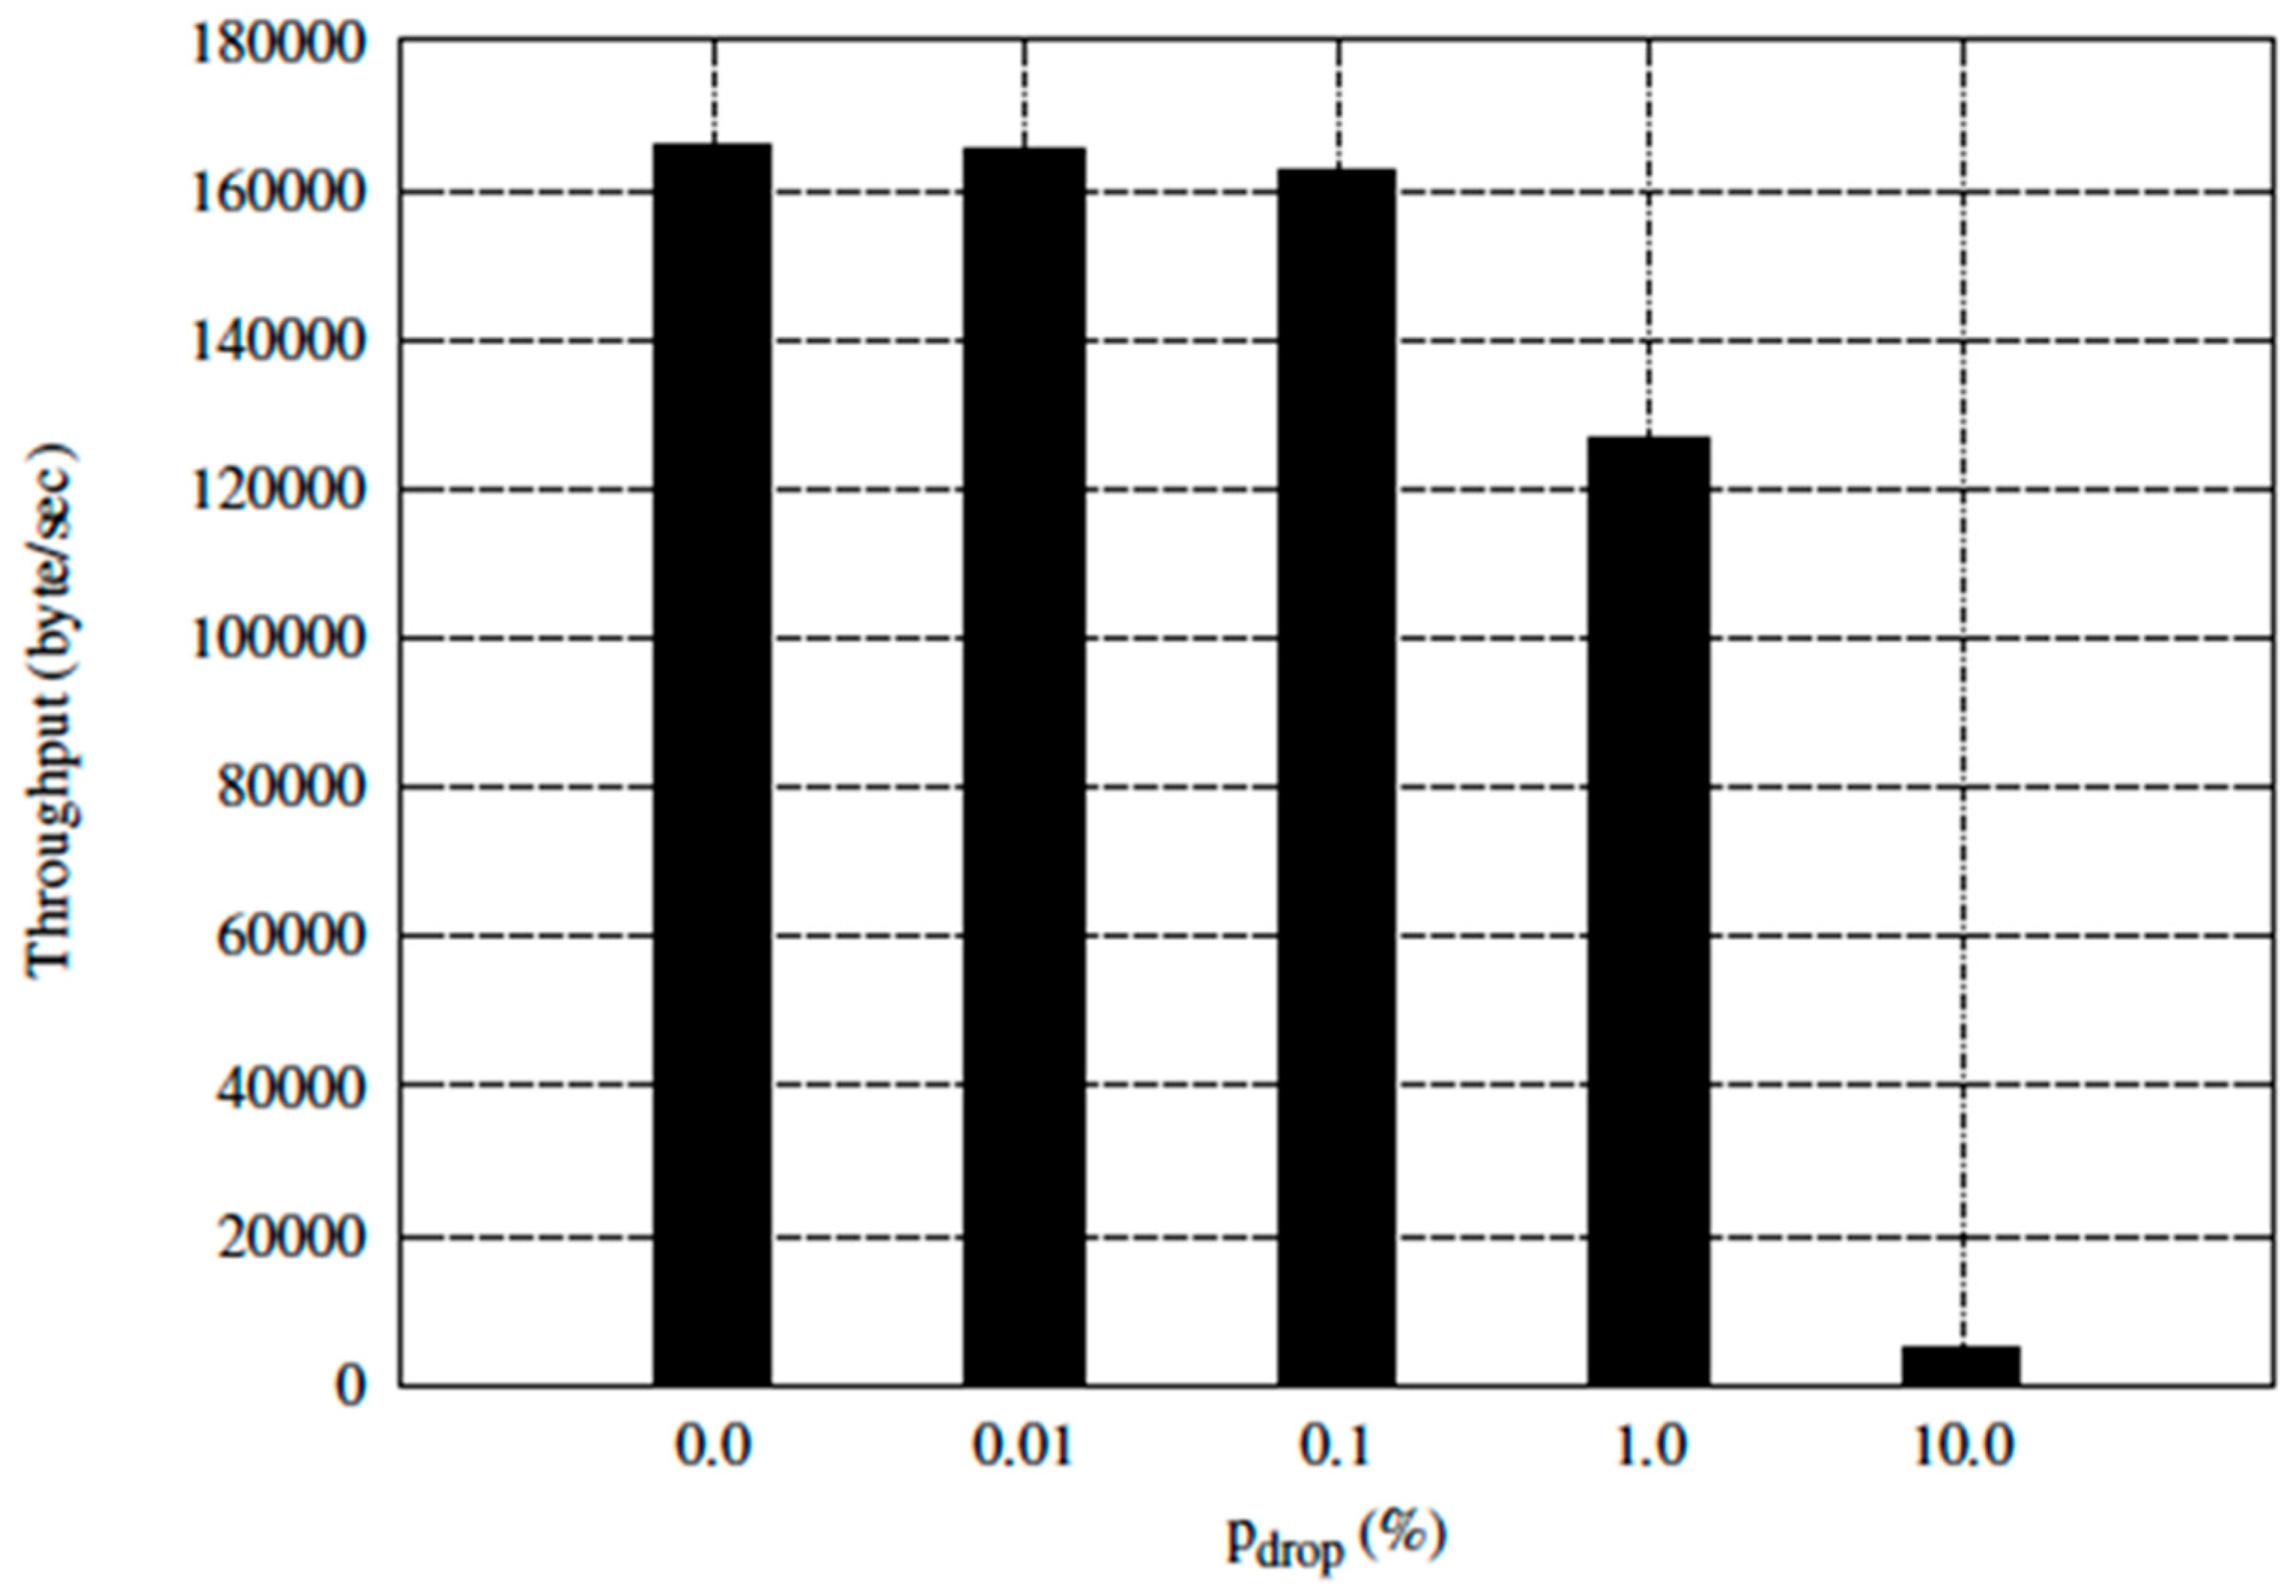
In this paper, we analysed TCP performance in a high bit error rate (BER) using simulation and modelling. Results obtained have shown that TCP throughput collapses for
. The problem is that TCP was not designed to handle such high BER wireless environments. The assumption of the TCP algorithm (fast recovery) is that packet loss caused by damage is very small (much less than 1%) [
47]. Fast recovery algorithm is not good in recovering multiple dropped packets from the same packet streams [
6]. This is because the receiver must wait for the TCP timeout of the sender. The waiting for the timeout brings much higher delays than the fast retransmission algorithm. Therefore, it is no surprise that both the simulation and the emulation show a much longer download time at
than any other scenarios. For instance, FTP download response time is about 32 times longer than that of a perfect channel (no packet dropping). The findings reported in this paper provide some insights into TCP performance in high BER wireless and mobile network environments, which can help network researchers and engineers contribute further towards the development of smart transport layer protocols for the next-generation Internet. However, analyzing TCP performance over the Internet of Things for life-saving emergency applications is suggested as future work.
In this paper, we provide three specific recommendations. Specifically, network researchers and engineers should: (1) avoid the combination of a very high noisy channel (BER > 10−6) and TCP; (2) employ either an optimized TCP or other transport layer protocols for wireless connections; and (3) design a new transport protocol, e.g., Datagram Congestion Control Protocol (DCCP, RFC 4340), or leave the task of a reliable end-to-end connection to the application layer by choosing the User Datagram Protocol. Adopting these recommendations will help network researchers and engineers to produce better TCP performance in practice, especially in wireless environments.


