1. Introduction
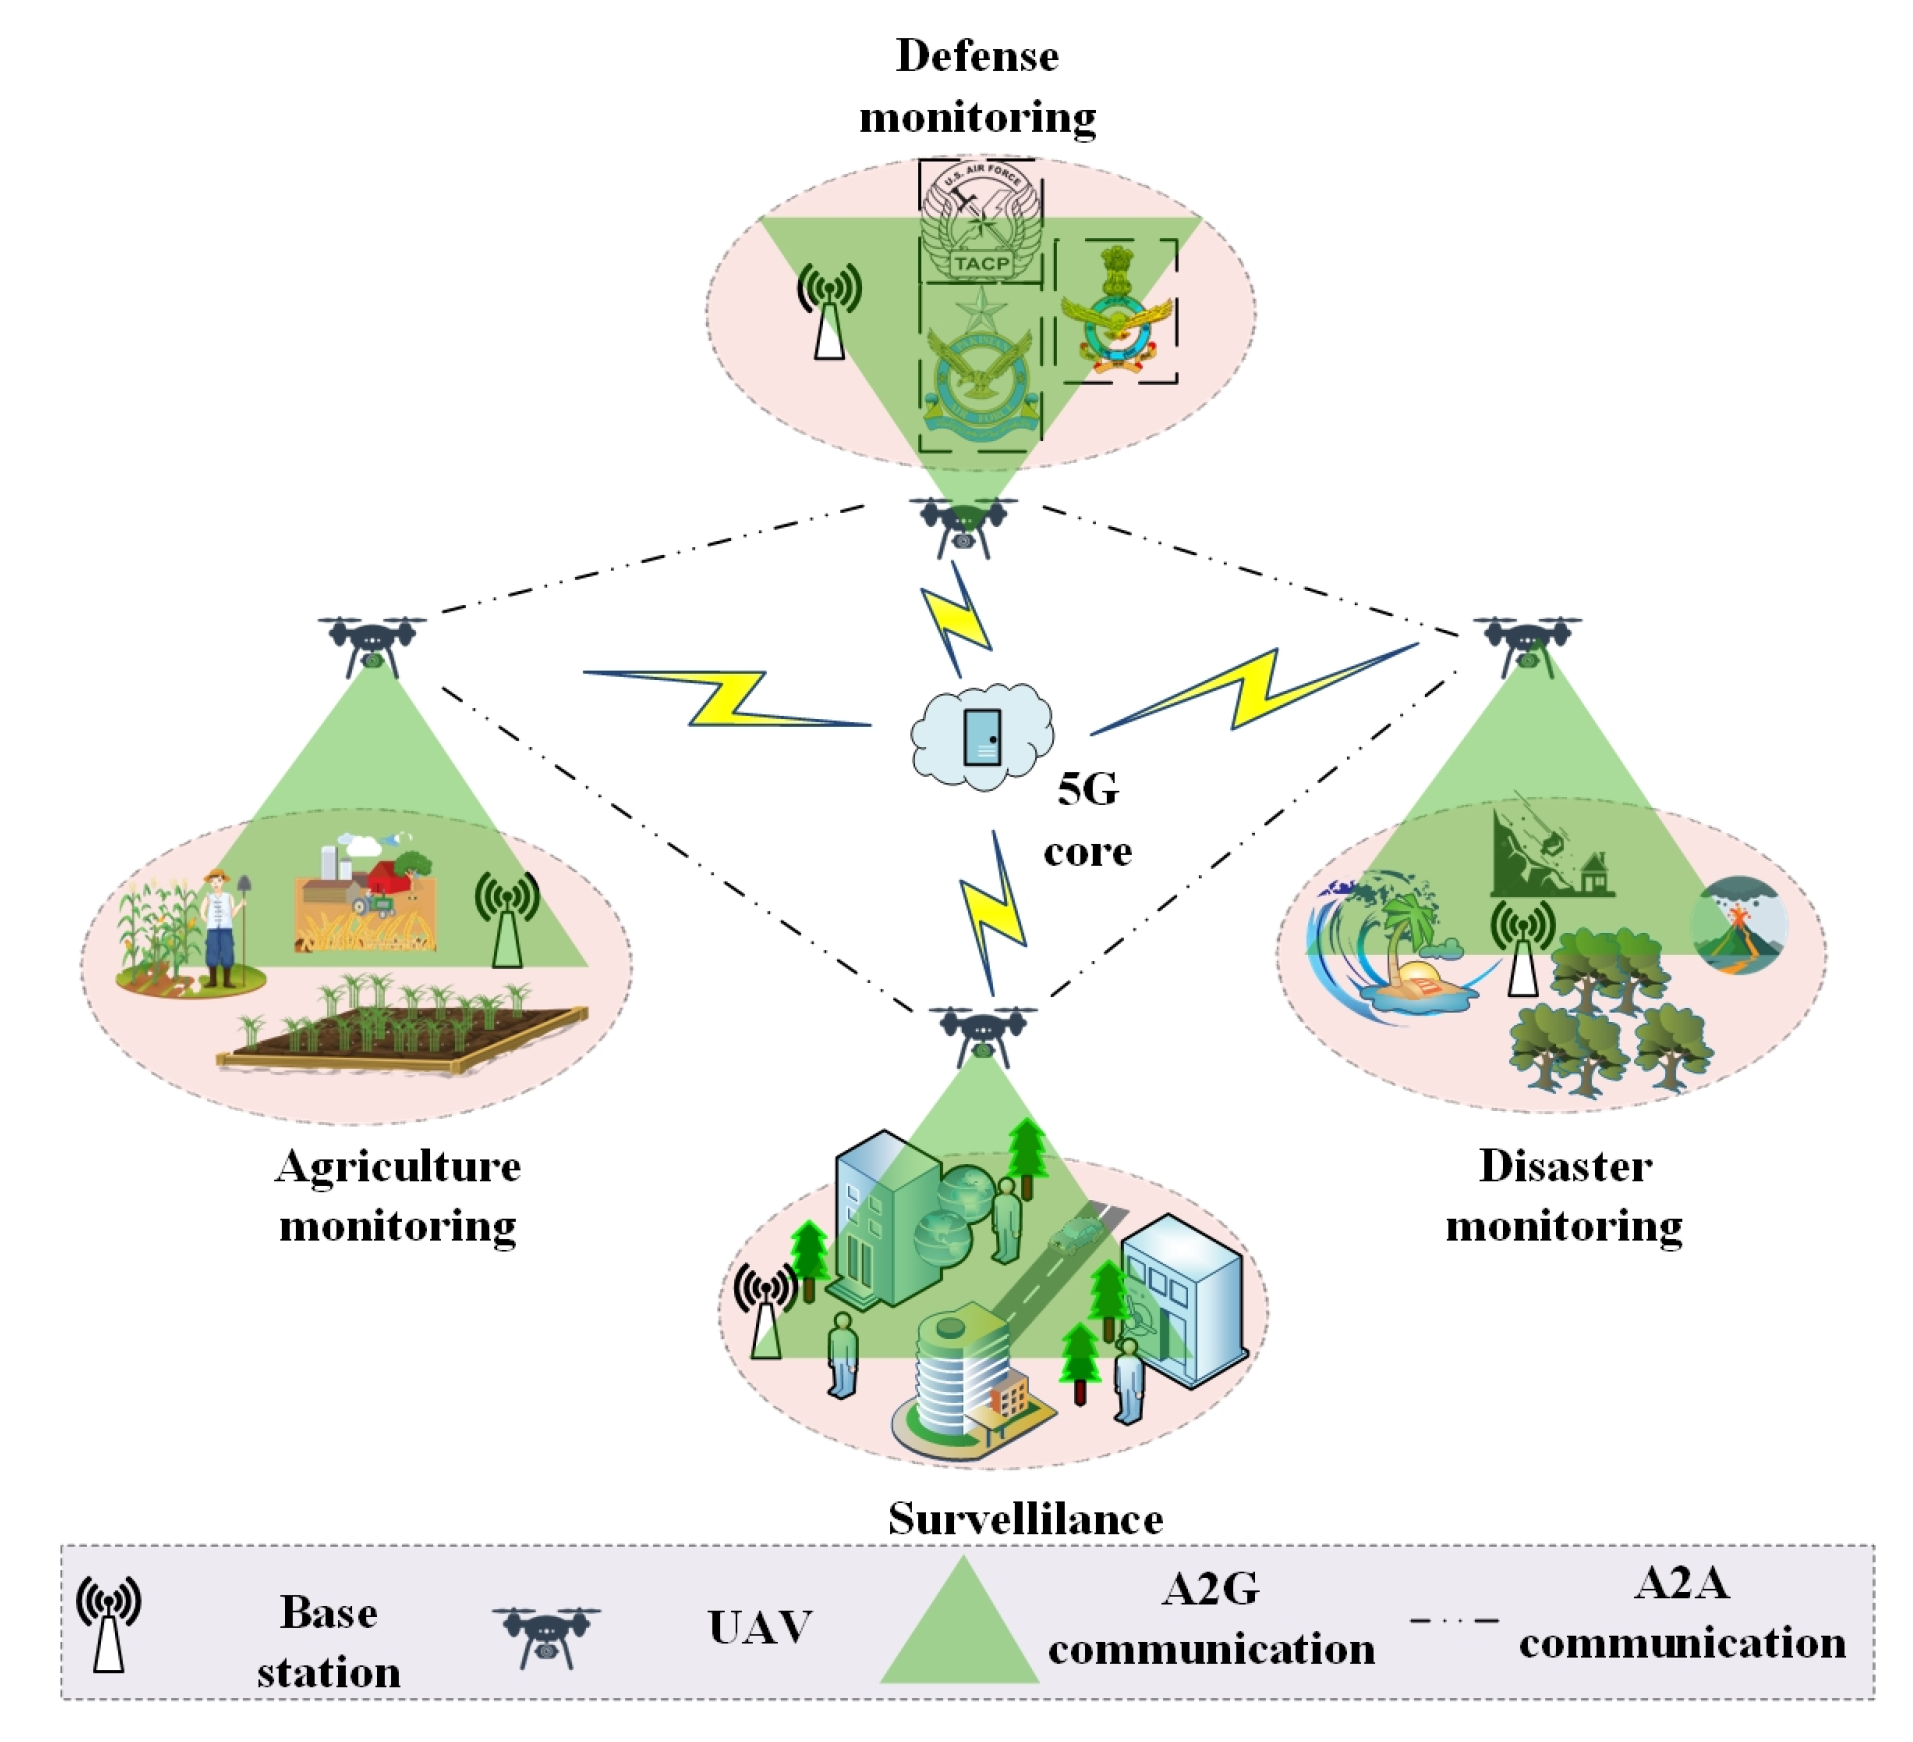
Unmanned aerial vehicles (UAVs) are highly demanding for various applications, such as rescue operations, surveillance, and disaster monitoring. Besides this, UAVs are also used to recover network facilities in the regions of natural disasters, such as forest fires, floods, cyclones, landslides, and manmade disasters, namely power plant explosions and terrorism, which can control emergencies when action is required [
1]. In any area of interest, one or more UAVs are used for monitoring and collecting data from the ground devices equipped in that area. Each UAV has onboard sensors and cameras to collect data from the monitoring area. A UAV’s mission is to collect data from IoT devices in the absence of base stations or when a disaster damages the base stations. Therefore, UAV-based data collection and processing is a worldwide topic among researchers. The UAV collects data in air-to-air (A2A) and air-to-ground (A2G) communications. The base stations are prone to environmental conditions which affect the reliability of A2A and A2G UAV communication [
2]. By utilizing flying base stations, the impact of weather and altitude on A2A and A2G communication is amplified, maximizing their energy consumption [
3,
4]. Less efficient path planning for UAVs leads to serious Quality of Service (QoS) issues, such as packet loss rate and network latency [
5]. There is a lack of consideration for both static and moving obstacles and no differentiation between various emergency events, which reduces the performance and effectiveness of UAV communication [
6].
The 5G-enabled UAV communication reduces the communication latency and bandwidth issues; however, the conventional problems, such as increased energy consumption, are not yet addressed [
7]. Clustering is a promising solution for energy consumption since it increases network scalability, reduces overhead, extends battery life, and boosts the throughput [
8]. The optimal cluster head (CH) is selected for managing different user groups; bypassing the information through CH reduces the network delay [
9]. However, current clustering schemes are required to construct frequently. This is due to the poor grouping of nodes based on limited parameters. In addition, UAVs are clustered without focusing on the vulnerability of the devices and base stations [
10,
11]. Data collection from disaster environments is challenging; using multiple UAVs requires proper positioning and efficient path planning [
12,
13]. However, deploying many UAVs without prior knowledge of traffic demand and event occurrence increases deployment costs. To reduce such drawbacks, relay-based methods and deployment algorithms are used [
14,
15]. Multiple constraints must be evaluated, including weather impact, traffic demand, coverage ratio, and emergency event counts. Based on these factors, the number of UAVs is considered, and is also helpful in planning an optimum path and effective deployment [
16,
17].
In a multi-UAV environment, meteorological conditions must be monitored [
18,
19]; UAV speed, direction, altitude, position, and distance must be adjusted accordingly. On the other hand, dynamic path planning is critical in multi-UAV-served disaster situations to avoid collisions and minimize energy consumption due to random trajectories. The path planning problem is considered an optimization problem [
20], and several optimization algorithms are used to determine the optimal path, such as particle swarm optimization (PSO), genetic algorithm (GA), etc. However, there is still a research gap in UAV positioning and path planning.
1.1. Motivation & Objectives
There is a need for an operational communication network whenever a disaster occurs, and a portion of the existing communication network is destroyed. Therefore, network operators must deploy an emergency communication network to provide connectivity to the ground devices. In this regard, using a mobile network through the deployment of UAVs can be viewed as a potential alternative for emergencies. Due to its dynamic nature and three-dimensional (3D) properties, UAV communication faces multiple challenges. Existing research in the multi-UAV environment has not adequately addressed various positioning and path planning problems. While deploying UAVs, limited parameters are considered in the literature, which is insufficient to perform optimal positioning, path planning, and reliable and energy-efficient communication. Different solutions have been used for the positioning and path planning of UAVs. However, a proper joint technique is still needed for positioning, clustering, and path planning, while considering multiple parameters to ensure optimal QoS, reliability, and energy efficiency in disaster and non-disaster scenarios. The challenges listed below inspired us to conduct this work and fill in the gaps in existing studies.
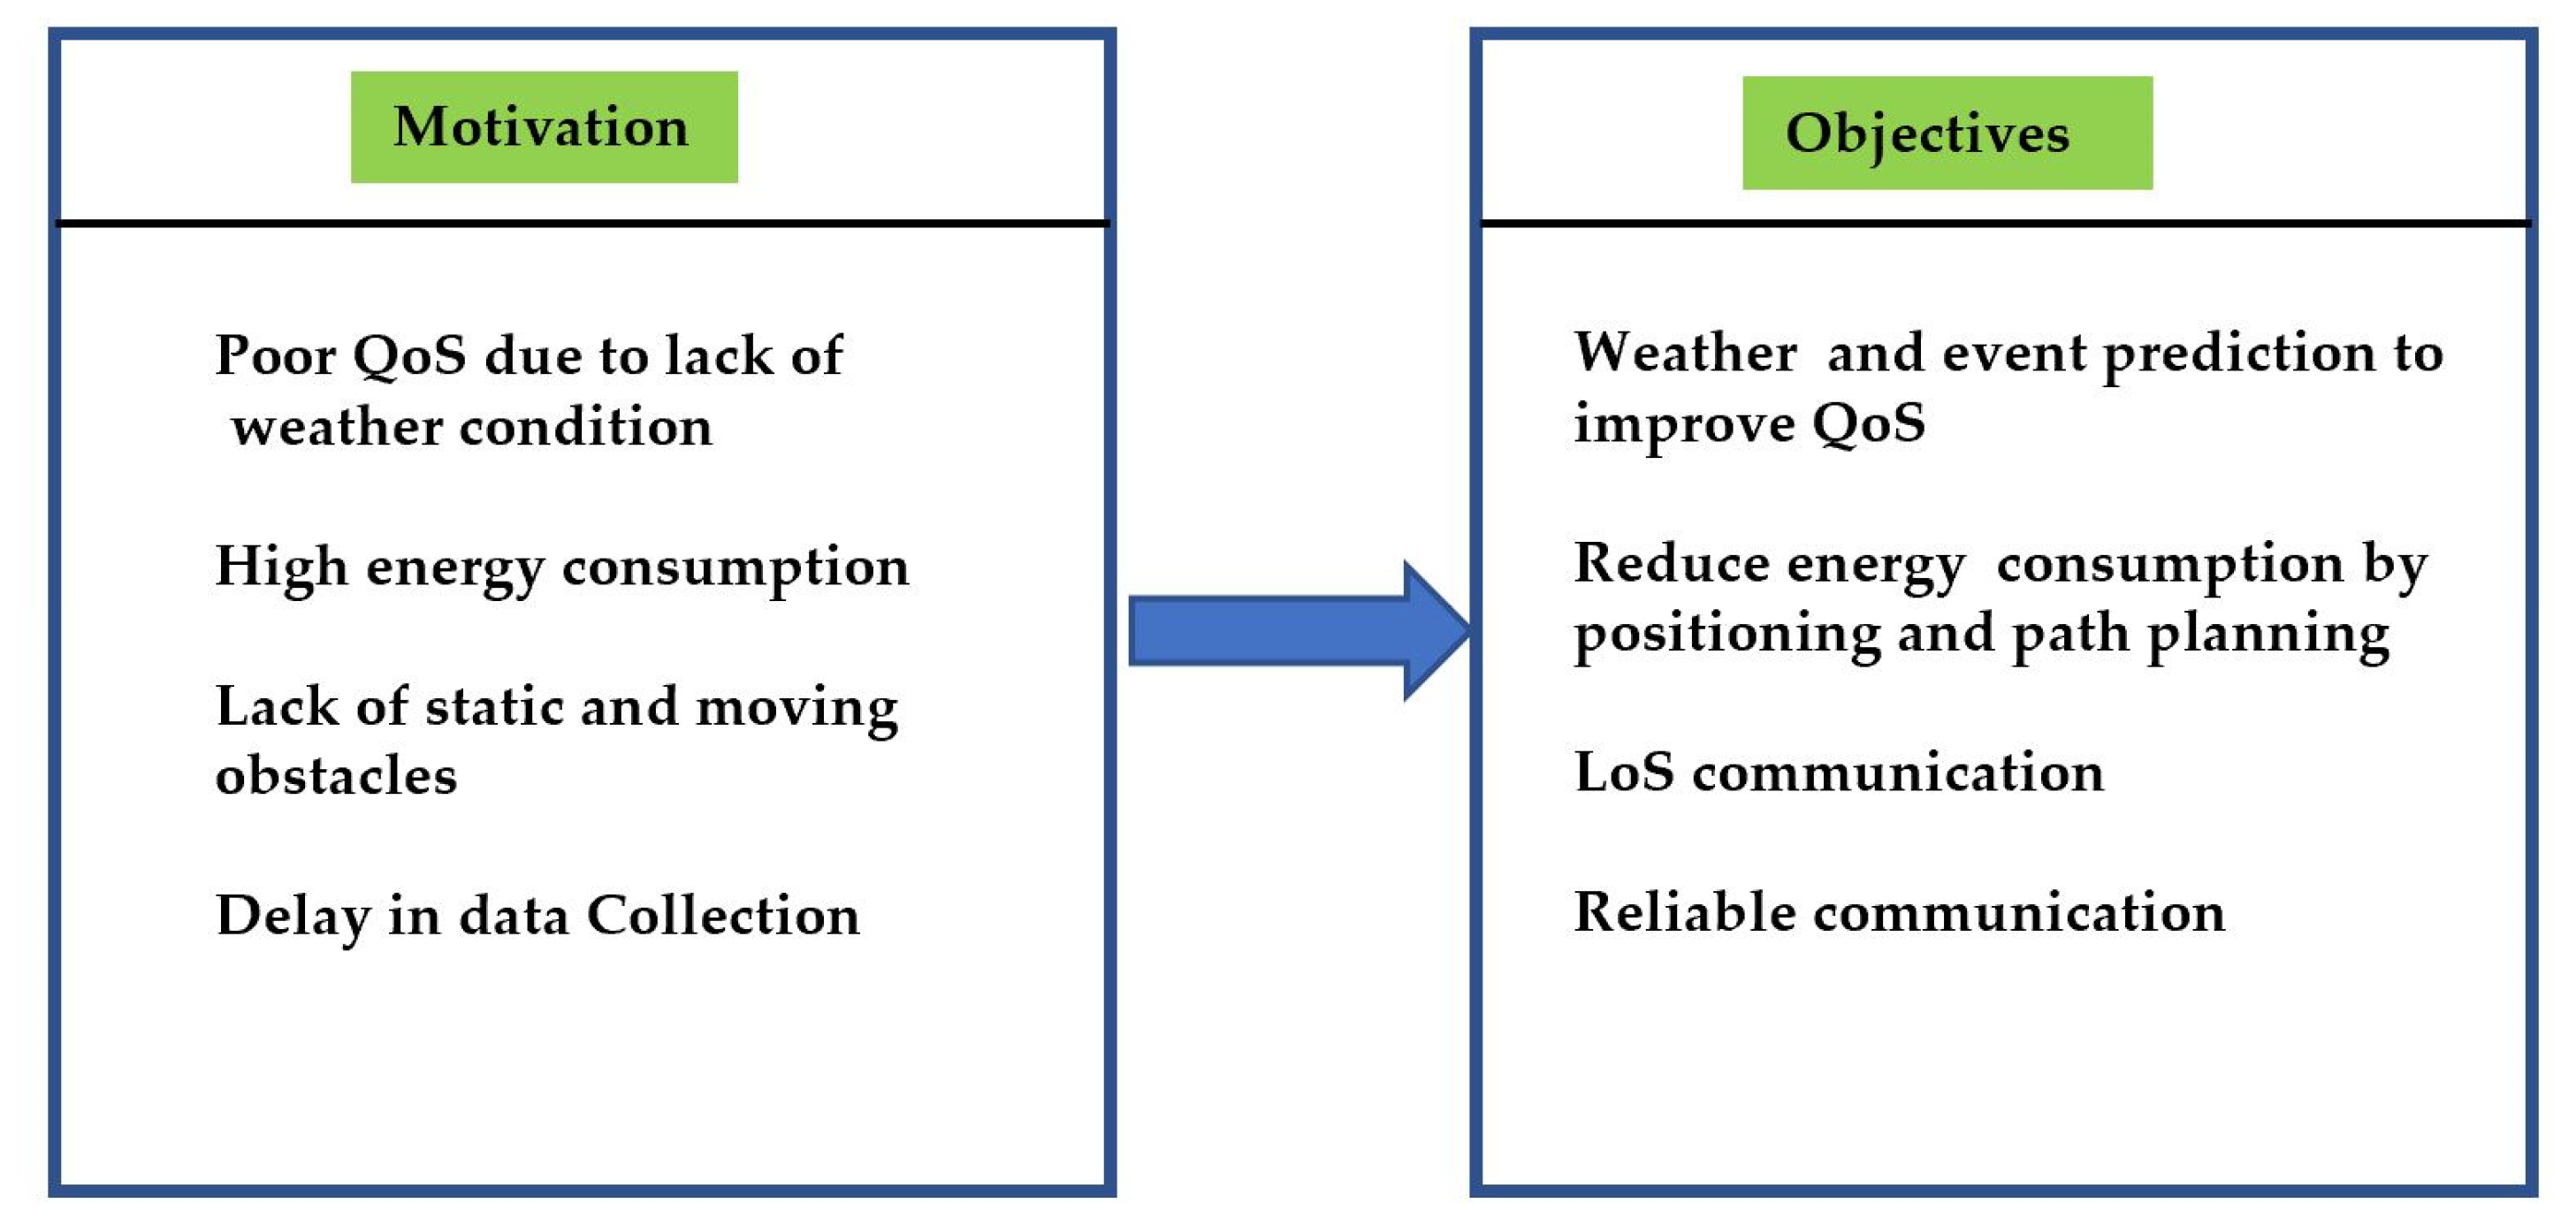
Lack of Weather Conditions—Wind factors, such as direction, speed, velocity, and turbulent flow significantly impact UAV communication. When determining optimal location and path planning, failing to do so will result in poor QoS performance.
Higher UAV Energy Consumption—The UAV is comprised of multiple resource-constrained sensors. UAVs consume energy in data gathering, movements, processing, and transmission. As a result, the issue of energy consumption requires careful consideration to reduce the need for frequent replacement and charging.
Obstacles in Path Planning—One of the challenges is path replanning is due to stationary and mobile obstacles in the network. Without prior knowledge of obstacles, path planning increases the likelihood of a collision between UAVs. Consideration of obstacles also minimizes packet loss and latency during data transfer.
Delay in Disaster Situations—To maximize performance, the latency in data transfer from the source to the UAV must be minimized in disaster scenarios, when data collecting is more susceptible to delay.
This research is motivated by the problems mentioned above encountered by state-of-the-art work. The primary goal of this study is to examine the performance of various UAV communications (A2A and A2G) under weather-suffered disaster scenarios. Path planning and positioning are required for a higher QoS, improved network coverage, and connectivity. These are met by the sub-objectives listed below.
Predicting the absolute weather impacts the selected area of interest based on past weather data, often known as historical weather information.
To maximize the scalability of the UAVs for a large-scale environment in which deployment of multiple UAVs positioning must be optimum.
To maximize the energy efficiency of UAVs and minimize the time of data collection without any packet loss.
To reduce the communication overhead in a multi-UAV environment by optimal path planning and positioning. The diagrammatical representation of motivation and objectives is presented in
Figure 1 for a better understanding.
1.2. Paper Contributions
We propose a dynamic positioning and path planning approach for disaster scenarios in a 5G-assisted muti-UAV environment (Dynamic-UAV), depending on the environmental context. The following are the significant step-by-step contributions of this paper:
Analyzing the context of the environment, the lightweight gated recurrent unit (LGRU) is applied to predict weather conditions (sunny, rain, lightning, cloudy, windy) and events (disaster/non-disaster). Consideration is given to historical weather information and environmental photographs while deploying UAVs for efficient communication.
Once the event and weather conditions are predicted, the density-based optics clustering (DBOC) method is used to cluster IoT devices in both disaster and non-disaster zones to increase the communication reliability between the UAV and devices.
A satellite that uses dynamic positioning-based soft actor-critic (DPSAC) algorithm is considered to estimate the required number of UAVs and dynamically position the UAVs, thereby reducing communication delay and maximizing the throughput and coverage.
The shuffled shepherd optimization with dynamic-window method (SSO-DWM) is used to design UAV paths, which takes into account both static and dynamic objects in the environment to avoid collisions and improve energy efficiency. The performance of the proposed method has been validated and determined to be superior compared to other existing approaches.
1.3. Paper Organization
The remainder of this paper is organized as follows:
Section 2 outlines the fundamentals and different types of UAV communication. This section also provides a synopsis of the literature and relevant work.
Section 3 addresses the problem statement and proposes dynamic UAV positioning and energy-efficient path planning for disaster scenarios in a 5G-assisted multi-UAVs environment.
Section 4 includes the simulation setup and a comparative study of numerous metrics with existing works.
Section 5 explains the application of the proposed approach,
Section 6 provides the summary, and
Section 7 provides the conclusion and future direction of the proposed work.
3. Problem Statement and Proposed Work
The summary presented in
Table 1 shows that most existing approaches performed UAV positioning or path planning. However, the lack of consideration of obstacles makes it hard to achieve their objective. Moreover, the weather conditions in which UAVs travel greatly influence their performance. Our approach addresses these factors to achieve maximum throughput and minimum energy consumption in UAV communication. In our system, the environment is classified into disaster and non-disaster regions after predicting it through the LGRU algorithm. The IoT devices in both areas are clustered based on several factors given in
Section 3.2. The UAVs are responsible for providing services to IoT devices. Let the number of devices present in the environment are
and the number of devices in a single
cluster be denoted as
. The clusters of devices formed do not overlap with other clusters, which can be formulated as,
Let’s write the number of UAVs as
. The flight period of the UAVs can be expressed as
which depends on the mission and battery of the UAV. The location of both devices and UAVs can be formulated as,
where
denotes the latitude and longitude of the devices and UAVs.
denotes the height of the UAV
at time
. The term
influences the coverage of the UAV [
36]; as the height of UAVs increase, the coverage also increases until the UAV reach its optimal location.
can be determined as:
In Equation (4)
denote the coverage radius of the UAV
. The existence of objects in the surroundings affects the channel between the ground devices and UAVs. The probability of Line of Sight (LoS) between UAVs and devices is modeled as a function of
as [
37]:
In Equation (5),
and
denote the constant values influencing the environment,
represents the constant representing the relation between environment and antenna. The LoS probability depends on the elevation angle.
denotes the angle of elevation between the IoT device and the UAV
, which can be formulated as:
where,
denotes the distance between the IoT device and the UAV. The probability of non-line of sight (NLoS) can be computed as [
38]:
The path loss that occurrs in the channel between the device and the UAV can be formulated as [
39]:
In Equation (8),
,
denote the coefficient of attenuations of the LoS and NLoS channel link.
is the path loss in free space.
,
and
denote the carrier frequency, light speed, and path loss exponent, respectively. The throughput of the IoT devices can be formulated as [
37]:
where,
denotes the connectivity between the device
and UAV
. The value of
equals 1 if the device is under the coverage of UAV; otherwise the
will be equal to 0. The last term in Equation (9) is the signal-to-noise and information ratio where
denotes the uplink power of the device,
denotes the power gain of the device,
denotes the interference between the UAV and neighbor cluster, and
is a function of power spectral density. The UAV’s energy consumption is divided into three categories, including energy consumption during motion and data collection. The entire energy consumption can be expressed in the following way:
In Equation (10),
and
denote the time involved in motion and data collection, and
and
denote the power utilized during motion and data collection, respectively. From the above equations, we can formulate the primary problem as follows:
The positioning of the UAVs in the environment is conducted to enhance the coverage of UAVs to maximize the throughput. The multi-objective utility-based maximization of the total sensing information in wireless sensor networks is proposed [
40]. The optimal position is derived by using PSO based on sensing utility, communication path quality utility, and network connectivity utility functions. The positioning of low-altitude UAVs for effective data collection is proposed in [
37]. The observed time difference of arrival time (OTDOA) positioning method was used for device location, with the UAV being positioned in a 2D plan. The following are the primary issues that various techniques face:
The UAV positioning considers only limited parameters, such as location and link quality, which is not enough for optimal positioning. Weather conditions are the essential factors in UAV positioning, which were not considered, thus reducing coverage.
The UAV was assumed to be at a constant height, which is not the case in reality; the channel has several variations, resulting in a coverage reduction.
The number of UAVs needed for adequate data gathering was not calculated, affecting the average data collecting throughput.
The optimal path planning of UAVs is performed by grouping the user equipment into clusters [
36]. The individual communication between UAVs and UEs was terminated, and a CH-based communication was performed. This way of planning the path of UAVs considerably reduced the energy consumption of the UAVs. Time-sensitive data collection by planning UAV trajectory and resource allocation is executed to maximize the number of served IoT devices [
41]. The game theory-based selection of UAVs and the reinforcement-based path planning optimization achieve minimum path loss [
42]. The significant problems involved in these approaches are:
The UAV trajectory is affected by many weather conditions, but they only focus on wind speed, leading to poor trajectory planning, thus increasing path loss [
36].
The planning only considers wind characteristics and the length of the path. However, the performance of this method is affected by the fact that obstacles in the environment. Furthermore, the UAV’s energy consumption was not taken into account [
42].
The trajectory planning was conducted only on the basis of distance, which is insufficient for picking an ideal path; the weather is one of the most important aspects impacting UAV trajectory, and it was overlooked, resulting in poor trajectory planning and higher energy consumption [
41].
The proposed approach overcomes all the problems mentioned above by performing the following processes; initially, the prediction of weather conditions and recognition of disaster regions are achieved by using the LGRU model. Significant features, such as wind characteristics and temperature parameters, are utilized. The clustering of IoT devices is performed in which the devices in disaster and non-disaster regions are grouped based on density. This eventually optimizes the communication between the devices and UAVs. The satellite is in charge of locating UAVs in 3D space, determining the number of UAVs to be deployed, and positioning them using the DPSAC algorithm. Further, the energy consumption of the UAVs is minimized by planning their path. Considering obstacles in the environment makes it more realistic that our approach would be be adopted. The path loss is also reduced by utilizing the dynamic window model.
The proposed work mainly focuses on performing the dynamic positioning and path planning in a 5G-assisted multi-UAV environment. The proposed Dynamic-UAV approach comprises entities, such as IoT devices, UAVs, 5G GBS, and a satellite.
Figure 3 depicts the overall architecture of the proposed approach. The processes involved in the proposed Dynamic-UAV approach are given below.
3.1. Events/Weather Prediction
The weather influences the position and communication channel of UAVs. Mainly the wind characteristics, such as wind direction
, speed
velocity
and turbulent flow
mostly affect the UAV communication. Lightning and heavy rain are also the factors that limit UAV communication. Hence, we need to predict weather conditions for UAV communication. Let
=
where
represents the wind characteristics. For instance, if there are extreme weather conditions, such as lightning, cyclones, etc., UAV communication may be impossible, or it may cause physical damage to the UAVs, so it must be predicted to achieve better communication and avoid those damages. The events are predicted using historical information, which helps improve UAVs’ communication efficiency. Based on the historical data, we predict the disaster regions from the UAV image by using a satellite. For example, if the image consists of collapsed buildings, then the event is known as an earthquake, and if the image has active flames or smoke, it is known as a fire accident. Prior knowledge of these weather conditions is very important for efficient communication. This historical information is used for predicting the disaster region, thus helping to give priority compared to the other areas. For this reason, we proposed the LGRU algorithm that contains an update gate and a reset gate. The update gate (
) controls the iteration range of previous information state to current information state. The reset gate (
) controls the overload of information state from the
. For weather prediction, the wind characteristics
are used respectively, which are updated periodically to the UAV.
The above equations represent the weather prediction formulas using LGRU. Equation (13) represents the gate update output (
) which acquires the current input (CI) as
,
and previously hidden state information (Ph) as
,
that forms a weighted matrix function of the gate update (
) using activation function (ꭘ). Equation (14) shows the gate reset output (
) which controls the state information from
and forms a weighted matrix of gate reset
using ꭘ. Equation (15) shows the contestant hidden state, which combines the previous information with current information (
) that forms a weighted matrix function of the hidden state
using activation function (þ), and finally, all the state information is combined to give a predicted result. Equation (16) shows the hidden state (
) which combines the processed results and gives predicted results which can be formulated as:
Let the past images
and
denotes the weather. For event predictions, the past images are required for predicting the accurate event in the present, which can be formulated as:
The above equations represent the event prediction using past images
of an earthquake
, fire
, tsunami
and battle region
. With these past images, LGRU predicts the accurate event in the present
which can be formulated as:
Algorithm 1 and
Figure 4 represent the working of LGRU in weather and event predictions, respectively. In Algorithm 1 we used the cost function
, which holds the set of all parameters.
is updated for every prediction based on the environmental condition. The performance is evaluated using this function. Cost function required constant minimization. The model’s performance improves with minimization in the cost function. In the case of accurate prediction, its value becomes zero. By using LGRU, we perform event prediction using images from past events and weather prediction with weather characteristic parameters, such as temperature (
), wind speed and direction (
), humidity (
), dew point (
), pressure (
), time (
), and precipitation time (
). The above measurements are considered for effective positioning, optimal path planning, and ensuring the safety of the UAVs.
Table 2 represents the weather reports predicted by the proposed LGRU algorithm for 24 h.
| Algorithm 1 LGRU-based weather and event prediction. |
| 1. Input |
| 2. Output, |
| 3. Begin |
| 4. While, do |
| 5. For each time slot, do |
| 6. Update // to UAV |
| 7. Compute // using (13) |
| 8. Compute // using (14) |
| 9. Calculate // bitwise multiplication using (15) |
| 10. // bitwise multiplication using (16) |
| 11. // using (17) |
| 12. End |
| 13. For each time slot, do |
| 14. Update // to UAV |
| 15. Compute // using (18) |
| 16. Compute // using (19) |
| 17. Calculate // bitwise multiplication using (20) |
| 18. Calculate // bitwise multiplication using (21) |
| 19. Compute // using (22) |
| 20. End |
| 21. Stop |
| 22. End |
3.2. Event Aware Clustering
After predicting the weather conditions, a clustering of IoT devices is performed to increase communication reliability. Based on the past event information, the environment is clustered in two regions: disaster and non-disaster. The regions are clustered into the disaster region and non-disaster region. Each area has multiple clusters. Each cluster has various IoT devices that send the data to the UAV via the
. For clustering, we consider the parameters
) of density
distance
and the number of users
). Let us consider,
. The DBOC algorithm performs the clustering process. For example, in case of any natural or manmade disasters, the base stations which sends the information to the authorities are affected; at that time, the IoT devices, such as sensors, actuators, etc., forms a cluster as a disaster and non-disaster region and sends data via the CH. The cluster formation can be formulated as:
Equation (23) represents the minimum points
that are closely related to IoT devices in disaster and non-disaster regions. The
represents the
and maximum radius
for forming clusters between the IoT objects. The DBOC algorithm first calculates the main distance (
) of the untreated IoT devices (UN) in the regions.
represents the untreated IoT device in the disaster area, which must be less than or equal to the
,
represents the untreated IoT device in the non-disaster areas, and if all the IoT devices are treated, then the
are calculated in disaster and non-disaster regions. After calculating the
of the IoT devices, the distance reachability (
is calculated for the devices to form clusters which can be formulated as:
Equation (24) represents the distance reachability (
) for the untreated IoT devices from disaster and non-disaster regions. Afterwards, all the IoT devices compute
and
, and a list of a clusters is formed as disaster and non-disaster regions. The final clustered output is formulated as:
Equation (25) represents clusters output
at the disaster
and non-disaster
region based on the maximum radius
and minimum points
. The clustering method reduces the complexity and energy of UAV communication. As CH sends the data to UAV hence, we need to select optimal CH; for that, we consider energy and centrality that can be formulated as:
Equation (26) shows the optimal CH selection from clustered IoT devices (
) in
for sending data to UAV. Centrality is the frequency of cluster nodes located on the shortest path between other cluster nodes. Energy is the capacity of cluster nodes to withstand other cluster nodes in the surrounding environment. Algorithm 2 and
Figure 5 represent the working of DBOC in events-aware clustering.
| Algorithm 2 Events-aware Clustering. |
| 1. Input |
| 2. Output |
| 3. Begin to obtain information form , |
| 4. For (cluster formation), do |
| 5. Compute // using (23) |
| 6. Compute // using (24) |
| 7. Elect // using (25) |
| 8. Compute // using (26) |
| 9. End |
| 10. End |
3.3. Multi-UAV Dynamic Positioning
The effective positioning of UAVs is performed after the clusters of IoT devices are generated by DBOC in a disaster region, which improves communication and provides adequate coverage during an emergency. Many variables influence UAV placement, including altitude, weather conditions, speed, and the existence of obstacles that obstruct communication between IoT devices and UAVs. During an emergency, the satellite is responsible for deploying the appropriate number of UAVs depending on traffic demand. In our proposed work, the UAV acts as an edge server that collects the data from the IoT devices and takes action based on that data. In the proposed Dynamic-UAV approach, the DPSAC algorithm is utilized. The goal of the DPSAC algorithm is to identify the optimal policy. The combination of policy and value-based approaches maximizes the long-term reward. The UAV positioning is constructed as a Markov Decision Process (MDP) with state attributes (ς) which are predicted weather conditions, coverage area, user density, delay sensitivity, elevation angle, path loss, and LoS/NLoS characteristics. The reason for adopting MDP is to allow sequential decision-making, and it gives optimal results for partially known environments. An MDP is comprised of state, action, transition probabilities, and reward. The DPSAC algorithm aims to identify the optimal policy and maximize the reward to determine the optimal position and number of UAVs. The combination of policy and value-based approaches maximizes the long-term reward. The position of UAVs in the proposed approach is constructed with state attributes that are predicted weather conditions, coverage area, path loss, angle of elevation, and LoS/NLoS characteristics. The state parameters for UAV number determination are delay sensitivity and density of users. The action set consists of two major actions: UAV count determination and positioning. Latency increases without determining the number of UAVs, which impacts the throughput. The coverage enhances while increasing the height of the UAVs from the ground. On the other side, path loss also occurs by increasing the height of UAVs, which creates interference, eventually influencing the throughput. Optimal positioning also improves the QoS in UAV communication. There is an impact on throughput by taking actions (position and number of UAVs to be deployed) in the environment, so it must be optimized to maximize the reward. The MDP tuple is given as []. The state, reward, and transitions are based on real-time interactions with environmental attributes. From the tuple, denotes the epochs, which range from , denotes the state, and denotes the action set consisting of two major actions discussed above. The actions are dynamically executed based on the current situation (disaster or non-disaster). The reward is generated based on the action value function to maximize the throughput. The DPSAC algorithm increases the reward from the agent’s interaction with the environment. DPSAC uses soft policy iteration to reach this goal. Soft policy iteration is evaluating the policy and making it optimal to maximize the reward. The denotes the transition probability as , and the discount factor is denoted by , and is set between 0 and 1. The discount factor determines the agent’s care about the reward in the long term compared to those in the near future. When the discount factor is 0, the agent only cares about the immediate reward. When the discount factor is 1, the agent cares about the future reward, and the rewards can increase based on the interpretation of the discounting factor. For every given state and action, the reward can be provided based on adding immediate and future rewards. DPSAC consists of three networks. The first network represents state value, the second network represents policy function, and the third is the soft Q function derived in this section. The policy and Q-network are updated by collecting data from the policy that is different from the current policy. The transition of data is stored in a replay buffer for each roll-out of actor, which is denoted by (D) in Equation (27). The state value function is denoted as .
The soft Q function is denoted as
which is trained as formulated below:
A separate approximation function
is utilized to minimize the squared residual error. The gradient function is estimated for the parameter updation, which is formulated as:
The optimization of the soft Q function is carried out by using the stochastic gradient function, which is computed as:
The optimal policy of positioning the UAV is achieved by learning the parameter policy, which is computed as:
By doing so, the positioning of the UAV is achieved optimally amidst several challenging factors.
Figure 6 illustrates the positioning of UAVs. The pseudocode for DPSAC-based optimal positioning of the UAV is given in Algorithm 3.
| Algorithm 3 DPSAC-based UAV positioning. |
| 1. Input: State attributes |
| 2. Output: Number determination and positioning of UAVs |
| 3. Begin |
| 4. Parameter initialization ( |
| 5. For each episode, do |
| 6. Set initial state |
| 7. For each time step, do |
| 8. Perform action from the policy |
| 9. Move to the next state |
| 10. Generate reward based on |
| 11. Store in the replay buffer |
| 12. End for |
| 13. For each gradient step, do |
| 14.
|
| 15.
|
| 16.
|
| 17.
|
| 18. End for |
| 19. End for |
| 20. End |
3.4. Energy-Efficient Path Planning
Path planning for UAVs is a crucial part of successful communication. After the UAVs have been dynamically positioned, the optimal path is planned in order to reduce their energy consumption. Many elements, such as wind conditions and limited availability of energy, influence UAV path planning. We propose a hybrid algorithm named SSO-DWM for path planning, which learns the obstacles’ mobility and dynamically changes the path. This process performs UAV path planning to maximize coverage capacity and reduce path loss. For that, we consider the parameters of wind characteristics
, LoS/NLoS, energy
, static and moving obstacles, distance
and optimality
. et,
. Initial evaluation of all alternative pathways and trajectories enables the UAV to determine the best path, which can be expressed as:
Equation (31) represents the evaluation of the UAV path by using path parameters (
).
denotes the first selected path and
denotes the second selected path for the UAV to find an optimal path (
).
, Ϥ are used for the iteration process, which can be set to zero at the time of the searching process.
denotes the random number which states the UAV time interval [
] while
. It depends on the UAV battery and mission. The flight time is the time taken by a UAV during motion and communication with IoT devices. The first path selected (
) is the best path, and no path is more optimal than itself, so
is ‘0’, and the second path selected (
) is the worse than any of the paths, so the second path
is also ‘0’. Therefore, an increase in
and a decrease in Ϥ improves the manipulation of the algorithm and reduces the investigation, which can be formulated as:
The above two equations represent the manipulation of the algorithm for finding the optimal path using the SSO optimization algorithm with parameters
. Another set of parameters is also considered, such as
and
, which are used for detecting the static and moving obstacles which can be formulated as:
Equation (34) represents the evaluation of the UAV path by using parameters (
). The
head (
) is used to calculate the angle between the direction of the current position, speed, and simulated trajectory direction. The angle of deviation must be more significant for a smaller value of
head (
).
Sep (
) represents the distance between simulated vector velocity (SV (
)) and trajectory. The overall value of
must be smaller to reduce the collision with obstacles. Ю,
,
,
denotes the weighted value co-efficient. Using DWM, obstacles in the path are detected, reducing the total energy consumption. The overall optimal path is formulated as:
The energy consumption and path loss are reduced by using this approach. The effective path planning approach is depicted in
Figure 7, in which the UAV optimally selects paths and detects obstacles using the proposed SSO-DWM. The proposed approach reduces path cost (1–4) and energy consumption compared to traditional UAV path planning. Traditional approaches detect the obstacles but have a high path cost, resulting in higher energy consumption. Algorithm 4 depicts the steps of SSO-DWM for energy-efficient path planning.
| Algorithm 4 Energy-efficient path planning. |
| 1. Input, |
| 2. Output |
| 3. Begin to Evaluate the path |
| 4. while criteria for stopping not met (, do |
| 5. For each UAV |
| 6. Evaluate path // using (31) |
| 7. Manipulate path // using (32) & (33) |
| 10. End |
| 11. For each UAV |
| 12. Evaluate obstacles // using (34) |
| 13. End |
| 14. Compute// using (35) |
| 15. End while |
| 16. End |
4. Simulation Setup, Comparative Analysis, and Experimental Results
The Dynamic-UAV technique is simulated using the NS 3.26 simulator [
43].
Table 3 shows the hardware and software required to mimic our technique accurately. IoT devices, ground base stations, UAVs, and a satellite are all part of the network model. The prediction of weather conditions is performed first, followed by the prediction of the event. The placement and route planning of the UAVs is then performed to enhance the throughput and energy efficiency. The simulation parameters needed to execute the proposed technique are shown in
Table 4.
The Dynamic-UAV technique is experimentally analyzed. QoS, reliability, and energy efficiency are evaluated using the proposed method. This section comprises a simulation setup, comparative analysis, and summary. The proposed Dynamic-UAV approach is validated and compared to that of previously published studies, such as EIC-UAV [
36], PSO-UAV [
40], and DC-UAV [
41], in terms of QoS (throughput (bps/Hz)), PDR, delay (ms)) reliability (coverage probability and the number of collected packets), and energy efficiency (KJ).
4.1. QoS Analysis
QoS is the measurement of overall network performance. The analysis of QoS is performed in terms of throughput, PDR, and delay.
4.1.1. Throughput Comparison
The amount of information transferred in a certain period is known as throughput. High throughput is essential for an effective communication system.
Figure 8 represents the throughput achieved with an increasing number of UAVs, compared with existing approaches. As the number of UAVs increases, so does throughput, proving that the proposed Dynamic-UAV approach achieves a high throughput rate in comparison to existing works. This is because of weather prediction, multi-UAV placement, and events-aware clustering performed in the proposed Dynamic-UAV approach. The LGRU algorithm separates disaster and non-disaster regions. Then, the DBOC algorithm clusters the IoT devices to reduce complexity and energy consumption during the communication of UAVs with ground devices. DPSAC is used to determine the optimal number of UAVs to be deployed in disaster and non-disaster regions and then provides optimal positioning based on those numbers to increase the reliability of communications. Compared to the proposed Dynamic-UAV approach, the location of the UAV is fixed at a constant altitude in the DC-UAV approach [
41], which reduces the throughput and increases communication complexity between UAVs and IoT devices. In PSO-UAV, the impact of weather conditions on UAV positioning is not addressed, which reduces the throughput performance [
40]. The EIC-UAV approach only considers windspeed while other parameters considered in our approach are not taken into account; thus, it also increases the data loss, resulting in low throughput performance [
36].
With 10 UAVs, the proposed Dynamic-UAV approach achieves a throughput of 2 bit/s, while the existing work EIC-UAV, PSO-UAV, and DC-UAV achieve 1.6 bit/s, 1.16 bit/s, and 0.8 bit/s, respectively. Compared to the existing approaches, the proposed work has a throughput rate of 1.593 bit/s on average, where the average throughput rate is 1.233 bit/s in EIC-UAV, 0.86 bit/s in PSO-UAV, and 0.64 bit/s in DC-UAV.
4.1.2. PDR Comparison
PDR is the ratio of packets successfully delivered to the destination compared to the total number of packets transmitted by the sender.
Figure 9 compares PDR with the number of UAVs to existing works. The PDR increases with the number of UAVs, as illustrated in
Figure 9. The proposed Dynamic-UAV method achieves a high PDR in comparison to the previous works. Event-aware clustering is utilized to boost the PDR in the proposed Dynamic-UAV approach. In PSO-UAV, the information from all the devices is collected randomly by UAVs, thus increasing communication complexity and decreasing the PDR. The PDR is lower due to the unaddressed impact of weather conditions in the EIC-UAV approach. The DC-UAV approach leads to a lower PDR due to the fixed altitude of the UAV, channel fluctuations, and inability to adjust its position dynamically.
When the number of UAVs increases to 10, the proposed Dynamic-UAV approach achieves a PDR of 0.95. In contrast, the state-of-the-art approaches DC-UAV, PSO-UAV, and EIC-UAV earn PDRs of 0.79, 0.8, and 0.85, respectively. The average PDR of the proposed work is 0.88. In terms of PDR, the numerical results depicted in
Figure 9 reflect the effectiveness of the proposed method.
4.1.3. Delay Comparison
Delay is the time taken by a packet from the source IoT device to its destination. It is formulated as follows:
where
represents the delay,
denotes the packet transmission time, and
shows the actual transmission time.
Figure 10 depicts the delay as the number of IoT devices increases. The proposed Dynamic-UAV transmits packets from source to destination with a shorter delay than the existing approaches. It is due to proper clustering using the DBOC algorithm, which clusters the IoT devices in disaster and non-disaster regions and selects the optimal CH based on energy and centrality. The existing EIC-UAV approach used shift algorithm for clustering ground devices in which a detailed explanation of centroid selection is not present. In the PSO-UAV approach, the UAV tries to collect information from all the sensors, which increases the delay when the number of sensors increases. Due to the fixed altitude, the DC-UAV approach encounters path loss; hence, the delay increases when the number of IoT devices increases.
When we increased the number of IoT devices to 100, Dynamic-UAV encountered a 35 ms delay in packet transmission. In contrast, the DC-UAV, PSO-UAV, and EIC-UAV approaches encounter delays of 150 ms, 120 ms, and 130 ms, respectively. The average delay in the proposed work is 18.5 ms for the number of IoT devices, which is less than the existing approaches.
Figure 11 depicts the delay experienced during packet transmission as the number of UAVs increases. The length of delay increases with the number of UAVs. The proposed approach outperforms the existing schemes due to multi-UAV positioning in terms of delay. UAVs are effectively positioned using the DPSAC algorithm, which optimally determines the number of UAVs required for a specific area while minimizing communication delays between UAVs and IoT devices. The EIC-UAV approach is inefficient when the number of UAVs increases because of the absence of centroid during the clustering of ground devices. In PSO-UAV, the algorithm falls into local minima for an increasing number of UAVs, due to which the delay also increases, whereas the number of UAV increases the DC-UAV encounters high delay because of its fixed altitude.
When the number of UAVs is increased to 10, the proposed Dynamic-UAV approach has a delay of 33 ms. On the other hand, DC-UAV, PSO-UAV, and EIC-UAV have delays of 130, 104, and 81 milliseconds, respectively. Our system experiences an average delay of 16.4 ms, validating its effectiveness. The average performance of each QoS metric is displayed in
Table 5.
4.2. Reliability Analysis
Reliability is the measure of the successful delivery of data packets without loss. The proposed reliability analysis is compared in terms of coverage probability and a number of collected data packets.
4.2.1. Coverage Probability Comparison
The coverage probability is defined as the distance that UAVs cover as their altitude increases.
Figure 12 depicts the coverage probability of the proposed Dynamic-UAV technique relative to the UAV’s height, compared to the existing approaches.
In
Figure 12, it is demonstrated that as the altitude of UAVs increases, so does the likelihood of coverage. Since the DPSAC algorithm considers several different parameters while positioning multi-UAVs, the proposed Dynamic-UAV method achieves a high probability of coverage in comparison to previous techniques as a result.
On the other hand, the most traditional systems use UAVs that are fixed in place, resulting in a limited likelihood of coverage. Only wind speed is not sufficient for positioning of UAV, and that is why coverage probability of the EIC-UAV approach is affected. The coverage probability of PSO-UAV is also affected due to the lack of weather conditions and other parameters. After reaching a maximum height of 100 m, the coverage probability of the proposed approach increases to 1, while that of the existing DC-UAV, PSO-UAV, and EIC-UAV techniques is only 0.5, 0.6, and 0.8, respectively. The proposed Dynamic-UAV approach has an average coverage probability of 0.82, significantly higher than the previous DC-UAV, PSO-UAV, and EIC-UAV techniques.
4.2.2. Number of Collected Packets Comparison
Compared to previous methodologies,
Figure 13 shows the number of packets captured as a function of UAV speed. In proportion to the speed of UAVs, the pace of packet collection slows down. The Dynamic-UAV technique has a greater packet-collecting rate than previous approaches.
Effective path planning is performed using the hybrid SSO-DWM, which finds an optimal path, detects obstacles during flight, and increases the packet collection rate despite increasing UAV speed. In contrast, the existing DC-UAV, PSO-UAV, and EIC-UAV approaches consider limited path planning parameters, decreasing the packet collection rate. When the speed of the UAV is 25 m/s, the suggested Dynamic-UAV approach collects 6000 packets, while the existing DC-UAV, PSO-UAV, and EIC-UAV systems gather 2000, 3000, and 4250 packets, respectively. The proposed work has an average packet collection rate of 7109, outperforming the existing DC-UAV, PSO-UAV, and EIC-UAV techniques.
Figure 14 depicts the correlation between UAV altitude and the number of collected packets. From
Figure 14, it is clear that the packet collection rate grows linearly with the increasing altitude of UAVs up to 80 m. The graph declines after 80 m (the saturation threshold) since the UAV is designed to fly only up to 80 m. Due to event/weather predictions and multi-UAV placement, the Dynamic-UAV technique achieves a large number of collected packets even at that height.
The LGRU prediction algorithm is used to predict weather and events based on past data, reducing the risk of UAVs suffering from physical damage. In contrast, the DPSAC algorithm is used to optimize UAV placement to provide enough coverage to IoT devices, even when UAVs fly at a high altitude. The average performance of each reliability matric is presented in
Table 6.
4.3. Energy Consumption and Efficiency Analysis
The amount of energy consumed when the number of IoT devices increases is known as energy consumption
. It is measured by taking the difference of total energy
to the residual energy
of the IoT devices, which is formulated as follows.
We computed the total energy consumed by the IoT devices.
Figure 15 represents the comparison of energy consumption to the number of IoT devices.
Figure 15 demonstrates that, as the number of IoT devices increases, so does their energy consumption. However, the Dynamic-UAV approach reduces energy consumption due to event/weather prediction, event-based clustering, and multi-UAV positioning. Predicting weather/events using the LGRU algorithm and event-aware clustering using the DB-OPTICS method minimizes energy consumption under extreme weather conditions. DPSAC-based multi-UAV positioning finds the suitable altitude for UAVs, decreasing the energy consumption and minimizing the delay significantly.
PSO-UAV solely considers wind speed; however, obstacles were not considered, resulting in poor path planning, increased risk of damage, and high energy consumption. The proposed approach consumes 8.5 kilojoules of energy for 100 IoT devices, compared to 13, 11.2, and 10 kilojoules for DC-UAV, PSO-UAV, and EIC-UAV. The proposed work consumes 7.68 kilojoules of energy on average, compared to DC-UAV, PSO-UAV, and EIC-UAV methods.
Energy efficiency is known as the minimum amount of energy consumed when the number of UAV devices increases. A perfect system must have high energy efficiency. More devices with low energy consumption lead to high energy efficiency. The energy efficiency is calculated by:
Figure 16 demonstrates that, as the number of UAVs increases, so does energy efficiency. Our proposed Dynamic-UAV approach provides excellent energy efficiency due to event/weather prediction and energy-efficient path planning. Efficient path planning uses a hybrid approach of the SSO-DWM methods to find the optimal path and detect obstacles, increasing energy efficiency. Collectively, these approaches are implemented to improve the overall system performance in an orderly manner.
Using 100 UAVs, the proposed Dynamic-UAV technique has an energy efficiency of 2, whereas the existing DC-UAV, PSO-UAV, and EIC-UAV are 0.75, 1.23, and 1.58, respectively. The proposed work has an average energy efficiency of 1.41 compared to the existing ones. A lack of weather conditions, lack of consideration of static and moving obstacles, and a lack of dynamic positioning reduces the performance of EIC-UAV, PSO-UAV, and DC-UAV, which results in higher energy consumption and lower energy efficiency. The amount of average energy consumption and average energy efficiency is presented in
Table 7.


 ,
, 


