1. Background and Significance
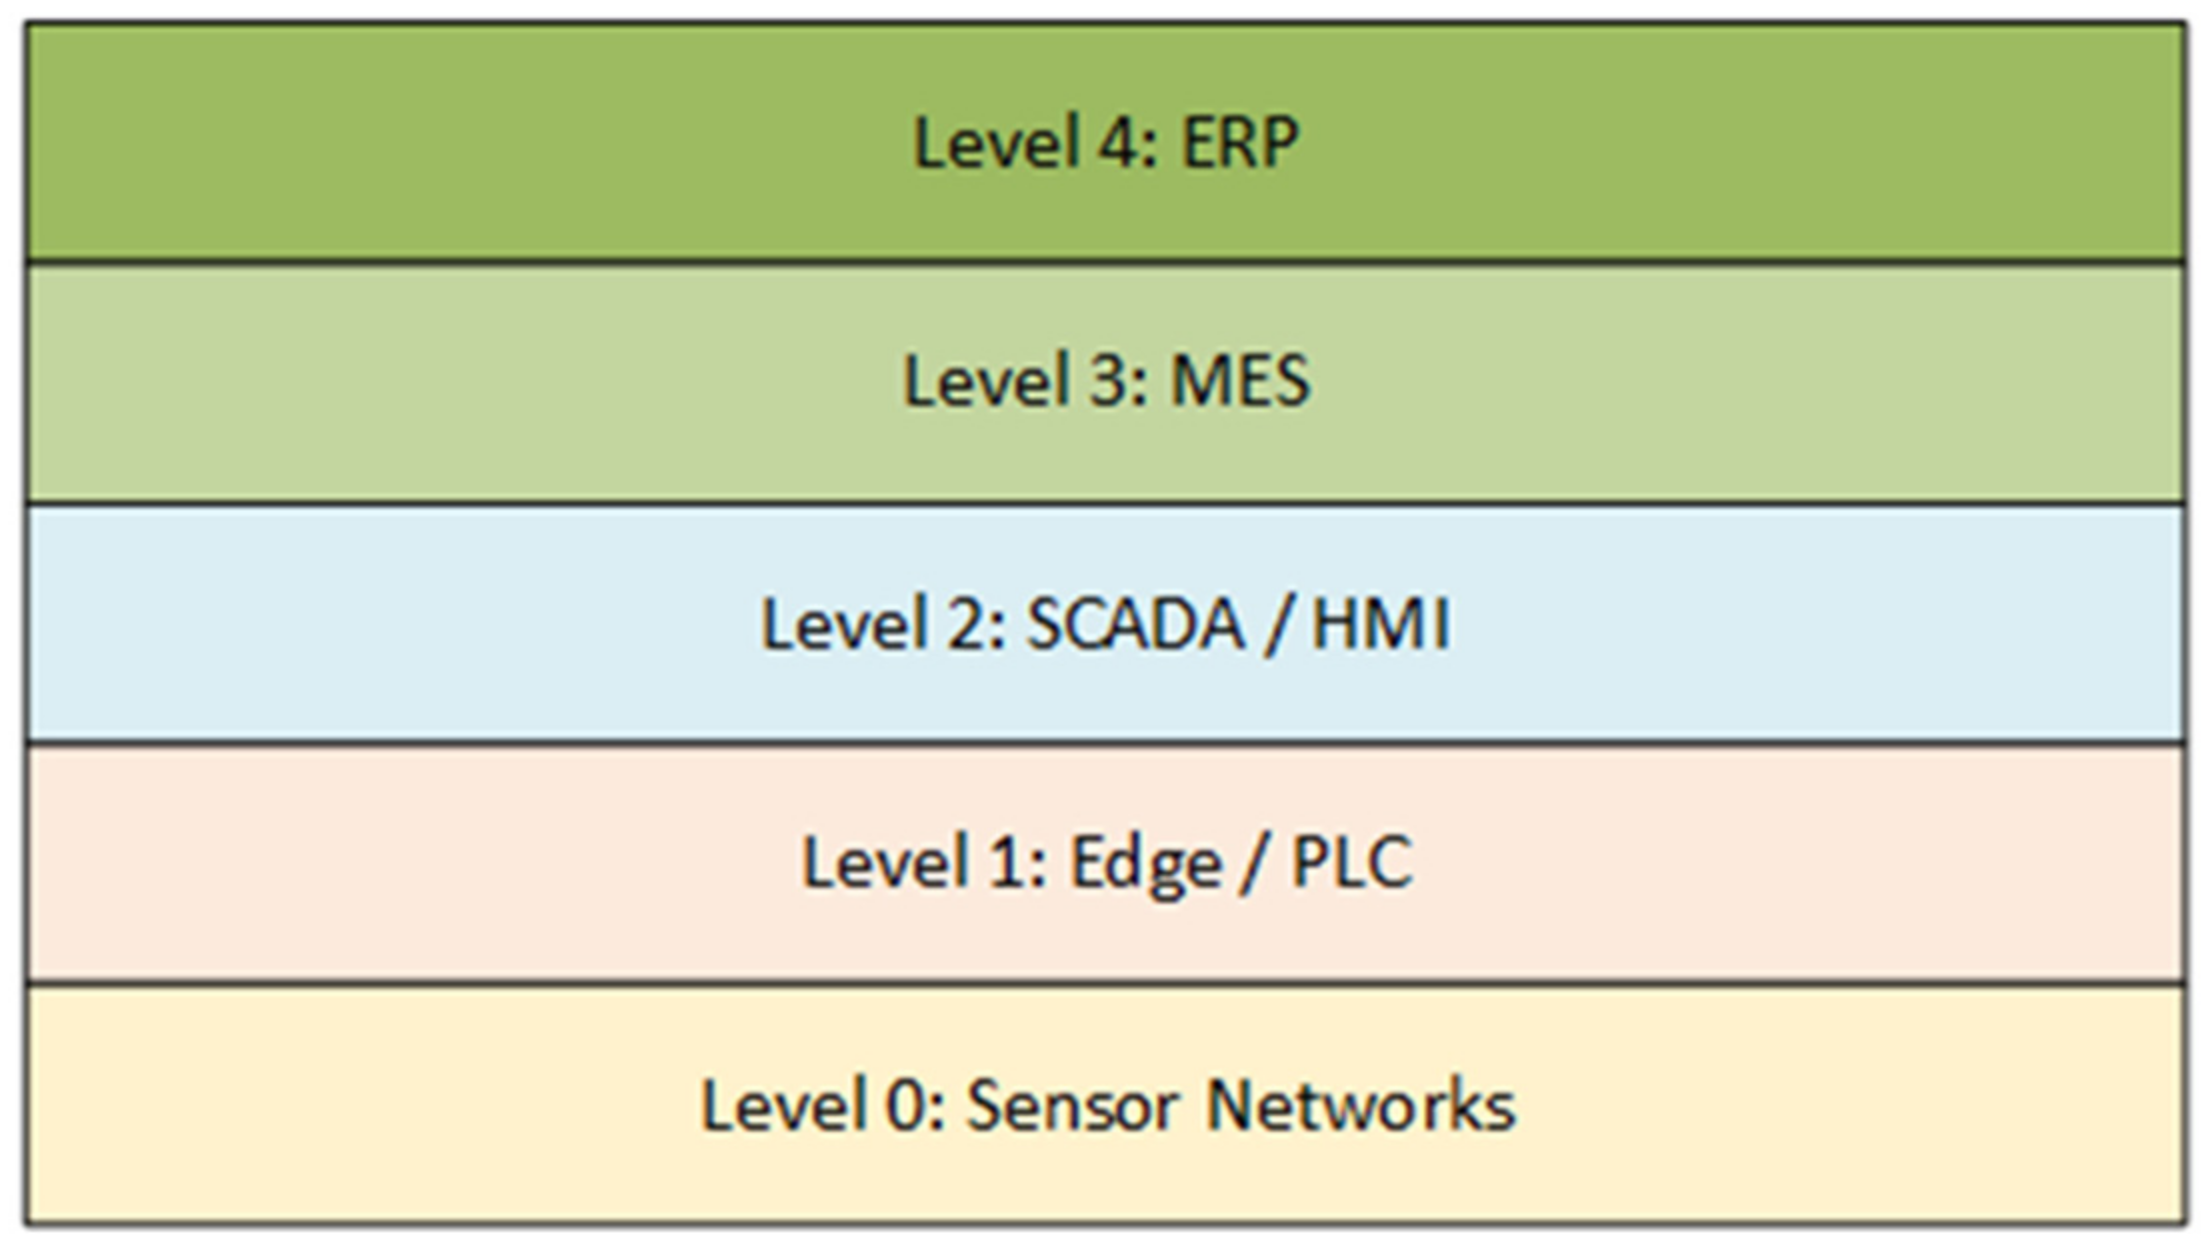
The software required to successfully run the complex industrial systems is distributed across multiple layers, in various configurations [
1,
2,
3], according to the ISA-95 model (
Figure 1). Starting from the sensors/actuator layers, through the edge/programmable logic controllers (PLC) layer [
4], via supervisory control and data acquisition/human-machine interface (SCADA/HMI) [
5,
6] and manufacturing execution systems (MES) [
7] way up to enterprise resource planning (ERP) [
8], all pieces of equipment run the software that needs to be updated occasionally. Since the manufacturing environment is often in highly regulated industries, this implies that all deployed software instances must be standardized [
9] and able to retain constant high reliability [
10].
The difference between software instances running at various levels is such that the definition of joint hardware/software stack is not quite feasible. When possible, the complexity is as close as explained in [
11]. Usually, the implementational and organizational aspects show a large-scale variance. Not only is the application development technology different, but also basic design principles such as the type of program, backbone design paradigms, and general usage philosophy [
12,
13,
14]. Furthermore, the volume of data traffic per layer and between layers could easily be different. Nevertheless, the software that runs at one level must communicate with the software running on the level above and the level below (
Figure 1). In short, the communication protocols are not equal in every case [
15,
16].
These facts prove that the software update is slightly more complex than in situations where the system is based on the same or comparable technology and the same communication protocols. Since the software needs to be updated from time to time, such a challenging environment requires precisely defined processes and scenarios that could make the deployment of an updated version effective and efficient [
17]. Regardless of the level and mentioned differences, the update process could follow similar procedural steps. The general resource awareness points could be identified, such as memory usage, data traffic, and downtime period [
18,
19].
The complete area of industrial software development, implementation, and deployment is considered very dynamic currently. The presented results cover near-complete Industry 4.0 software integration maturity models [
20], which is an impressive stage of development in the area as of now. The results of the research from various computer science topics are used to improve the overall experience in the industrial domain and improve the Industry 4.0 agenda [
21]. It is not only the improvement of the product quality management system as described in [
22] but also the usage of artificial intelligence (AI) and deep learning algorithms that could improve the segments of system security monitoring [
23,
24] and general fault diagnostics [
25,
26].
Nevertheless, all the mentioned pieces of the software need to be updated sometimes, and the proper update strategy will lead to lower downtime and higher customer satisfaction. The main objective of this paper is to highlight the common problems with software updates across multiple layers in the complex industrial environment and to introduce a set of recommendations and guidelines for the most time- and cost-effective software updates from the resource awareness point of view. As the showcase, the executed experiments were with the software used on the ERP level. The ERP level is the environment where the performed experiments will have the lowest impact on production [
27]. Since this level might be decoupled more easily from the rest of the system, it proved to be the most convenient level for both trials, testing, and the initial production deployment. Therefore, different deployment strategies and the influence of the critical resource management points could be examined.
The most critical points for resource management are the storage capacity (especially at the lower levels) [
28], downtime during the update process [
29], and the data traffic through the connecting networks [
30]. Namely, MES systems could run in a shop floor environment on computers connected to the wireless network which could experience different disruptions as the result of operating nearby machines generating high frequencies. When deploying an updated version of the software to some programmable device, an update package needs to be distributed via a network and stored on the destination device, and the previous version needs to be backed up in case of roll back.
Depending on the type of devices, their number, and the layer of running software, the amount of transferred data (per device) could be, according to our experience, between 10 kB and 1 GB. The clients on the sensor levels need small packages, the size of which is measured in kilobytes, and which execute few functions. Oppositely, the installation of the server node software at the ERP level might need several gigabytes. Considering regular data traffic, the additional network load created as the result of the software update could use a substantial portion of the data throughput and cause communication problems [
31]. Moreover, the devices on which the software is executed could have limited storage capacity, which would require backup in a remote location.
The next important case is the situation where bugs and software errors are discovered after the deployment. When this situation occurs, the deployed software needs to roll back to the previous version. The roll-back procedure entails additional time and network resources [
32,
33]. This means that the system must contain nodes with enough storage space to store several versions of the active software. Unfortunately, this is not possible every time, and in these cases, downtime for the roll-back scenario would be pointedly extended.
To overcome the described problems, the update process must be carefully planned, and an adequate procedure should be followed. The mentioned procedures are called deployment strategies and a desirable choice of deployment strategy would reduce the downtime and other downsides of the update process. Unfortunately, in such a complex environment, none of the existing and well-known deployment strategies alone could bring a satisfying solution. Each separate strategy tends to bring not only positive but also negative effects to the update process. For example, blue/green deployment could reduce the downtime close to zero, but it offers verification on a single node only; canary offers the possibility to test in a production environment but does not define scenarios of what to do when the change happens between software layers. In the end, dark mode and feature flags alone could lead to an uncomprehensive software solution where the status tracking and roll back to the previous state could be a task close to impossible. Thus, the decision was to try to define a hybrid strategy that would synergistically use the existing ones, emphasizing their positive and reducing their negative sides.
To reduce the impact of the mentioned problems on the system uptime, the common software node structure together with the hybrid deployment approach was proposed. The common software node structure is based on blue/green architecture extended by feature flags. Such a design is applicable in most cases, both in server and client nodes. In this way, the software update will more likely be the case of the version switchover than the node restart. For client networks, the preferable approach will be the usage of sentinel nodes which will reduce the network peaks and improve canary deployment, which is a common strategy for client networks.
To make the complete system more effective, the design is enriched with the potential use of distributed backups and message queues as additional support mechanisms. The mentioned combination of deployment methods could be used further for other software layers [
34].
In this research, the results for the clients on levels 3 and 4 (mostly on the ERP level) are presented and elaborated on. Except for ERP, the proposed approach is fully applicable to the MES, while some adaptations could be used at the lower levels as well. The discussion section conveys potential problems and strategy variations when the proposed hybrid approach must be applied to sensor networks, Internet of Things (IoT), and SCADA levels. The simulation, based on a realistic factory layout, used for the test was one of the first steps in the ongoing research, expected to result in the digital twin which could be used as a testbed for the system running the software in multiple ISA-95 levels.
2. Related Work and Common Deployment Strategies
As mentioned previously, the software update is a delicate process, during which a product version is changed. This process could often leave a software instance in an intermediate, undefined, or even a vulnerable state. Such a state often requires downtime, which inevitably leads to data loss. In lower-level industrial systems, reducing downtime and data loss is necessary. Thanks to the evolution of the software industry, deployment methods have been developed and improved to make software updates as efficient as possible. With a proper deployment strategy, overall time and resource losses could be as small as possible. This section provides an overview of some existing deployment strategies which were used as a basis for the set of recommendations provided by this paper. Along with them, the insight in the current Industry 4.0 research is presented, with special attention to the concepts useful for further research.
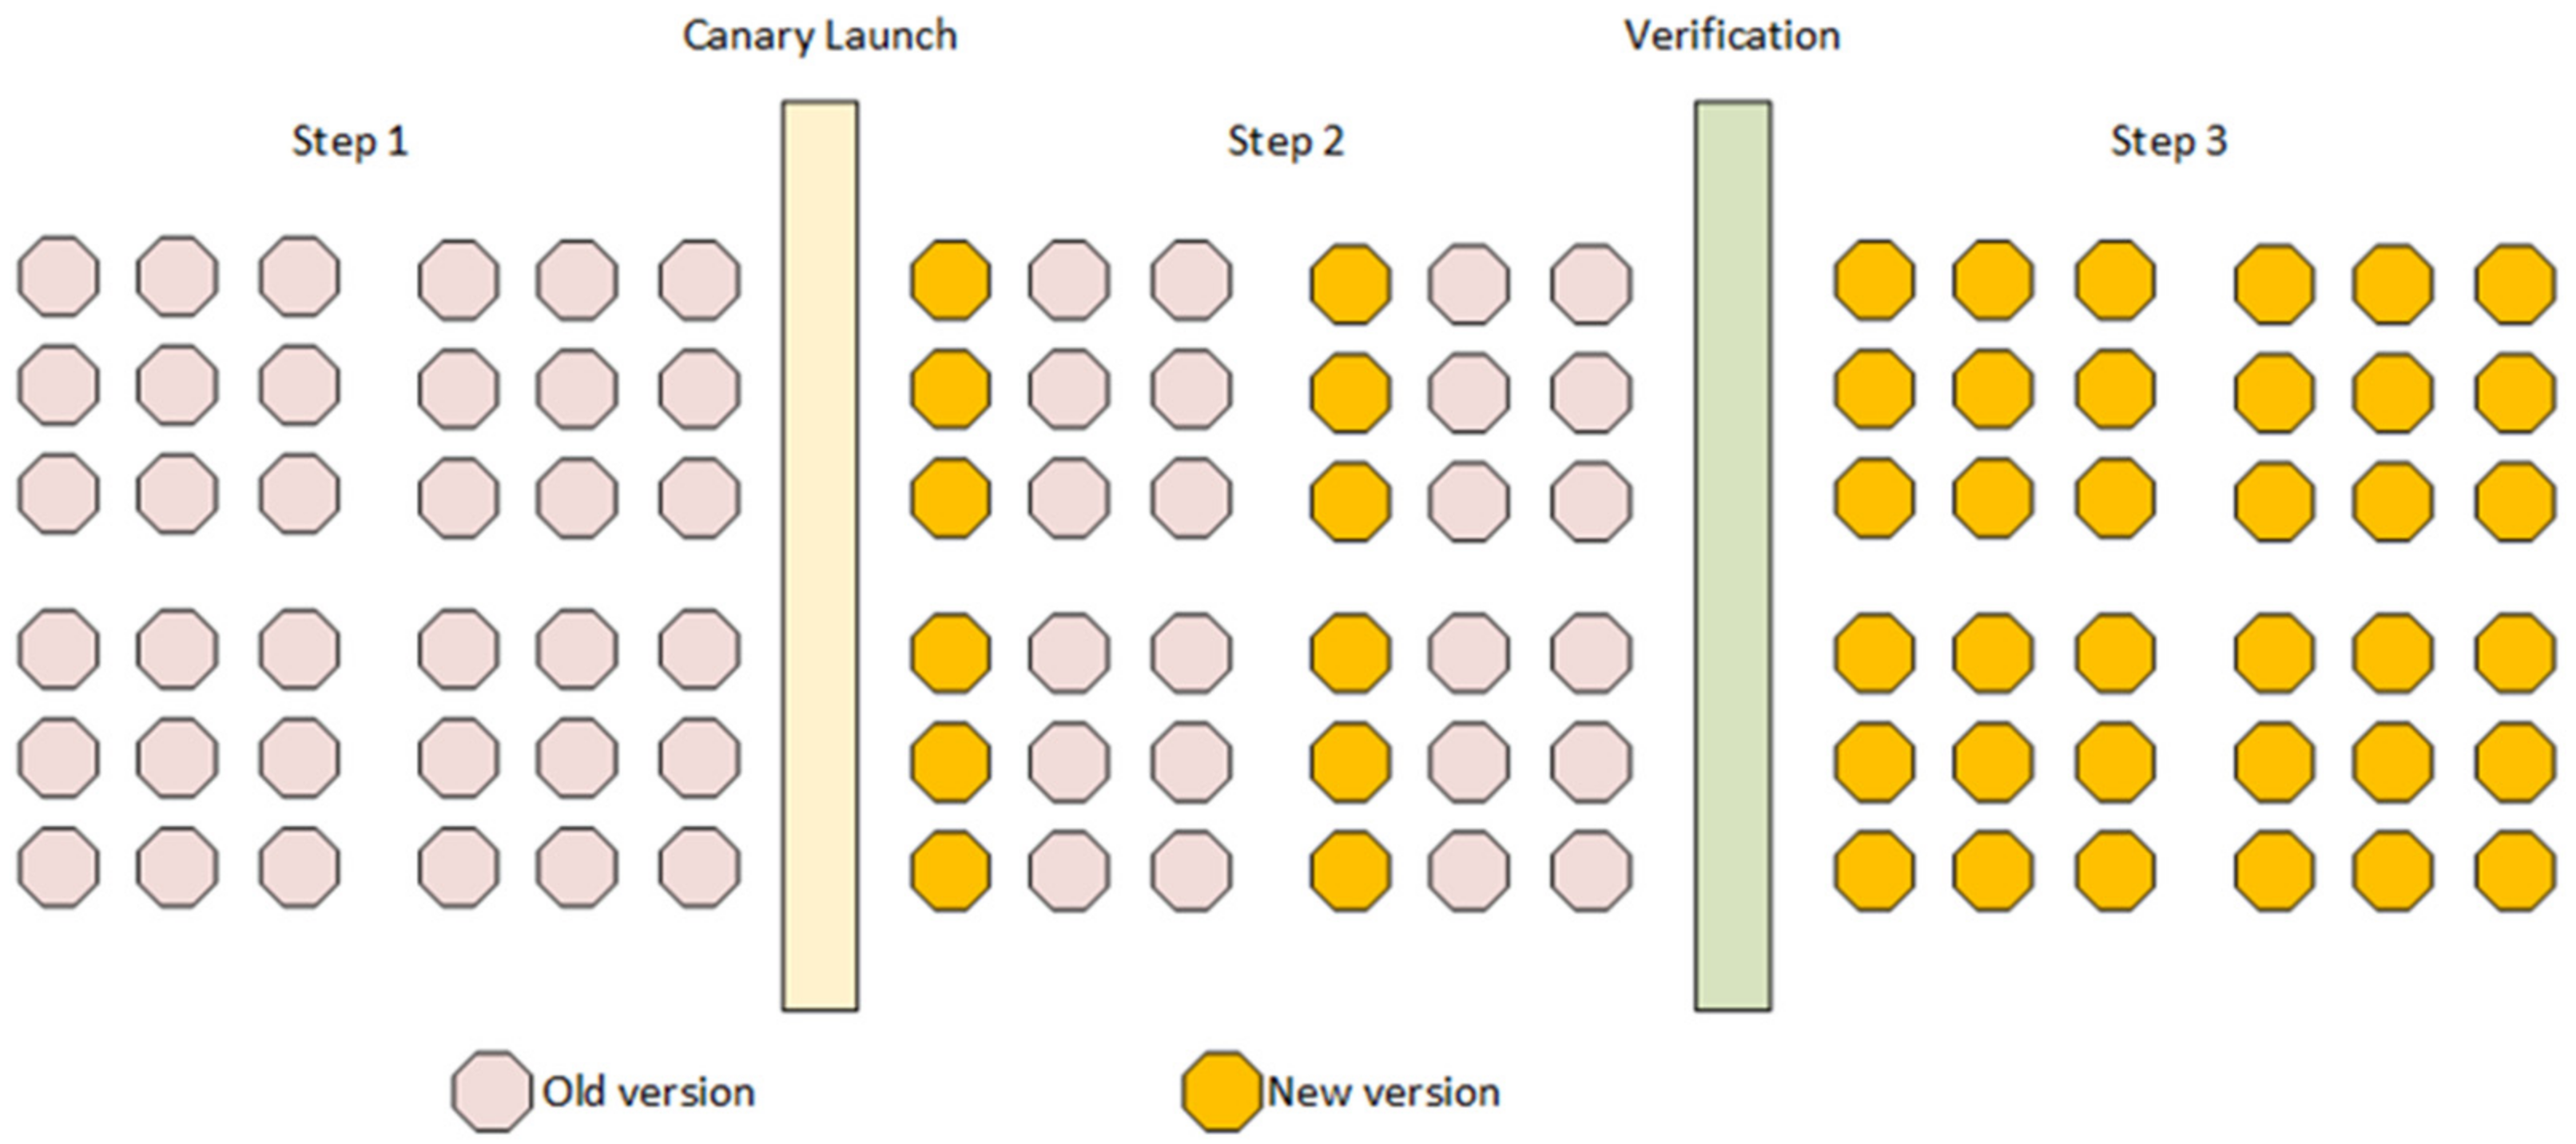
Starting deployment with a small number of users is an effective way of reducing the risk of unsuccessful deployment [
35]. The canary deployment method (
Figure 2) incrementally deploys new versions of software into production with an impact on only a small number of users at a time [
36]. In the examined case, this approach is applied to the small number of software instances on the IoT level. If the problem is detected early enough, then it might be possible to hide and disable problematic functionalities for the limited number of devices and run a quick roll back to the previous stable state. By this, the dark and canary deployment was selected. This approach contributes to continuous deployment and successful resolution of the main research question in this paper—how to reduce downtime.
The dark method is an incremental method that hides the functionality of the updated version from end users [
37]. This method attempts to detect potential problems with the updated version before they affect customers. When creating large features (i.e., dark features), the software product is divided into small batches and the dark feature is hidden from the user until the entire feature is deployed, then the dark features are turned on and made available to users. Engineers on Instagram use the dark launch to develop new features slowly and steadily for up to 6 months [
38]. Facebook implements a version of dark launches using Gatekeeper that controls which software changes will affect which portion of the users [
39]. In [
40], research was conducted on Atlassian Software Systems, located in Sydney, Australia. Deployment of large features was realized through dark features and despite all the clear advantages that this method has, employees pointed out that this method of deployment made it difficult to demonstrate to customers the added value of new features in the software product. On the other side, in systems such as lower levels in industrial deployment, this is a favorable method since it does not allow single node deployment to go to the next stage of verification or even production without a proper checkup. Generally, the canary method is used during the single node update to mitigate the risk of releasing large feature groups with significant failures.
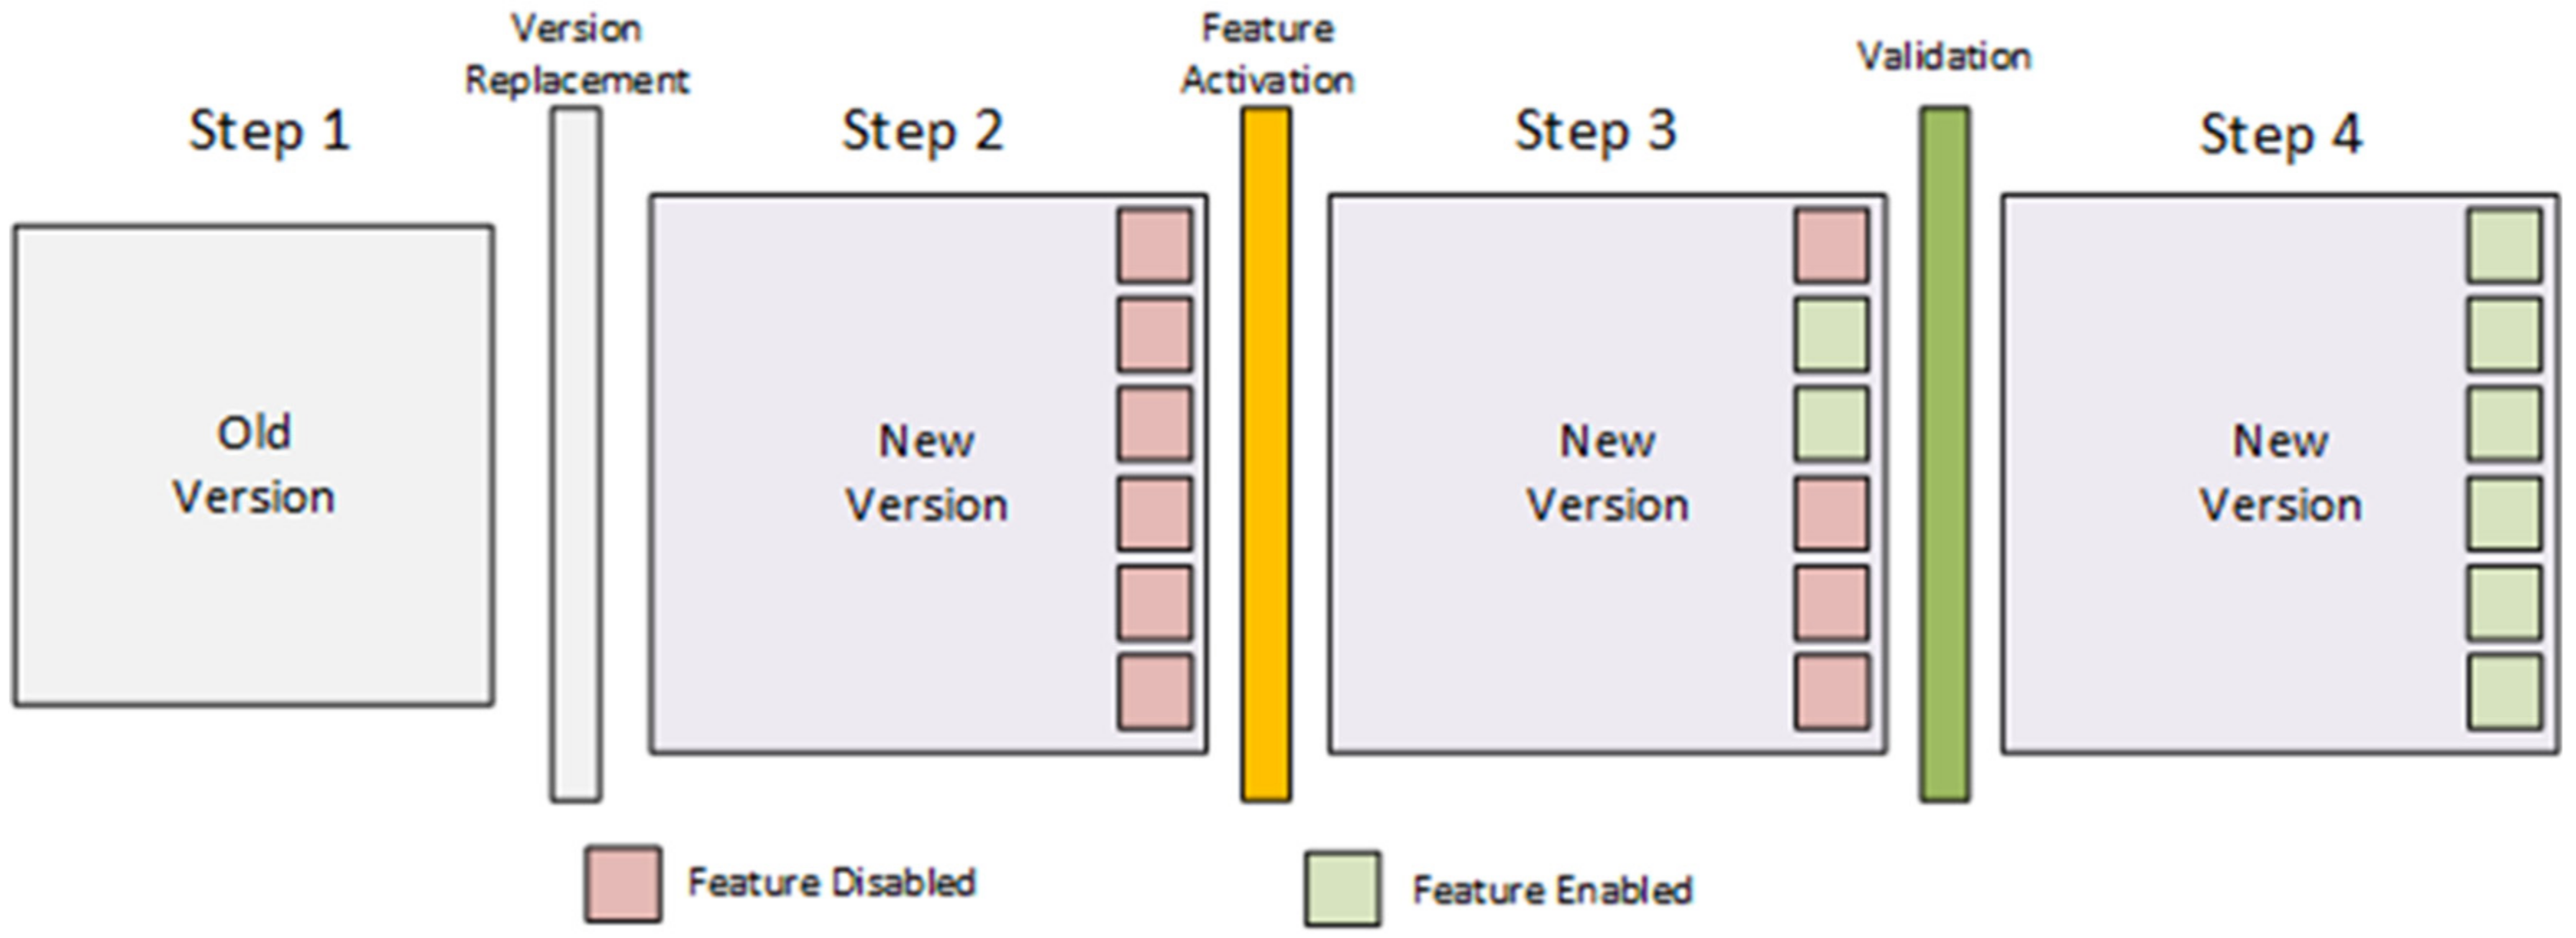
Many companies that provide large-scale upgrades use a combination of dark launches and feature flags (
Figure 3) to deploy large architectural changes. By using feature flags, the developer turns features on and off through the configuration server until it is fully ready for use. In this way, integration problems and maintenance of long-running feature branches are avoided [
38]. The paper [
41] states that conditional logic and configuration flags were used to implement feature flags. Etsy uses configuration flags that switch on and off specific portions of the software code [
42], and Rally Software uses a conditional framework [
34]. This is proven to be a good approach in industrial systems when new features are introduced. The potential for such an approach is shifted to higher levels of the software—closer to MES and ERP. In lower levels, the canary approach is chosen since feature flags would create additional complexity in the environment where overall resource awareness is necessary.
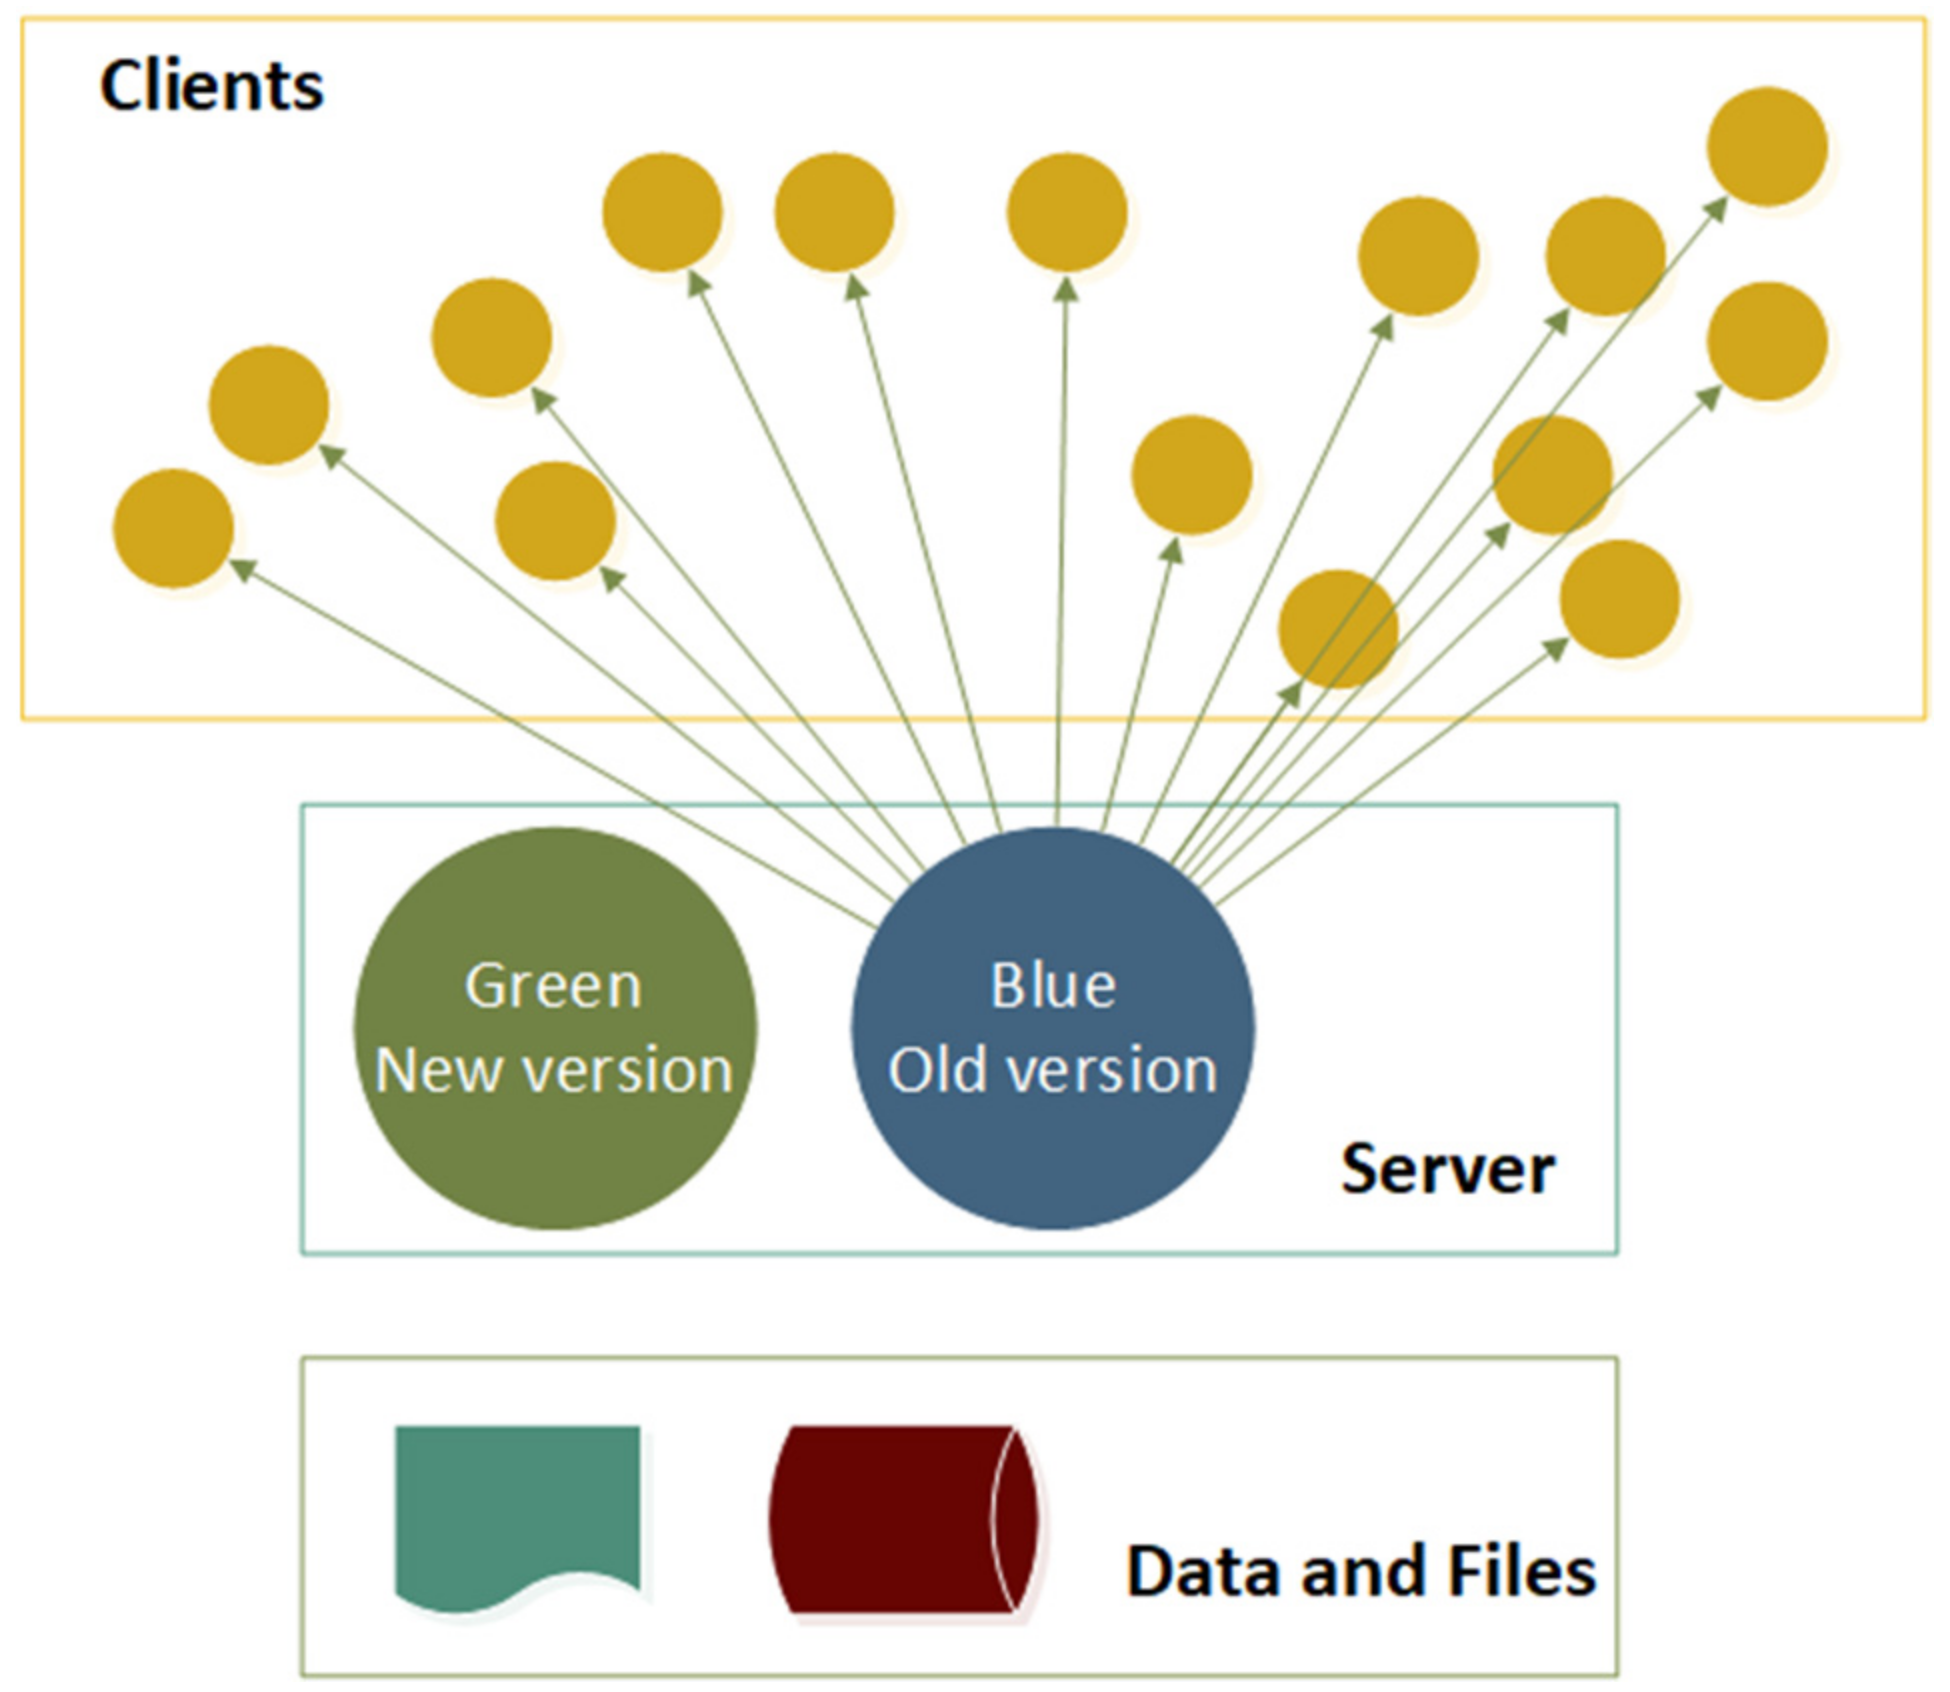
One of the most used deployment techniques, regardless of whether the nodes have enough resources, is the blue/green deployment technique (
Figure 4). It uses two identical environments, one for production and the other for staging, with changes planned to be introduced. Even if an error occurs, the previously safe environment can be restored very quickly and easily [
43]. Using this technique requires additional costs to create a duplicate environment, making it perfectly suitable for higher levels in the ISA-95 stack.
In the work presented in [
44], dark and canary deployment strategies are proposed for successful deployment. It is also stated that one of the essential characteristics of good continuous deployment is the fast feedback of users. Besides numerous errors caused by the deployment that could be easily detected through internal diagnostics and log analysis, the possibility that users could report the detected problem makes them feel more important and contributes to a general acceptance of the system. Since this is the requirement on the MES and ERP level, where the number of active users is significantly higher than in the lower levels, the blue/green testing method is suitable.
Not only standard deployment strategies from the software development domain are of interest in the presented research, but also some approaches are known from the industrial environment. One of them is the so-called hybrid software defined network (hybrid SDN or HSDN) [
45]. They are used to make data management more effective with a reduced hardware cost, by splitting the system into management, control, and data plane. Splitting the complete environment into mentioned planes makes it like the ISA-95 stack and brings comparable software deployment challenges.
To build the hybrid strategy, the current research partly relies on the approaches defined in island-based, service-based, and class-based HSDNs, as described in [
45]. Looking in this direction, the study [
46] helped in understanding the industrial networks and using the evaluated approaches for incremental deployment that could be used for level 3 and 4 software, in a way that looks like the implementation of the feature flags deployment method. The explanation of intra-domain deployment given in [
47] was important as a way to prove that the canary deployment is the proper baseline for the client update strategy, while the explanation of the importance of traffic engineering defines the need for the introduction of backup and sentinel nodes in the client networks.
The usage of queuing models and buffers is another approach frequently used in the HSDN domain [
48] and is used in this research when the model of the single node was defined. By default, a single software node consists of blue and green software versions together with a buffer that makes the data synchronization between two software layers, or between clients and servers, smoother, more error-prone, and effective.
Hybrid deployment models are a well-known engineering approach [
49], and with all their technical benefits, they are also tailored and used to make the customer more satisfied by targeting their specific needs, reducing system downtime, and preventing error propagation.
3. Materials and Methods
As the starting point, the comparison of the mentioned, well-known, and widely used software deployment strategies is performed. Relying on the findings explained in the related work presented in the previous section, none of the strategies could be used as a perfect solution in every case. Thus, the next step in the research was to identify the main positive and negative characteristics of each of the described approaches and use them in a synergistic way to obtain the most effective deployment approach. The main purpose was to devise an approach that could be used, to some extent, in all five layers of the industrial software environment. The collateral benefit expected from this research is the general recommended architecture for the single software node regardless of the software level.
3.1. Towards a General Hybrid Approach
The most used deployment strategies are analyzed and their positive sides are highlighted. As has been mentioned before, none of them proved to be an ideal solution for every case, but with a proper combination, their downsides will have a lower effect on the overall process.
The initial choice was the combination of blue/green and canary deployment. Thus, the blue/green approach was introduced on every node—both server and client (whenever it was possible). For the group of clients where the examined software should be deployed, the canary approach is defined as the basic viable deployment scenario. This is a usual and widely used combination. The most important characteristic shared by both the blue/green and canary releases is the possibility to test new versions in a live production environment with a reduced risk level. When developing the updated version of the software, it is usually tested in a single server node and with several clients. Even though the updated version could work properly in the test environment, the deployment to the full-scale production area could lead to complications not predicted before.
Next, both methods provide the possibility for close-to-zero downtime. The version change might occur quickly enough for the software update to become a process that could be performed not only during non-peak hours but virtually anytime.
The downside for the blue/green deployment is that the deployment process could require more space for different versions and that the targeted pieces of software need additional logic for change management. The elements such as message queues and long-running processes need to be carefully monitored if no downtime is required. The additional problem with blue/green and canary occurs when a change in different software levels or layers is needed for an updated version. Regardless of database schema change, communication protocol update, or a required updated version of the software in the connection layer, all of these must be considered during the update process. The level of change could be such that a simple switchover is not possible, and thus deployment would require significant downtime. The additional downside is the roll-back scenario. When it happens, the system needs to go back to the previous version, and another downtime slot rises. This is often highlighted as a crucial problem by the customer.
To reduce the downtime when a roll back is needed and to control the launch of new features, the dark launch and feature flags are added to the tested software (namely, to the green version). This is intended to simplify turning on or off new features in the environment that remain almost unchanged. New functionalities could be developed and controlled by simple Boolean variables. In an ideal case, this approach requires less time both for planning and coordination and for testing. Thus, development and testing could be parallelized (depending on the nature of the change). The cost of this approach is the additional programming and organizational effort where the feature flag system is set up and later utilized.
The increased number of configuration parameters could be a problem with feature flags. They need to be carefully managed in order not to cause more problems in the future. Moreover, the additional coding effort is needed to maintain the code and could eventually leave the application more fragile if updates are not thoughtfully planned.
The initial impression is that all mentioned approaches contrast with each other rather than being complementary. Instead of sticking to a single deployment method, the choice was to combine them in a suitable system where each technique fills the gaps of the others (
Figure 5). The suggested approach is considered the hybrid approach since it is the combination of canary deployment and blue/green technique enhanced with the dark launch approach and the feature flags. This setup could be supported with buffers between the levels, or between clients and servers, ensuring precise message processing as stated in [
50].
3.2. Configuration for a Single Node
Deployment for server and client nodes could look different, but the software organization on both ends could follow the same pattern. Besides the fact that in a distributed environment, the number of server nodes is pointedly lower than the number of clients, it is worth having predefined baselines for all the different software instances.
Consequently, the update process could be driven by the same pattern and the same set of actions might be performed along the line. An additional piece of software, the updater, could be used then both for the server and client updates. Although the number of distributed update packages for server nodes will be lower than for the clients, this is not the limiting factor that would require different deployment approaches.
The available space in the server node is higher, thus the blue/green approach is a desirable choice. Moreover, client machines for software running in levels 3 and 4 are regular computers, so the space will not have a limited role. The extension of the deployed software with the incoming and outgoing message buffers is considered an additional option in cases when the order of message synchronization is critical. From the technological perspective, message queues are a standard component used in many systems regularly.
The software configuration in the single node follows the approach based on the blue/green method extended with the dark method and feature flags. The additional cost in terms of needed development time is acceptable for levels 3 and 4 since the roll back is easy because both client and servers could contain enough storage space.
The mentioned combination could be used both in server and client nodes in levels 3 and 4; the update process would, ideally, always follow the scenario where the system is switched to the updated version, which gradually enables new features. The main elements of the software configuration in a single software node are the blue version (currently running version), the green version with feature flags, and the communication buffer (
Figure 6).
Before the update starts, the current version (blue) is active, and the previous version (green) is passive and ready to take over if necessary (
Figure 7). The deployment starts with the archiving of the previous version. At this moment, the current version is running without the backup, and the updated version is being uploaded, becoming the new green. The updated version is uploaded in black mode with all feature flags disabled. In that way, initially, the users will see no difference and they will continue to work with the same version of the software.
After the execution instance switches from the current (blue) to the new green, the feature flags will be turned on in a predefined scenario. In this way, the deployment team will be able to control the update and, if any problems occur, keep some feature flags turned off until the problems are fixed and the next version is ready to deploy. The scenario of how to turn on and off the feature flag could be defined in multiple ways, but this topic is out of the scope of this paper. This scenario is perfectly suitable when it comes to the update of the server node.
In case the update of client nodes is needed, the process must be slightly modified. In the usual environment of MES or ERP level, there could be several hundred clients connecting to the same server. Updating all of them in a single shot is slightly risky since the number of the affected nodes will be significant, which could result in significant customer dissatisfaction. To avoid this potential threat, canary deployment for the clients will be introduced.
3.3. Choosing the Initial Set of Deployment Nodes
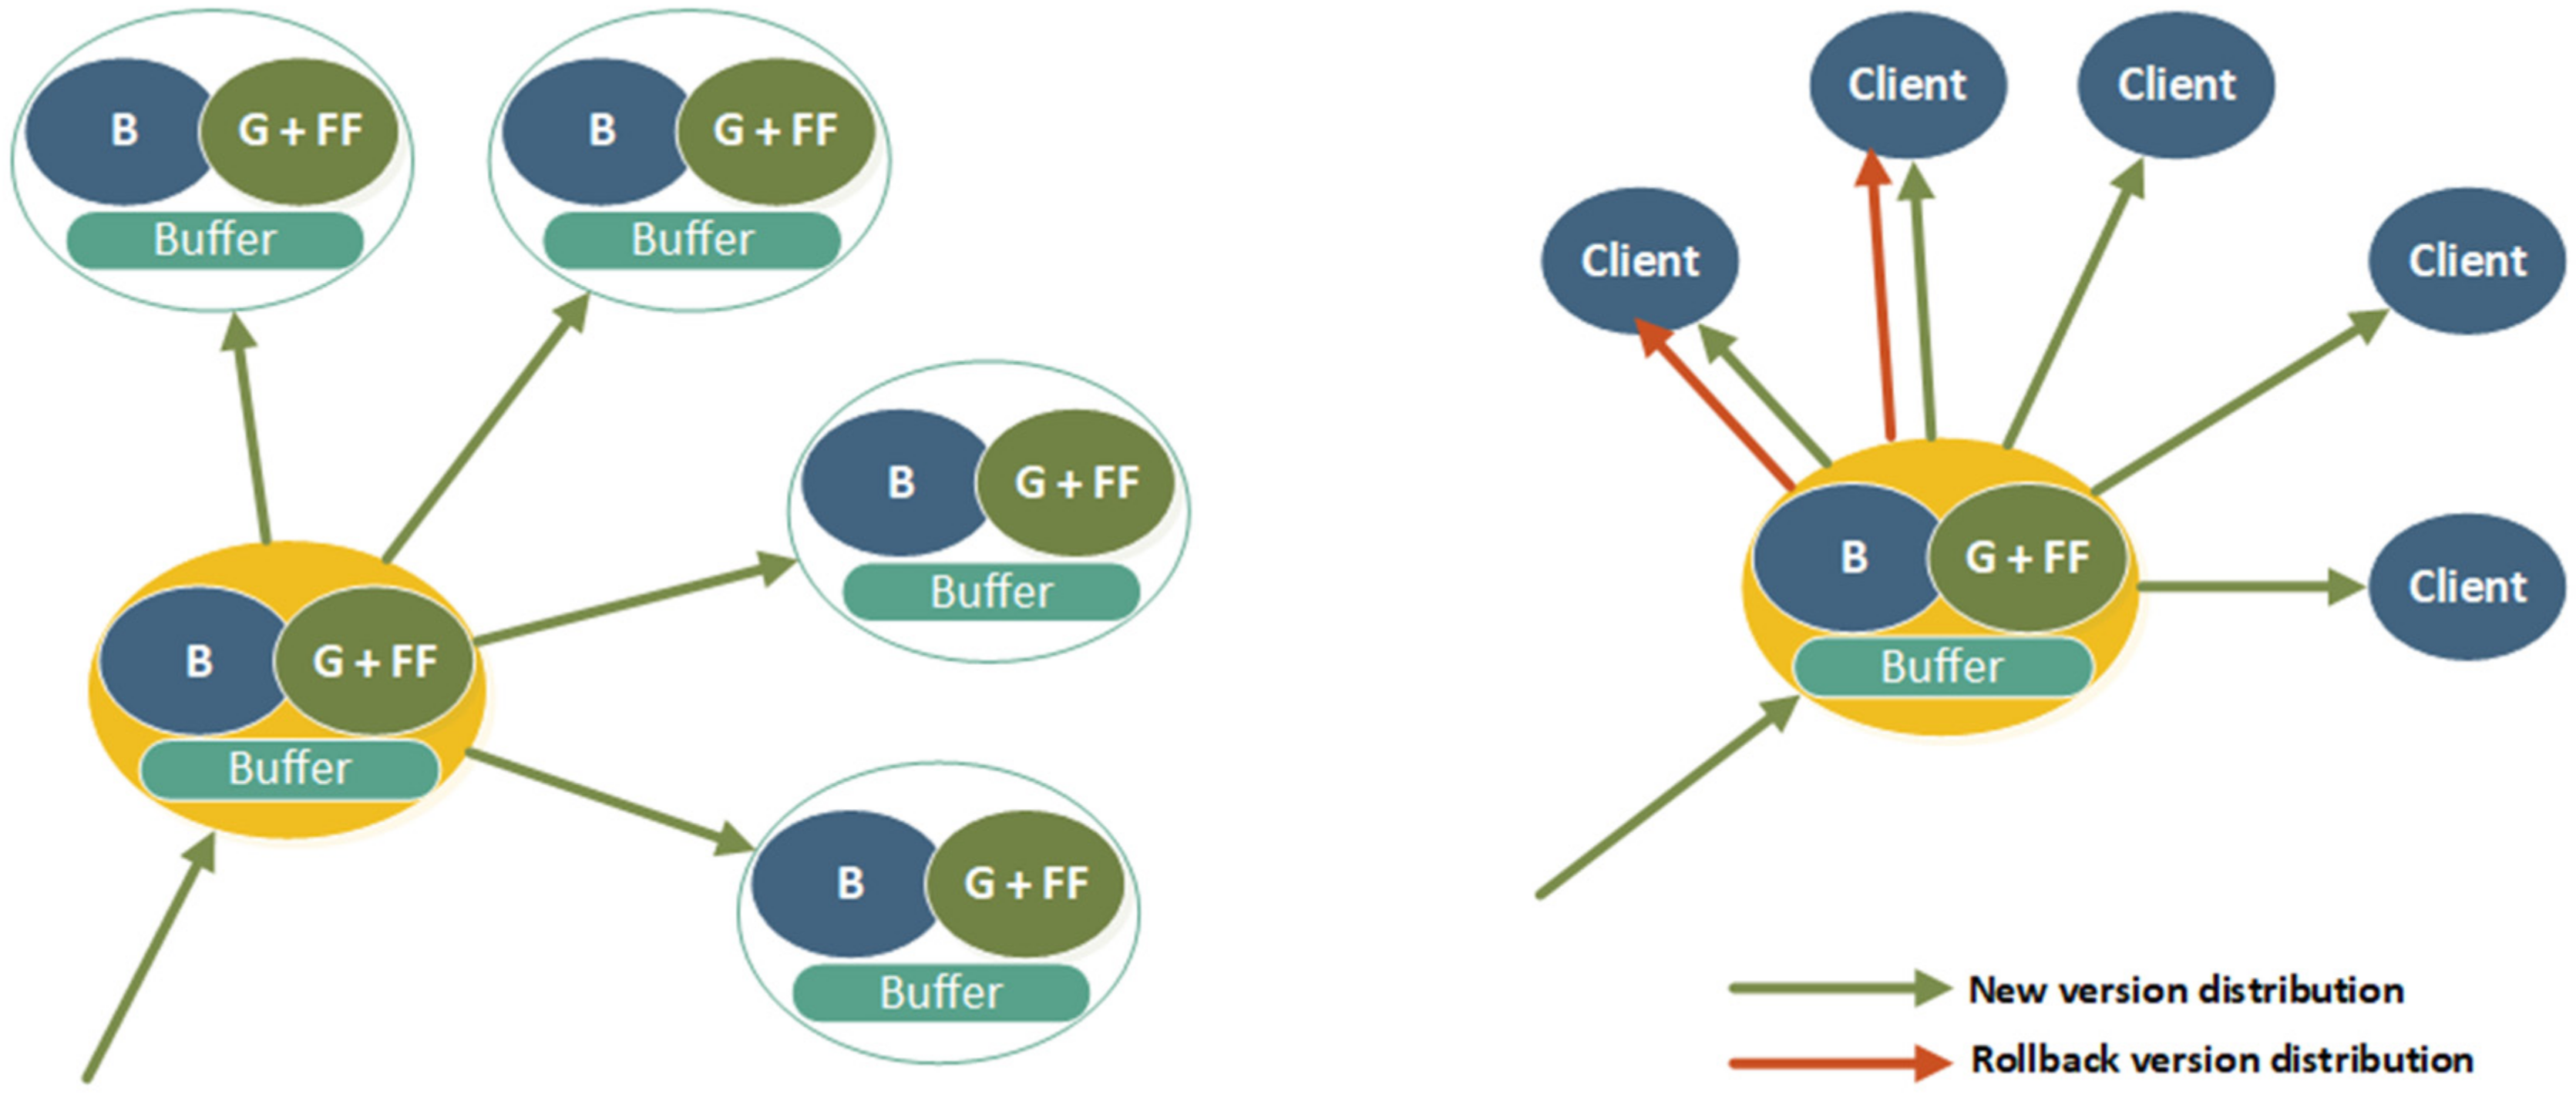
The update process for the client nodes starts by choosing the initial set of deployment nodes. The chosen clients will serve as the target nodes for the first wave of the new software version deployment—the canaries (
Figure 8). After the canaries, the rest of the nodes from the group will be targeted by the update process. The nodes are divided into groups based on the organizational or network location. In most cases, a group is the set of nodes that belong to the same work center or area, but sometimes, one set of the node could be considered a group if they are connected to the same piece of the network equipment.
The methods for the node grouping and/or choosing initial nodes are not part of this work, but, in short, they are based on the premise that the selected nodes must be considered representative of their group. This means that these should be nodes with the heaviest traffic, the nodes where the higher number of actions is taken, or the nodes which serve the highest number of different users. Each of these criteria plays its role when it comes to choosing the canary nodes, and the nodes, depending on their position, will be selected based on the mentioned criteria.
The precise definition of the node choosing process is still considered a work in progress and will be the topic in the next research stage. For the moment, the analysis of the client logs was the process that gives insight into the number of executed actions, their diversity, and then the number of different users followed by the client’s active time. From the list of the active users, the list of their profiles could be obtained, which means that analyzing user diversity is possible. This helps us to define the specific measure called the node importance factor. The measure of node importance within its group (marked as parameter N), is calculated as:
The higher calculated value N means the higher node importance factor. Looking at Equation (1), the value A represents the number of registered actions per client, while the value D represents the action diversity coefficient. It is the value between 0 and 1 that represents the ratio between the number of different actions used in the specific client and the total possible number of actions.
The next important parameters are the U and the P. Similarly to A and D, the value U is the number of different users that were logged into the client and the D is the ratio between the number of different user profiles logged and the total number of the user profiles. In addition, the value T is the number of active daily hours. All the mentioned values are calculated as the daily average for the last 90 days (about 3 months). In perspective, the length of the observed period will become a parameter for the calculation of the node importance.
After the initial set of nodes has been defined, the update process can start. The update, following the method described in this paper, was performed only in these nodes following the previously defined approach. Consequently, when the feature flags start to be enabled, in case of a problem, only a limited number of nodes will be affected, and the corrective actions could be performed faster and more effectively. It is also worth mentioning that the volume of the software update could significantly affect network traffic in the production environment, especially at ERP and MES levels. At the two levels mentioned, clients could be complex applications consuming a few hundred megabytes. The next section discusses the additional techniques which should enhance the general hybrid approach.
3.4. The General Downtime Problem
The effect on data traffic, or reduced bandwidth, is not the only problem that could be triggered by the update process itself. The next important topic is node downtime. During the update process, the targeted node could go offline for a certain period. Depending on the implementation technology and the software type, the downtime associated with the version switch could turn the system offline for a longer or shorter period. The effect of the node downtime could also affect a different number of nodes. If the client node is offline, this is usually limited only to a single node. However, when the server node goes offline, all the connected clients could go to the disconnected state too. The worst-case scenario in both cases is related to the period needed to restart the updated application. Again, this is related to the used technology and the time needed for restart could be between a few seconds and dozens of minutes, according to our experience in different domains such as [
51,
52].
3.5. Additional Techniques Used to Improve Efficiency
To make the complete system more reliable and to improve the deployment efficiency, the system was enriched by the introduction of three additional techniques—sentinel nodes, backup nodes, and loose coupling between clients and servers using message buffers.
The idea with sentinel nodes is in line with canary deployments. The idea is to split clients into logical groups and then pick one of the clients from each group and promote it to the sentinel node. These groups usually consist of the client nodes belonging to the same network segment, or the same space area, or they execute the same set of actions. This means that the selected sentinel node will be used as the initial node when an updated version must be deployed. Choosing sentinel nodes in advance will give the advantage in deployment planning and will ensure that the verification of the new features will go through the most convenient path of execution. Since the sentinel node is close to equal to the rest of the group members, the discovered issue on that node will be equal of that on any other node.
After the updated version is verified in the sentinel node, the new software will then be distributed to the other client nodes within the sentinel’s group. In that way, the canary strategy is applied, which proves its value in the mentioned case. Furthermore, this approach with slight modification could reduce data bandwidth problems if the sentinel node is used as the distribution point for the client update. This approach will also help to reduce the data bandwidth from and to the server which will reduce the potential data flood. On the other hand, the traffic in a sentinel’s network segment will be increased. This is not considered a major problem since the data traffic between client nodes is significantly lower than inbound and outbound server data flow.
Namely, if the update process has been run from a single node, the server, a complete update package will be distributed as many times as necessary to correspond to the total number of clients. If the update must be conducted at ERP or MES level, the update package could reach hundreds of megabytes, causing extreme outbound network load for the server for some period. During this process, regular communication with the server will be seriously affected, which could result in processing delays and could cause other communication errors.
Using the sentinel node as the distribution point for the update will reduce the load on the server. On the other hand, the cost for this reduced load is the increased load on the sentinel node, but the traffic will go between the clients, causing potential communication problems only for sentinel nodes for some period (
Figure 8). The sentinel nodes act as the branch node in the tree-like structure that could be used for the software update distribution and could be further divided into levels. To achieve further optimization in the distribution, sentinel nodes in level 1 will receive the update first (
Figure 8). They will distribute the update to connected level 2 nodes. Level 2 nodes will distribute the update across their subset of the dependent nodes—to level 3 nodes. The nodes dependent on level 2 nodes are not limited to their work center or cell but are connected to the network topology. Level 3 nodes are terminal nodes in the presented example, and they will not distribute the updates further. At this point, the problem of picking sentinel nodes will not be elaborated on in detail. How to choose sentinel nodes and how to organize them is an interesting topic, but unfortunately, not the focus of this paper.
This approach could be further improved by defining an updated tree for each group of nodes. This means that the maximal number of clients connected in one group must be defined. These clients will then receive the update package from the sentinel node, and each of them will then forward deployment to the next nodes within the same group. In that way, the created structure will be a B-like tree, with a total update time slightly higher; however, the impact on overall communication bandwidth across the network will be significantly reduced.
Sentinel nodes are a good approach where the clients have enough space to keep both blue and green versions of the software together with an update package. Unfortunately, especially at the lower levels such as IoT and sensor networks, the hardware nodes do not have enough storage capacity. In this case, the proposed enhanced blue/green approach is not feasible, and the additional backup nodes will be introduced (
Figure 9). The backup node is a device with a larger storage capacity and better communication bandwidth that allows storage of at least two versions of the software together with an update and roll-back package.
As mentioned previously, since this case does not allow the possibility of having two versions in the same client node, downtime during the update is unavoidable. The update process on the single client will consist of stopping the previous version, replacing it with a completely new set of files, and then running an updated version. If the error is detected on the client node after the update, the backup node will trigger the roll-back process. In this scenario, the backup node handles the complete update process and takes care of the order of the update. The backup node will choose which client nodes will be first to receive an update and then will take care of the update sequence. Moreover, if the feature flag approach is possible, the backup node will take control of turning feature flags on after the deployment.
In both mentioned approaches, one problem that could lead to the downtime of the complete system is the situation when the server needs to be updated and the process itself is such that the server will be offline. Moreover, if the server needs to restart, the same problem will appear. To avoid this problem, the introduction of the message queue is the desirable technique whenever it is possible—at IoT and MES levels. Having a message queue between clients and servers will make client operations possible when the server is not active. Message queues could be implemented in the client nodes or as part of the server. Moreover, in lower layers, it is common to implement a joint message queue for the set of client nodes. Message queues will collect and send messages to the server once they become active again. Clients will detect that they are disconnected, but using the message queue will allow them to have at least some operations active and possible. Full functionality will be restored when a server is online again.
4. Results and Analysis
The main goal of this research was to define a deployment strategy, followed by custom-built monitoring and deployment tools, which will make the update process easier and more effective. This paper, tending to present the first results, is focused on different deployment strategies and their combination into a hybrid approach. The presented approach is not to look at the different deployment strategies as opposing, but to consider them together as complementary and thus use the best features from each of them.
The term “easier” used in this paper is related to the more ergonomic deployment environment that will allow the administrator to easily identify potential problems and react faster. The next steps in the development will include more intelligent system responses that will automatically trigger maintenance actions. The dark method with feature flags is the main paradigm that helps in this sense. The possibility to revert the functionality to the previous version in the runtime, without additional downtime and network traffic that would be required with the hard roll back, is the main contribution to the “easier” roll back.
The term “more effective” is used in the sense that the proposed approach should reduce downtime whenever and wherever possible, to try to eliminate data loss and reduce the potential traffic peaks in some segments during the update and roll-back processes. This updated efficiency and reduced data traffic peaks are paid for by the potentially longer update period.
4.1. Effects on Server Nodes
To achieve the research goal, the decision was to replace the standard update strategy. The standard update strategy is defined by three basic steps—copy the updated version to the destination node, stop the current version, and run the updated version. This strategy is replaced with a new hybrid approach where different scenarios are active in a slightly different configuration.
Defining a common node structure (
Figure 6) made an initial step toward the deployment process standardization and made the transition from the standard deployment towards a hybrid approach at the node level via a basic blue/green strategy possible (
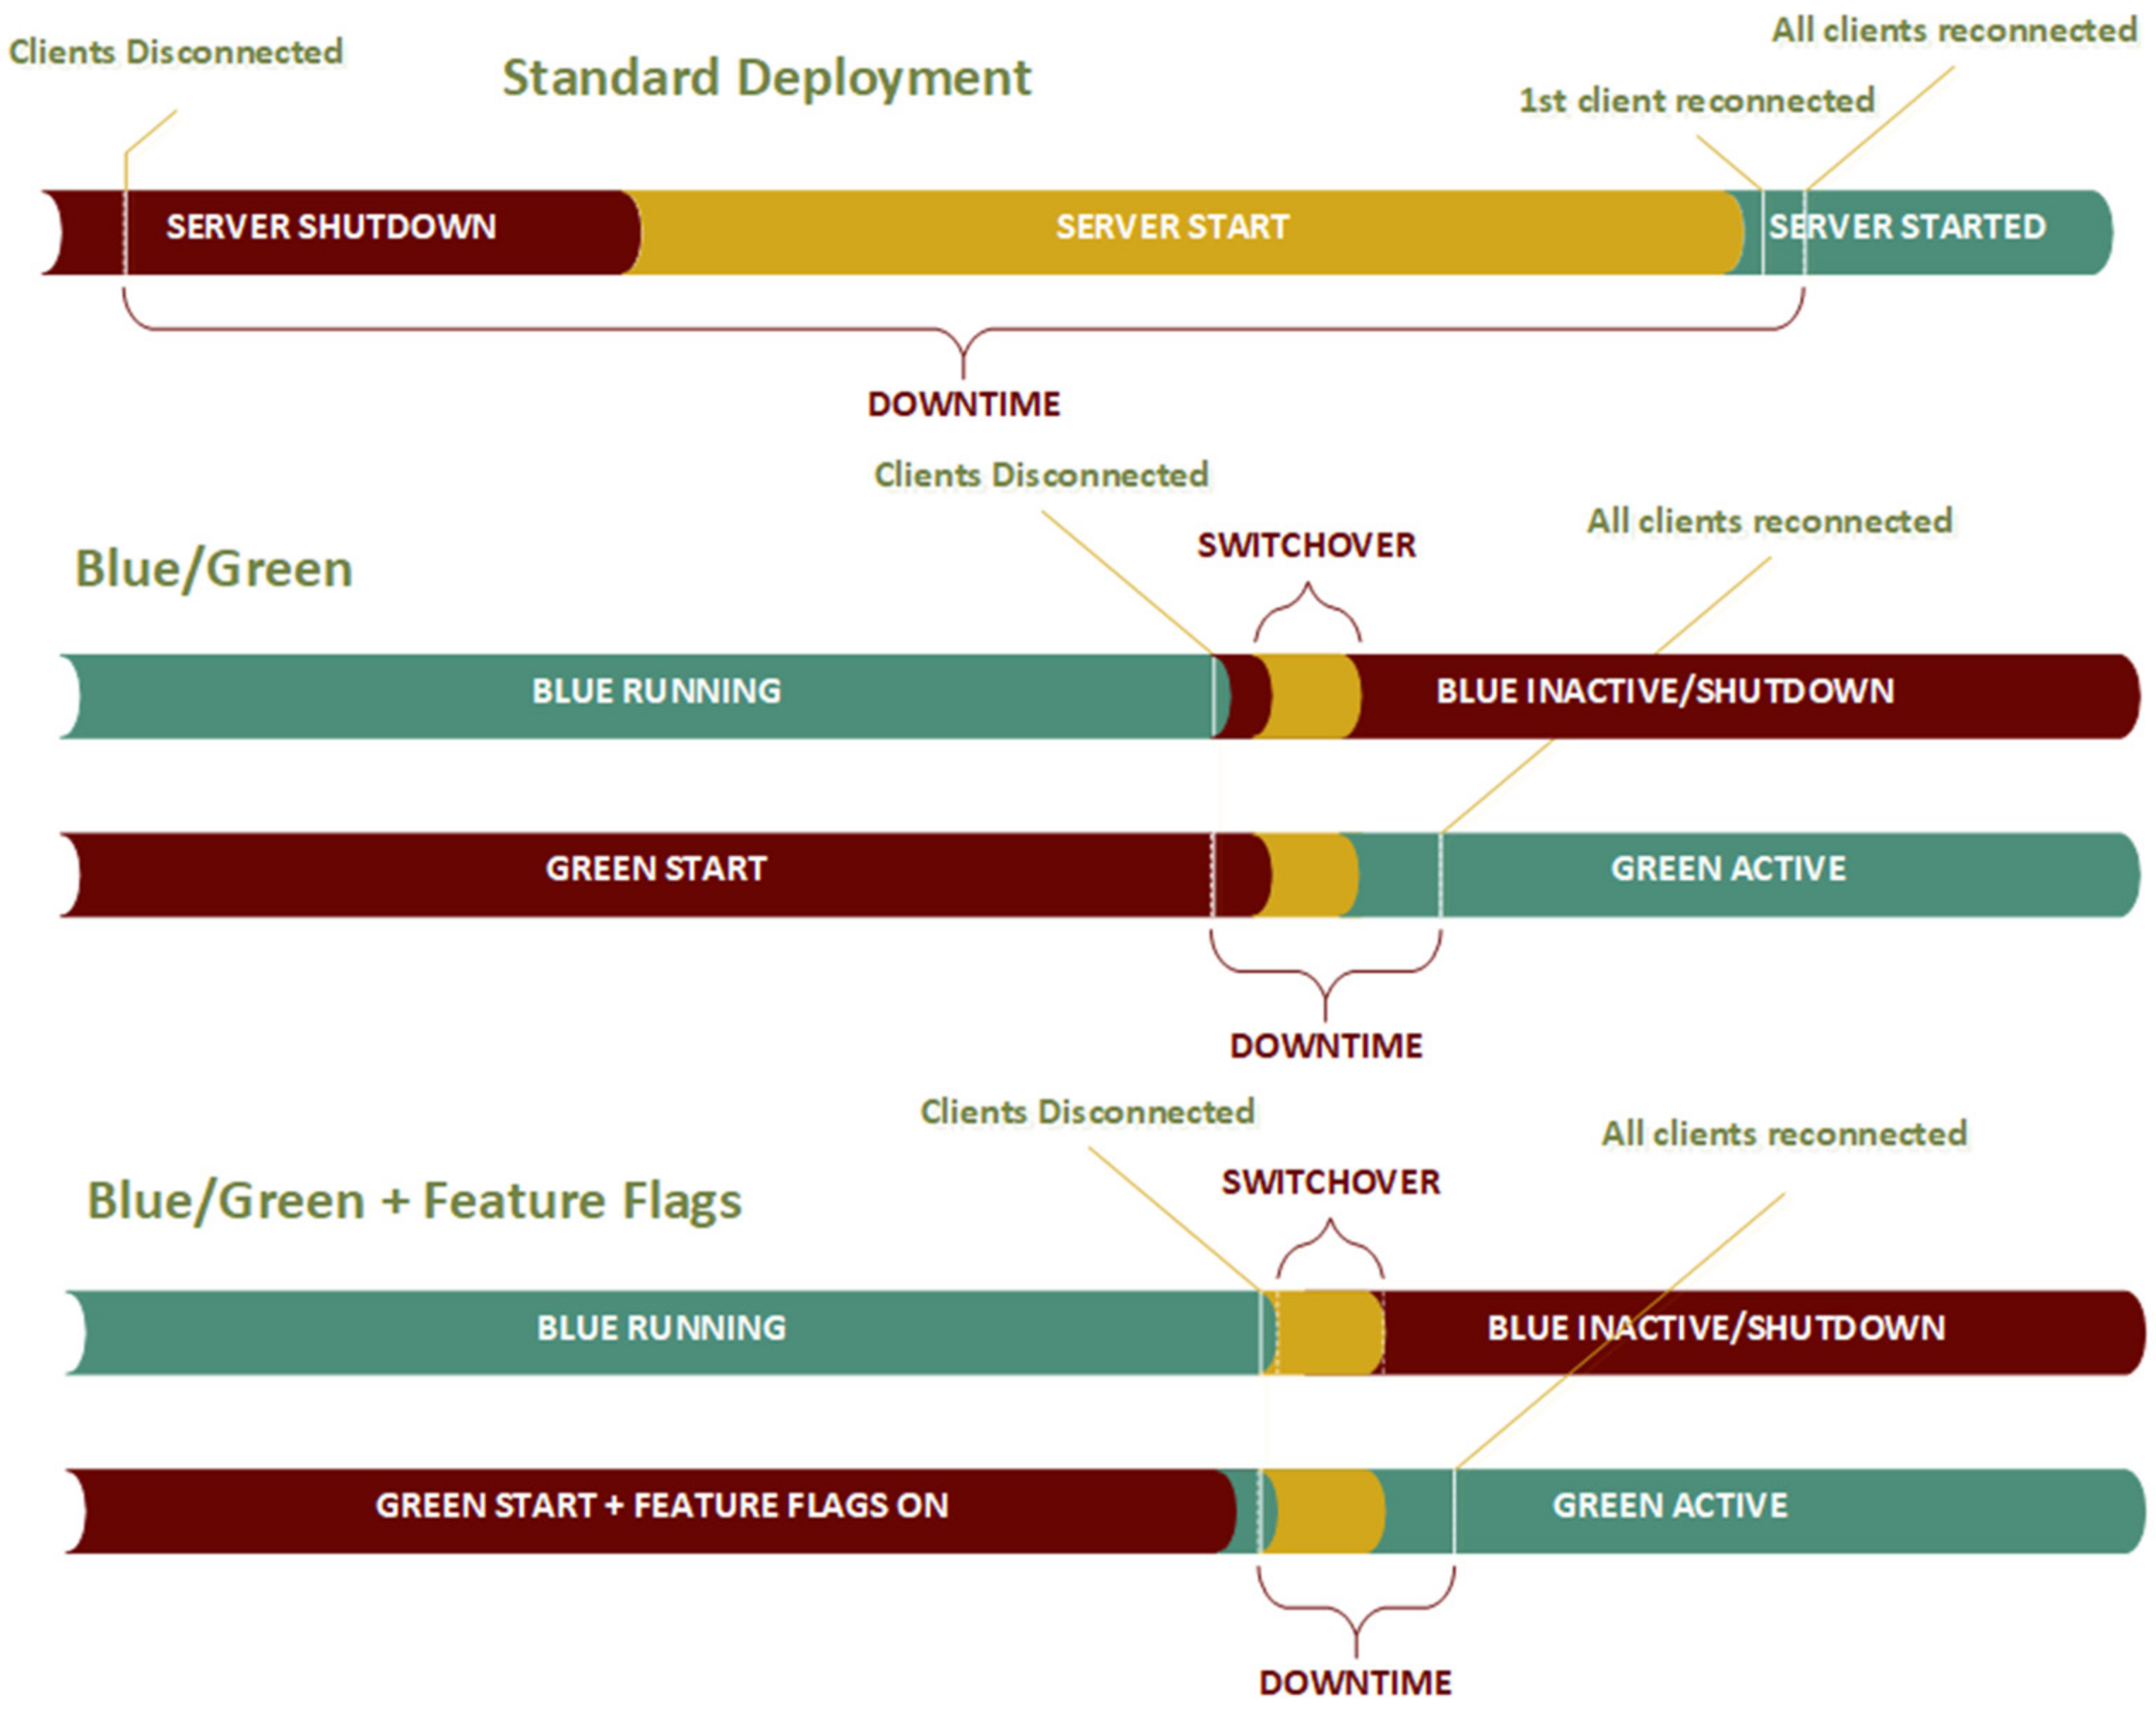
Figure 10). Standard deployment leaves the system in disconnected mode for a long time. The downtime period itself is calculated simply as the difference of average moments where all clients (n—total number of clients) are reconnected after restart (CR) and the moments when the client is disconnected (CD), as in the following:
The moment where client disconnection is detected could also be looked at from the server’s perspective and this is the moment where, in shutdown procedure, communication services are terminated. From the server’s point of view, the important moment is when the first client has connected again. This is the moment when the server could verify that it is again able to exchange data with the clients. For this paper, more important is the measure from the client’s point of view since it gives a feeling of the system downtime that is closer to the customer’s perception.
To reduce the described downtime effect, blue/green deployment is an often-used approach. In this case, the downtime is limited to the switchover time, the period after clients are disconnected from blue (lead-in part of the downtime), and the period when the clients establish the connection again to green. A switchover routine run by a separate piece of software is used to handle state change both for blue and green instances. In this scenario, clients are only aware of connection and disconnection events and look to the server as a single node.
By enabling feature flags, the downtime period could be reduced further, and this makes an important contribution to the hybrid approach. Since communication services could be treated as the feature of the software node, the green instance could be running before the switchover starts. In this case, the switchover routine will trigger communication to start on green and communication to close in blue which would reduce the lead-in part of the downtime period. The additional update, which is a part of the future research that could reduce downloads further, could be implemented on client nodes. Client nodes could ping the green instance immediately after they lose connection to blue and within milliseconds reestablish their operation. This update would require additional programming effort, but the downtime on the client-side will then be close to 0, leading to better customer satisfaction.
The effect of the blue/green approach at ERP levels is displayed in
Table 1. In both cases, the architecture is a standard client/server where one server node is connected to several dozens of clients. The used test environment had one ERP connection server followed by 320 clients. For the testing, clients were grouped into groups of 20, where each group belonged to the same network segment. The servers were in an isolated firewall-guarded network with traffic control. The overall access time between groups of clients and the server is not equal, and in some cases, data packets travel through the different setup of network devices between the client and the server.
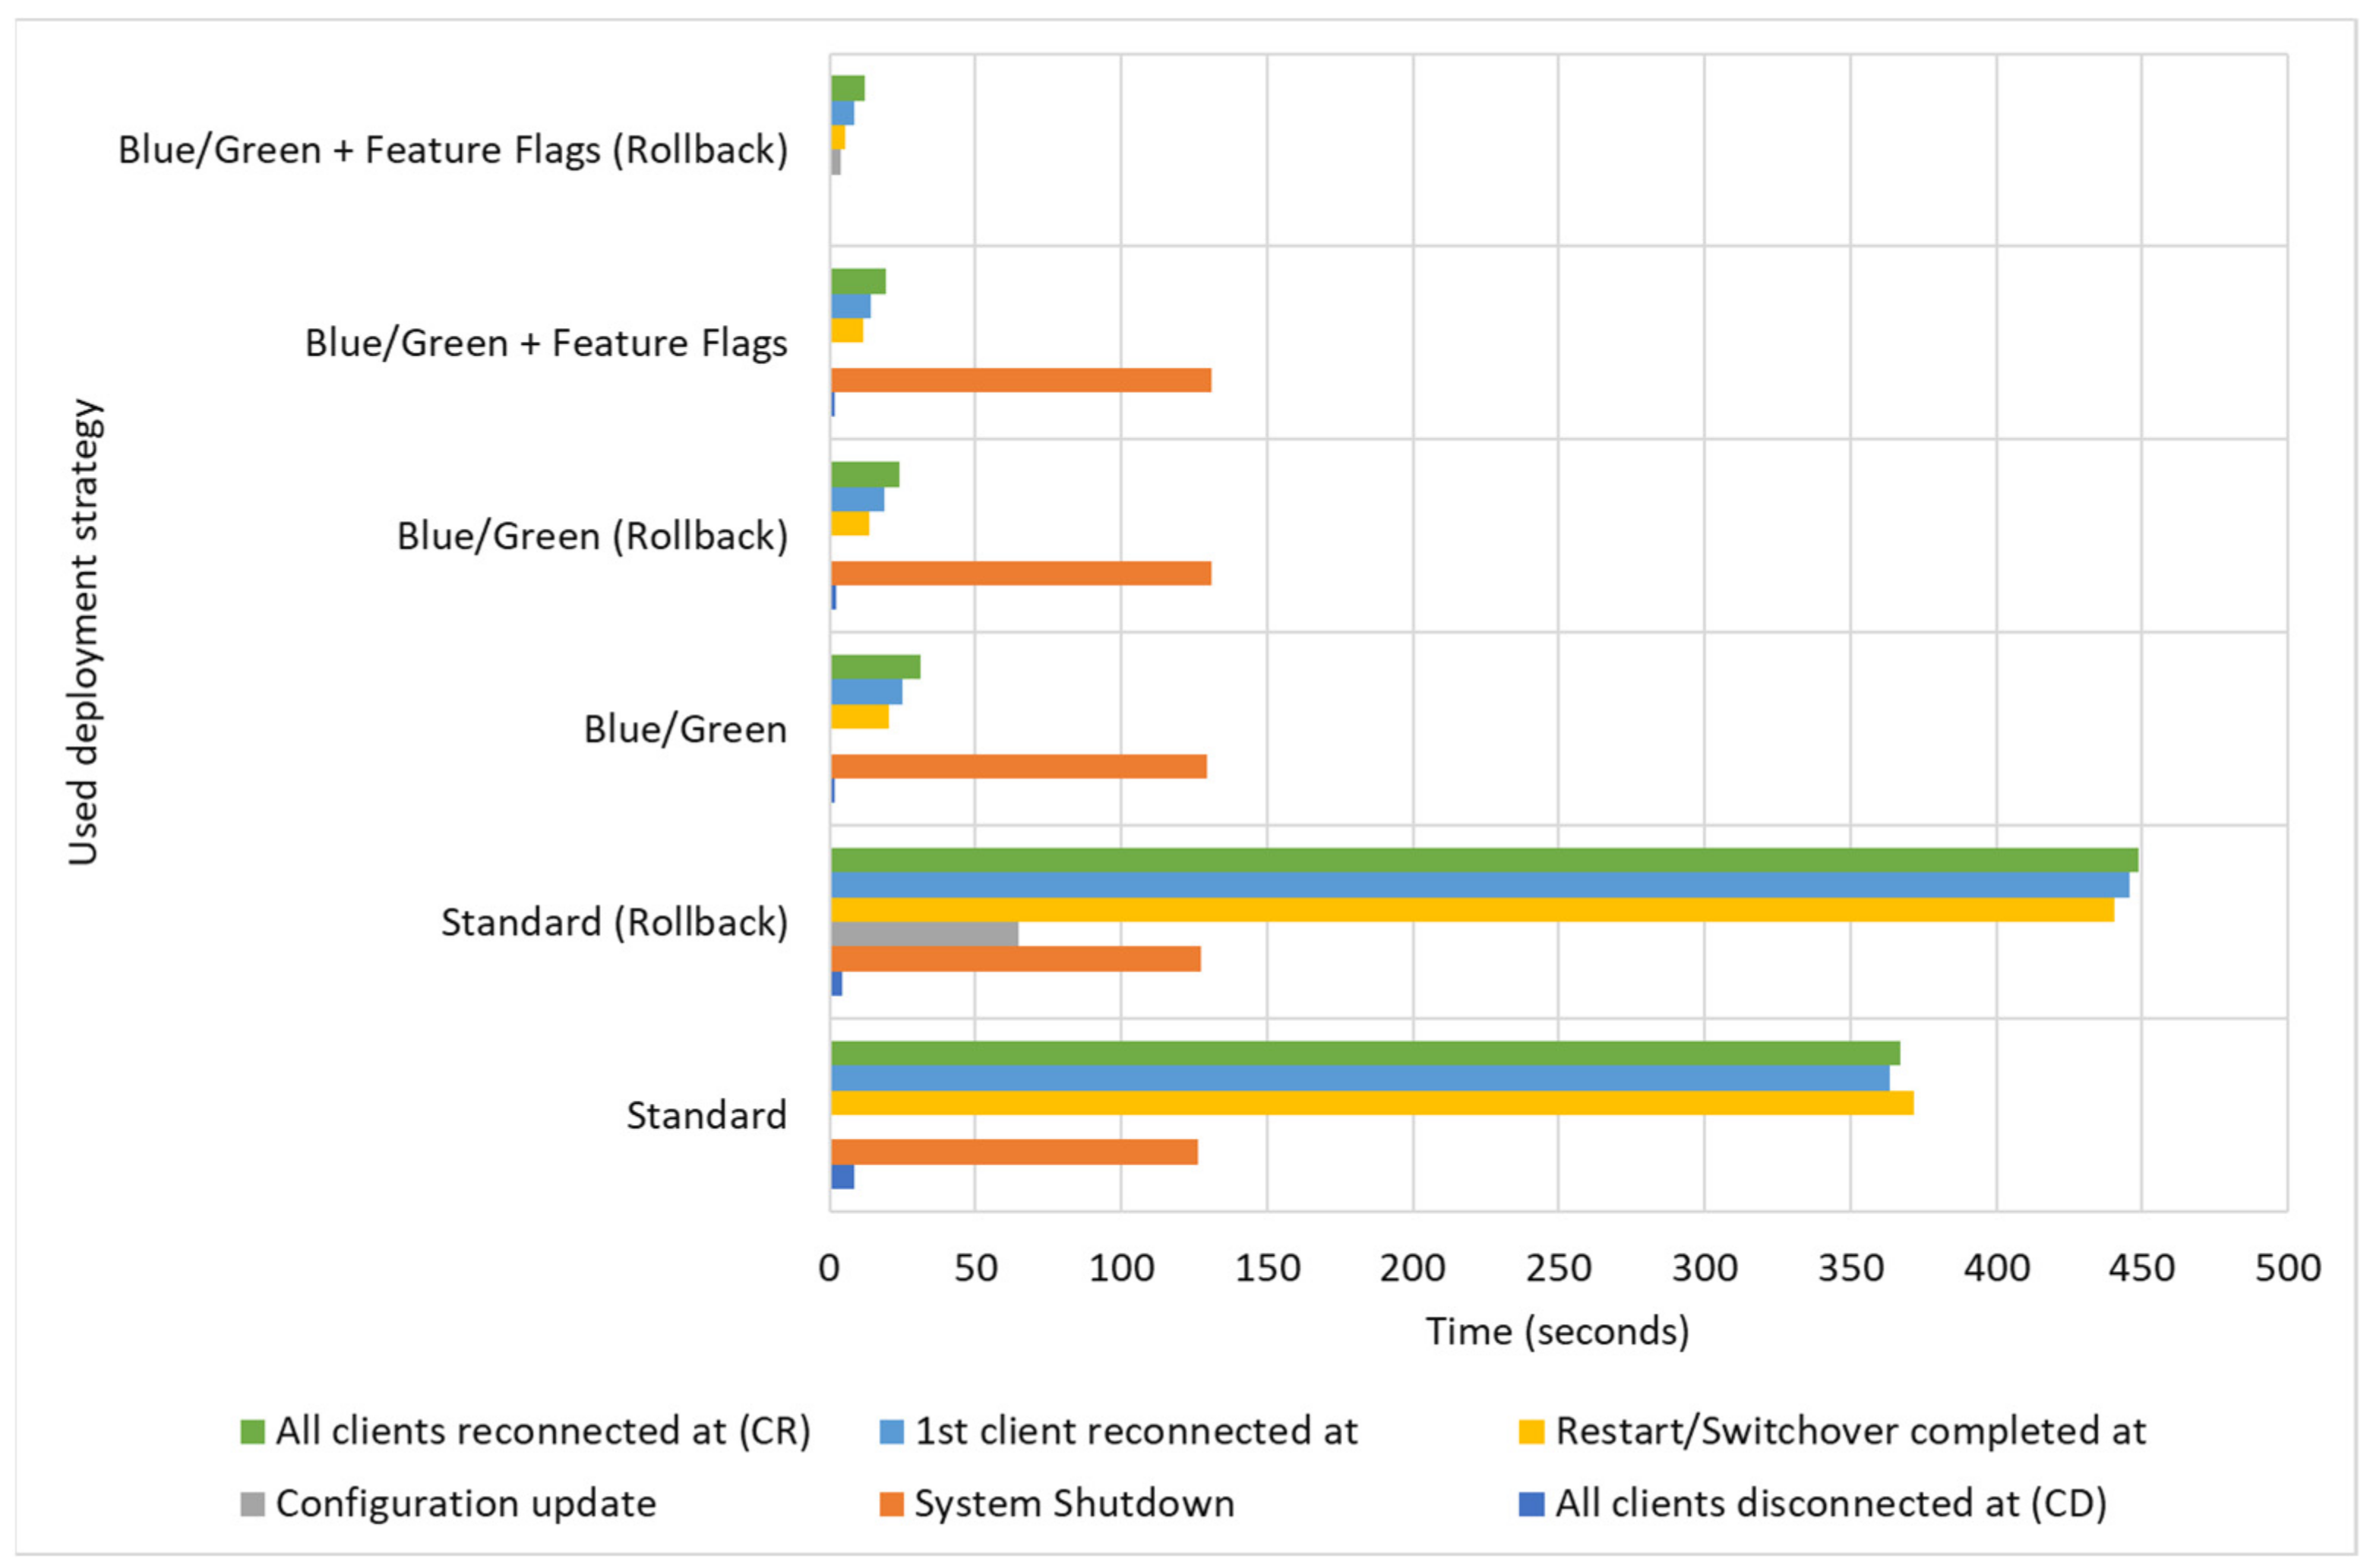
With the standard approach, server shutdown starts at some point, and soon after (on average, after 8.30 s), clients are disconnected from the server and the downtime is counted from this point. After both shutdown and start processes are completed, the system is back online when the SERVER_STARTED signal can be detected. This happens after 371.58 s (about 6 min) on average. Then, the clients need to reestablish the connection, which requires approximately 10 s more. Then, the average downtime for the server update is more than 6 min (372.35 s (about 6 min)).
With the proposed update, total downtime is reduced to less than 20 s (17.72 s). The main gain is that the time for the previous version’s shutdown and the start of the new one is not accumulated. The updated version is started while the old one is running. The critical moment is the communication switch. The communication switch starts now when the new system becomes active. After this point, clients are disconnected after no more than 2 s, and this point represents the start of the downtime (on average, this happens 268 s (about 4 and a half minutes) after the restart process begins).
Activating the updated version and communication switch takes around 10 s, and after approximately 278 s (about 4 and a half minutes), the updated version fires the SERVER_STARTED event. All the clients become connected again in less than 20 s after the moment when they become disconnected. In this way, the downtime is reduced more than 18 times, and the complete process could be considered almost transparent for the client nodes. In this scenario, the effect of the dark deployment with feature flags is seen in the slightly higher startup time, since their implementation requires an additional core module that needs to be started early in the loading sequence (131 vs. 126 s (about 2 min)) and without the possibility to be loaded simultaneously with other functionality.
A more complex case occurs when the problem is noticed and when the system needs roll back (
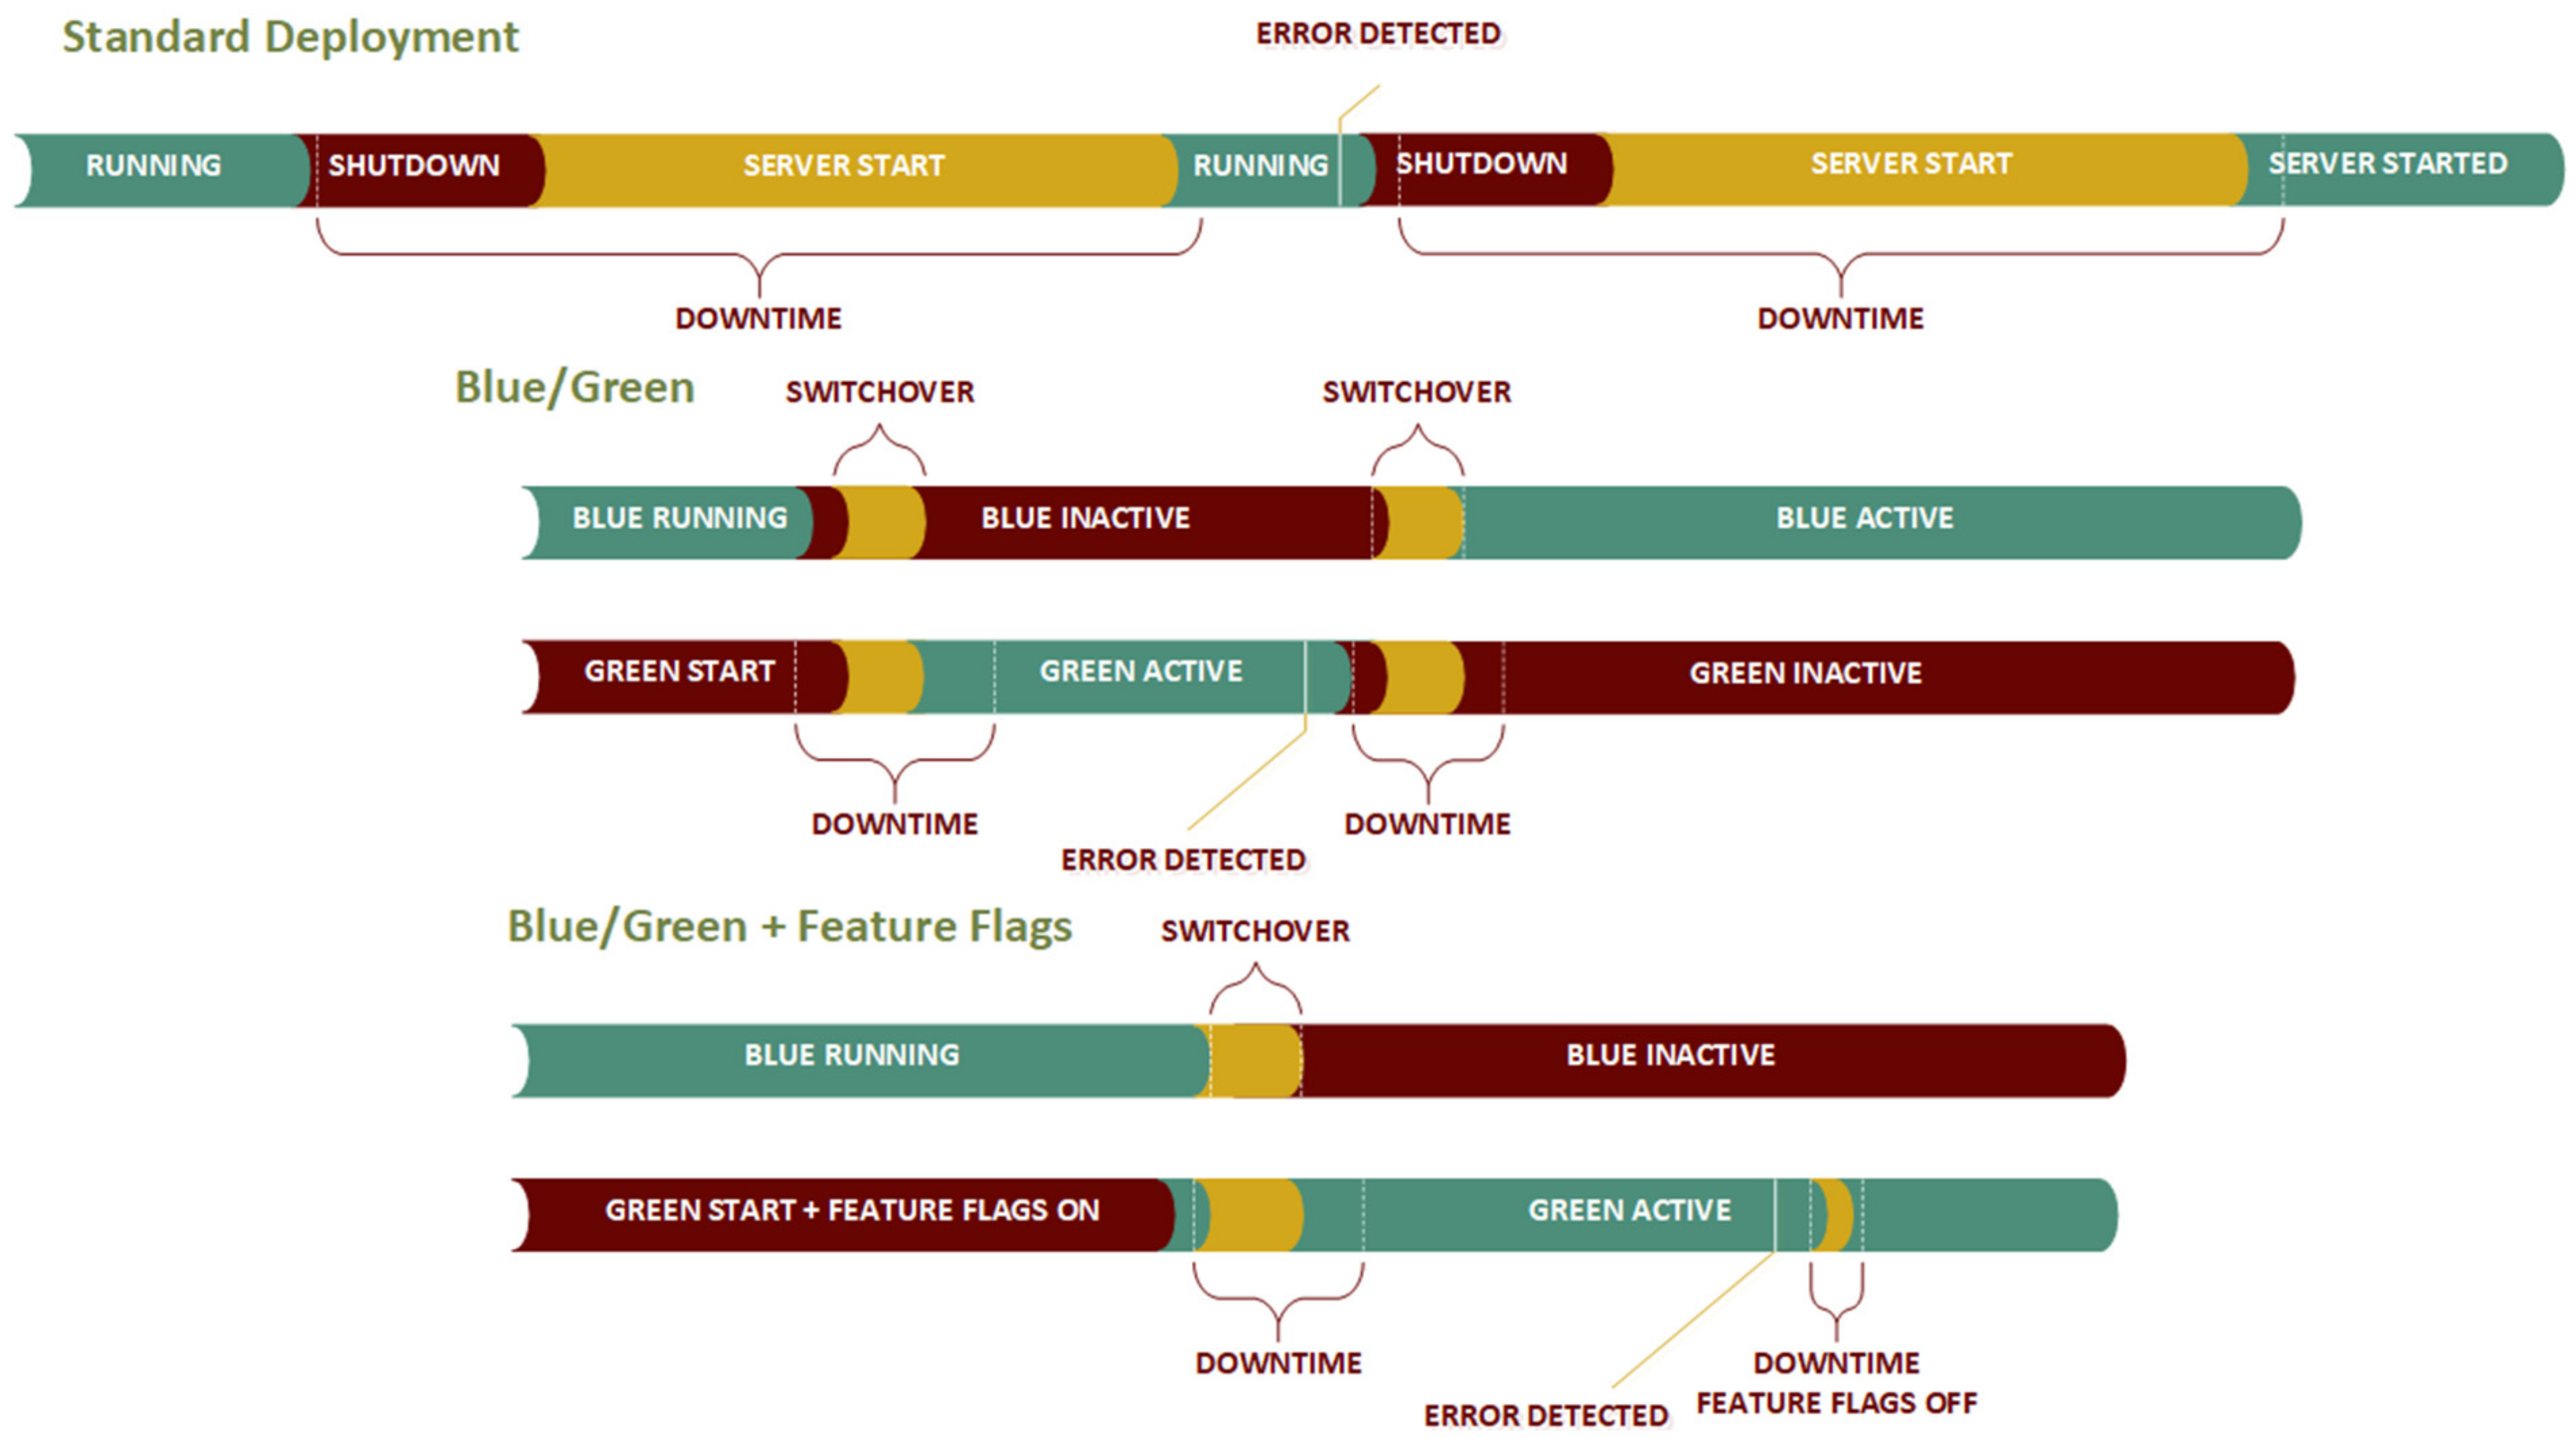
Table 2). The roll back in the regular case requires system shutdown, configuration update back to the original, and the server restart in the sequence (
Figure 11). With the addition of the time needed for the client reconnection, the total downtime is easily raised to more than 7 ½ minutes. If it is considered that the regular update happens before the erroneous one, the total accumulated downtime for the deployment and roll back is almost 15 min, which is, in some environments, close to unacceptable.
The roll back in the case of simple blue/green deployment is slightly higher than in the case of the upgrade. The additional time to update the configuration is not needed, but the total switchover time consists of client disconnection and synchronization switchover. In the average case, this is slightly under 14 s. If the time needed for the client reconnection is summed up, it could be concluded that it is a few moments more than 24 s. Combined with the initial system update, the total downtime, in this case, is around 42 s. Compared with almost 15 min in the initial case, it is a little more than 5% of the initial time.
Looking at the process when a system upgrade is followed by the detected error (
Figure 11), the standard approach is proven to be the least effective. Total downtime is twice the time needed for restart, increased with the time needed for the configuration restore. Standard blue/green reduces the time needed for the configuration restore since the blue version is ready to be reactivated, thus the total downtime is twice that of the case of a successful update. In the case when feature flags are used, the roll-back time will be further reduced only for the time needed to switch the new features off. In this case, green will continue to run, and clients would not need to have a long disconnection period.
Enabling the dark method with the feature flags will reduce the switchover time in the roll-back case even more. In this case, the switchover to a new software instance will not be needed. The only action needed by the deployment engineer is to turn the feature flags off and eventually wait until all the clients are reconnected. Depending on the nature of the change, the total time needed is the time needed for the configuration update increased by the time needed for client reconnection. In the worst-case scenario, this time is close to 12 s, which is 50% of the time needed for the clear blue/green deployment (
Table 1). The total time needed for the update and the roll back combined is under 30 s (29.86 s), which makes only 3.62% of the time needed with the standard approach—820.98 s (about 13 and a half minutes).
The proposed effect is suitable for the server nodes and makes their update and roll-back processes significantly more effective than in the case of a regular approach (
Figure 12). The analysis of network traffic does not apply to the server nodes, since only one software instance needs to be uploaded at once. Server nodes have enough storage space to keep multiple instances of the software packages, so the analysis mentioned is irrelevant.
4.2. Effects on Client Network Nodes
Traffic analysis is more than relevant in the case of client deployments. First, the update package needs to be distributed to each client. Then, this updated package must be unpacked, and the version needs to be updated. This update process looks like the one from the server nodes, the only difference being that clients sometimes do not have enough space to keep multiple versions. For the client deployment, the following cases will be considered—standard approach, canary with sentinel, and canary with backup node. The difference between canary with sentinel and canary with backup node is the fact that in the latter one, the clients do not have enough storage space to store more than one version of the software.
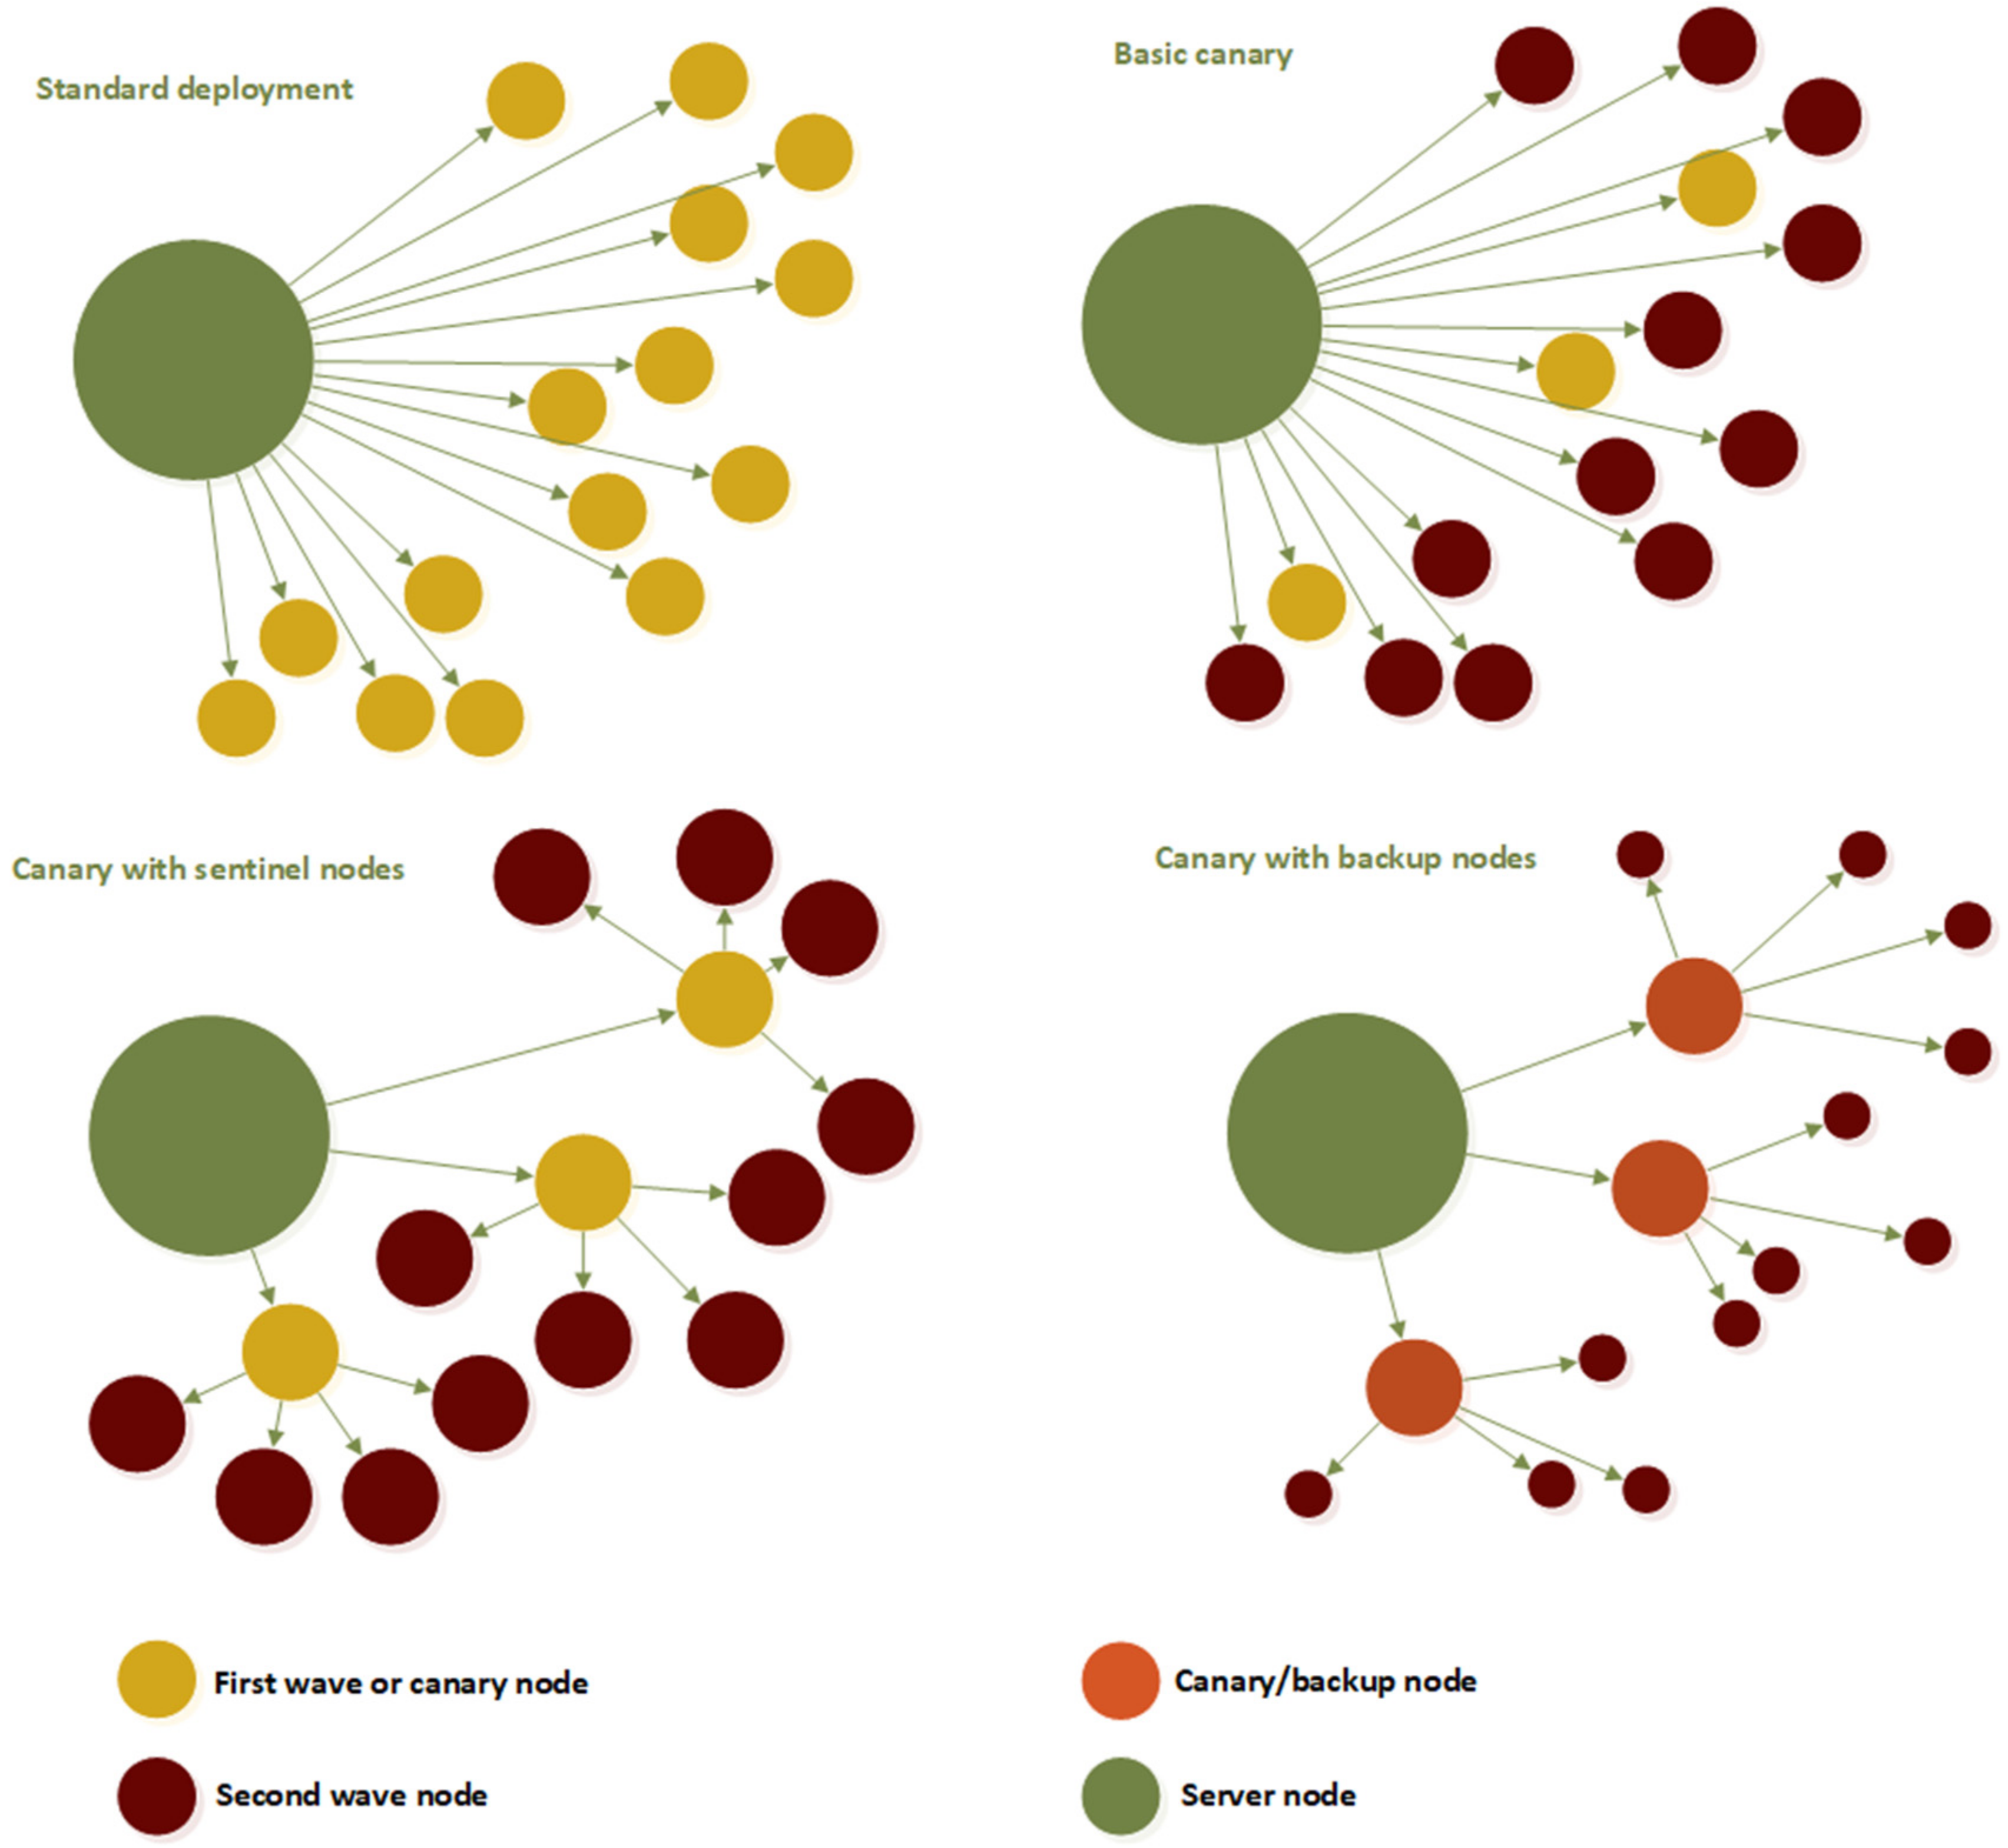
For this research, four variations of the test client network are used (
Figure 13). The test is, at first, conducted with standard deployment where all nodes are updated at once. The second experiment was to run deployment in two waves using the basic canary approach—first, the subset of 20 nodes is updated, followed by the remaining 300. The third scenario is based on the usage of canary networks with the sentinel nodes. Sentinel nodes will be updated first, and they will handle the update for the nodes in their subnetwork. In this scenario, all the nodes are equal by their structure and capability, thus sentinel node could be at any moment replaced by some other node from its network.
The same idea is used in the fourth scenario, where backup nodes replaced sentinels. The major difference in the third and fourth scenarios is that nodes in the fourth scenario are considered less capable than the backup nodes and they are not able of supporting the proposed common node structure but only keeping one version of the software at a given moment.
For the test, the environment configuration with 320 clients was used. The test environment is generated as the 4× multiplication of the real environment as in
Figure 8. In standard deployment, they are not grouped at all. In canary deployments, they are grouped in buckets of 16 clients. This makes 20 client buckets. The average client update package size is considered to be the file of 50 MB of data.
In scenarios with standard and sentinel approaches, all the clients’ nodes are the same, while in the configuration with backup nodes, the backup node is a more capable hardware node in terms of storage space. Regarding deployment configuration, clients in canary with sentinel are supported with both blue/green deployment and dark mode with feature flags. In the configuration with backup nodes, the full set of deployment approaches is applicable only on backup nodes, while other clients are capable only of the standard update (
Table 3).
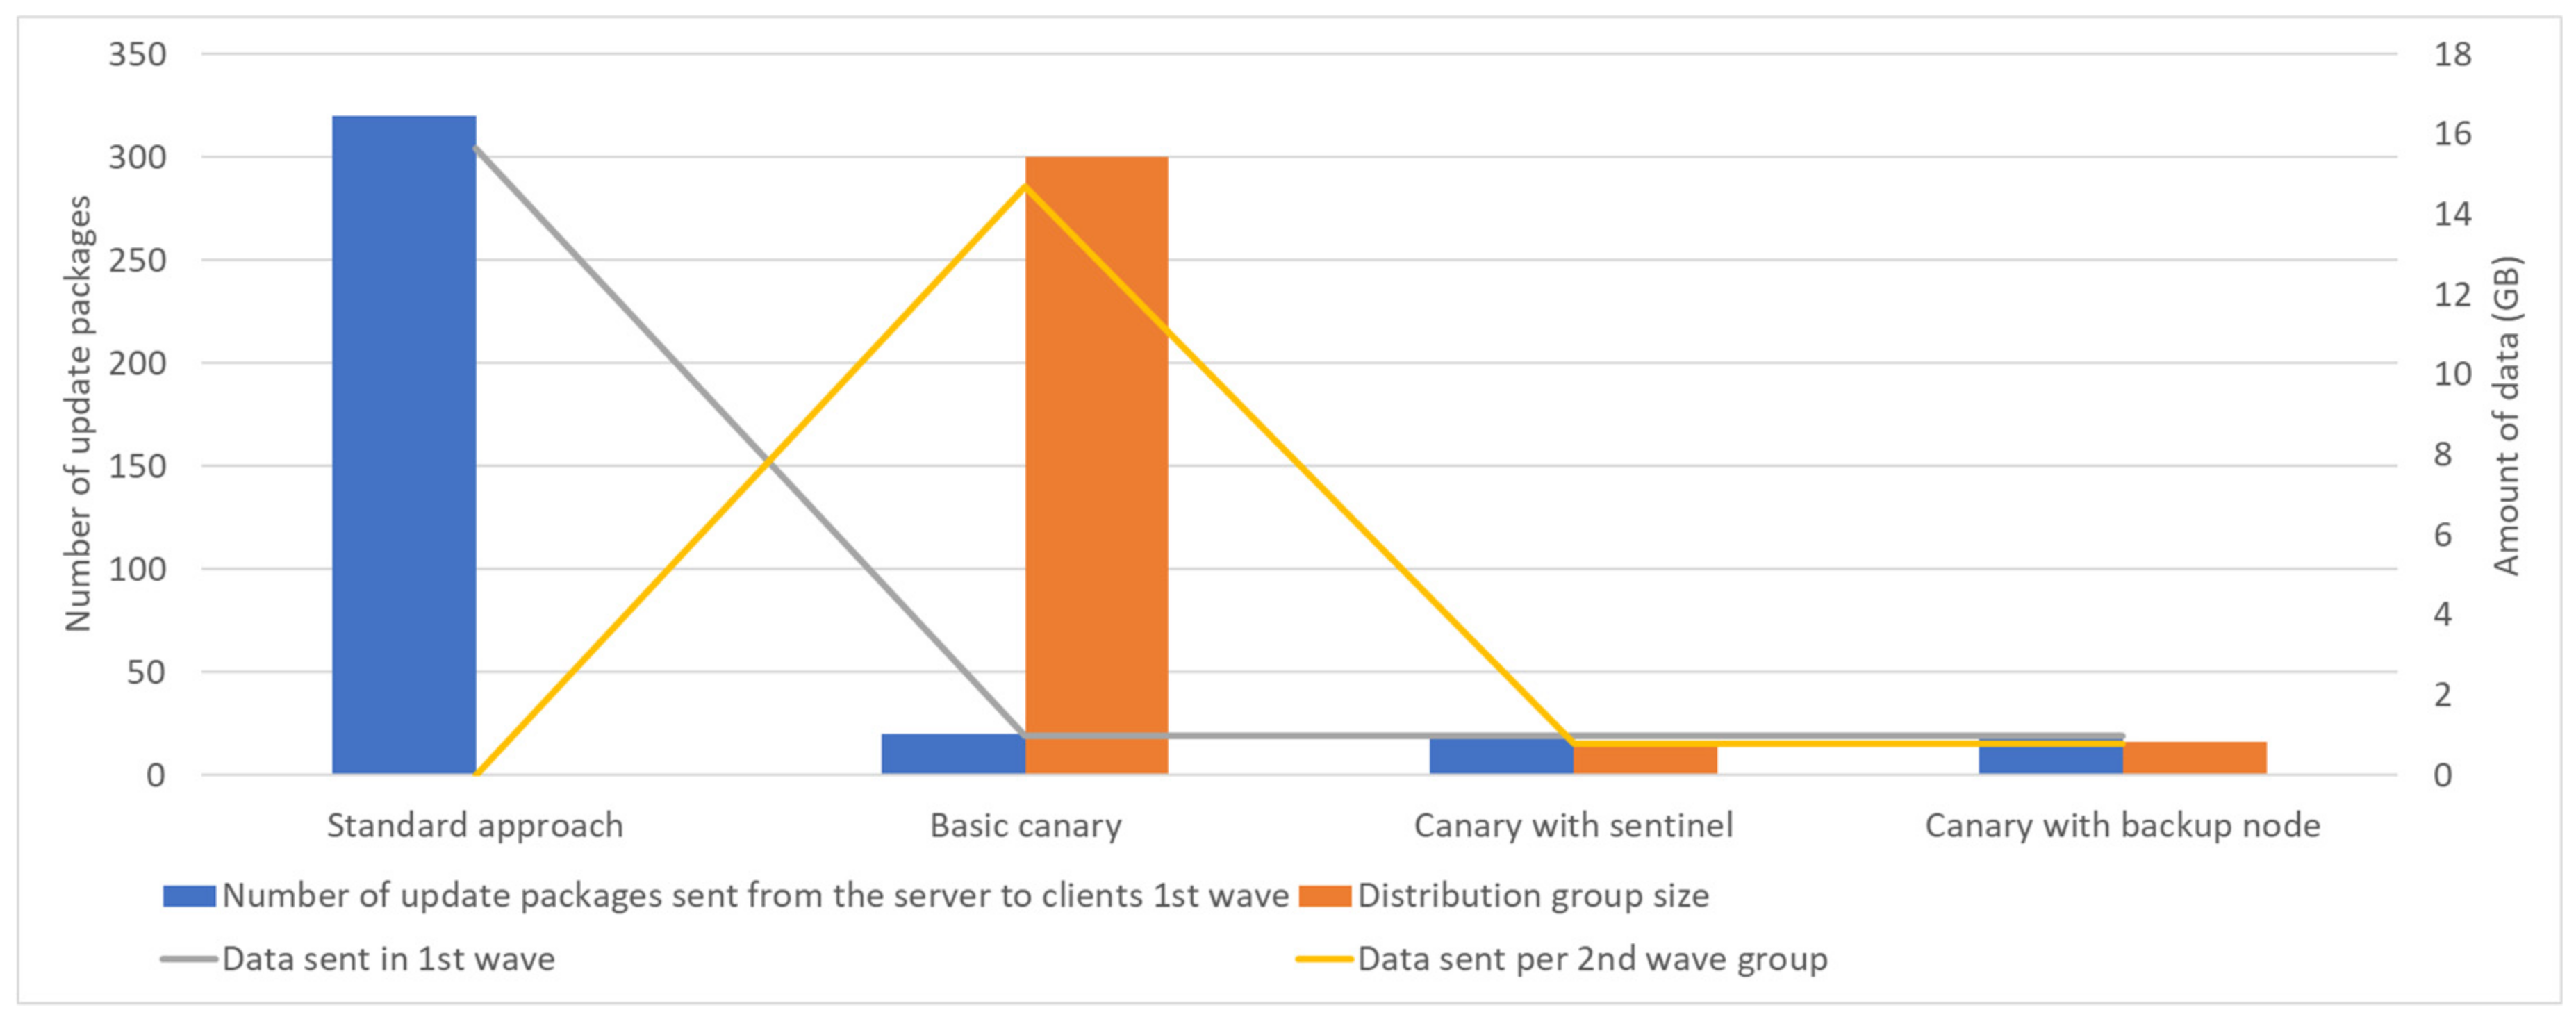
Looking at the number of the emitted updated packages and the total amount of distributed data, these numbers are equal in all four scenarios. A total of 320 packages are sent over the network. With the package size of 50 MB, it makes the total amount of transferred data 15.63 GB. The distribution of the update packages is the point that makes the difference (
Figure 14). In the standard approach and basic canary, update packages are emitted from a single spot, making a massive impact on data traffic and causing a high network load. Since, in practical deployments, this update distribution node is usually a server node, the effect on the complete system performance is obvious. Thus, there is update package distribution to sentinel or backup nodes for the second wave of the client. In this scenario, the server will send less than 1 GB of data to the first wave canary nodes, and then each of them will send 0.78 GB of data within its subnetwork.
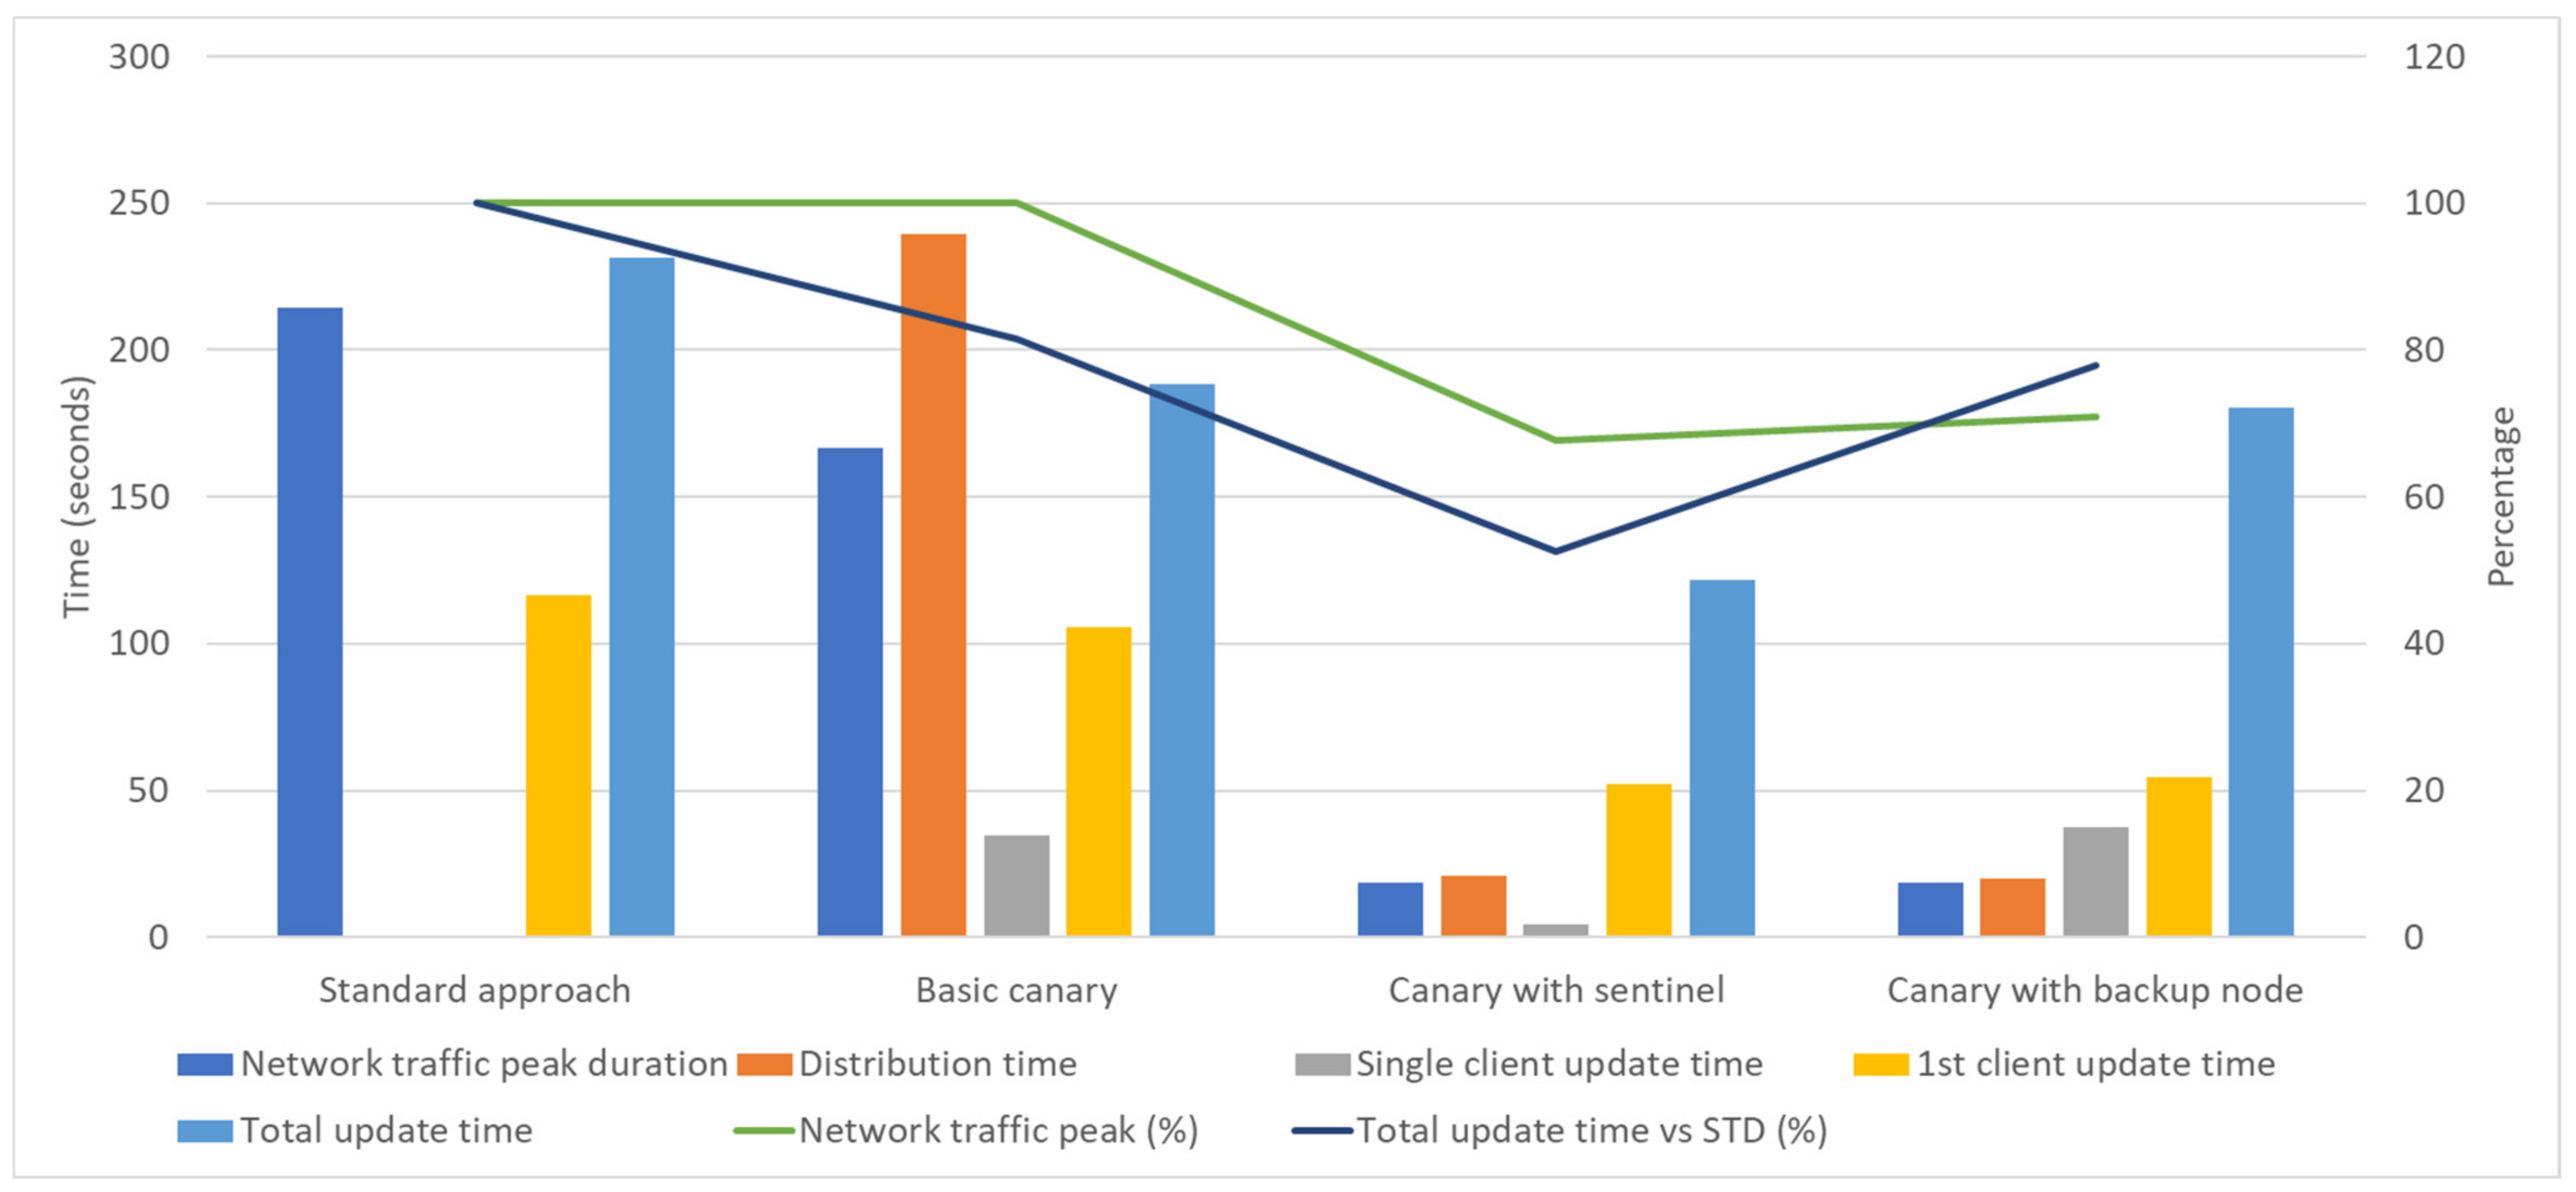
This will help to reduce network peaks duration, distribution, and total update time needed (
Figure 15). In the controlled environment, such as a test network, a network peak of 100% was detected in the server node and lasted for more than 3 ½ minutes for standard deployment and almost 3 min for the basic canary approach. In the remaining two cases, with sentinel/backup nodes, the highest network peaks were around 70% and lasted less than 20 s.
Distribution time decrease is the collateral benefit of the introduction of sentinel nodes and network traffic reduction. The time needed for the basic canary or standard approach is somewhere between three and four minutes, while for the updated canary scenarios, the time is on the level of 20 s. Another significant improvement is the time needed for the first node to report back with the updated version. For the updated canaries, this is at the level of 50 s, while for the basic canary and standard deployment, the value is raised to 2 min. Here, it is important to point out that the time for the client to report back is the time needed to upload an updated version combined with the time for a software switchover in the client node. Wherever it is possible to implement a common node structure, the switchover time was under 5 s, while for the nodes without this possibility, version change was between 30 and 40 s.
Having this in mind, it can be concluded that the most effective deployment environment is the one with the sentinel nodes. Using this approach, the effect of the network bottleneck will be avoided, which is not possible when using the standard approach. This effect causes the most delay in the standard deployment process. When the server emits update packages, the network becomes overloaded for some amount of time, causing the prolonged execution of software updates.
With the updated canary approaches, the 100% network peak is not present since the total amount of emitted data is only 1/20 of the amount of data with the initial approach. Further update package distribution is conducted in the client network where sentinel and backup nodes coordinate updates within their groups. Distribution time is close in the configuration with sentinel and backup nodes. The difference is evident in the total update time. In the configuration with backup nodes, there is no possibility to implement the blue/green approach in all clients, but only in backup nodes. Thus, the update for the remaining client instances must be as in the standard deployment approach and will consume a significant amount of time.
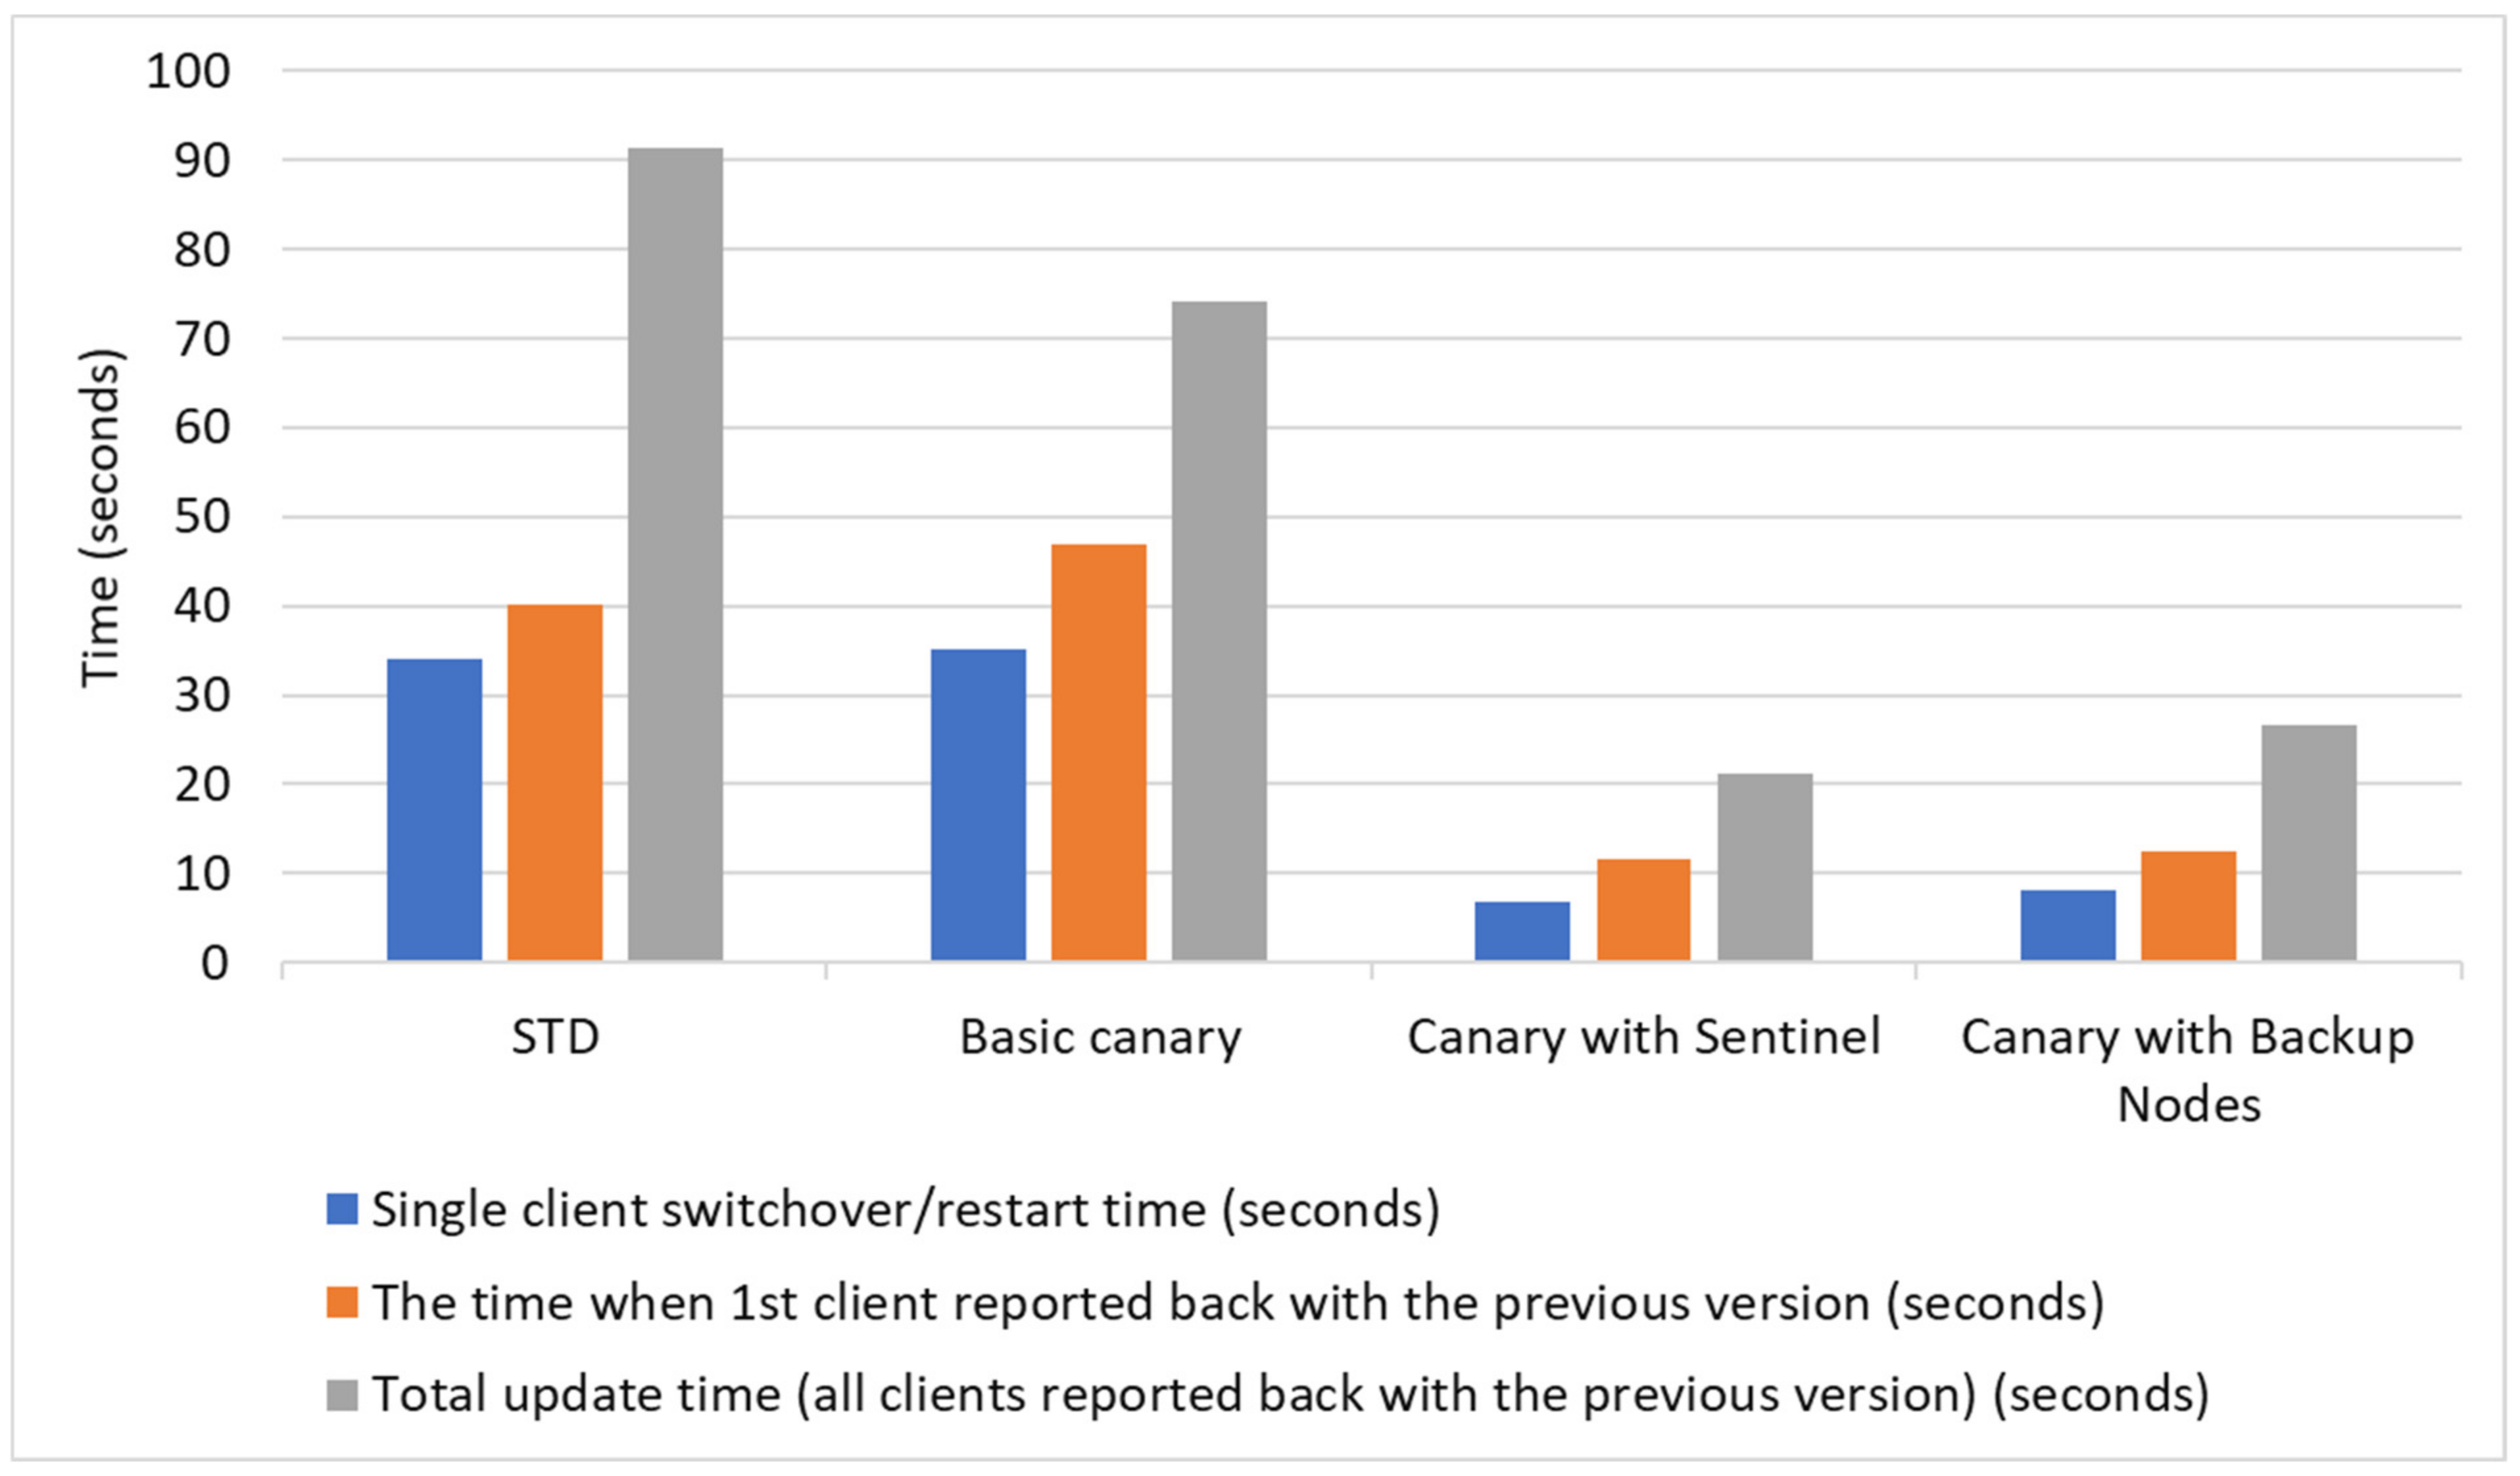
The results for the case when the roll back is needed are shown in
Table 4, and their comparison in
Figure 16. The results may vary depending on the node structure used for the test. If the hardware has enough storage and processing power to bear the general node structure as proposed in this research, the overall switchover time will be significantly lowered. The application of the blue/green strategy enhanced by dark mode and feature flags was discussed in the previous section and the same conclusions apply to the client nodes. In the presented research, the only scenario where the proposed node structure is not applicable is the canary with backup nodes. By design, this approach is used where there is no possibility to secure the necessary number of nodes with a higher capacity.
The immediate advantage for the clients who have enough storage space is the fact that there will be no need to re-emit update packages from the server. In the standard approach, the client will just shut down the current version, and start the previous one. In the other three cases, only roll back will be needed in sentinel/backup nodes while the other clients will not be affected since they will stay with the old software version. Thus, in roll back, none of the nodes will send additional packages for the update.
The total required time where all clients return to the previous version is just above 90 s (1 and a half minutes), while the time needed for full roll back with sentinel and backup lead client networks is 21.19 and 26.72 s, respectively. This is on the level between 20 and 30% compared to the initial strategy.
5. Discussion
The immediate benefit of the blue/green approach is instantly visible on every level and every type of node. Whenever it has been applied, the downtime is reduced from the amount needed from software restart time (shut down + start) to the communication switch time. With this approach, it is safe to let the previous version run until the updated version is updated and started. Once the updated version is started, the communication needs to switch to the updated version. During this process, the previous version will go to the disconnected state and then later will be shut down. At the same time, the updated version will become active and take over the functionality. Enhancing the node with already implemented blue/green with the feature flags and dark launch approach is a step further. With this combined approach, the lead-in part of the downtime will be reduced, and the complete switchover will be more effective. The combined approach is applicable both on the server and client nodes with proven effects. One conditional downside of the introduction of such a deployment scenario is a need for additional software deployment since the complete software segment related to feature flags must be carefully designed and implemented alongside the other features.
If the blue/green update process is applied to the server node, the downtime will be in seconds, rather than minutes. For the clients, the same scenario will result in similar downtime. Depending on the implementation, active client connections could be transferred from the previous version to the new one and in this case, the additional downtime for the clients is close to nothing. On the other hand, if this is not possible, clients will become disconnected when the previous version goes offline and will then be connected again when they become able to ping a new running instance of the server process. The total benefit is significant since the complete process looks seamless from the client’s point of view. A potential loss of data is also reduced due to the lower communication downtime.
Any deployment scenario, but especially blue/green, could be further improved by adding message buffers between clients and the server node. If the client comes with the implemented message queue, this will collect messages that should be sent from the client to the server until the server is down and, theoretically, no data loss will happen in the client-to-server communication. This is one of the directions for future research and experiments with diverse types of message queues could help in achieving better performances under different environmental conditions.
As has been mentioned before, the dark method with feature flags is used in the proposed hybrid deployment solution as the extension of the blue/green deployment, and it applies to any kind of software node. The effect of this method is not that visible during the regular deployments mostly during the roll-back process. Once the software instance gets switched from the old to the updated version, all feature flags will be disabled, and the system will operate with the same configuration. Feature flags will then be activated, and the system behavior will be monitored. If some problem appears, the feature flags could be disabled, and the system roll back, in the ideal case, will be conducted without another software restart. With this approach, the roll back is switching the feature flag back to the initial state.
The dark method with feature flags applies both to the server and client nodes with equally favorable effects. Rolling back to the previous version without software restart is especially important for the clients at lower levels, such as sensor nodes. These nodes usually operate on batteries in a remote environment, and the amount of power needed for the transfer of the updated version and software restart is higher than the amount of energy they need for regular operation. The possibility to avoid node restart when a roll back is needed will significantly save the battery power and the node will not be at risk of remaining without the power in the middle of the update process.
Blue/green and dark mode deployments are mostly related to the updates of the single nodes. For the update scenario for large client networks, canary deployment is a well-known and widely used method. It proves its worth even in its basic configuration, but with the proposed updates based on the introduction of backup and sentinel nodes, its potential is increased. The possibility to send the update to the initial set of nodes is used for the final verification before the full set of clients becomes updated, which is the strongest advantage of any canary deployment. To make the set of canary nodes more representative, the clients should be split into logical groups, and one of the nodes should be promoted to the sentinel node. This node is chosen heuristically and it should be a genuine representative of the whole group. Usually, the node would run most of the updated functionalities, so the results will be relevant. The sentinel node could also be used as the distribution node that will trigger the update within the same group. In this way, the server will not have the traffic peak when it comes to the client update process. The server will distribute the updated version to sentinel nodes, and sentinel nodes will distribute updates within their group.
In cases when the clients are limited with space and where it is not possible to store two versions of the software simultaneously, the backup node will be used as a concept that will replace the sentinel node. The backup node will take responsibility for the update distribution. It will choose the initial node for the software update (choose its canaries), enable feature flags, and then follow up the update to the other nodes.
During this research, the proposed approach was tested in level 4 and partly level 3 applications—ERP and MES. The applications running to these two levels are closest to most of the users and they work in an environment where networking the bandwidth and the storage space in a single node is not so problematic compared to sensor networks (level 1) and IoT (level 2) nodes, where the challenges are different as has been explained in [
53]. In any case, we hope that the described approach is general enough that it could be used in every layer with a slightly different setup of the elements used. Our parallel research shows the expected results in the lower-level nodes [
34]. The current conclusion could be represented by the scheme of the usage of different strategies according to the software level, as has been shown in
Table 5.
The blue/green is the major choice for any server deployment. Server nodes are not numerous in the overall network, so the number of software uploads will not be high in any case, which means that the problems with the data traffic should not appear. Next, wherever it is possible, the strong suggestion is to include a dark mode with feature flags. Due to the technology limitations, the proposed hybrid strategy was used in MES and ERP clients in the current test deployment setup.
Bearing in mind the complexity of server-side software in levels 3 and 4, one potential direction for future work is the introduction of microservice architecture; the introduction of microservices at least on levels 3 and 4 will be considered. Microservices will be a crucial step forward since they allow deployment of the updates to the isolated part, without affecting the rest of the system. The complete microservices structure consists of several independent microservices, unlike the standard server architecture with a single service loading multiple modules. In the case when one microservice crashes, it will not cause the general failure of the total system. Since the erroneous service is isolated, the rest of the system will continue to run. Microservice architecture has higher fault tolerance and faster recovery compared to the standard system. The cost of microservice introduction is increased complexity needed for orchestration and interservice communication.
The overall analysis of the potential benefits is shown in
Table 6. There, the total number of nodes in the network is defined as NN, while the number of nodes in level 1 is marked with N1. One level 1 node is usually used as the sentinel/backup node for a single level 2 group. Sometimes, this is not the case, and thus the number of level 2 groups could differ from N1. This value is marked with G. This could happen when multiple groups have one sentinel node due to the network topology, or where one level 2 group could have more than one sentinel/backup node.
These values are important since they are used to estimate the number of client uploads within the complete network as well as its segments and subsegments. Moreover, with a knowledge of the size of the updated package (IS, in the calculation table), it is easy to further calculate the network traffic during the update process and to estimate the hardware requirements for the clients, server, and the network throughput.
Additional values that are important to measure the system behavior and to estimate potential downtimes are the values TD, TU, and TS which are, respectively, time needed to shut down the software instance, the time needed to start it up, and the time needed for the switchover between two software versions where the targeted node can run the software deployed in the blue/green or blue/green with the feature flags manner. The usual time needed for the node full restart is TD + TU, and if the possibility for the switchover exists, the time is TS.
With the standard deployment, the complete process is handled either by an engineer or as the scheduled task forwarded through the node network. The biggest possible problem is the possibility of human error during the update. For this reason, all well-known strategies require automatization. The automated set of steps reduces the need for intervention in most cases. The proposed hybrid approach is a step forward in this direction since the update is performed through the piece of software running in the sentinel/backup or the server node. This approach gives better control and monitoring, at the cost of the additional software development.
Regarding client networks, canary deployment is a safe way of ensuring fewer problems in the case of roll back. Depending on the computing power and storage space, the general suggestion would be to use a canary with a sentinel or a canary with a backup node. The latter one is used in the lower levels where space could be considered a significant issue. This strategy may be further improved by the research on more effective algorithms that should help when choosing the optimal representatives for canary, sentinel, or backup nodes.
6. Conclusions
Deploying software in a complex industrial system is a challenge since it should work with high reliability with the applications developed in heterogeneous environments and dedicated to different ISA-95 levels. Over the years, we experimented with many diverse and well-known deployment strategies, and the conclusion was that every strategy has its strengths and weaknesses. Thus, the decision to combine blue/green, canary, dark, and feature flag deployments into a synergistic system making a hybrid deployment approach was made.
Together with the hybrid deployment approach, we imposed the usage of the additional techniques to make a more error-proof deployment. These techniques assume the use of sentinel nodes and inter-level buffer. We suggest using this kind of buffer in the client machines whenever possible since this will reduce the data loss in cases where clients could stay disconnected for some period and where the loss of the collected data is not acceptable. In cases when the usage of the sentinel node is not possible, the application of the backup node is suggested.
Using the proposed hybrid strategy together with the additional techniques mentioned, we managed to reduce the downtime when the updated version of the software is deployed and reduce the effect of the high network load during the software update. The proposed approach gave the best effect for roll-back scenarios for server nodes—the downtime is reduced to only 3% compared with the standard approach. The improvement for the successful update is also significant and it is under 6% of the downtime when the regular approach is used. For client network updates, the best scenario is the use of the network of equal nodes where some of them are considered sentinel nodes. In this way, the replacement of the sentinel node is possible at any given moment. Downtime in this scenario is 50% compared to the downtime for the successful updates, and only 30% in the case when a roll back is needed. Network peak reduction is from 100 to 70% of network load, and the duration of network peak period is reduced from approximately 200 to only 20 s.
The proposed hybrid deployment scenario together with the common software node structure looks like a promising system that will be developed further and validated in a real production environment. The system is currently undergoing testing in the lower ISA-95 levels with promising results. The hidden cost behind the described concepts is the additional time needed for programming and verification. Fortunately, this cost eventually pays off since the lower downtime and stable production system lead to higher customer satisfaction and better overall software acceptance.


