1. Introduction
Computer networks have become more vulnerable to penetration and to exploits exposing information, due to the Internet being completely open to users. Recently, network attacks are becoming more sophisticated and harder the detect. The statistical studies according to the Symantec Global Internet Security Threat report indicate that intrusions are at record levels and are increasing drastically. Given the exponential growth of the dependence on data, algorithms for data protection from threats and attacks are greatly needed to preserve the privacy, confidentiality, availability, and integrity of information systems. Hence, intrusion detection systems (IDSs) are a vital tool for protecting data.
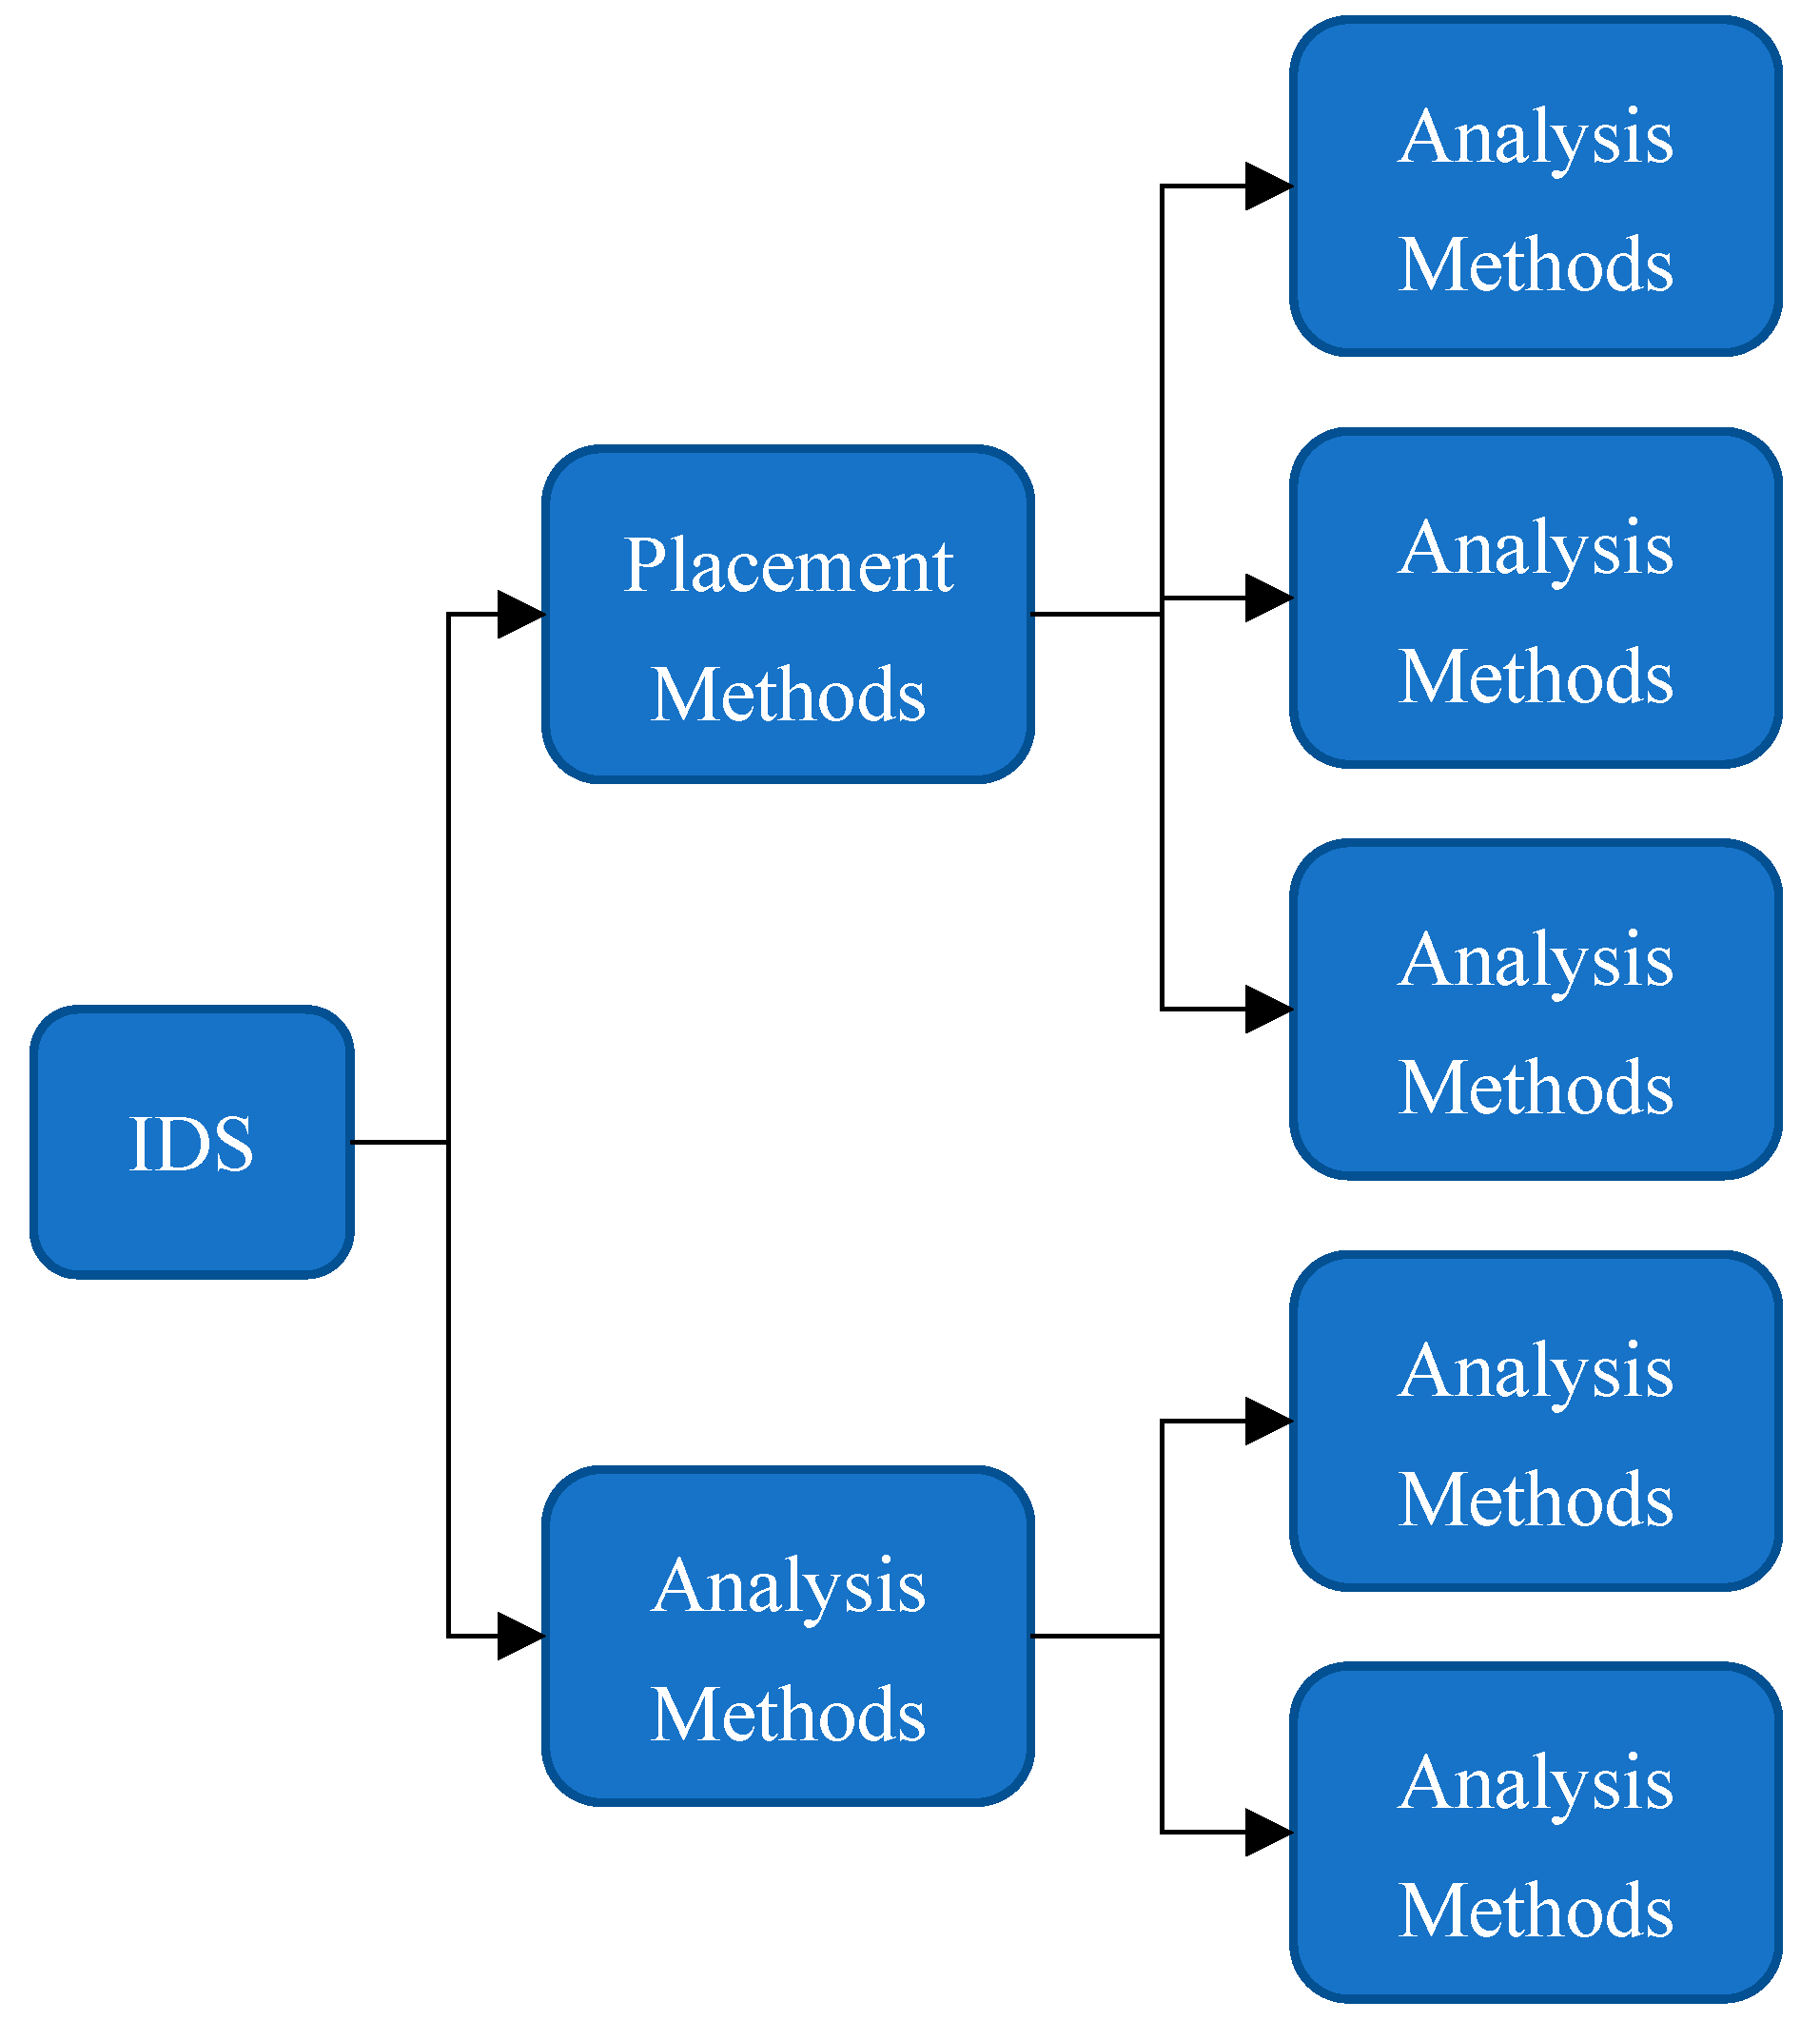
Figure 1 shows IDS categories. While detection algorithms only recognize well-known attacks, anomaly detection algorithms can recognize unidentified attacks according to users’ behavior. Two of the main issues with anomaly detection are speed and efficiency [
1]. If the network has high traffic, it is almost intolerable to utilize a fast sophisticated algorithm for intrusion detection (ID) in advance. Many new procedures achieve a good rate of IDS, but they need high resource allocation and are time-consuming (i.e., communication, memory energy, or another system requirement). These deficiencies may become even more complicated if the traffic is manipulated in real-time.
One of the secure design principles is defense-in-depth, which implies adding multiple security mechanisms to prevent, detect, contain, and recover from attacks. Security mechanisms such as access control, multi-factor authentication, and data encoding are being utilized to act as a frontline defense to prevent potential attacks [
2]. Protection procedures and tools, such as intrusion preventions, anti-viruses, firewalls, and IDSs, can monitor the activity of network systems to detect, prevent, and counter suspicious actions [
3]. IDSs enable the continuous monitoring of the network traffic to detect anomalous activity in the systems, which is considered a vital method to perform network security [
4]. The use of machine learning (ML) and statistical methods enable the building of an effective IDS to protect the networks [
5].
Due to advances in computer network technologies, people have relied heavily on network services to obtain information over the Internet. According to the statistics provided in information security, there are a large number of threats that affect computer systems and information. Therefore, defense mechanisms are continuously being developed to preserve the integrity of computer systems and networks to ensure the confidentiality of information. An intrusion detection system (IDS) provides a major role in protecting. An effective IDS enables the protection of computer and information systems from potential intrusions as well as helps detect intrusion and misuse. The process of detected system anomalies protects against potential new attacks or a zero-day attack, where anomalies are detected based on user behavior.
There are so many data mining techniques to classify the normal or abnormal behavior of a user. However, these data mining techniques have some limitations, so the main objective of the research is to reduce these limitations and improve the accuracy. The glossary zero-day attack was initially denoted to the day’s accounts since new software programs were publicly released, so the zero-day program is attained by attacking an inventor’s PC before the release. Previous studies presented several data mining (DM) techniques that are based on classifying user behavior, but they have some limitations, as this research provides solutions to reduce them and improve the accuracy of mining. The limitations related to the detection techniques are described as follows:
Efficiency and speed are the most main issues in anomaly detection systems. One of the problems is related to the traffic volume on the network, as complex detection algorithms cannot be used at an adequate speed if the traffic is high. Many theories of advanced algorithms that rely on a high detection rate were presented, but they are very complex to apply in practice.
The effect of missing data on the results obtained during classification. Accurate and reliable conclusions cannot be drawn if there are missing data that are important for feature selection during classification.
One of the most important limitations of intrusion detection algorithms is real-time traffic analysis. The information system is potentially exposed to an intrusion risk if the real-time traffic detection is inaccurate.
This paper provides a novel data mining (DM) technique for the IDS approach. The proposed technique is based on ML and hybrid algorithms, namely, K-mean for cluster formulation and sequential minimal optimization (SMO) for clustering and categorization [
6]. The contribution of this paper is in integrating the processes of SMO and K-means clustering approaches to enhance IDS performance, accurately identify new attacks, and increase detection rate [
7], in addition to reducing the false-positive alarm rate in real-time by taking advantage of attack patterns.
The remainder of the paper is organized as follows:
Section 2 discusses data mining techniques,
Section 3 discusses the related works,
Section 4 presents the proposed machine learning-based anomaly detection algorithm,
Section 5 illustrates the results and discussion, and finally,
Section 6 concludes the paper.
2. Data Mining Techniques
DM plays an important role in IDS and is used in different data applications. Mining techniques such as classification, association rules, and clustering enable users to make sense of information about intrusions by monitoring network data. IDS categories are based on their scope from standalone PCs to network systems. The most common categorizations are hosts-based IDSs (HIDSs) and network IDSs (NIDSs). The system that monitors significant files in OS is an instance of an HIDS, while the systems that examine traffic of the received network is an instance of an NIDS. The following paragraphs classify ID techniques used in DM applications [
8].
Classification is defined as the process of analyzing data by taking an instance of the dataset to be assigned to a specific class and extracting models known as classifiers that define important data categories [
9]. An IDS is a server or software program that screens and monitors network traffic for malicious activities or violations of security policies. The system, which relies on the classification concept, sorts network traffic into normal or malicious. The process of data classification is divided into two parts. The first part is known as the learning period, during which a classifier is created, and from it, the data categories are predicted in the second part, which is the classification step. In classification analysis, the end-user/analyst needs to know how to define the categories in advance.
In the classification process, the main goal of the classifier is to explore the data to discover the different categories, in addition to arranging the new records into the category [
10]. Many classification techniques are used, such as decision tree induction, genetic algorithm, fuzzy logic, and Bayesian networks-nearest neighbor classifier. In general, data classification techniques have a lower impact on ID methods compared to data clustering techniques, which have a great impact on the performance of IDSs. This is because of the high amount of data required to classify the dataset into normal and abnormal categories.
The clustering approach provides an easier and faster classification process than human labeling for a large amount of data. It enables the labeling of data and grouping it into similar objects. Each group is known as a cluster and consists of several members with similar traits, and the members differ from one group to another. Clustering methods can be useful for classifying network data to detect intrusions. There are several clustering algorithms, and they are divided into five groups as follows [
11]:
Hierarchical clustering techniques: This method creates tree-based structure classification from unclassified data assets. It can be developed with the assistance of statistical methodologies.
Density-based techniques: This technique strains the arguments of each cluster from a precise distribution probability. It can only be utilized for spherical-based clusters. The value of a density-based cluster considers the point’s density, where density arguments should be prepared before dataset scanning.
Grid-based techniques: The key benefit of this algorithm is its vast calculation time, regardless of the number of data cells. The object band is quantized into a predetermined number of cells.
Model-based techniques: This method calculates the greatest data fit based on the hypothesis model. The number of clusters based on statistical standards can be determined repeatedly. The algorithm may construct clusters based on a modeling density probability that imitates the distribution of 3D data objects.
Partition techniques: In this technique, for n points datasets with hypothesis k data dividers, each point should fit precisely one cluster, and each cluster should comprise at least one point. The dividing method enhances the reiterative re-partitioning method by removing points from one cluster to another. The method of data division relies on a specific partitioning function.
Table 1 discusses the differences and comparisons between these techniques. The importance of the table lies in defining the differences among the most-studied clustering techniques and their use in improving anomaly detection in recent years so that each of them is clarified by presenting the strengths and weaknesses against the used mechanism (K-means).
Clustering technologies detect complex intrusions over various periods and act as unsupervised learning mechanisms to discover patterns in multidimensional unpaired data [
12]. The patterns within the cluster are equivalent to each other but differ from one group to another. Therefore, the abnormal patterns indicate the occurrence of unusual activity, which may be pointing to the possibility of infiltration of the data or a new attack. The importance of using the clustering mechanism helps in discovering errors and misuse in addition to reporting the possibility of an attack.
3. Related Work
Previous studies presented several DM techniques that are based on classifying user behavior, but they have some limitations. This research provides solutions to reduce these limitations and improve the accuracy of mining. Some of the main limitations and challenges related to the detection techniques are described below.
One of the most important limitations of ID algorithms is real-time traffic analysis. The information system is potentially exposed to an intrusion risk if real-time traffic detection is inaccurate.
Efficiency and speed are the main issues in anomaly detection systems. One of the problems is related to the traffic volume on the network, given that complex detection algorithms are used at an adequate speed if the traffic is high.
The effect of missing data on the results obtained during classification. Accurate and reliable conclusions cannot be drawn if there are missing data that are important for feature selection when carrying out classification.
According to the abovementioned limitations and challenges, this section reviews a survey of various ID models and techniques. It also presents the methodologies used to develop the IDS and the latest updated models. A study by C. Taylor et al. [
13] proposed an approach known as the network analysis of anomalous traffic events (NATE), which is based on clustering and multivariate analysis. NATE can enhance the ability of IDS to deal with detection constraints and big data traffic [
14]. Moreover, NATE enables performance features of limited attack scope and anomaly detection, in addition to minimizing network traffic measurement [
15]. The NATE operation is based on two phases; the first is data collection and analysis for possible attacks, and the second is intrusion detection in the real-time environment [
16]. The NATE classification is a cluster-based algorithm The proposed study shows that the clustering approach enables quick updates of the new attack features for real-time traffic in the database [
17].
A. Bakhtiar and G. Antonio [
15] provided a production-based expert system toolset (P-BEST) to detect misuse attacks and develop a new signature mechanism. P-BEST can provide efficient IDS performance in a real-time environment [
16]. The proposed mechanism allows integration with c programming for flexibility and ease of use. However, it has a low detection capability of intrusions and attacks with incomplete and uncertain data or unknown environment information [
18].
C. Zheng et al. [
19] presented a framework for DM to build IDS models. The proposed framework enables the automatic use of the IDS model [
20]. The operations of the DM framework tiers are dependent on the ability of inductively learned computations related to relevant system features, raw audit data processing, and network-dumped data, which are all summarized into connection records and attributes [
21]. This approach applies two algorithms: association rules and frequent episodes [
22].
M. Saeed et al. [
23] presented the use of a decision tree for multiple host-based detector combinations. The proposed idea depends on the ID measures and decision tree. The measures are considered the basis of IDS modeling [
24]. The modeling measures are performed by the statistical rule-based method [
25].
Minegishi, T. et al. [
26]. presented a framework for data mining (DM) to build IDS models. Three tiers are reviewed data mining framework parties, classification, association rules, and frequent episodes programs. The proposed framework enables the use of the IDS model automatically [
23]. The operations of the data mining framework tiers are dependent on the ability of inductively learned computations related to relevant system features, the raw audit data processing, and the network dumped data, which are all summarized into connection records attributes [
23]. This approach applies two algorithms, association rules, and frequent episodes.
The author Minegishi, T. and his team also presented an anomaly detection system known as audit data analysis and mining (ADAM) in [
27]. The proposed ADAM uses data mining techniques for detecting intrusions. It combines classification and association rules algorithms for discovering attacks in TCP dump [
26]. ADAM can classify suspicious activities of known and unknown attack connections.
Barbará, D. et al. [
28] presented the use of a decision tree for multiple host-based detectors’ combination. The proposed idea depends on the intrusion detection measures and decision tree. The measures are considered the base of IDS modeling. The modeling measures are performed by the statistical rule-based method.
Another study presented by Zhang et al. [
29] provides a hybrid misuse and anomaly detection approach for NIDS. The study investigates the combination of two detection methods to reduce the limitations of both when they are considered individually. The proposed hybrid detection approach is evaluated as a technique for data mining intrusion detection for the random dataset.
In the study by P. Yuhuai et al. [
30], a method was proposed to improve the efficiency of the decision tree algorithm. They reviewed the operations of bagging and boosting and randomization techniques to generate various classifier ranges through training data manipulation. Z. Peng et al. [
31] provided the ability of artificial intelligence (AI) technology to enhance the accuracy of anomaly detection. The proposed study evaluates the use of semi-supervised learning and unsupervised learning techniques to detect anomalies. The authors used the K-means clustering approach and training instances through the Euclidean distance method and then evaluated the C4.5 algorithm [
32]. Their results showed that the semi-supervised training algorithm gives better performance than supervised or unsupervised algorithms.
V. Olena et al. [
33] designed an effective intrusion identification system based on the fuzzy logic approach. The proposed system enables the detection of intrusion behavior in the network. It uses a mechanical method to create fuzzy rules, which are obtained from specific rules using repeating elements [
34]. Through the results of the experiments, the authors concluded that the system based on fuzzy logic achieves a higher accuracy to determine whether the records are normal or offensive.
G. Azidine et al. [
35] proposed the use of two algorithms for ID: the backpropagation algorithm and C4.5 algorithm. In addition to dealing with known attacks, these algorithms are mainly used to detect misuse and determine the level of deviations in normal profiles. They can also explore algorithms based on supervised ML [
17]. The authors used KDD CUP99 databases and tested the datasets by the proposed algorithm containing several attack types, such as denial of service (DoS), investigation, user-to-root (U2R), and remote-to-local (R2L). Through the results obtained, the study showed that the use of neural networks provides high performance in detecting known attacks, but the use of decision trees gives a higher and more exciting performance when detecting new attacks [
36].
G. Mutanov et al. [
37] proposed a hybrid ML technique for network ID based on a combination of K-means clustering and support vector machine classification. This research aims to reduce the rate of false-positive alarms and false-negative alarm rates and improve the detection rate. The authors used the network security-knowledge and data discovery (NSL-KDD) dataset, and the classification was performed by using a support vector machine [
38]. After training and testing the proposed hybrid ML technique, the results showed that the proposed technique achieves a positive detection rate and reduces the false alarm rate.
In our work, a new anomaly detection with a hybrid DM algorithm is proposed, with the key aim of improving the detection rate and reducing the false-positive alarm rate. The study uses a dataset known as NSL-KDD to assess the hybrid K-means clustering and SMO ML technique.
4. Machine Learning-Based Anomaly Detection Algorithm
First, the idea of the normality concept is introduced to obtain a suitable solution for anomaly detection in the network. The idea of the normal is linked to the development of a formal model that clarifies the relationship between the basic variables related to the system dynamics. Accordingly, the degree of deviation that appears in the behavior of the system due to the detection of any event or anomaly is measured depending on the normal state model. Our methodology depends on using a new anomaly detection method based on K-means clustering and SMO algorithms [
39]. The detection process is tested in the online network to generate an appropriate number of detectors with a high detection rate and accuracy.
The proposed method is set to reduce the number of features by using feature selection algorithms in the preprocessing phase. The selection of particular features from the dataset is performed by applying consistency-subset level and genetic search algorithms. The selection method removes the irrelevant features before the cluster formulation and categorization operations and, subsequently, the K-mean cluster formulation process. The K-mean cluster formulation decreases the dataset training, processing time, and complexity. The classification process is based on SMO to enhance the detection quality.
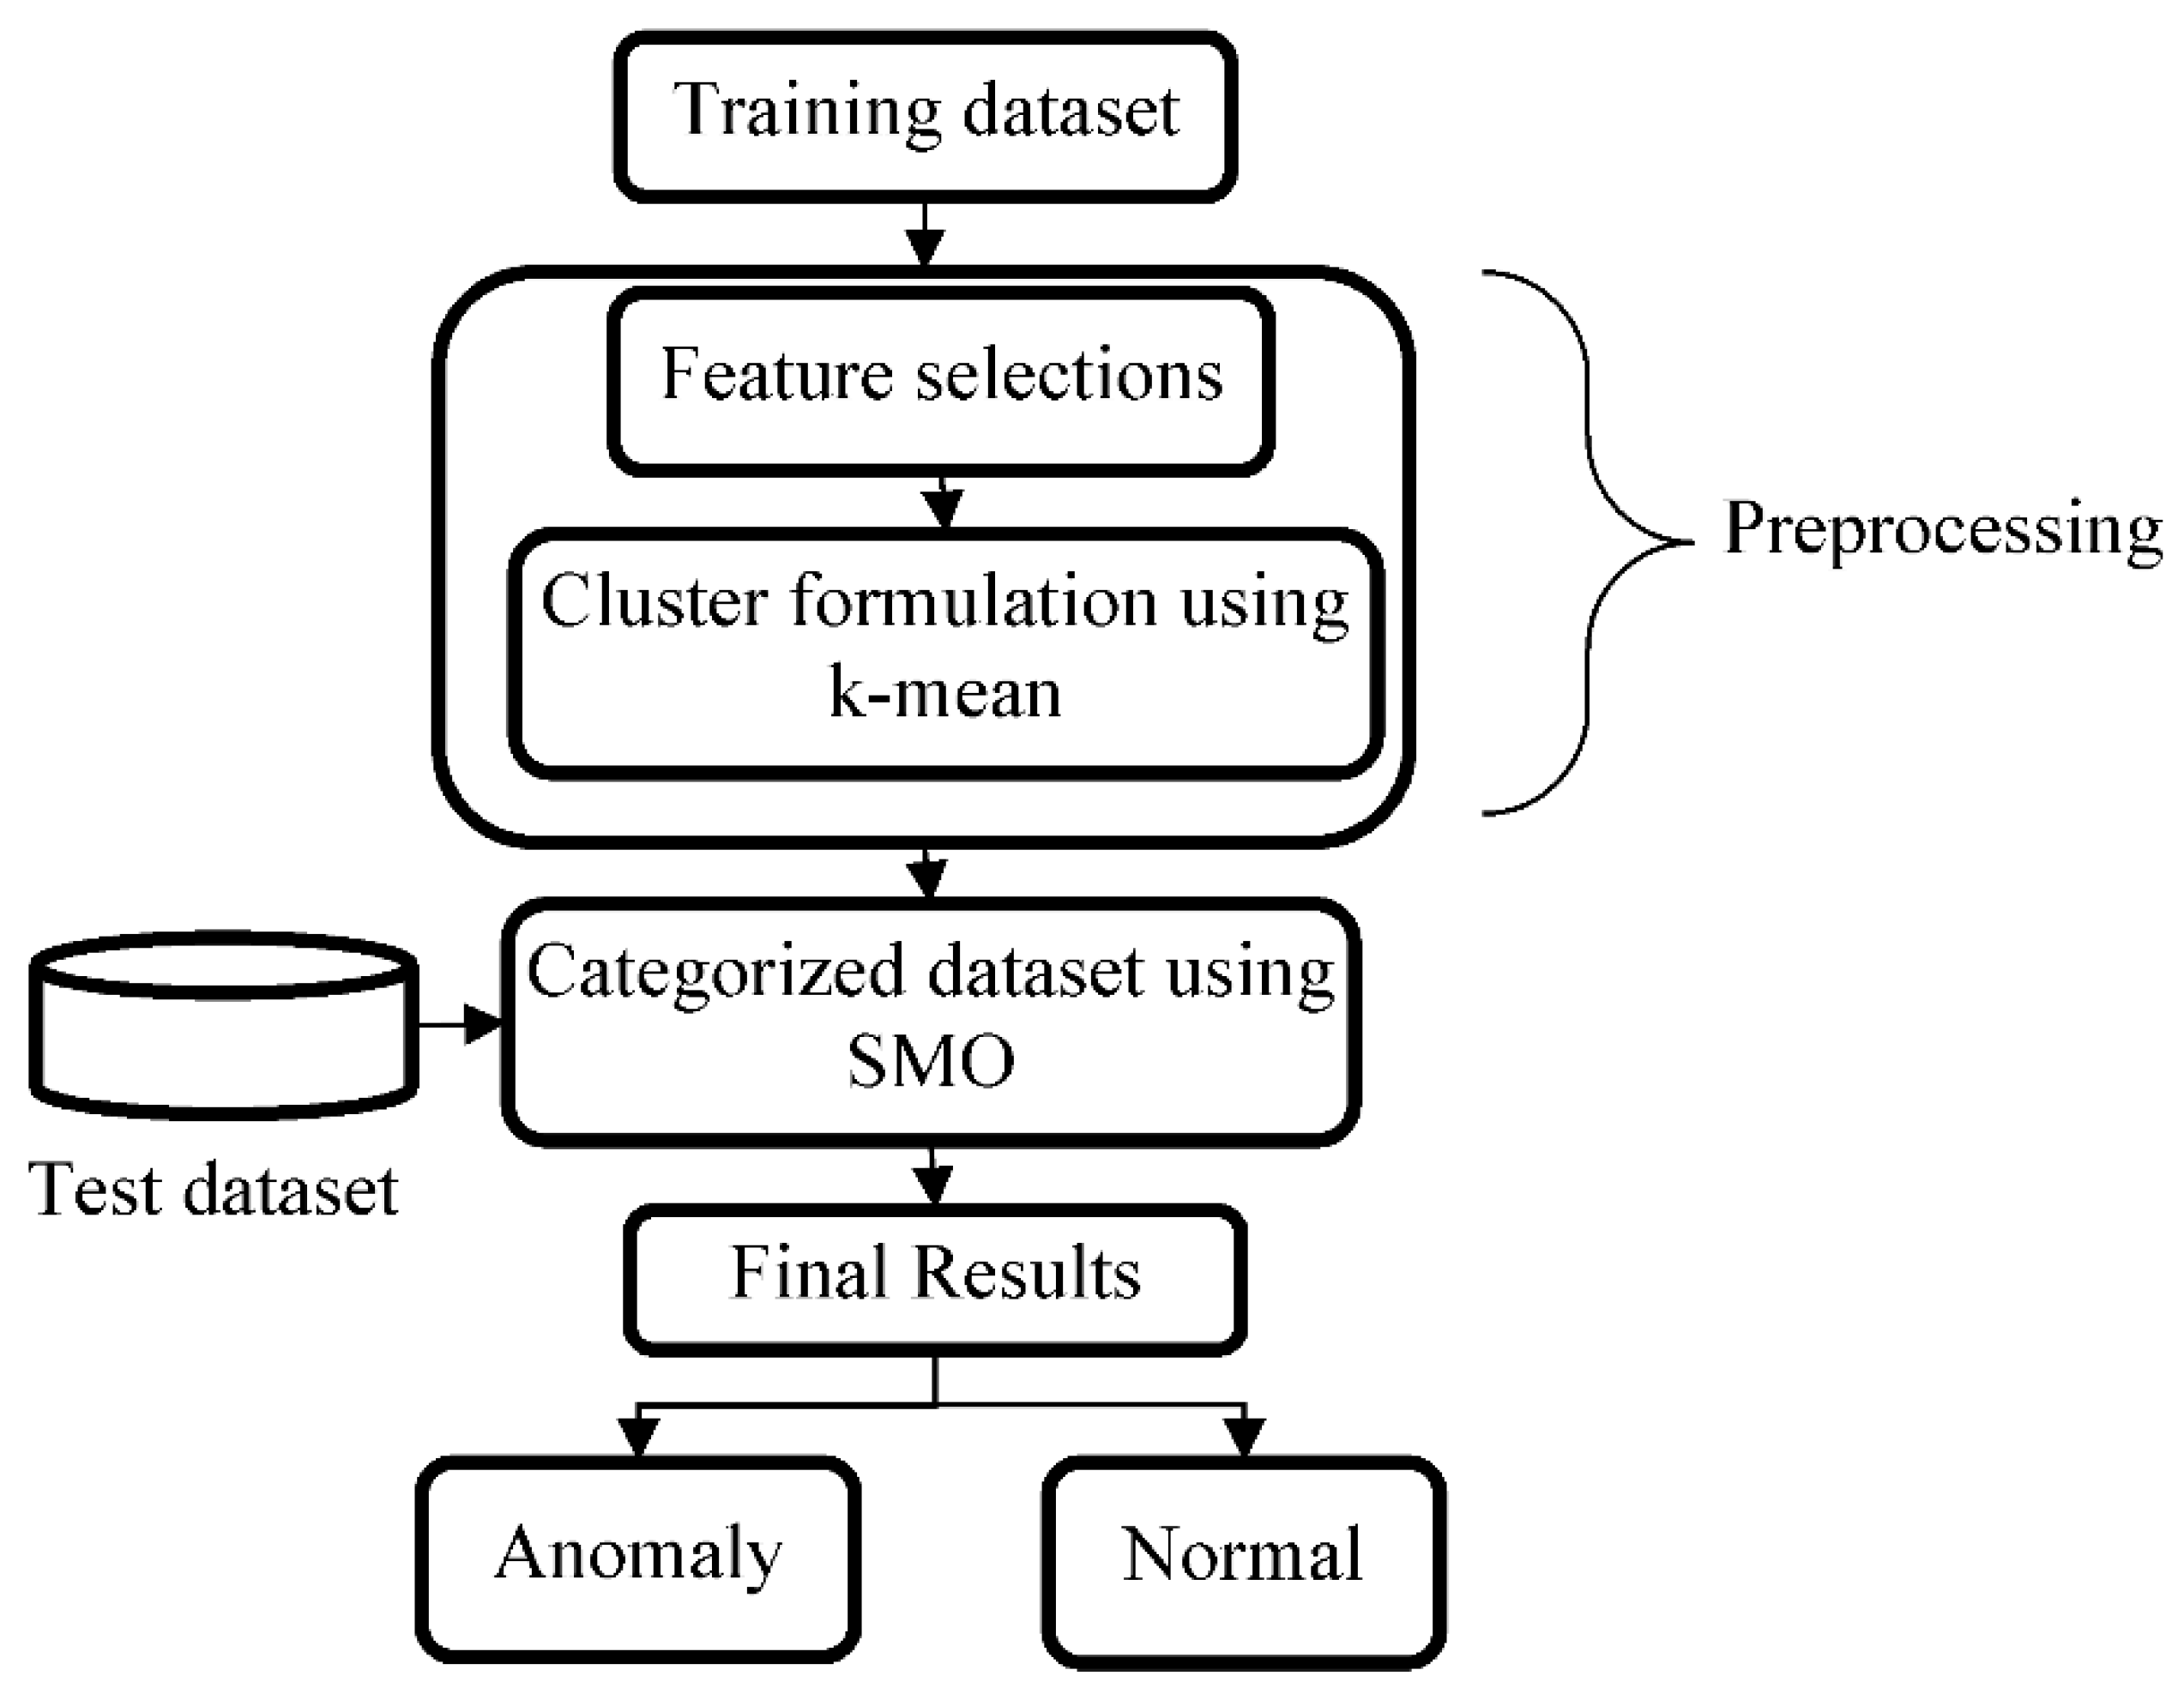
Figure 2 shows the methodology flow chart and describes the model diagram.
In the model diagram shown in
Figure 2, normal and abnormal data are trained, taking the assumption that attack data do not occur as frequently as normal data. The training data contain both normal and abnormal data. We assume that attack data will not occur as frequently as normal data. This assumption is valid because intrusion-based attackers usually monitor the data traffic based on collected samples, where larger samples allow the attackers to have a successful intrusion. Thus, less than x% of the data is anomalous, where x is equal to the intrusion and attacks probability. The preprocessing for the original NSL-KDD dataset helps prepare the trained data for the classification stage and reduces the data mystery. In addition, it provides accurate information to the following detection engine. The stage of the preprocessing depends on feature selections and cluster formulation-based K-means approaches. This stage helps clean the network’s data by collecting and processing lost or inadequate attributes as the data are preprocessed through the following stages.
4.1. Feature Selection
Feature selection is one of the vital stages in the preprocessing in our hybrid model, given that the selection output plays an important role in the ML process and the cluster formulation of the K-mean. Thereafter, it affects the final effectiveness of the DM algorithm of the ID model. Overall, the input parameters are classified for the high-dimension feature stream.
However, some features will not be relevant to the hybrid algorithm process because the classification will not involve them. Inappropriate, duplicate, or noisy data may divert the ML process if not excluded early in the process. The existence of these irrelevant data in the dataset may increase the complexity of the model and learning time, which accordingly degrades the performance of learning algorithms. Thus, removing such features will improve the performance of the clustering and classification algorithms, leading to positive effects on the entire IDS performance. It likewise helps in speeding up the detection process and enhancing the precision of results and overall security. Therefore, there is a need to identify and handle these irrelevant datasets. Some methods are specified to detect irrelevant attributes in the datasets (i.e., pairwise attribute algorithm, PANDA) to detect the most and least noisy thresholds. PANDA is useful due to its work without class knowledge [
40]. Noise identification is then followed by irrelevant feature handling and removal. There are three main approaches: identify and ignore, identify and filter out (i.e., fuzzy wavelet analysis), and finally, identify and scrub (i.e., automatic repeat request, forward error correction, or hybrid techniques) [
41].
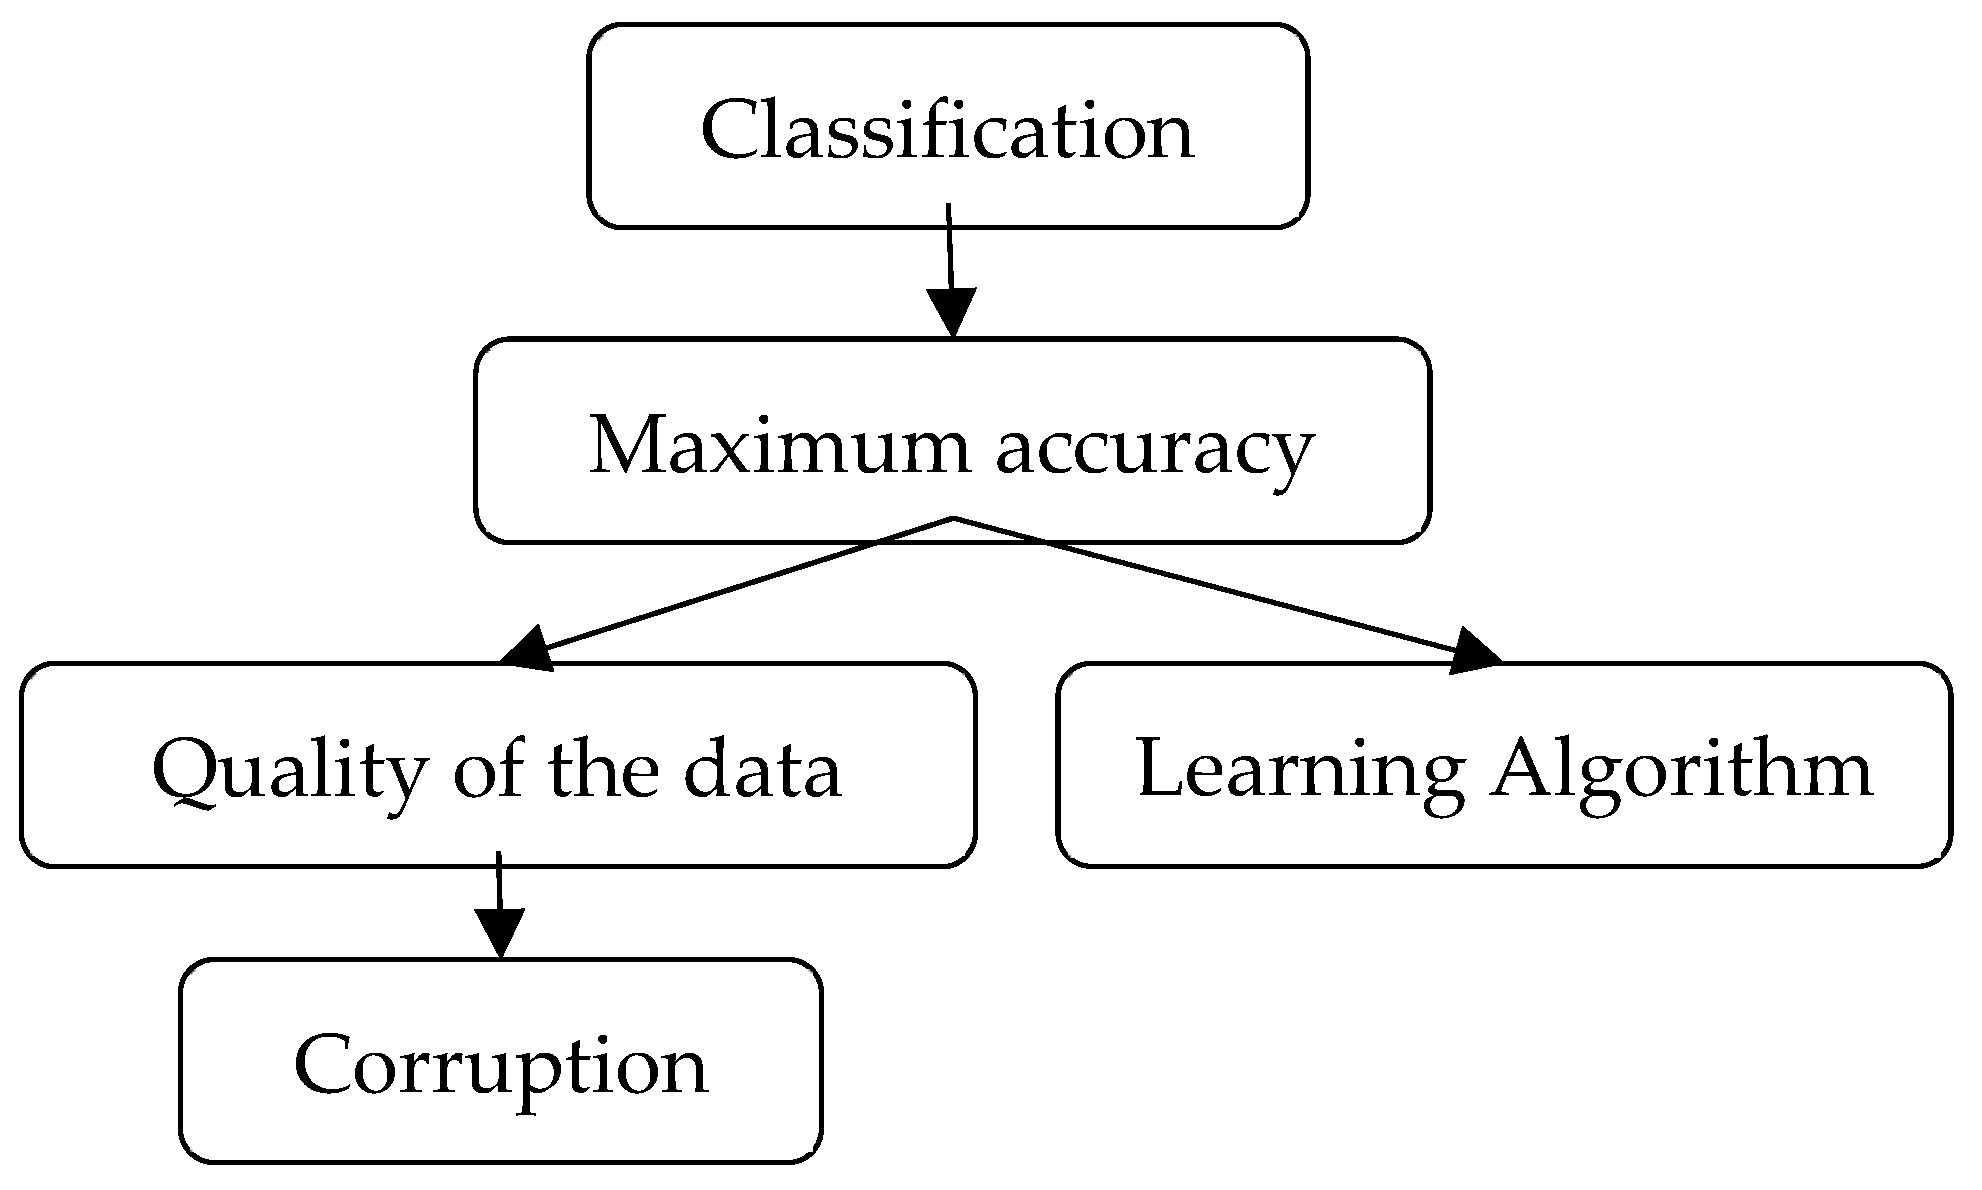
Real data traffic is mostly exposed to many factors. Some of the most important factors are noise, inappropriate, and duplicate data. Data corruption, where data are severely affected during data collection and data preparation procedures, is an inevitable issue. There are two types of errors: implied noise presented by collection utilities (i.e., sensor) and random error presented by random sources as additive white Gaussian noise. Inappropriate and duplicate data are actual data that have been used incorrectly at the wrong time or allocated in the wrong way. The system throughput and efficiency seriously rely on the training data quality, and the strength is compared with the categorizer’s errors. The flow is illustrated in
Figure 3.
For example, the data may include inappropriate, duplicate, or noisy data, which may be excluded. In this case, redundant and irrelevant features can be introduced as noise or interfered data that divert the ML process. Feature selection reduces the number of attributes; removes inappropriate, redundant, or noisy features; and leads to positive effects on system performance output, such as speeding up the DM algorithms, enhancing ML precision, and resulting in a better security model.
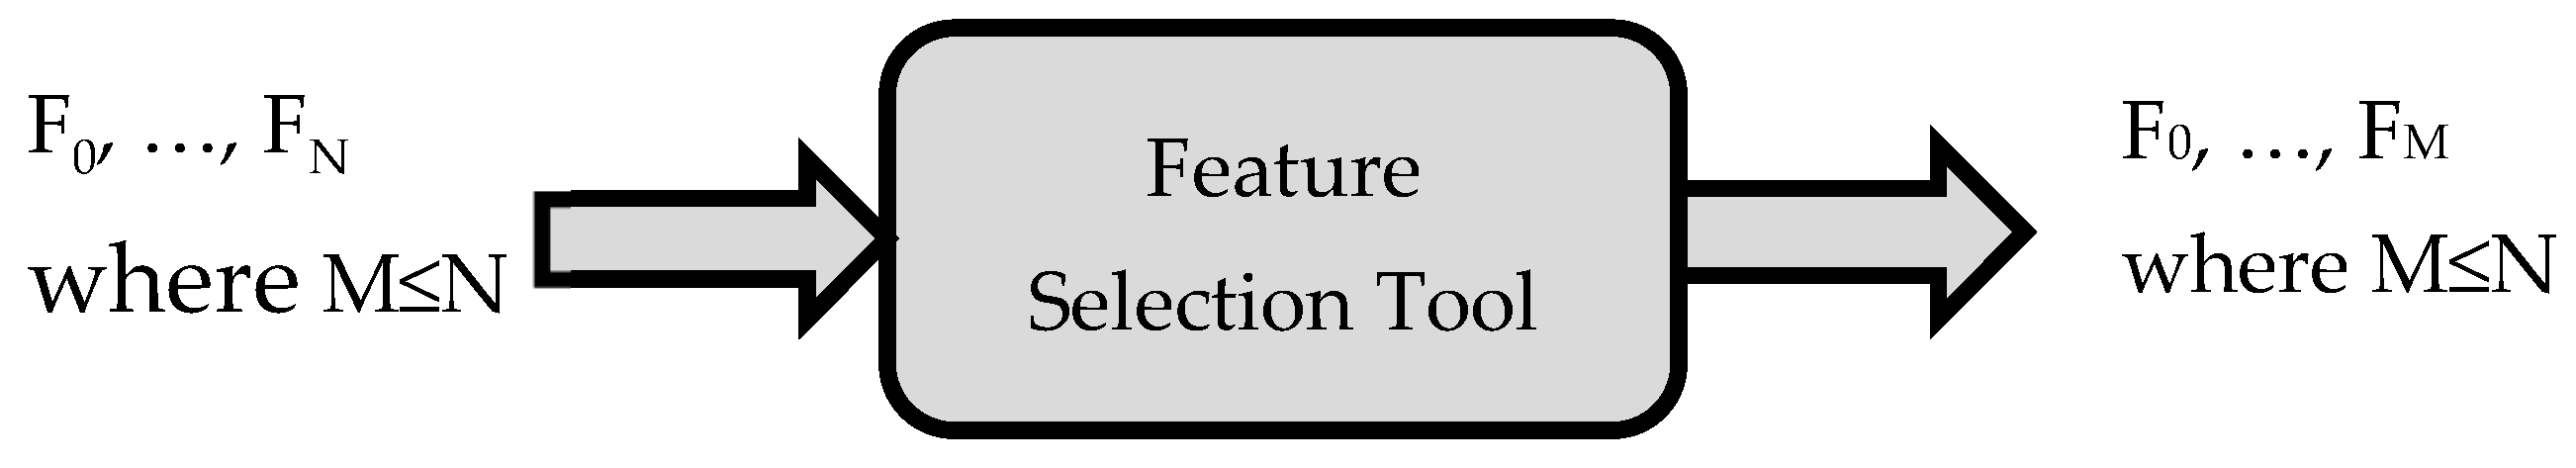
The feature selection procedure is demonstrated in
Figure 4.
Figure 4 shows that if we have the set of features (F_0 to F_N) from the original dataset, which was collected from the network traffic, then the selected features achieved from the selection tool (i.e., feature selection toolbox (FST) in MATLAB) are (F_0 to F_M). The feature number achieved differs based on the utilized tool for selection and the feature’s cross-correlation that has been fed to the tool. The next stage involves the elementary philosophies of the analysis of features. The number of features in the output, indicated by M in the illustration, is usually less than the number of features in the input indicated by N. However, in some special cases, the input and output may be equal.
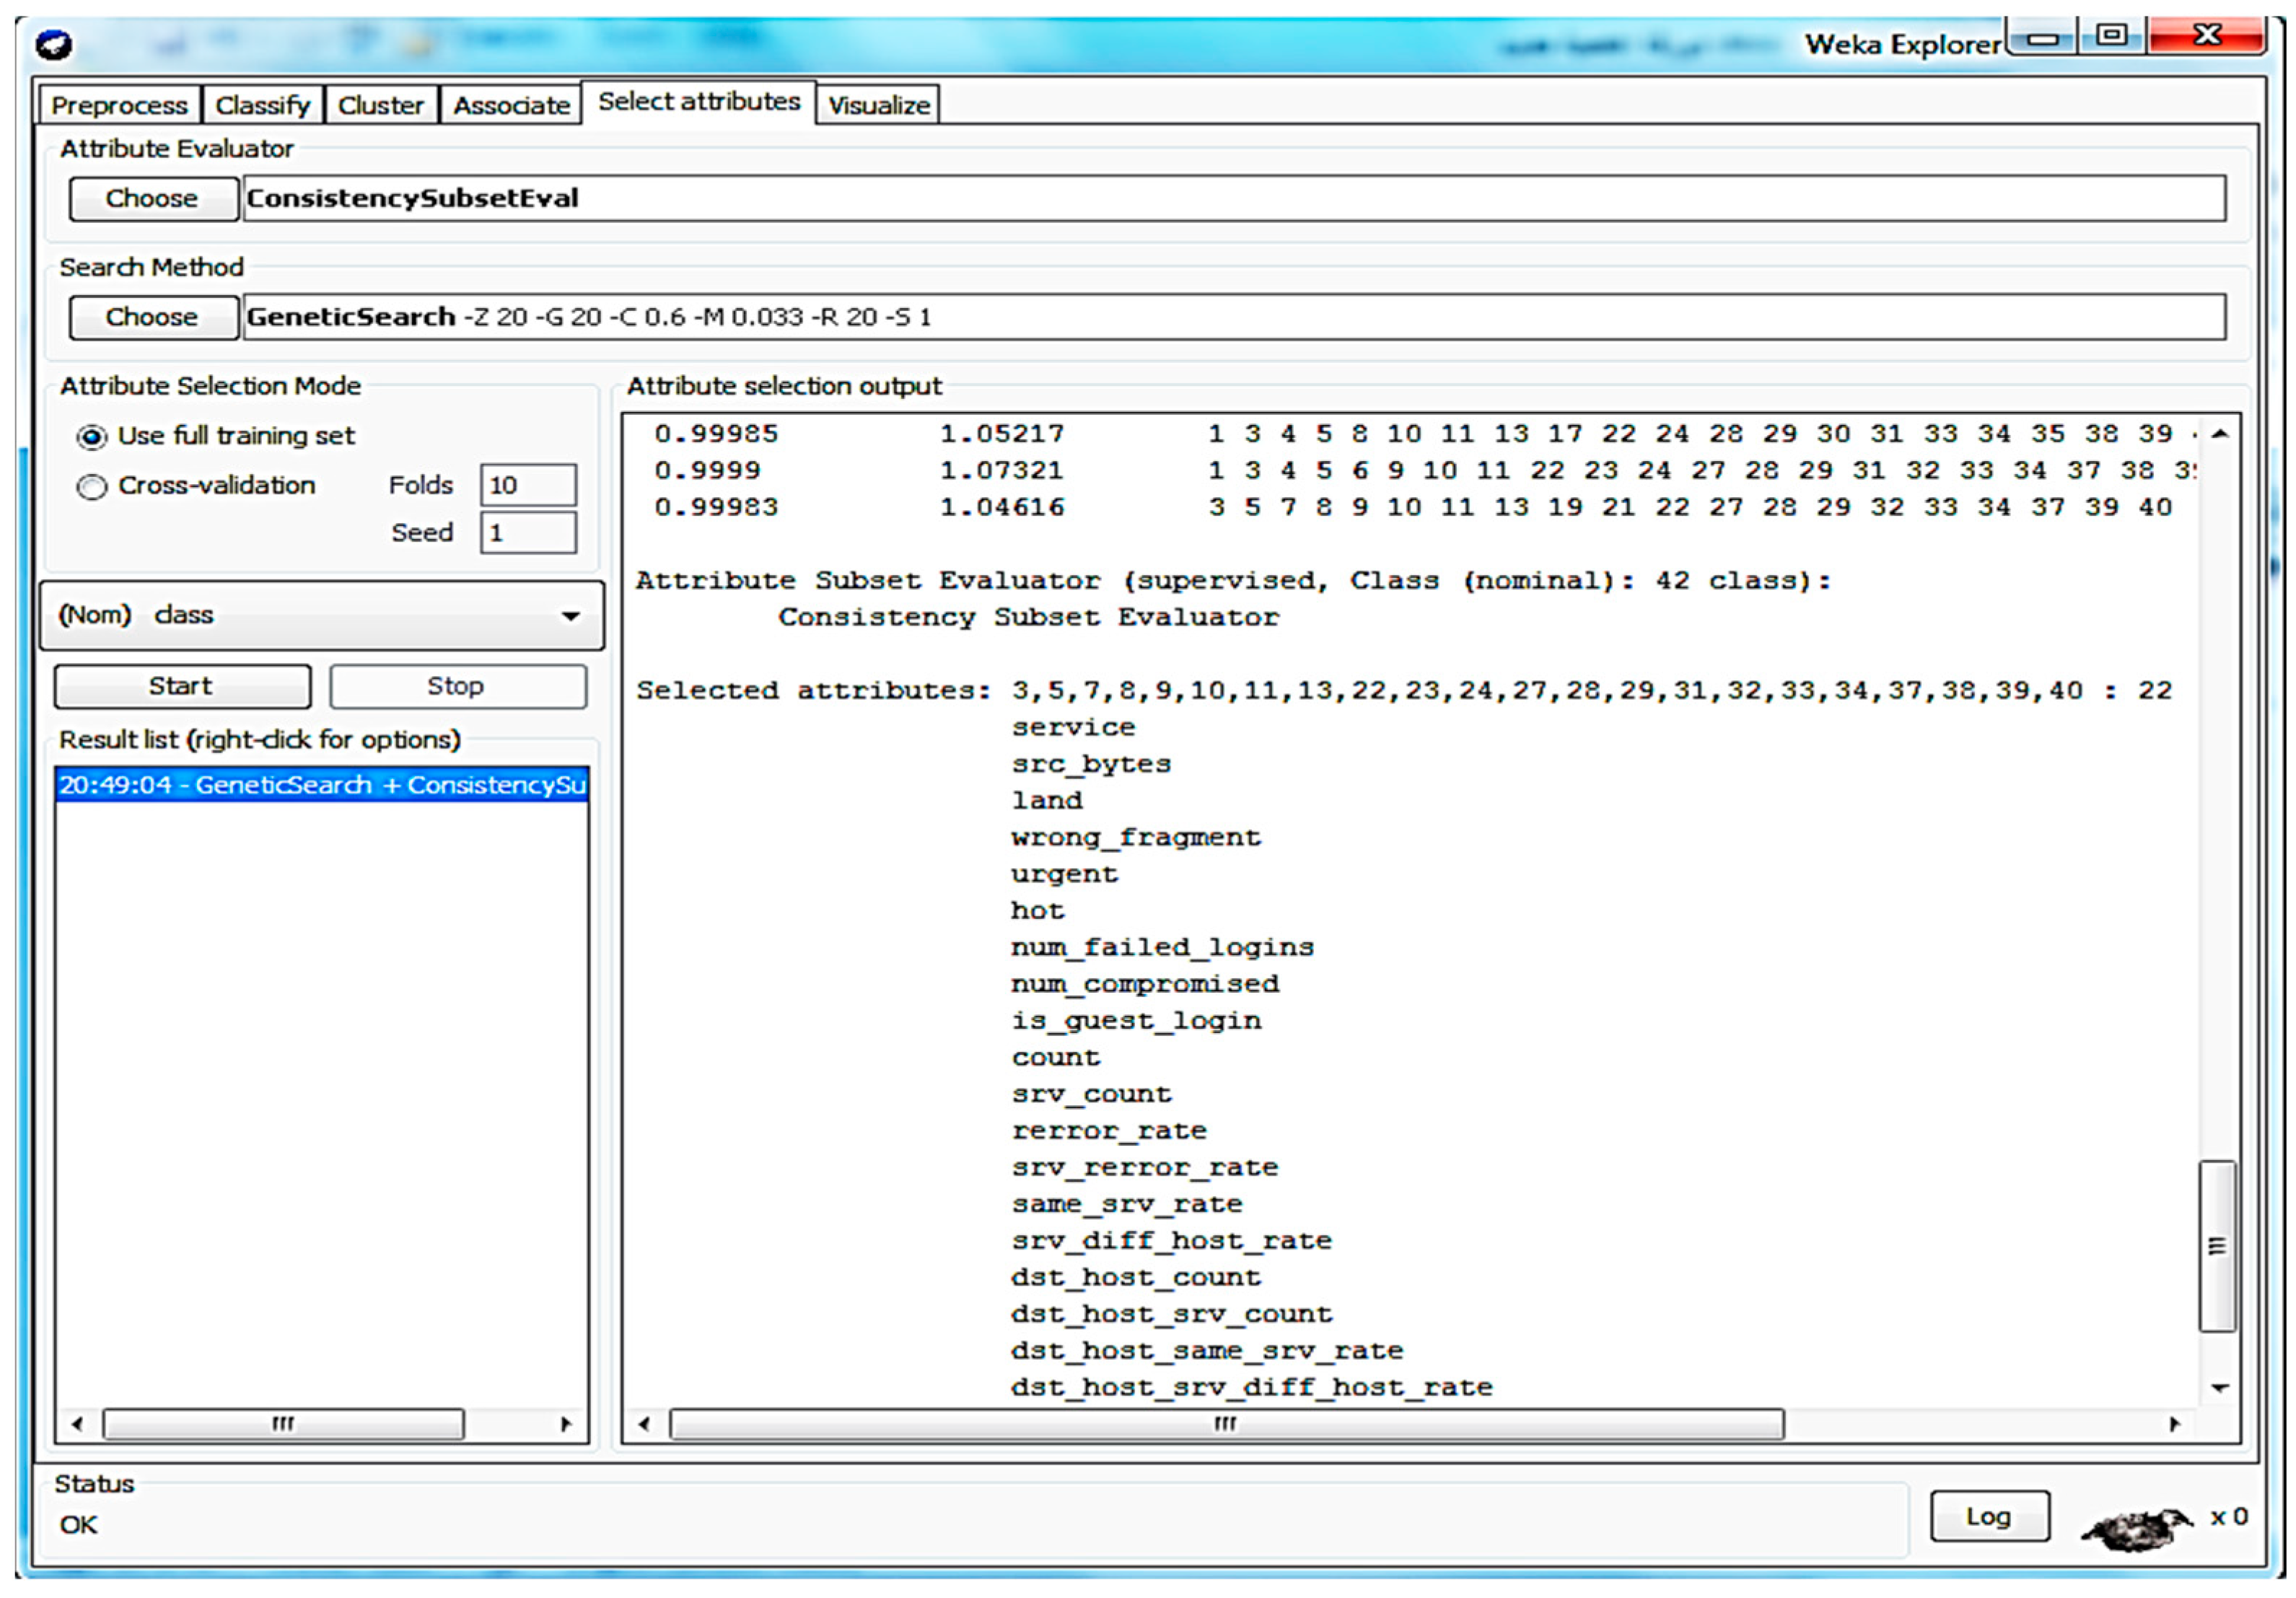
After this stage, the dataset will include only the most effective features to be fed to the ID engine. The selection of features aims to improve the anomaly detection ratio and reduce the false alarm probability (FAP) of ID in the network. Waikato Environment for Knowledge Analysis (WEKA 3.9.4) is an ML tool used in this study to calculate the selection of feature subsets for our hybrid DM scheme. This is performed by the categorization of the test throughput on each feature subset.
Figure 5 represents the program interface of WEKA 3.9.4 software, which provides ML tools to enable the process of feature selection. It enables setting the consistency-subset level and attribute parameters. The consistency-subset level is an element-level processor providing reiteration within a data block in the data subset. The genetic-search scheme is used to select certain features from the dataset and eliminate features that are irrelevant to the process before the cluster formulation and categorization stages.
4.2. Clustering Phase
The cluster formulation stage is performed by using K-means cluster formulation algorithms. Three clusters are created and tested. The method is iterated through data training; the cluster’s structures have been inherited from each other. The cluster update causes the centroid values to be modified, which affects the present cluster elements. If there are no more modifications in the cluster centroids values, that means the cluster formulation for the K-means process has become stable. After that, the clustering model is built.
The generated network traffic due to the data collection is analyzed in the testing stage. The final stage is categorization, where it is managed; that is, the SMO algorithm is utilized to categorize the database as an anomaly or normal. The K-mean approach is usually easier and simpler to be implemented, while the construction of SMO is comparatively higher in terms of computational complexity.
One of the great applications of the proposed method is in the area of IoT and WSN with a high traffic volume. One of the strengths of the proposed method is the high accuracy of intrusion detection using data mining. The proposed method was designed to deal and process a high traffic volume without affecting the performance.
5. Results and Discussion
Utilizing Waikato environments has developed experiments for Knowledge Analyses (WEKA
®). WEKA
® is a utility that is used efficiently in ML and DM; it was developed and invented in 1997 by researchers at Waikato University and in New Zealand. WEKA
® [
41] is a combination of DM and ML procedures that are built using JavaBean codes and data files, and it has been used for graphic user interfaces (GUIs) to exchange for comfortable human interaction. WEKA
® comprises 76 categorization procedures, 15 feature assessors, 10 procedures for search and mining for feature selection, and 49 data preprocessing utilities.
There are five procedures to find association rules. WEKA® also has six GUIs, including knowledge flow, explorer, experimenter, etc. The data storage format is stored in an attribute-relation file format (arff). It comprises utilities as well for imagining. WEKA® has plenty of boards that can be utilized to perform specific threads. It also has great scalability, which can be extended and comprised of any newly developed ML algorithm. These extended or new algorithms can be linked to the database directly. The detection of attack can be measured by the following metrics: (A) false-positive (FP) or false alarm corresponds to the number of detected attacks, but these attacks are normal; (B) false negative (FN) corresponds to the number of detected normal instances, but these instances are actual attacks; that is, they are the target of IDSs; (C) true positive (TP) corresponds to the number of detected attacks that are in fact attacks; and (D) true negative (TN) corresponds to the number of detected normal instances that are normal.
In this paper, three parameters of measurement are used, namely, detection rate (DTR), false-positive rate alarm (FPR), and accuracy (AC). DTR is defined as the ratio of attacks detected to the total number of attacks. This is the best parameter to measure the performance of the model and is determined using Equation (1) [
42]:
FPR is one of the main parameters to find out the effectiveness of various models and is a major concern during network setup. Normal data are considered abnormal or attack-type data. FPR is obtained using Equation (2):
AC is the proportion of the total number of the correct predictions to the actual dataset size. It is determined using Equation (3), and then the matrix of confusion can be presented as shown in
Table 2.
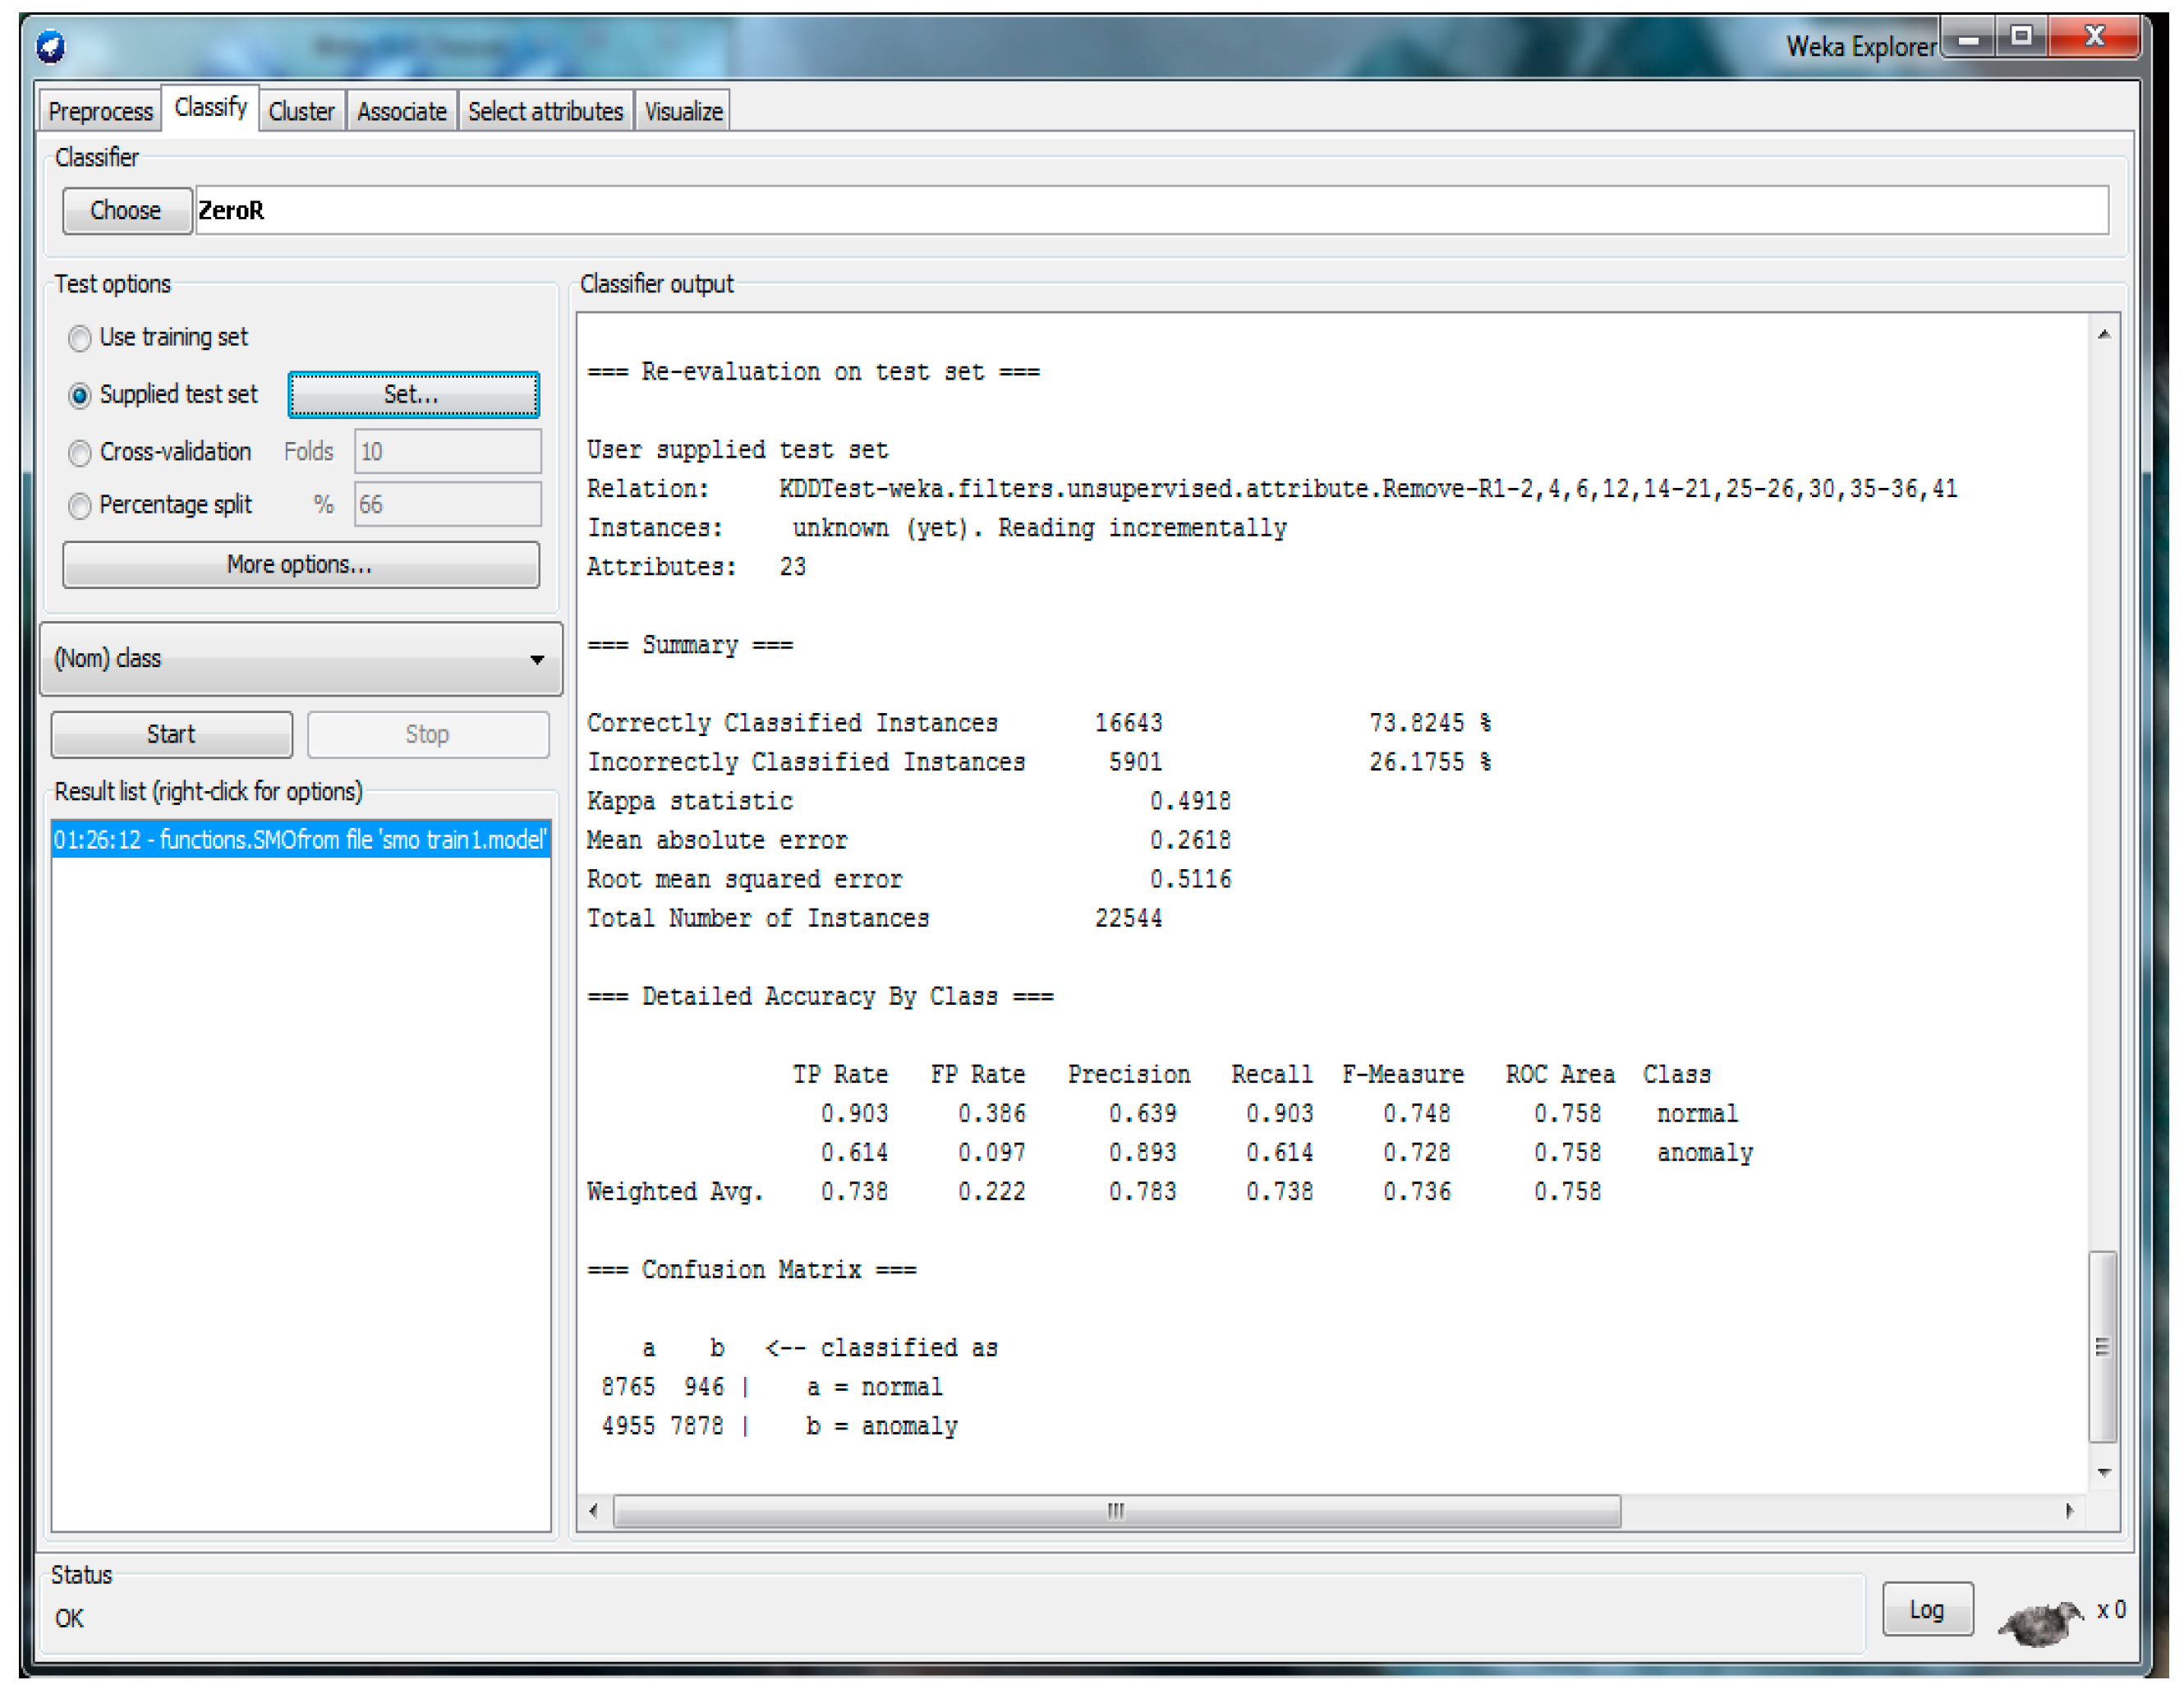
5.1. Accuracy Measure of Individual Algorithms (SMO)
To perform the data analysis and prediction of algorithms that were used to build our model, firstly, we applied the SMO algorithm for the NLS-KDD dataset with 22 attributes (with feature selection) using WEKA, as shown in
Figure 6. The details of accuracy parameters for SMO are shown in
Table 3. The details of the confusion matrix are shown in
Table 4. Finally, the measurement parameters for SMO are calculated and presented in
Table 5, whereby using Equations (1)–(3), we easily can calculate AC, FPR, and DTR. From
Table 4, one can calculate:
5.2. K-Mean Algorithm Implementation
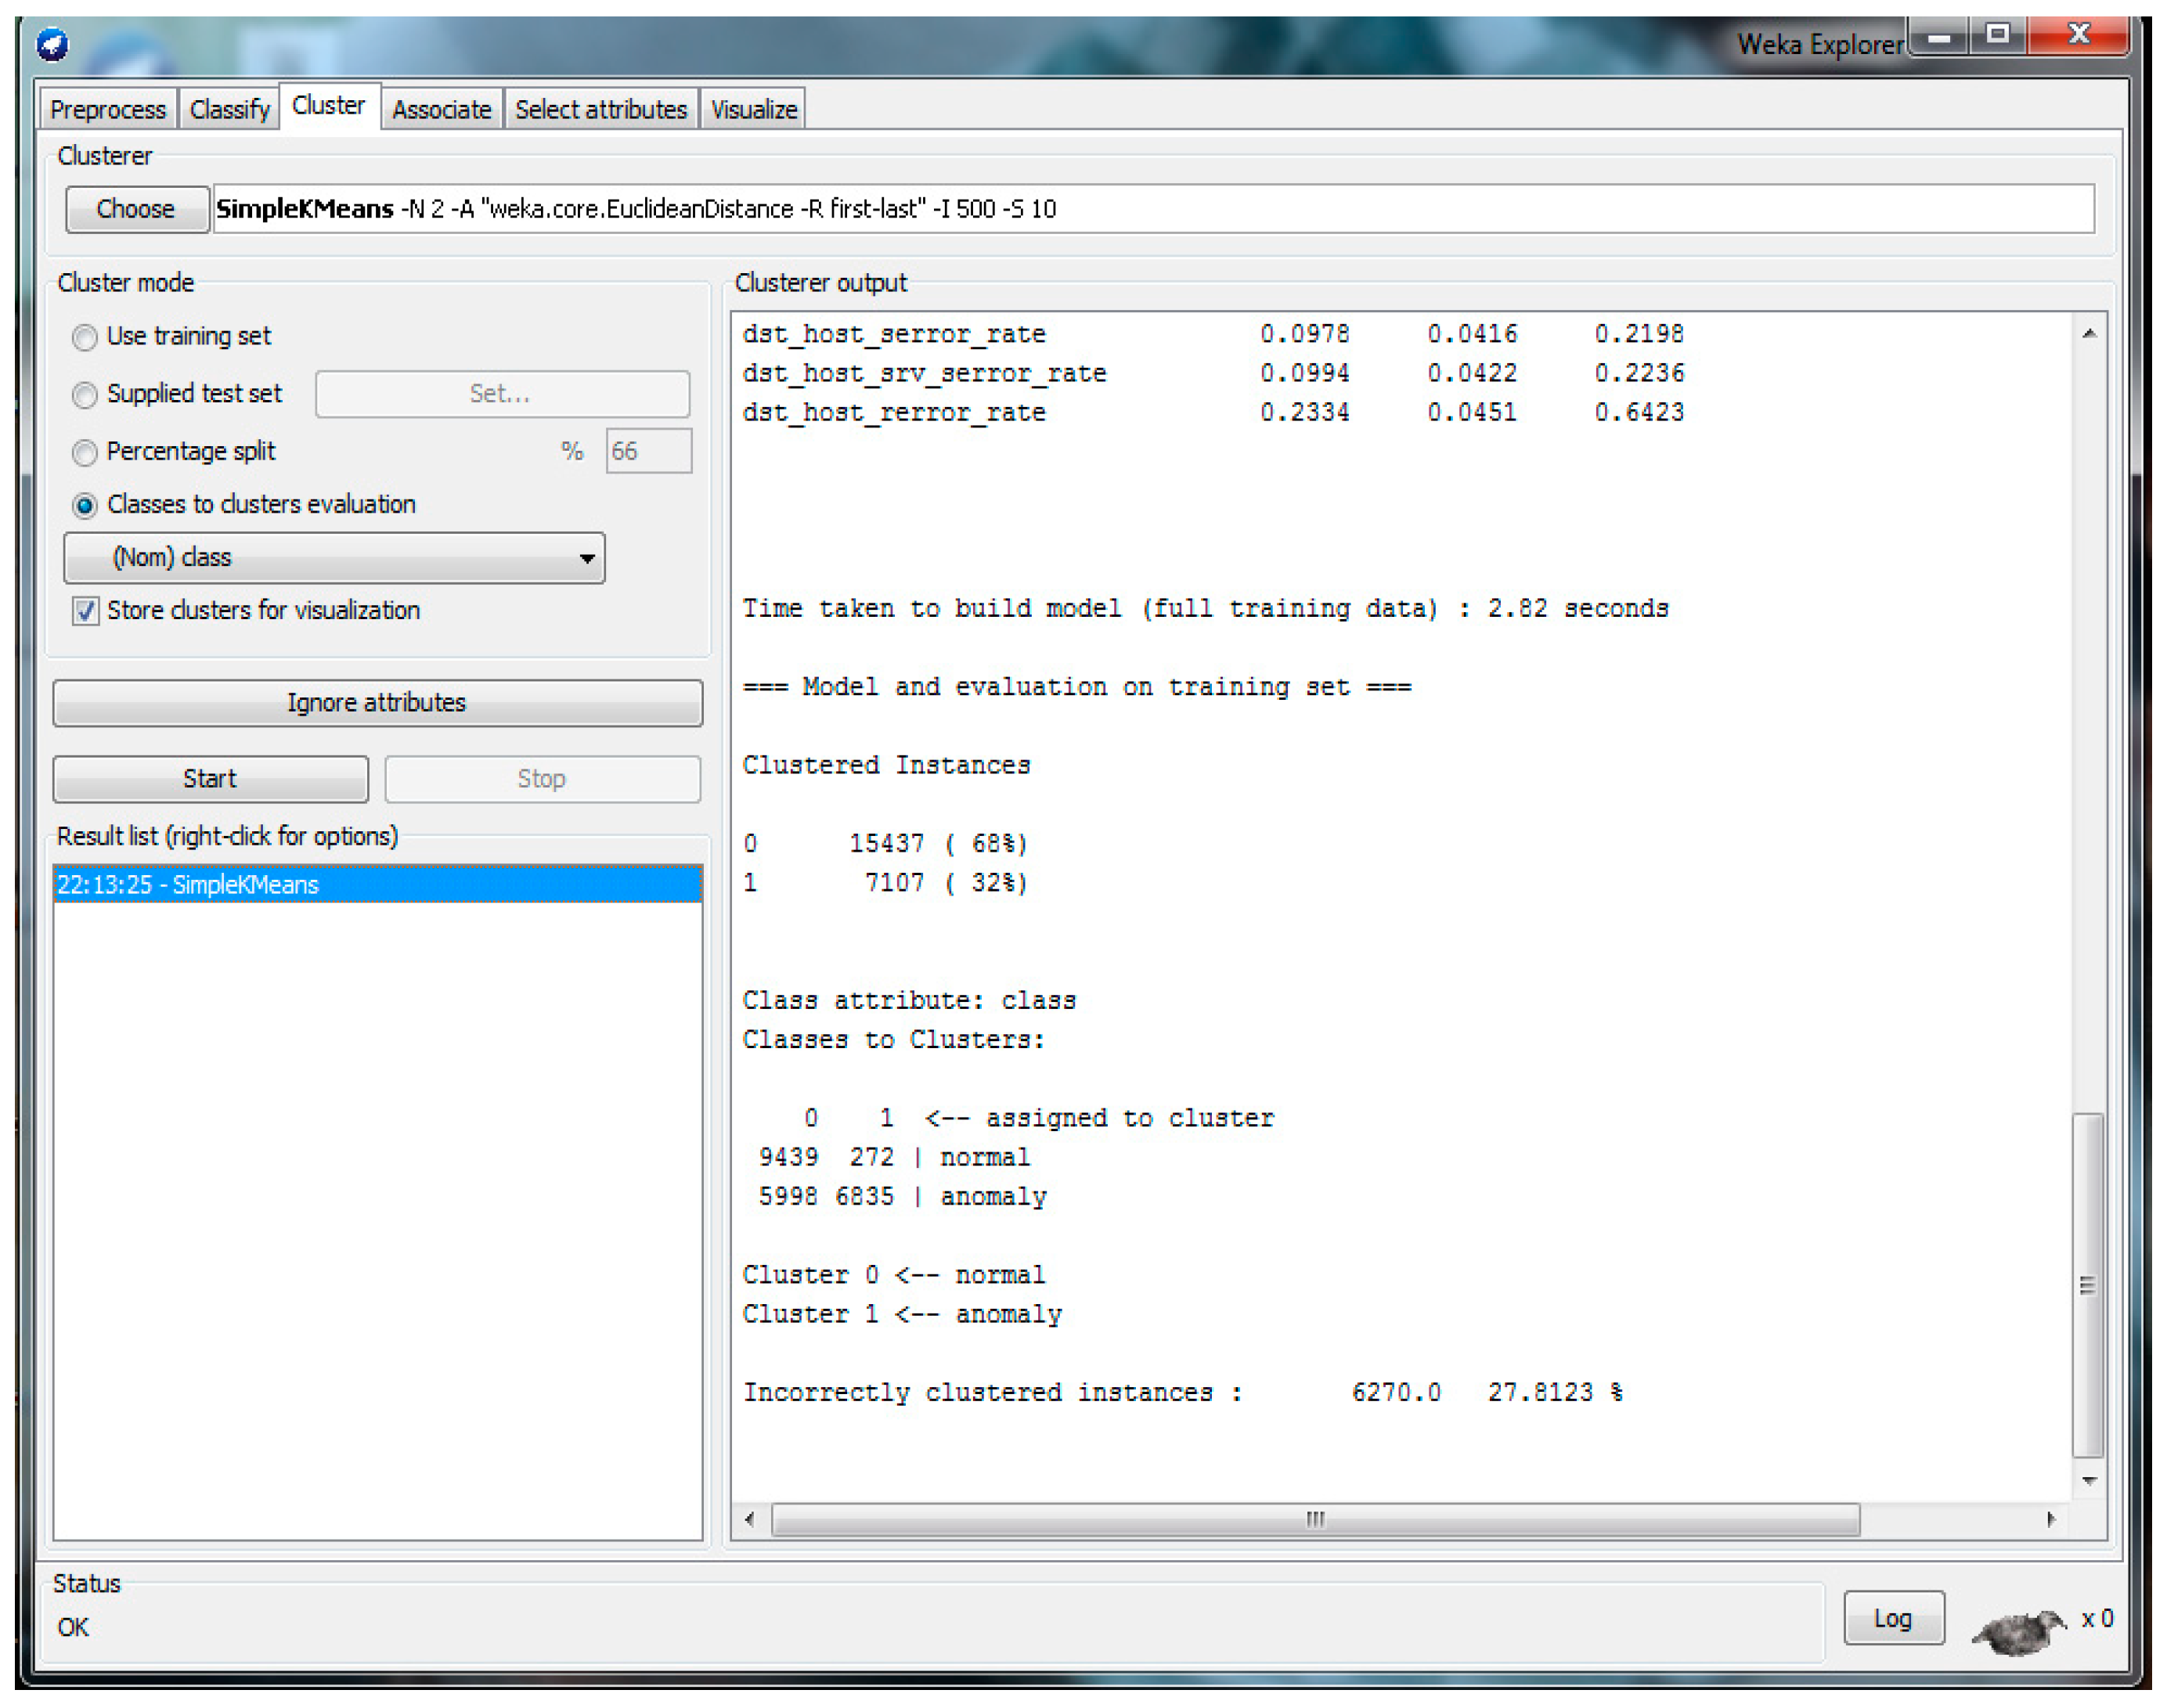
The result of the NLS-KDD dataset with 22 attributes and feature selection using WEKA is shown in
Figure 7. Then, the CCI was 72.1877% and ICI was 27.8123%. From the achieved results in
Figure 7, the details of the confusion matrix are presented in
Table 6. Then,
Table 7 demonstrates measurement K-mean parameters where, by using Equations (1)–(3), AC, FPR, and DTR were calculated.
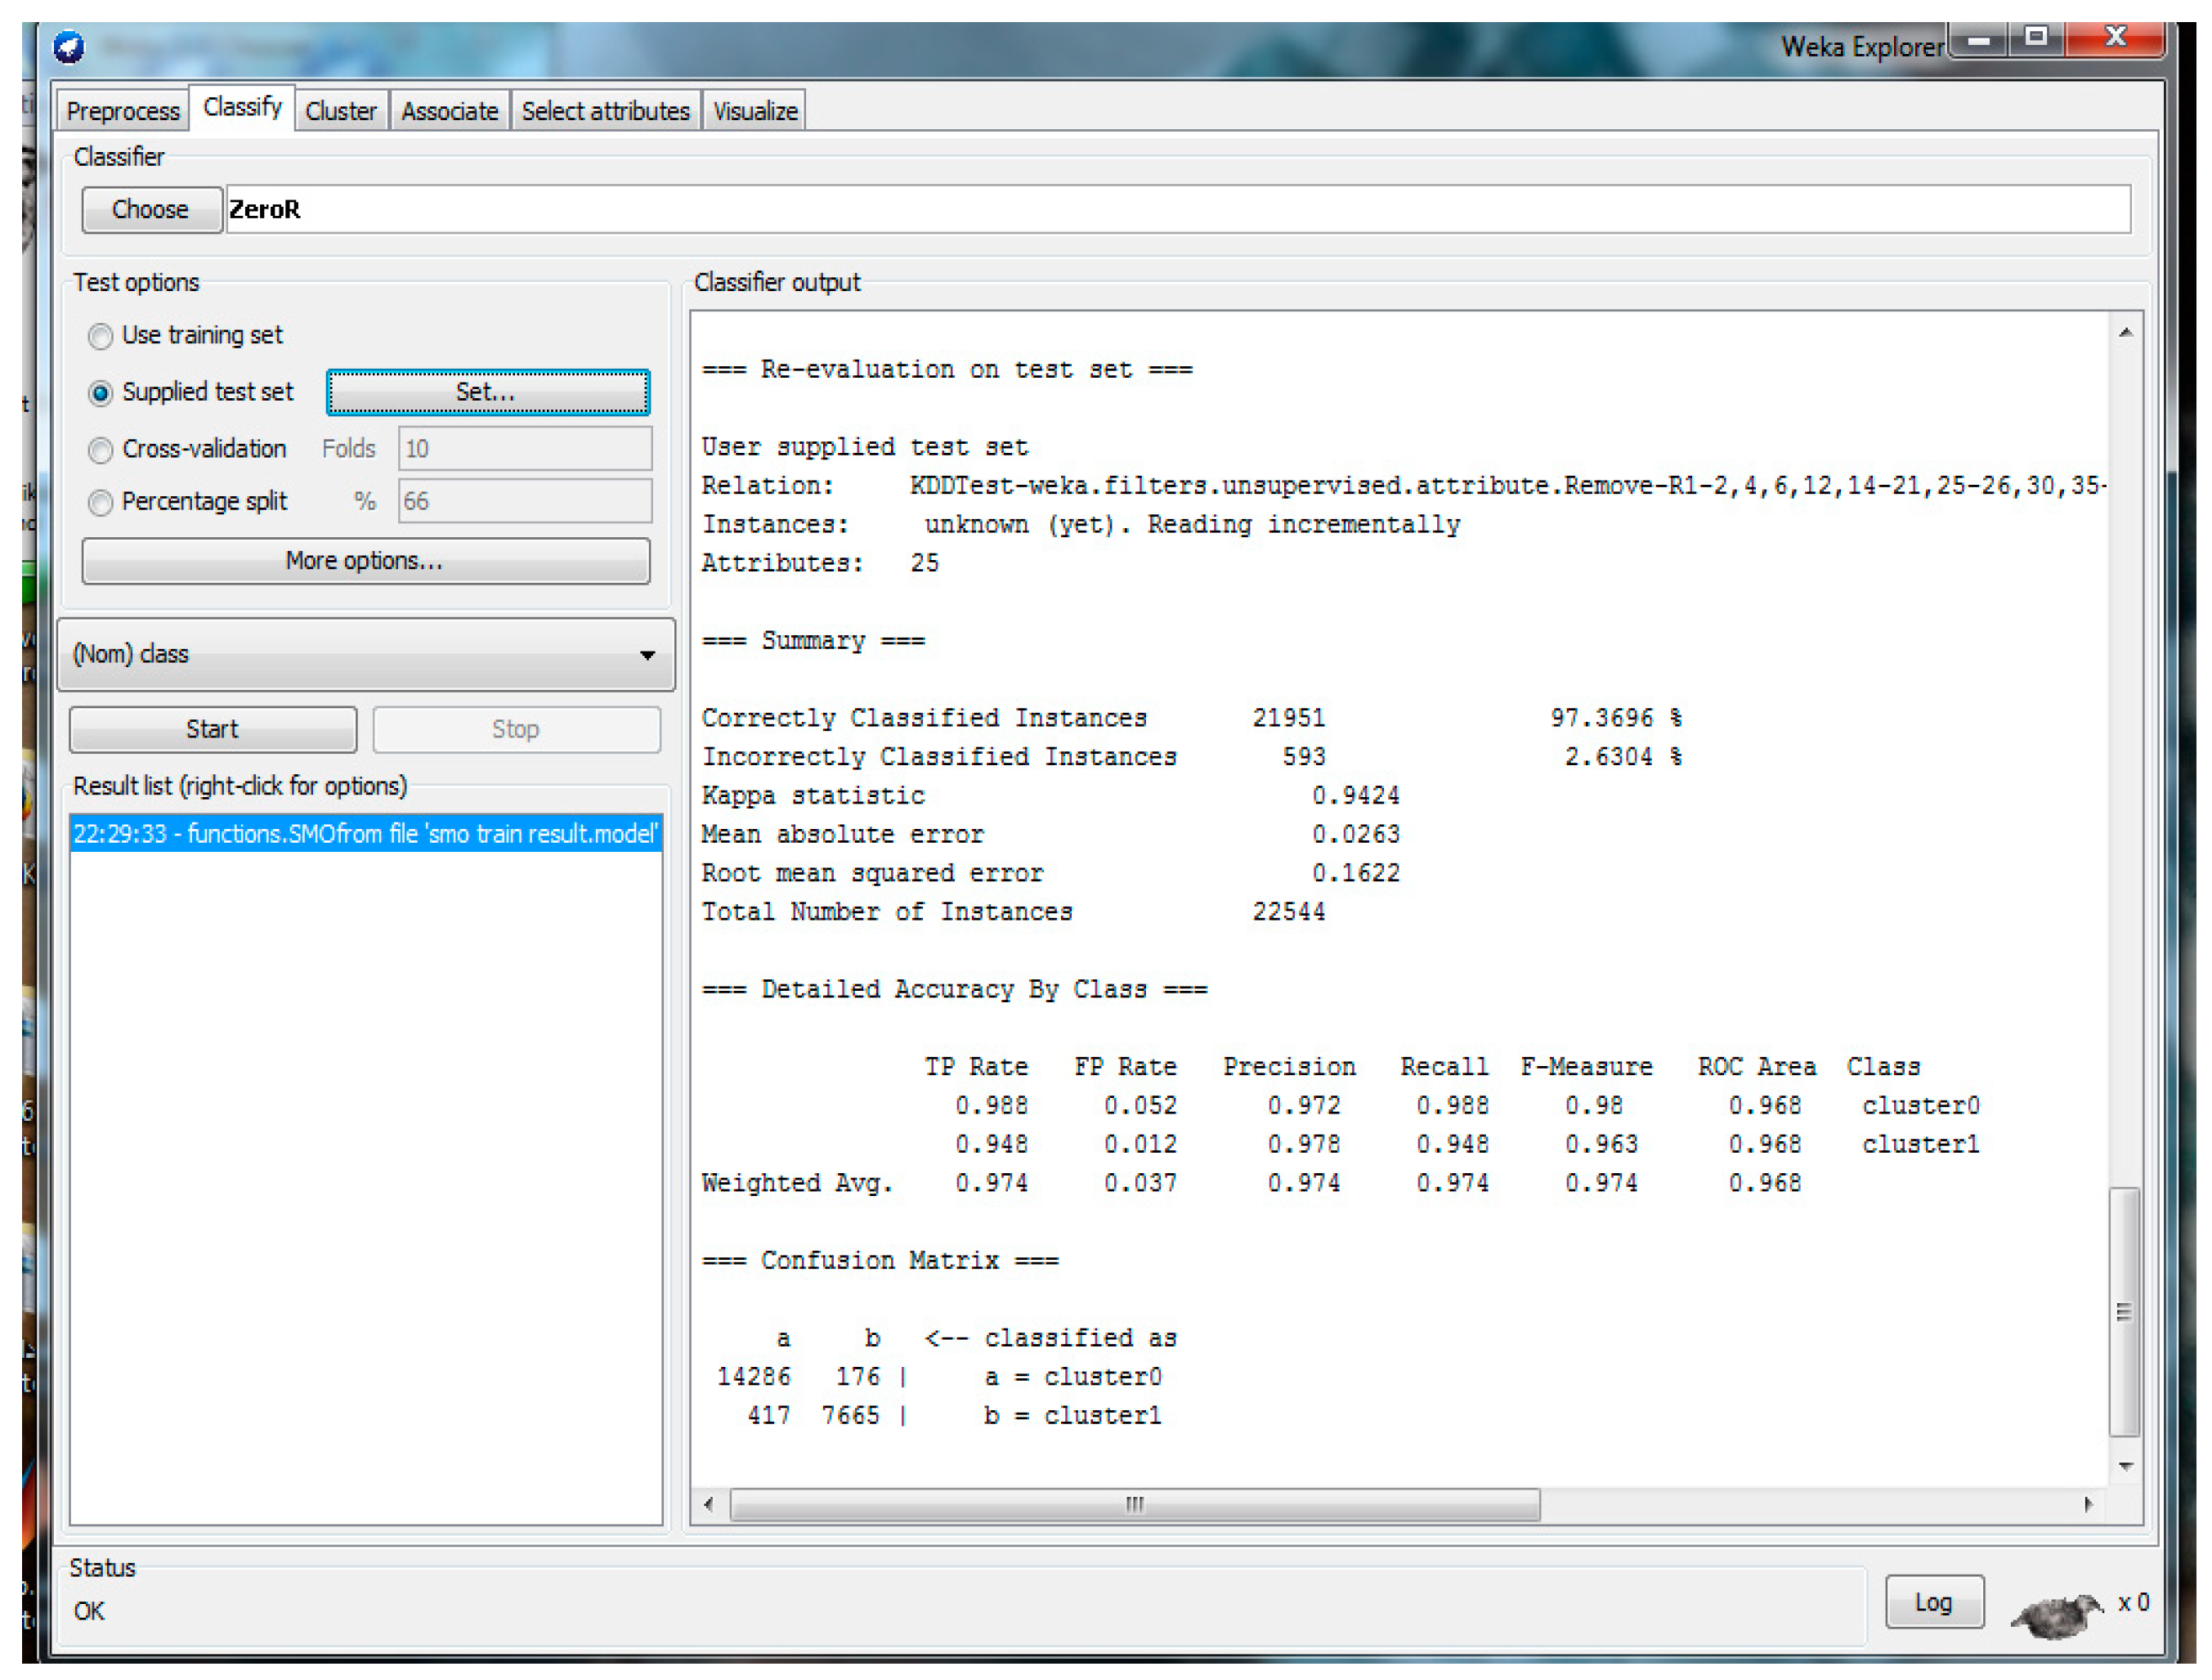
5.3. Hybrid Technique, i.e., K-mean and SMO Implementation
The resultant NLS-KDD dataset with 22 attributes and feature selection using WEKA is shown in
Figure 8. Based on the results in
Figure 8, the accuracy details are presented in
Table 8, while the confusion matrix is presented in
Table 9. One can then calculate
Table 10 demonstrates the measurement of K-mean parameters where, by using Equations (1)–(3), AC, FPR, and DTR were calculated.
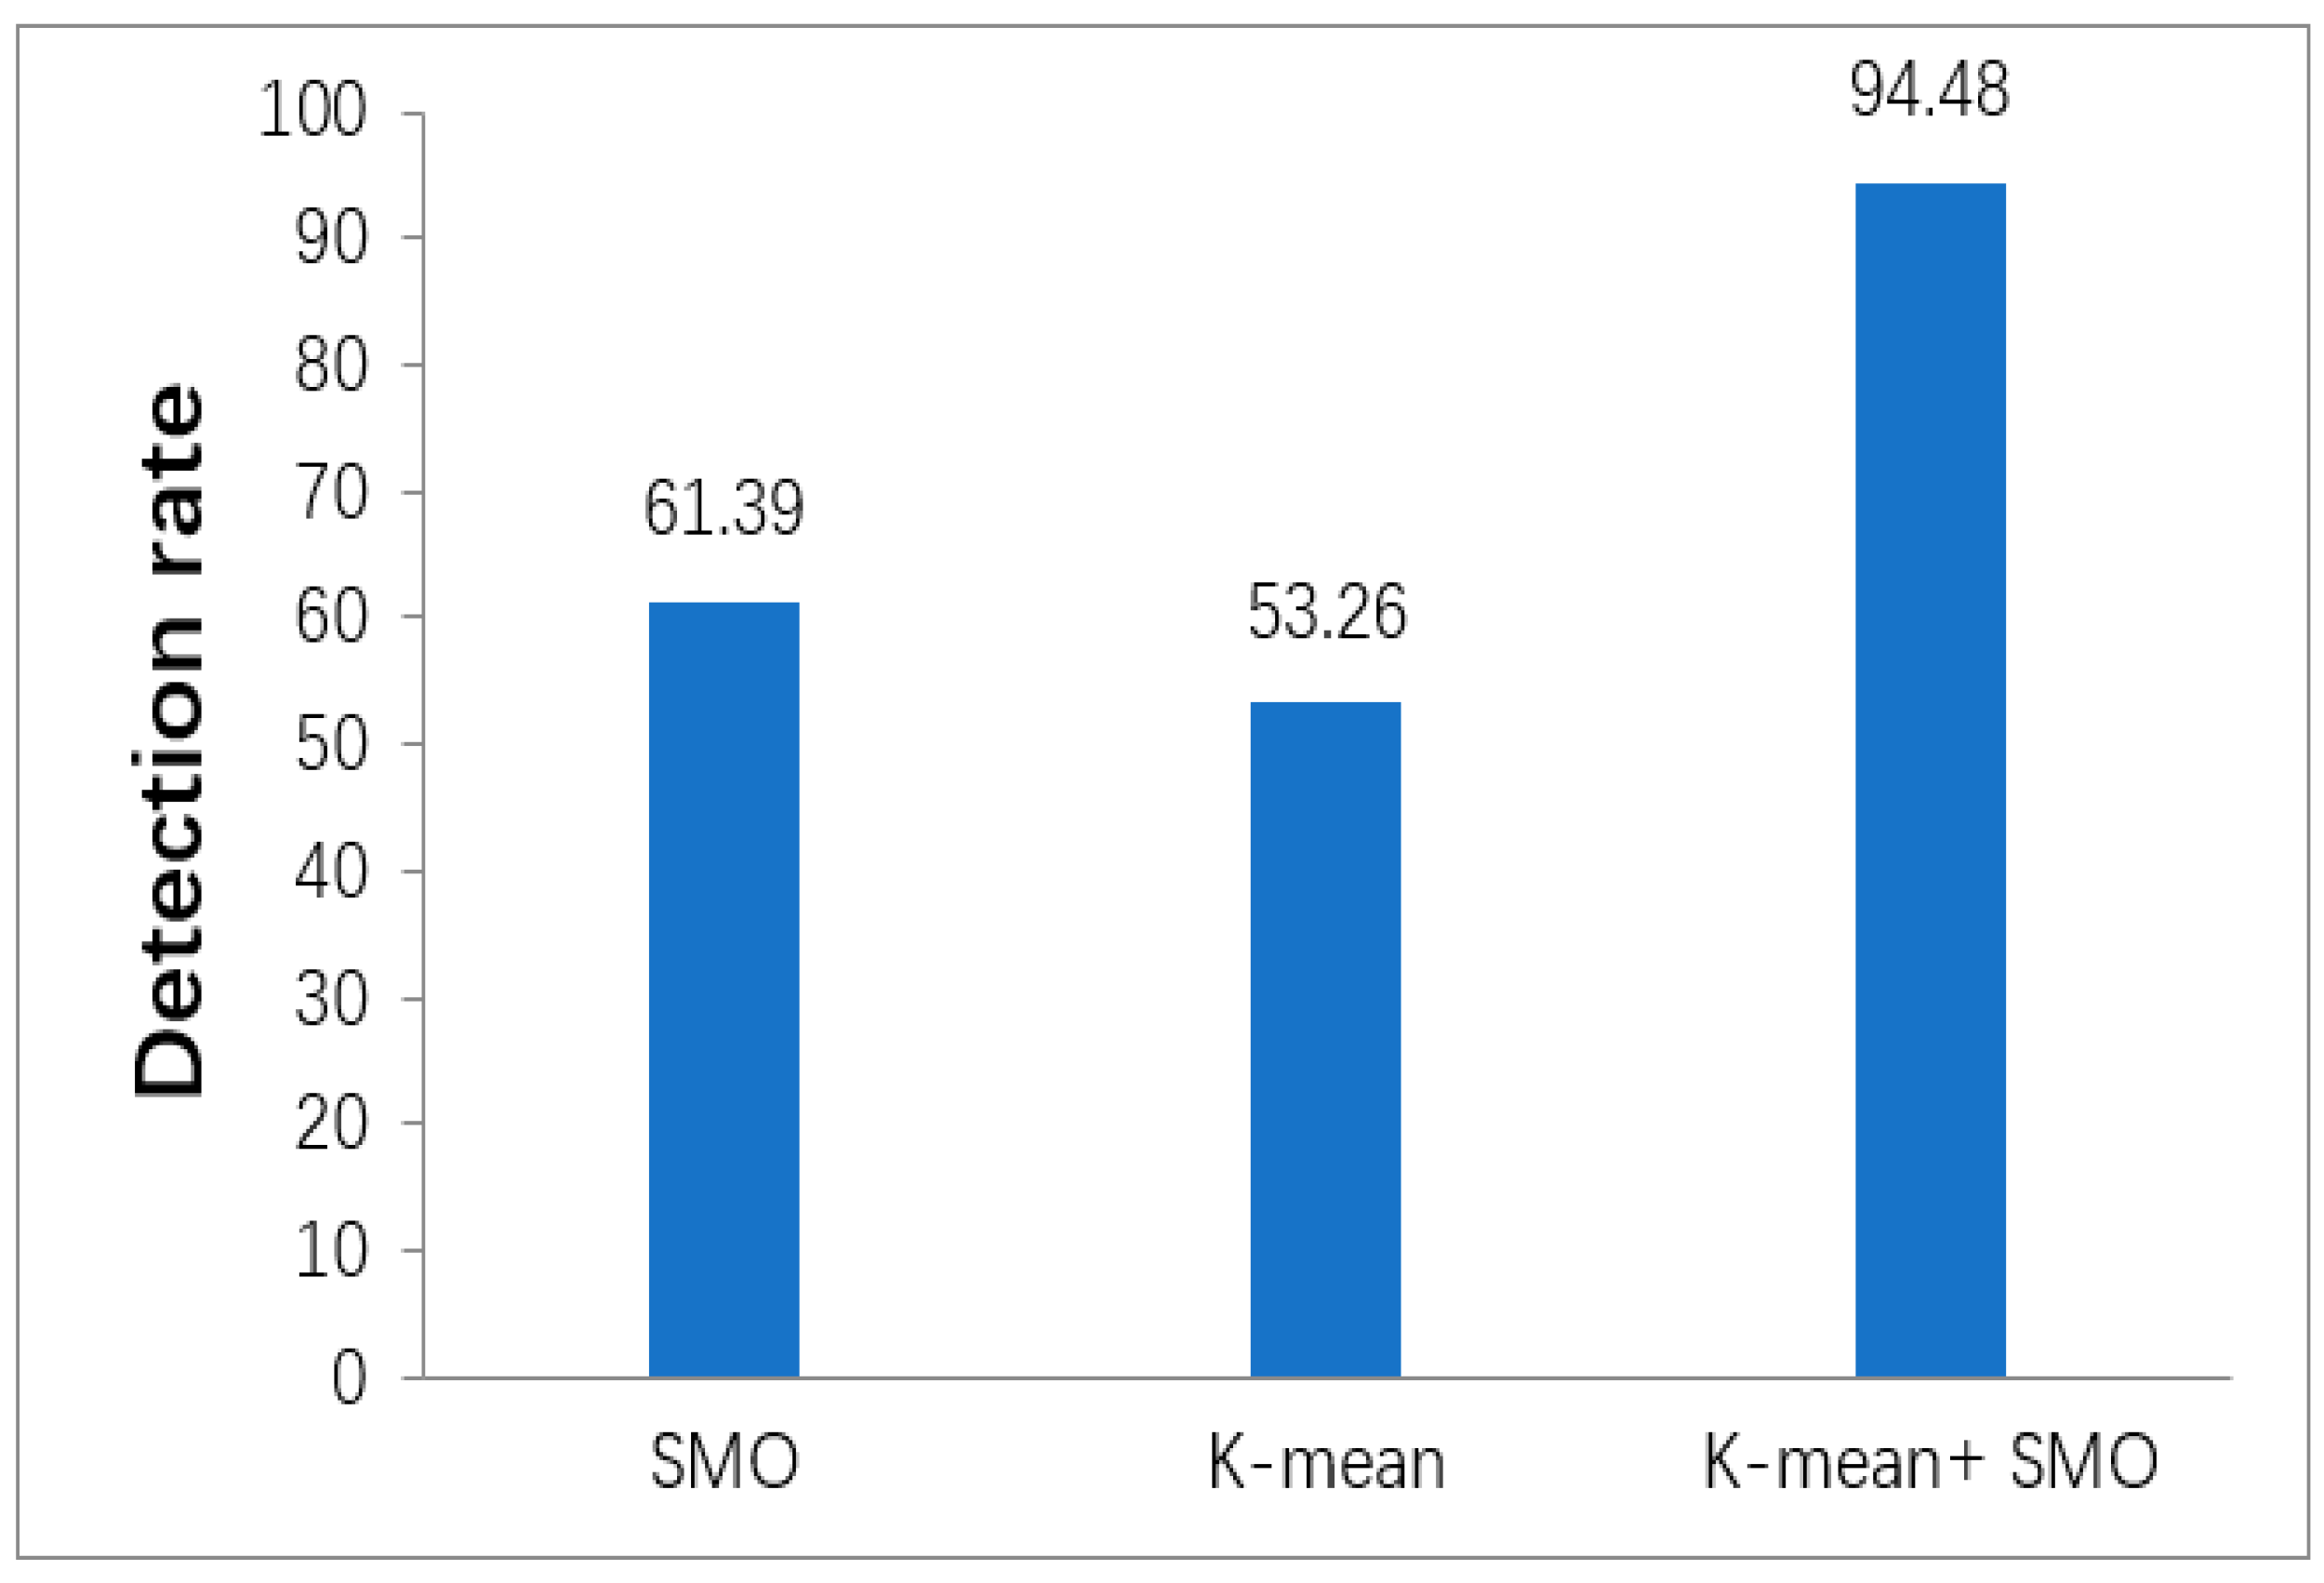
Figure 9 shows the comparison of the detection rate for K-mean, SMO, and SMO jointly with the K-mean DM. The detection ratio represents the correctness of a model for detecting intrusion. The experimental result shows that the proposed algorithm performs better in terms of correctness in detecting intrusion (94.48), while other individual DM techniques perform as follows: SMO = 61.39 and K-mean = 53.26.
The improvement obtained by the proposed method was the result of an increase in the detection rate and a decrease in the false alarm rate in the network ID. Owing to these two enhancement features, K-means enables testing of the classification performance on each feature set, while the supervised algorithm (SMO) improves the detection quality by reducing the number of features in the dataset.
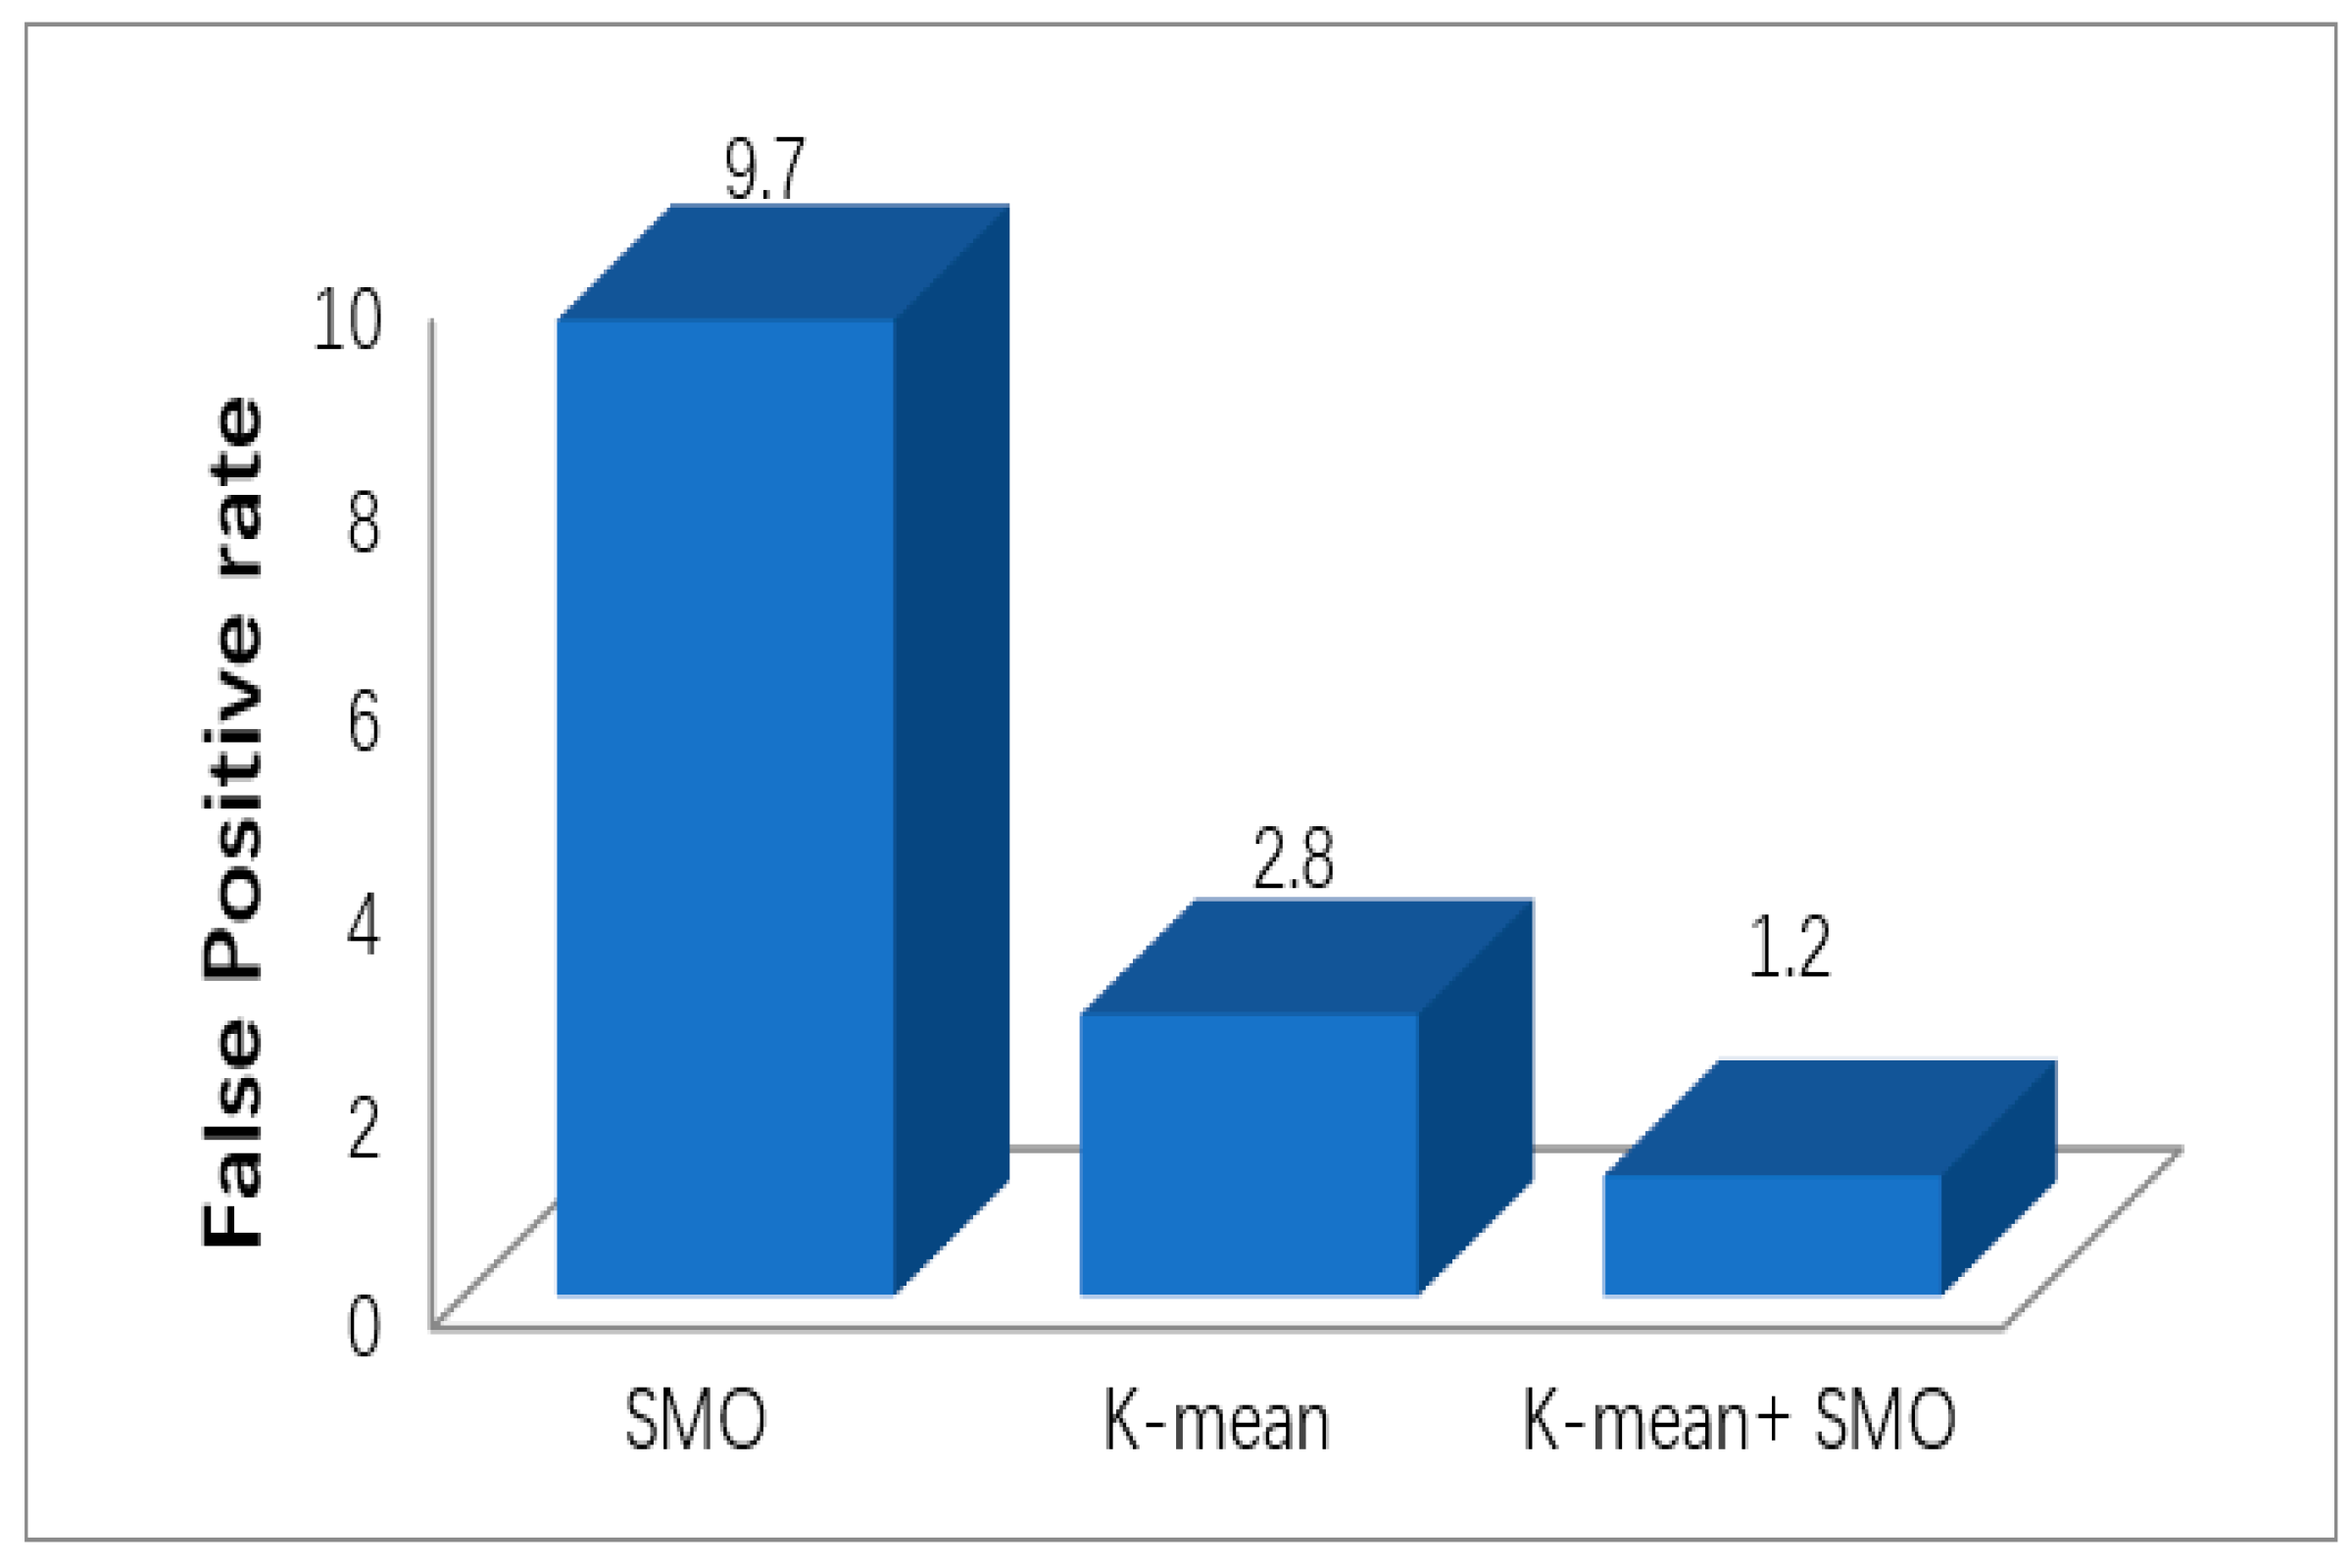
Figure 10 shows the comparison of false-positive rates for K-mean, SMO, and SMO jointly with K-mean DM. The false-positive rate of the proposed model performs better (1.2) compared to other individual models of DM techniques (SMO = 9.7 and K-mean = 2.8). This parameter is a very important measure to evaluate the performance of a model. Hence, the results show that the proposed model performs better than other models.
According to the results presented in
Figure 11 and
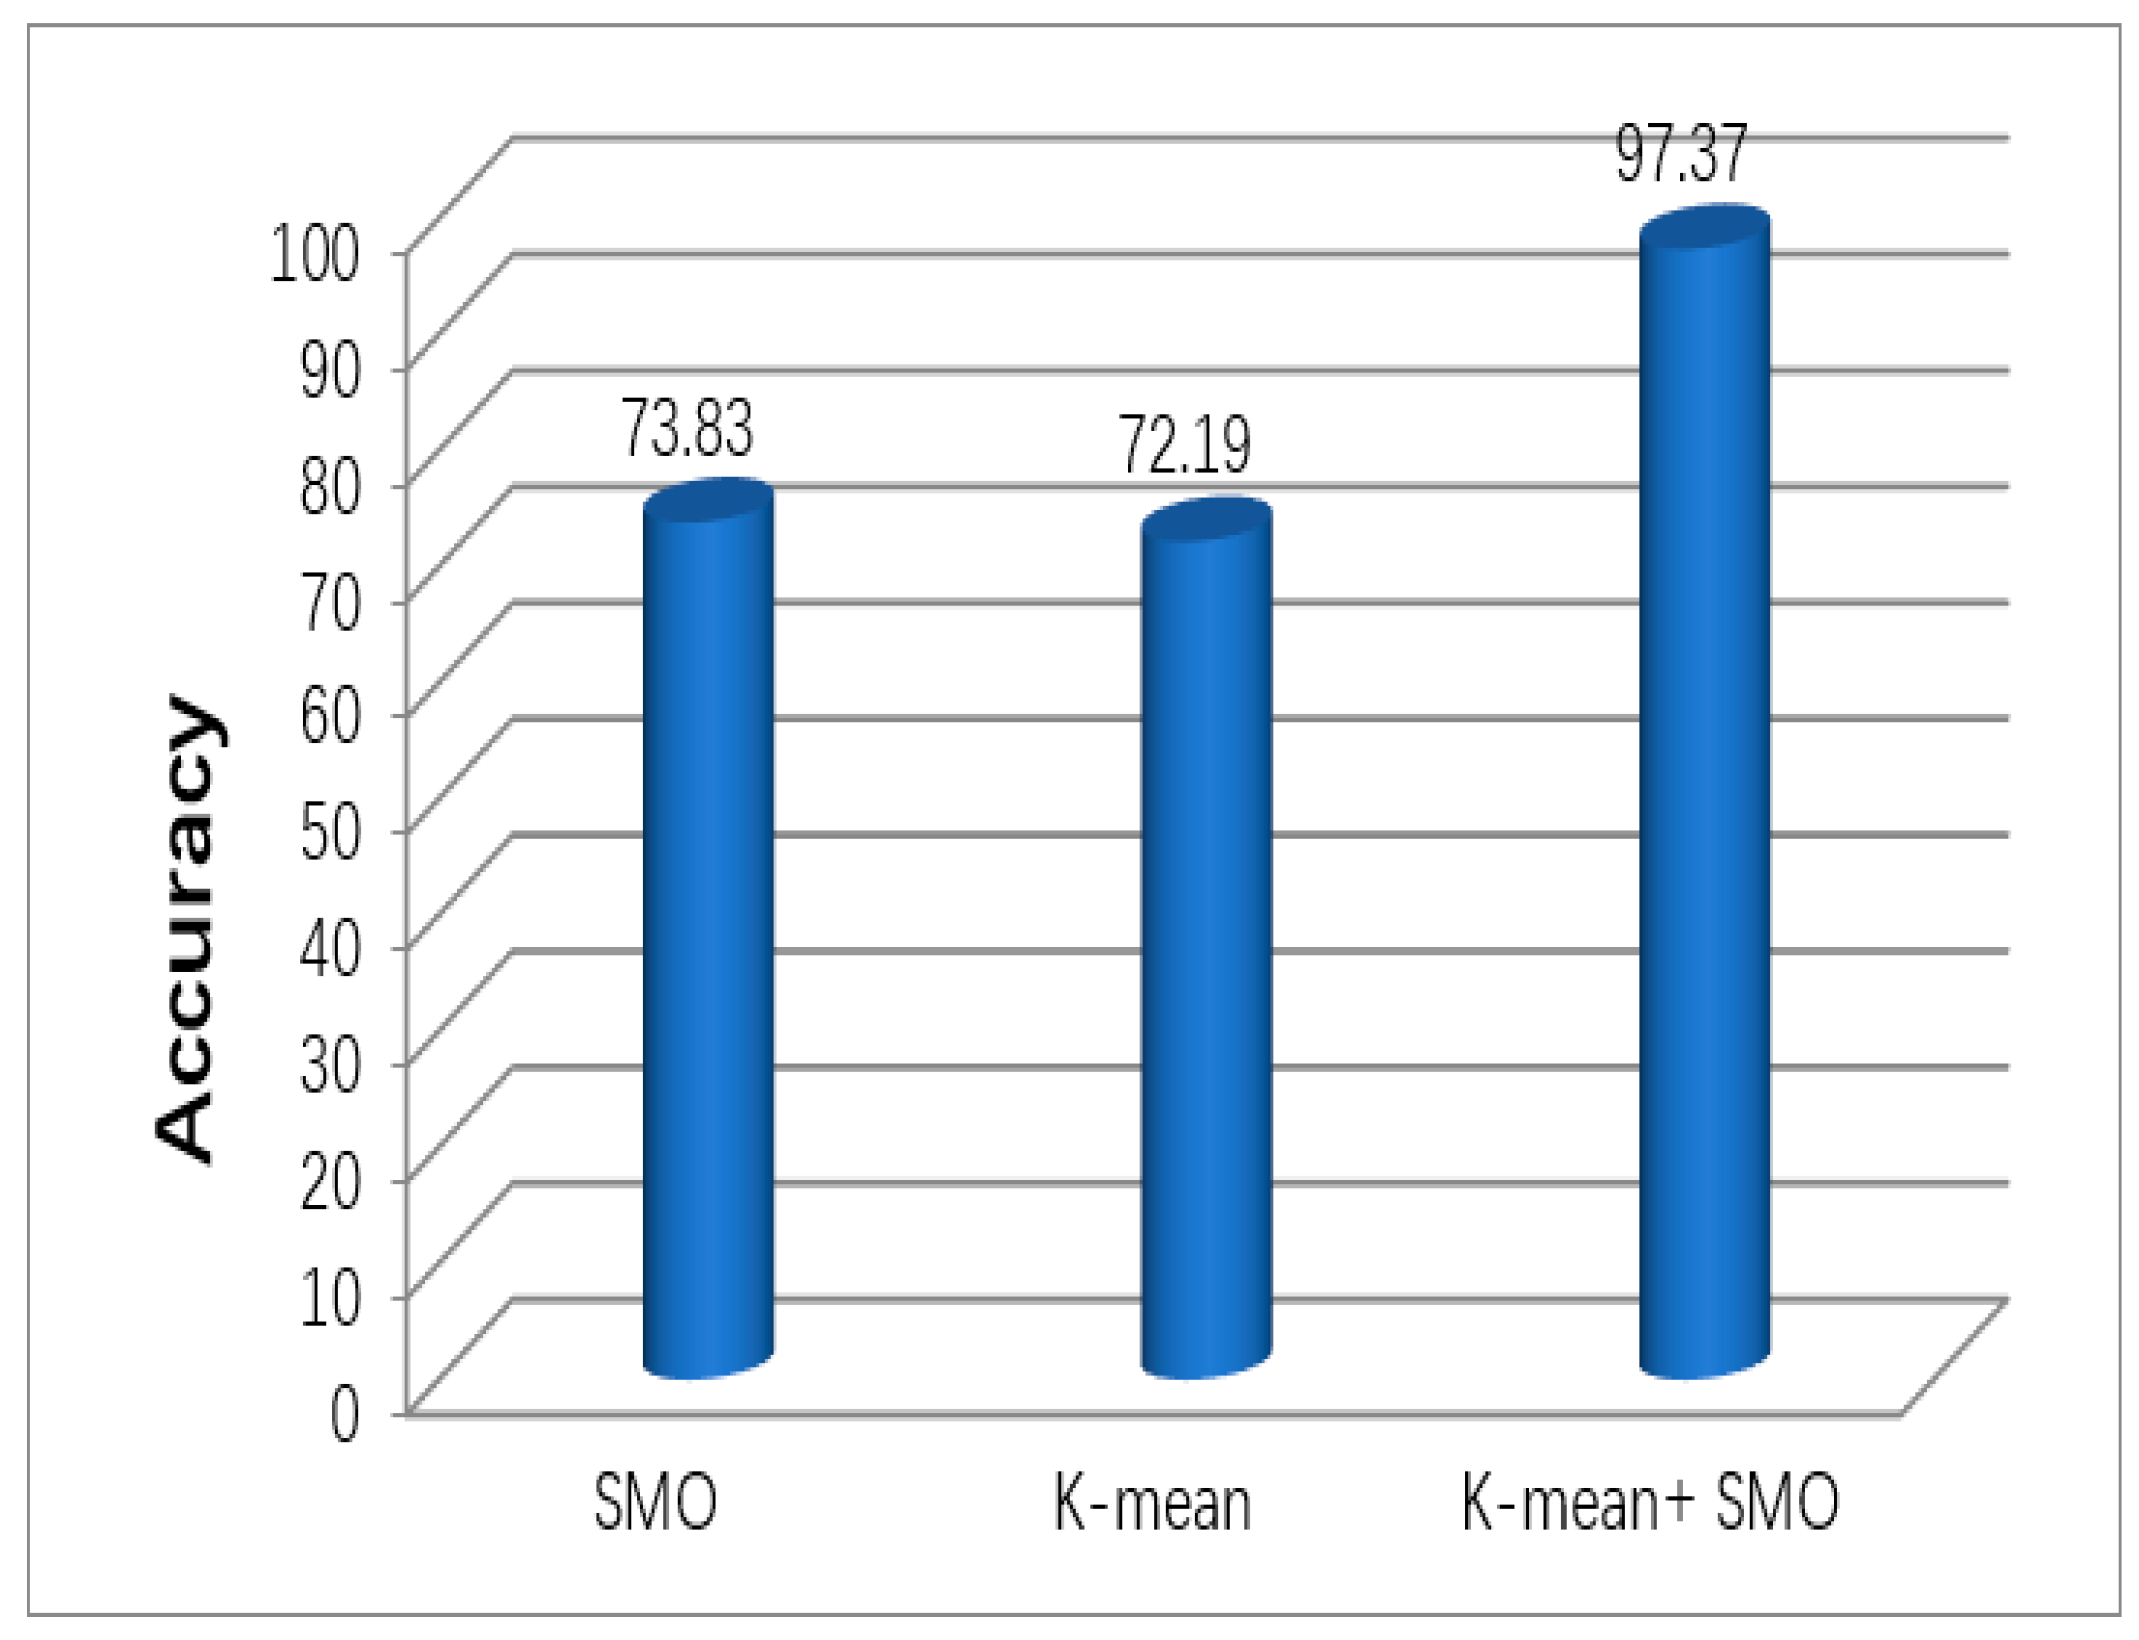
Figure 12, the experimentation results show that the proposed SMO jointly with the K-mean model is more accurate than the other individual DM techniques (SMO = 73.82 and K-mean = 72.188).
Figure 12 shows that the accuracy of the proposed SMO jointly with the K-mean model is 97.3695. The SMO jointly with the K-mean model accomplishes a better performance than the SMO and K-mean when applied separately.
In terms of anomaly detection probability or anomaly detection ratio, which is defined as the model correctness for ID, the computer experimental output presents that the SMO jointly with the K-mean algorithm also achieves better performance in terms of ID correctness (94.48), while other separated DM techniques perform as follows: SMO = 61.4 and K-mean = 53.3.
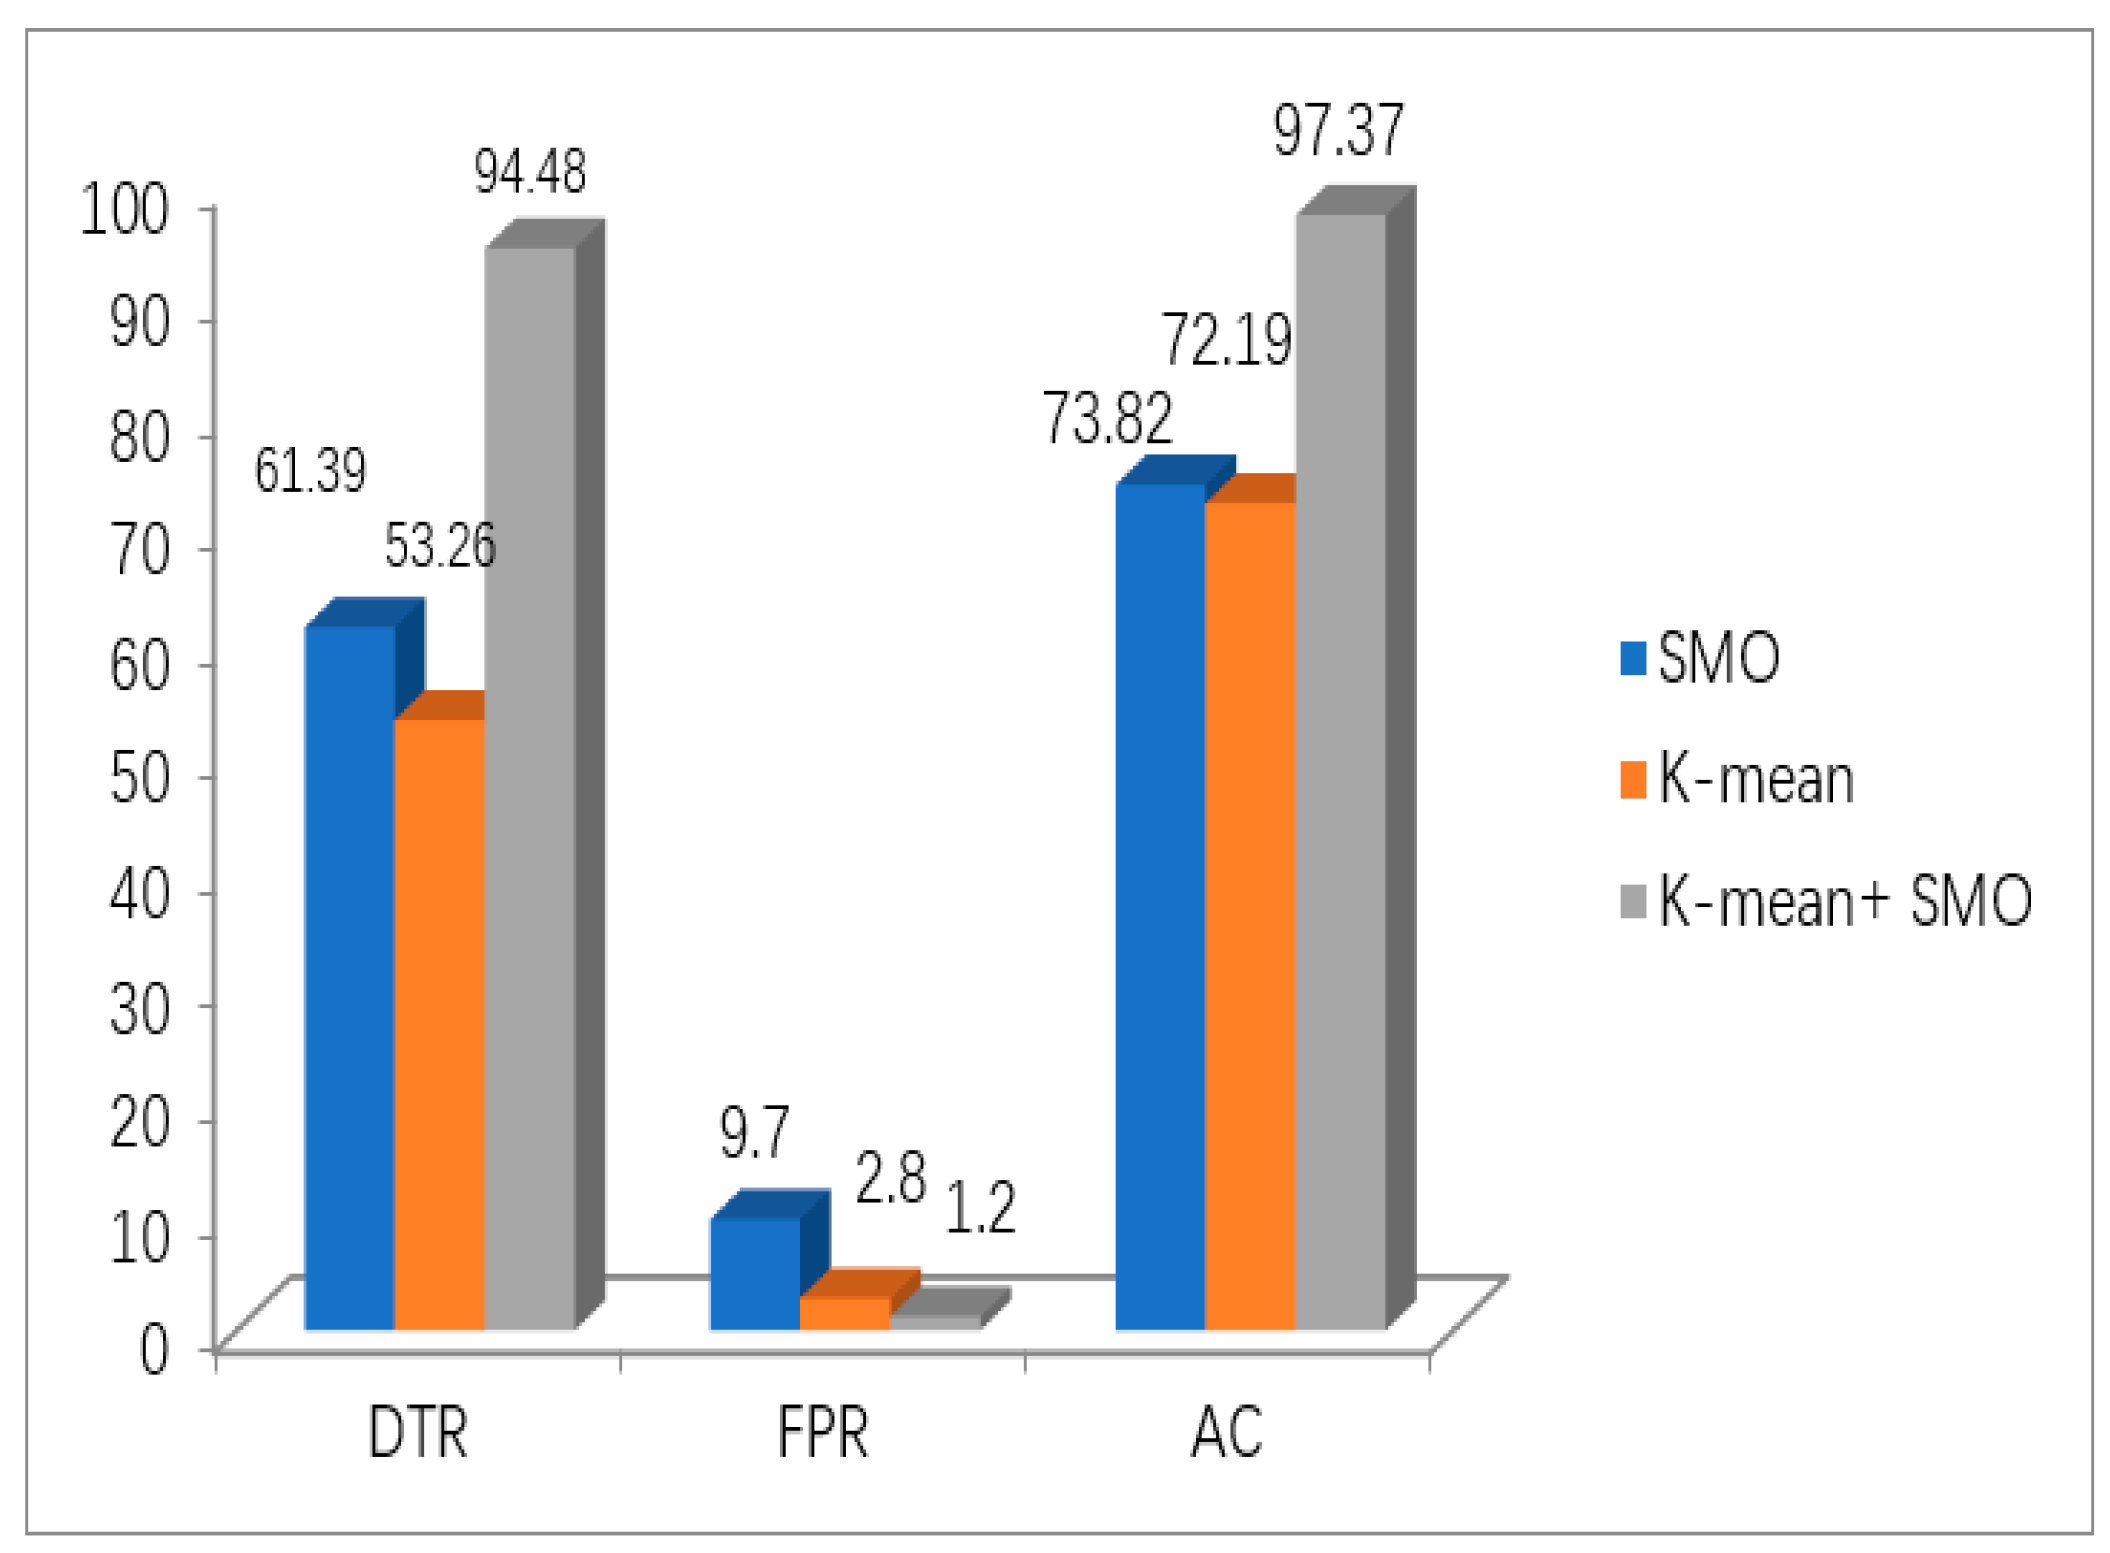
Figure 12 shows the performance of the DTR, FPR, and AC of the proposed hybrid model compared with SMO and K-means. The proposed model gives 1.5-times better performance than other models without the hybrid DM techniques (SMO = 9.7 and K-mean = 2.8). In addition, the accuracy and detection rates for the hybrid model are enhanced by approximately 74.97% and 60.6%, respectively, compared to other models. FAP is quite a significant parameter for the simulation design to assess the performance of the proposed approach. Therefore, the results presented that the SMO jointly with K-mean model performance was better than the other related models in the literature.
From the discussion and experimentation outcomes, it was shown that the application for various scenarios with evaluation parameters of the proposed algorithm, SMO jointly with the K-mean model, achieved acceptable results. By using the hybrid algorithm of DM dataset scenarios, the anomaly detection probability was enhanced significantly. For most of the scenarios, the main aim was to enhance the anomaly detection probability, but FAP was also reduced greatly, and detection accuracy was maximized.
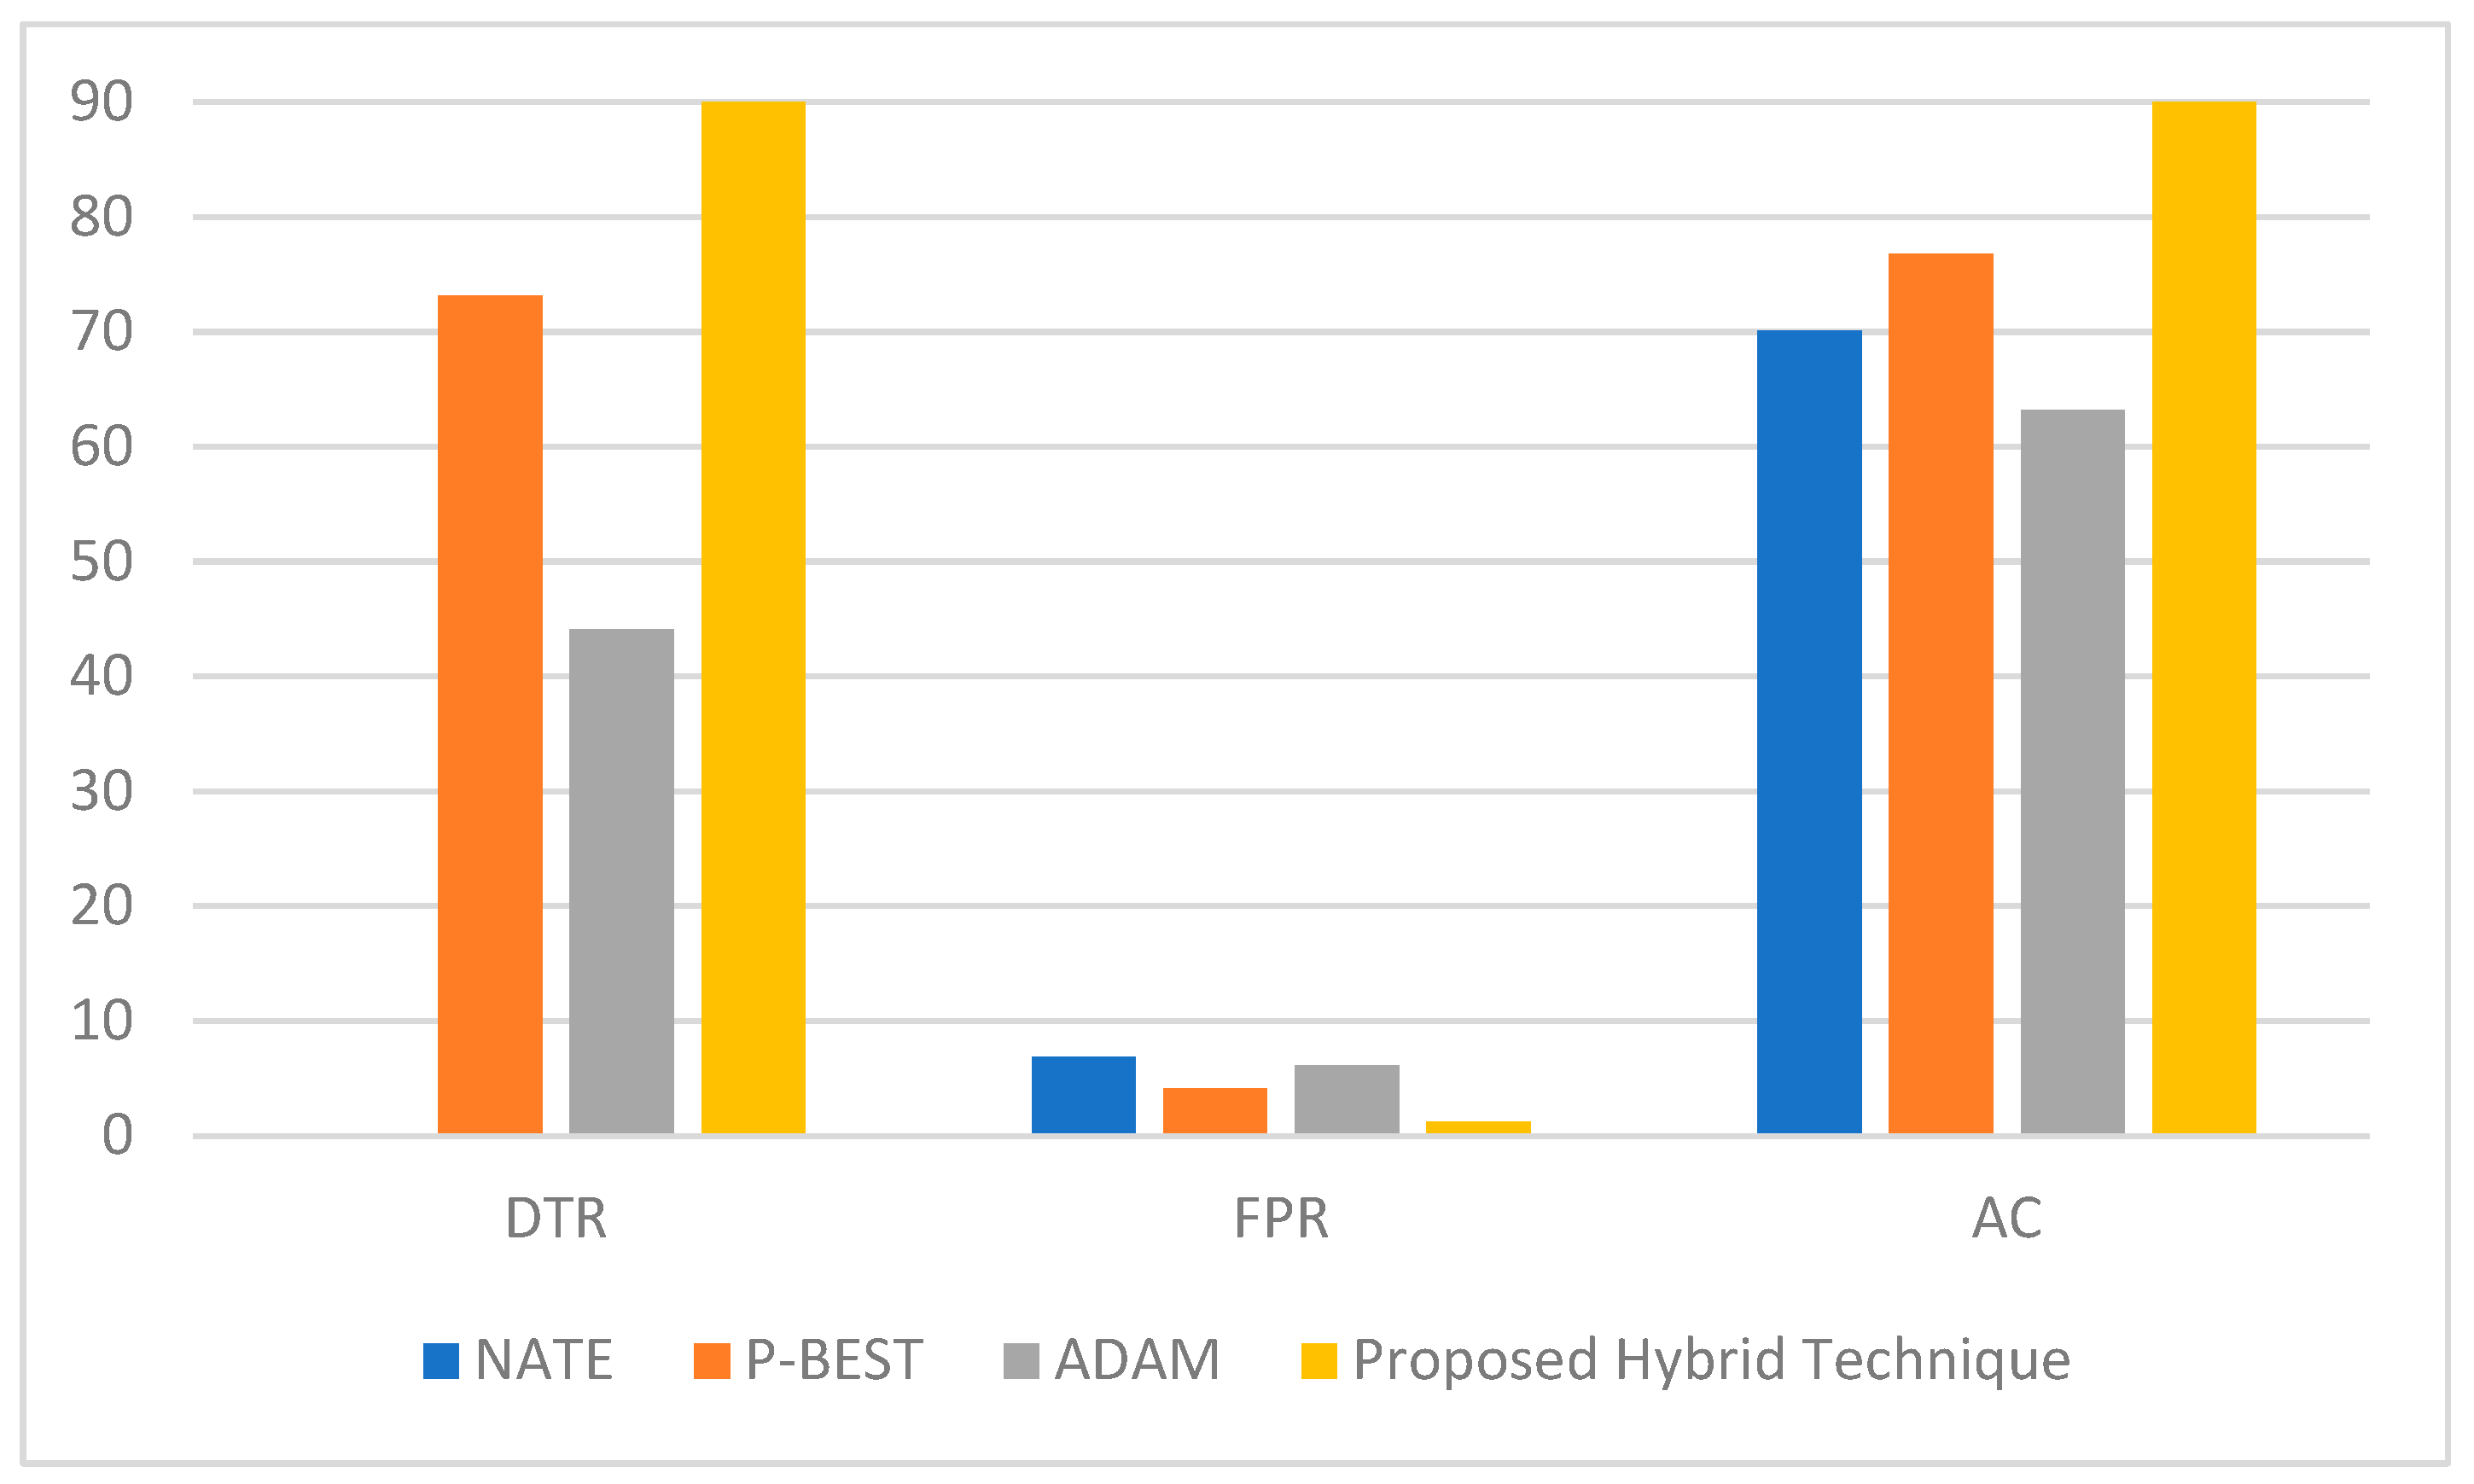
Figure 13 shows the benchmarking between the proposed hybrid algorithm and the other related algorithms in terms of DTR, FPR and AC. Similar parameters were used for all algorithms wherever applicable. The hybrid proposed algorithm shows better performance with about 18% from P-BEST with acceptable processing complexity.
6. Conclusions and Future Work
This study proposed a hybrid method for anomaly detection utilizing K-mean cluster formulation and SMO categorization. The methodology precisely addressed topics that arise in the framework of large-band databases. SMO utilizes feature selection in preprocessing stages to improve the dataset. The consistency-subset level and genetic search algorithm were used to choose certain features from the NLS-KDD dataset and eliminate the features that are inappropriate for the process before the clustering and categorization stages. Then, K-means was used for clustering to eliminate the training of the training datasets while keeping the processing time under a certain threshold.
The administered categorization algorithm known as SMO was adopted to enhance the detection quality. A benchmarking was conducted for the contributed approach using SMO jointly with K-mean DM with other related algorithms. The results present that the proposed algorithm outperformed recently and closely related works, i.e., NATE, ADAM, and P-BEST, using similar parameters and the environment by approximately 14.48%; the FAP was reduced by 12%, and a high accuracy of 97.4% was reached.
The proposed algorithm can be considered for anomaly detection in future DM systems, where online processing time is highly likely to be reduced. The justification is that the joint algorithm provides appropriate numbers of detectors to be generated with an acceptable accuracy detection and trivial FAP. Owing to a low FAP, it is highly expected to reduce the time of the preprocessing and processing.
However, a few challenges should be resolved, such as patterns and anomaly detection in massive datasets in real-time, and achieving a practically unlimited number of variables and processing power, which must be addressed by extensive research and development. The machine learning-based anomaly detection using k-mean array and sequential minimal optimization shows a significant efficiency and speed. However, with the increase of the real-time traffic volume on the network, it needs high-performance processing to maintain acceptable performance, especially in real-time analysis.
With data becoming a great business, any disturbance in enterprise data may cause serious outages that lead to exorbitant costs. Future works in ML-based data anomaly detection will be toward proactive schemes rather than reactive ones, where the detection of anomalies can be handled in near real-time. This makes ML algorithms have great potential in the near future.
In future work, the proposed approach will be evaluated on other standard training datasets to ensure its high performance. In addition, some other feature selection algorithms can be used that can select the more significant feature and make the system more effective. Additionally, the proposed method classifies the dataset into two classes. Future research can classify dataset into five classes: DoS, probe, U2R, R2L, and normal. Finally, a mathematical model for the proposed algorithm, using ML with K-mean SMO, is significant research work that deserves to be explored.


 ,
, 


