1. Introduction
In our modern culture, random numbers are easily encountered in everyday life, such as when tossing a coin, dice, and playing the lottery. They are used to protect users’ privacy and information in the digital information age. In addition, random numbers are also important for Monte Carlo simulations and in statistical analysis [
1,
2]. Information security means protecting information from various threats, and the types of threats include damage, alterations, and leakage during data transmission, reception, searches, storage, and processing. From the supplier’s point of view, information security involves the safe protection and operation of hardware databases, such as networks and systems, as well as the intelligence assets of computer facilities. On the other hand, from the user’s point of view, information security is meant to prevent the leakage and abuse of personal information. Random numbers are important for authentication. In the authentication process, random numbers are used to compare queries or are used as keys for encrypting and decrypting queries or messages [
3].
A random number is a randomly generated sequence, and the distribution of numbers should not be stochastic. Reliable random numbers are characterized by randomness, which is the property of a sequence to be random without statistical bias, with unpredictability in that the next number given a previous sequence cannot be predicted, and with non-reproducibility, which is a property according to which a sequence once generated cannot be reproduced. A random number applied to a high-level security system must be tested in terms of the aforementioned three properties of a random number and must pass all NIST-defined tests [
4]. A random number generator (RNG) is a system that generates unpredictable random numbers, and there are true random number generators (TRNG) and pseudo random number generators (PRNG). The TRNG has a characteristic of generating random numbers through a naturally existing entropy source, and the PRNG has periodicity because it generates random numbers according to a mathematical formula. Generally, TRNGs have been implemented in a small-area and low-power CMOS process targeting specific hardware, thus are not easily scalable to programmable hardware.
Entropy refers to the Shannon entropy used in statistical mechanics and represents the average level of information or uncertainty of a variable [
5]. Entropy is a quantitative indicator of uncertainty. Given a discrete random variable
, which occur with probability
, the entropy of
X,
, can be expressed as follows:
In contrast, a PRNG is based on software, and the output is determined by the SEED. The SEED of PRNG is comparable to the key to a lock, meaning that if the SEED is leaked to the public, all pseudo-random numbers will be reproduced by the attacker, defeating the security system. Hence, for a PRNG to generate safe random numbers, it needs a SEED generator that generates unpredictable random numbers. A typical example of a PRNG is a stream cipher, which is one of the structures of symmetric key encryption. The stream cipher has a structure that combines the random number generated according to the SEED and the data to be encrypted [
6]. The PRNG implemented in software requires a CPU and MCU as well as memory at the same time; hence, it has a disadvantage in that it is not safe for security requirements, and it is affected by the constraint of requiring a SEED generator that generates unpredictable random numbers. However, as the TRNG is implemented in hardware, there is no need to use any computing resources, such as a CPU or a MCU, nor any separate memory. Additionally, it does not require an external function block, such as a SEED generator because it uses a naturally existing entropy source [
7]. Typically, the TRNG used in the CMOS process utilizes meta-stability, oscillator jitter, and other noise sources, such as gate oxide and chaos.
The remainder of this paper is organized in the following manner:
Section 2 introduces existing issues with the conventional TRNG.
Section 3 describes a NIST 800-22a test suite.
Section 4 presents the proposed post-processing algorithms.
Section 5 and
Section 6 discuss TRNG circuit details and measurement results associated with the proposed post-processing algorithms, and
Section 6 provides the conclusion.
2. Existing Issues with the Conventional TRNG
As an ideal RNG, TRNGs must utilize unpredictable and high-performance entropy sources. However, the entropy source comes from the operating conditions or external disturbances; thus, the hardware-based TRNG is sensitive to changes in the process, voltage, and temperature (PVT) and external attacks that affect the quality of entropy [
8,
9]. Regarding these properties, there have been many active studies of TRNG post-processing techniques to improve intrinsic TRNG performance outcomes [
10,
11,
12,
13,
14]. Among PVT changes, the process variation is the only random parameter physically defined during the chip fabrication phase and not under the actual operating conditions. It is an unpredictable manufacturing error and causes various process deviations. One of the well-known mismatches is caused by an inconsistent etching and doping process at different wafer positions. Even with an identical material with an identical amount of processing time, the degree of etching can differ, resulting in errors in the width and depth. Wafer mismatch affects the operating speed of chips manufactured at each location due to the mismatch of the wafer thickness that occurs during the process of cutting and polishing the ingot. If there is process variation, the physical characteristics of the transistor, such as width (
W) and length (
L), change. The drain current of the MOSFET transistor is expressed as follows:
Considering
W and
L along with other variables associated with transistor parameter variations caused by manufacturing errors, we can statistically predict a certain range of the drain current. In other words, even circuits with an identical structure may have different performance outcomes.
Figure 1 shows two extreme examples of a cell that is biased due to process variations. Process deviation can be divided into FF, SS, FS, and SF cases according to
of PMOS and
of NMOS. In an inverter fabricated with a SF wafer, because
of NMOS is larger than
of PMOS, the duty cycle shrinks to less than 50% and is biased to 0. On the other hand, in the inverter is fabricated with a FS wafer, because
of PMOS is larger than
of NMOS, the duty cycle exceeds 50% and is biased to 1.
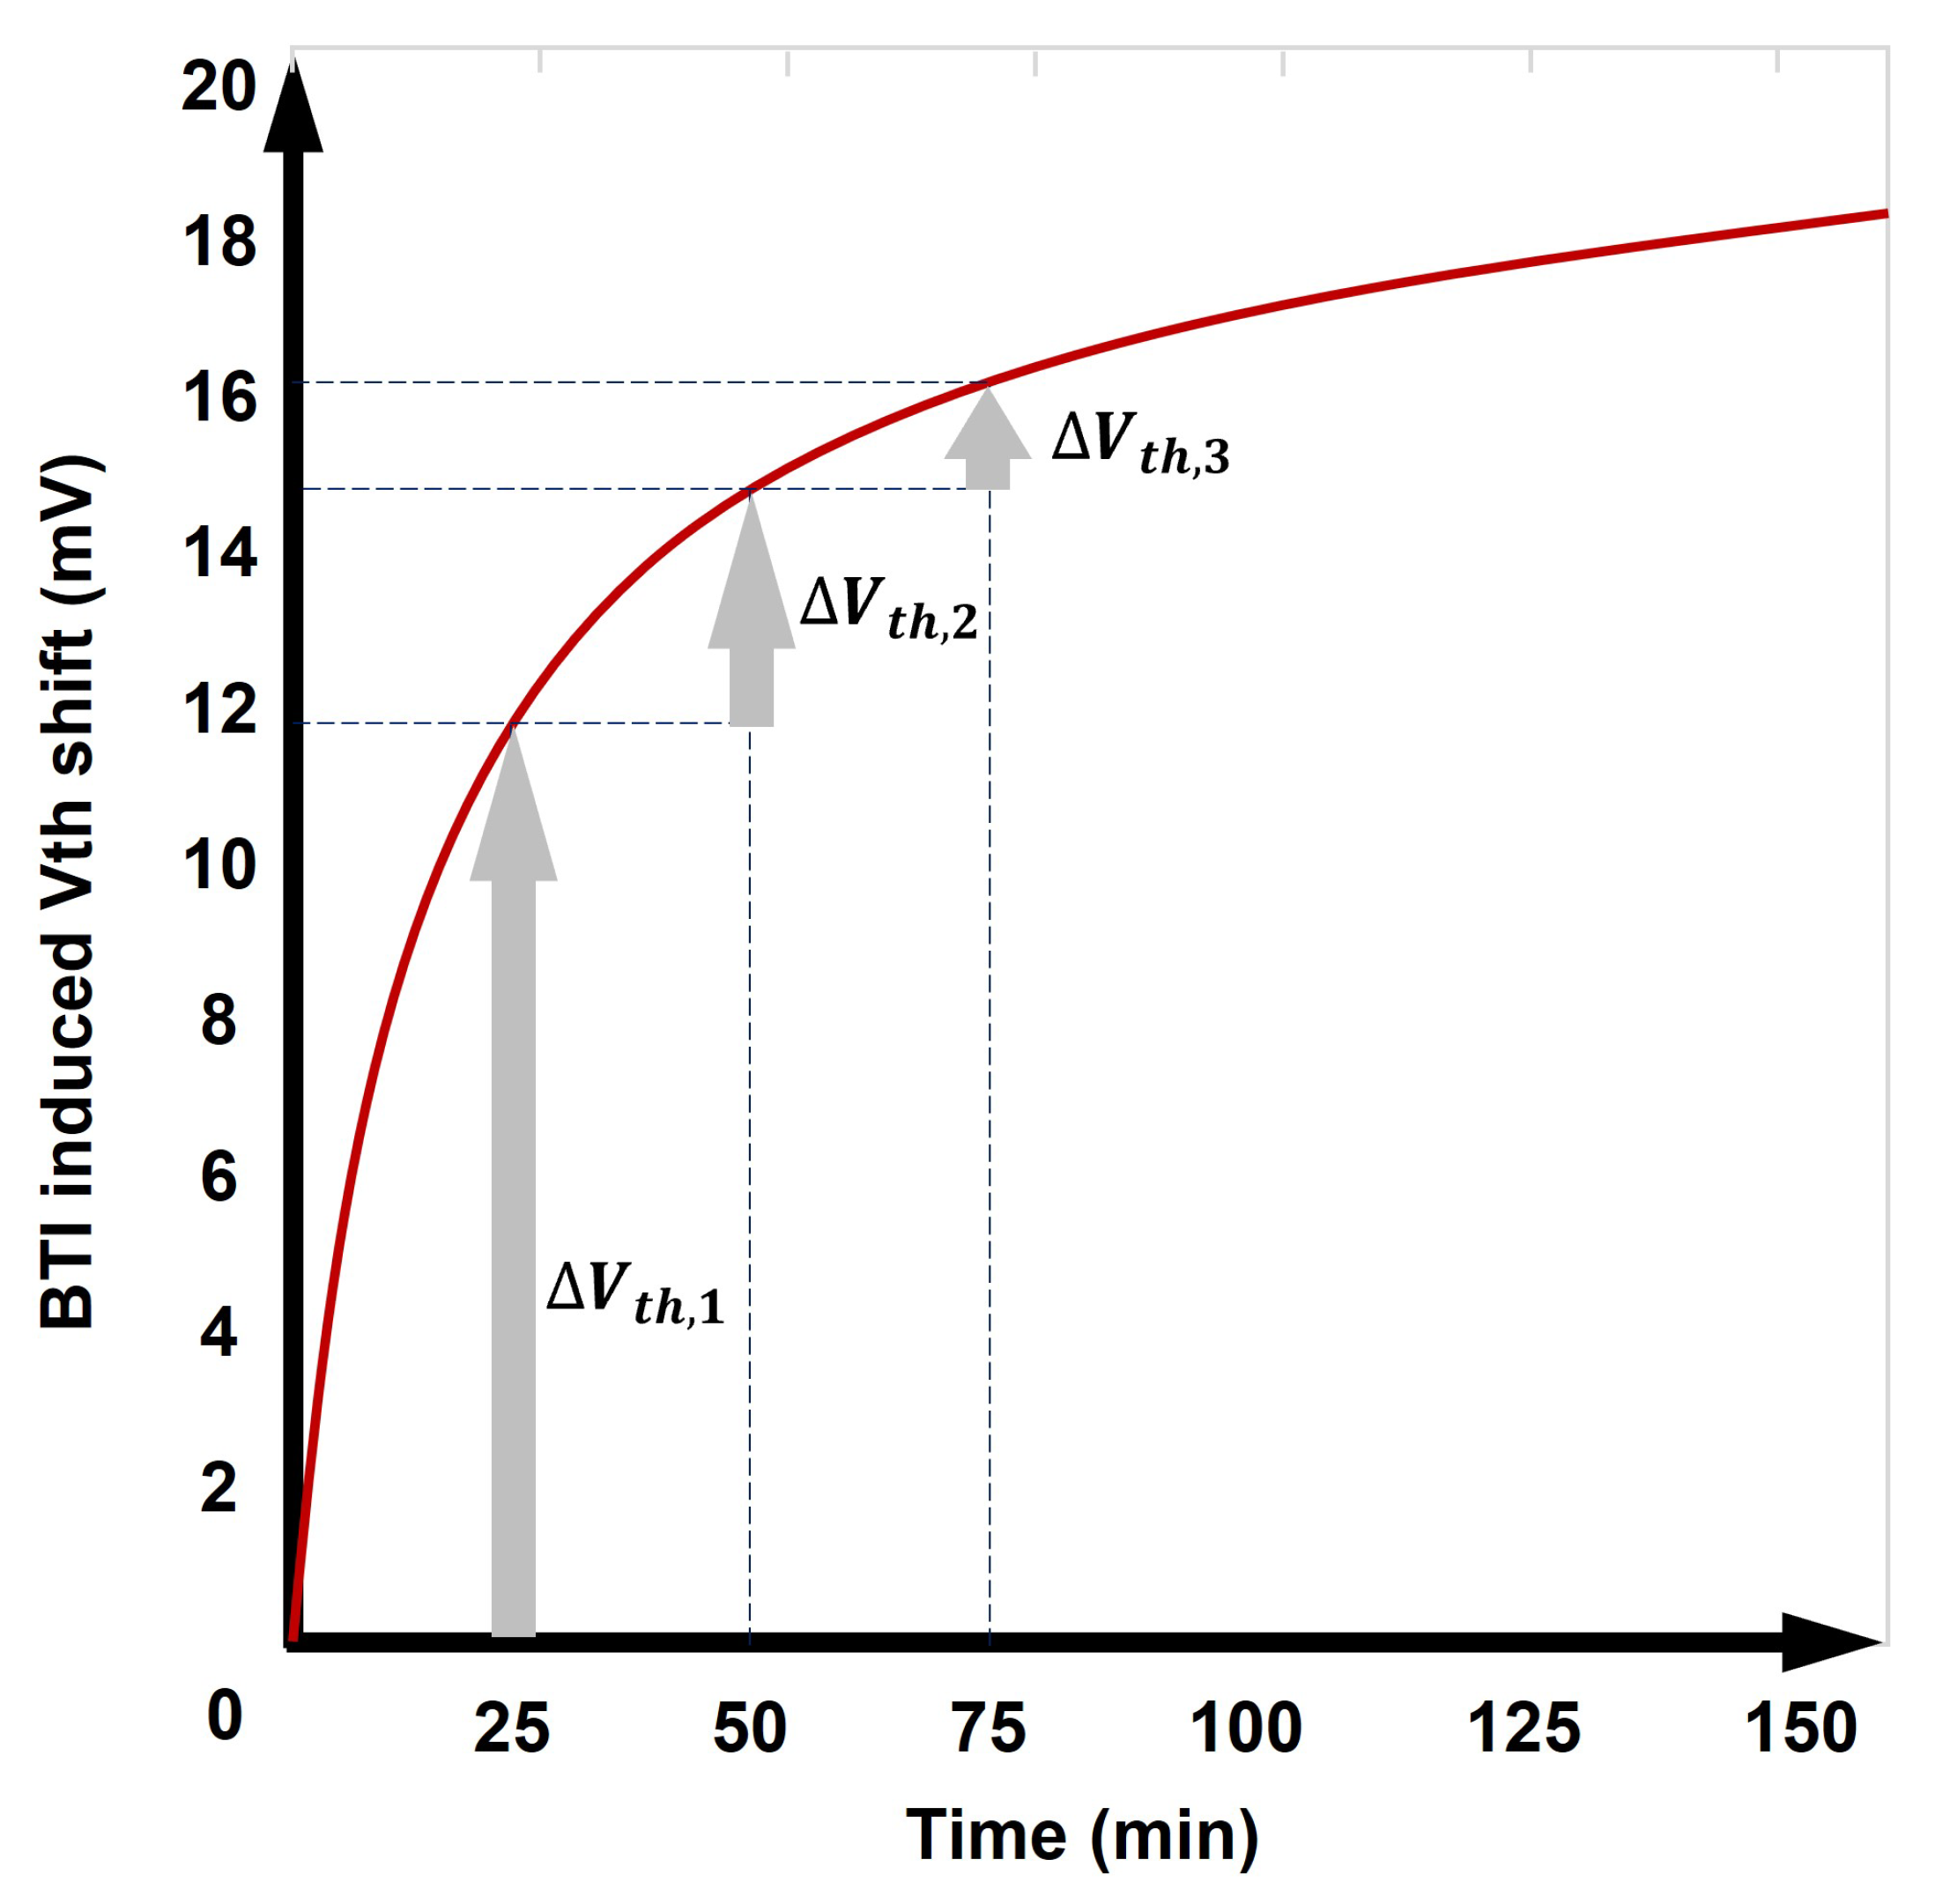
In addition to this process, there is the aging of silicon as a factor that affects the performance of a TRNG. As silicon ages, the
of the transistor changes, which greatly affects the performance of the TRNG [
10,
15]. As the size of the process decreases, the length of the transistor channel also becomes shorter. In this case, electrons receive a high electric field due to HCIs (hot carrier injections), a short-channel effect, and deteriorate the quality of the insulating film of the gate [
10]. Another phenomenon that arises during transistor operation is BTI (bias temperature instability). Given that the BTI characteristics change during the bias of the transistor, the
of the transistor continues to change, as shown in
Figure 2.
3. NIST 800-22a Test Suite
In order to evaluate the performance of random numbers, tests by statistical methods have been widely used. Security Levels of Federal Information Processing Standard (FIPS) FIPS 140-2, a US federal information processing standard, addresses the security requirements that cryptographic modules must satisfy [
16]. The Diehard test is a statistical test for measuring the quality of RNGs and has been developed by George Marsaglia for many years, thus far consisting of 12 sub-tests [
17]. The document AIS.31 of the German Federal Information Technology Security Agency (BIS) (Bundesamt für Sicherheit in der Informationstechnik) describes the evaluation criteria for RNGs and consists of eight sub-tests [
18]. Each of the analytical tests is contained in documents 800-22a of the National Institute of Standards and Technology (NIST). This document introduces a method to verify the randomness of a random number generator applicable to encryption.
NIST 800-22a introduces two approaches to the test results, the
p-value and proportion.
Table 1 shows an example of the NIST test results. According to the results, the
p-value and the proportion values of each test are recorded, and pass or fail on the test is determined according to the authenticity of a specific condition. The
p-value approach determines the uniformity of the
p-value distribution. For each test, the minimum number of tests is determined from the value of
. If
is set to 0.01, the minimum number of tests is 100 in order to reflect a rejection ratio. Therefore, each test is performed with 100 sequences. Each of the 100 sequences results a corresponding
p-value, and the test result is divided into the values of C1 to C10 according to the distribution. C1 is the number of cases in which each
p-value in the test group exists between 0 and 0.1, C2 is for those existing between 0.1 and 0.2 and C10 denotes the number of cases in which each
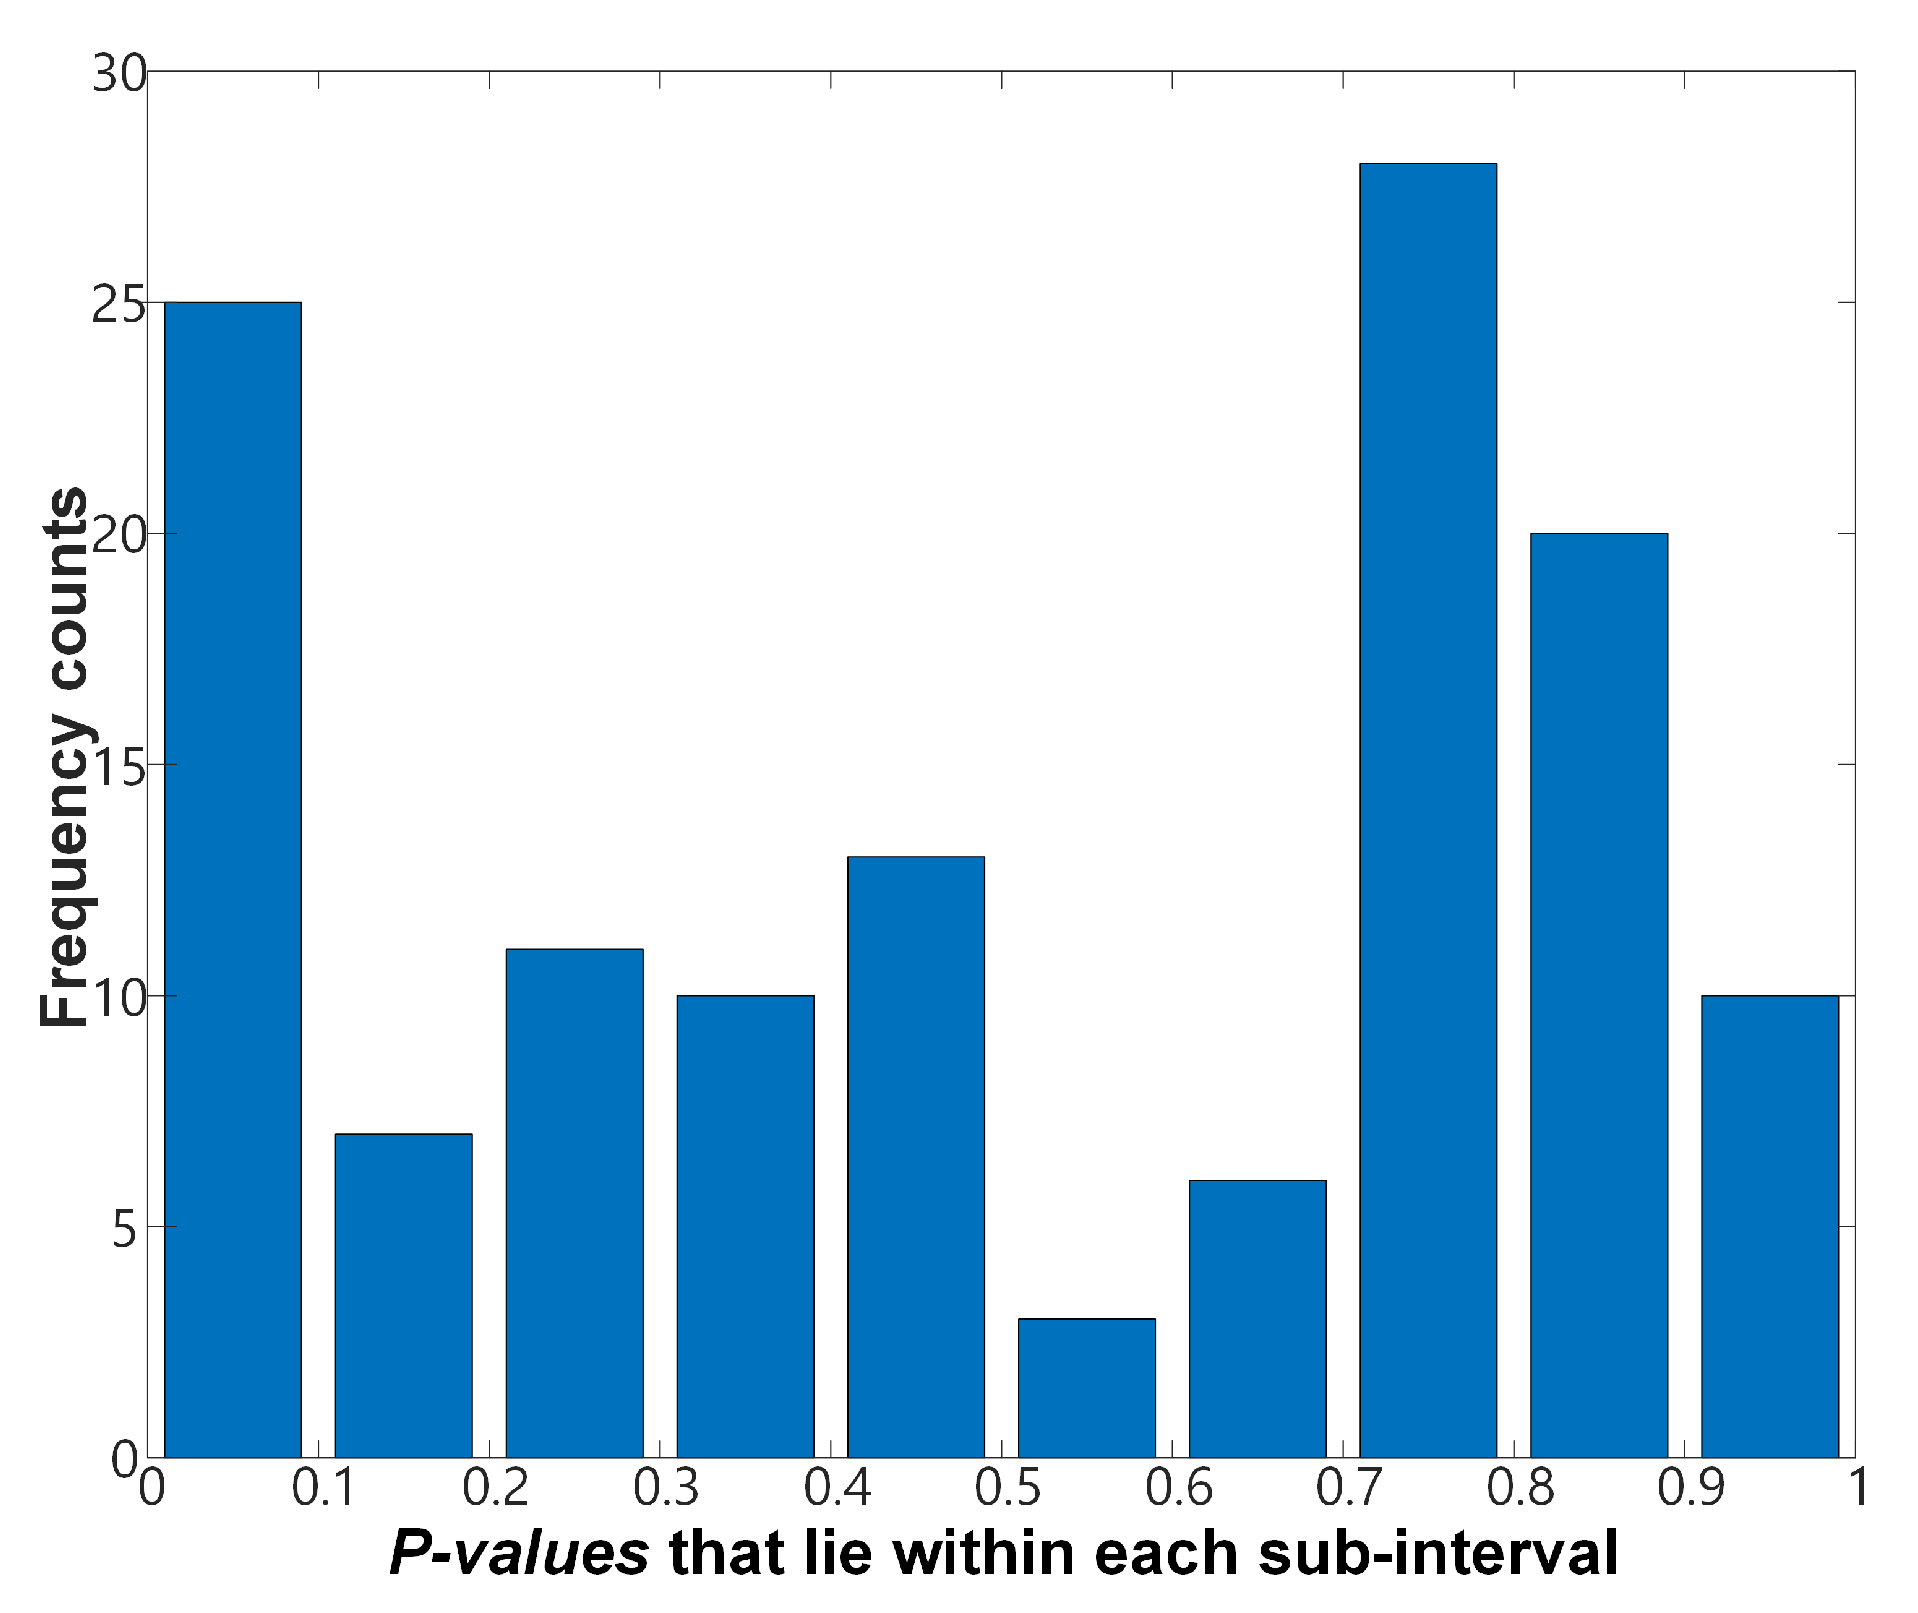
p-value in the test group is between 0.9 and 1. Therefore, the grand sum of the value from C1 to C10 becomes 100. The values from C1 to C10 are used for the Chi-square test, based on a statistical method (Chi-square distribution), and if the
p-values are skewed to one side, as shown in
Figure 3, the overall
p-value becomes very low such that it can be rejected. In the proportion approach, the proportion value of passed sequences is calculated from the empirical results of statistical tests. The allowable range of the ratio can be defined as
, where
. For example, if
is 0.01 and
m is 100, the proportion value then becomes 0.96; likewise, if
is 0.001 and
m is 1000, the range of the ratio is calculated as 0.98. The range of the allowable ratio of 0.96 indicates that 96% of
m tests have to pass the proportion approach. In this paper, we set
and
m to 0.01 and 100, respectively.
From a cryptographical perspective, SP 800-90A, B, and C documents written by US NIST clearly describe how a TRNG should be operated and evaluated [
19,
20,
21]. According to the document SP 800-22a of US NIST, there are 15 verification tests concerning cryptographic stability perspectives [
22]. Most of the verification tests in the test suite utilize a standard normal distribution and a Chi-square (
) test as a reference distribution. Assuming that the RNG generates statistically random bits, the standard normal distribution is used to compare the test results from the RNG with the theoretically expected values. Moreover, the
distribution is used to check how well the observed frequencies of the measured samples match the expected frequencies of the hypothesized distribution.
4. Proposed Post-Processing Algorithms
The post-processing algorithm proposed in this paper is targeted to supplement the randomness of the TRNG among the three characteristics of randomness, unpredictability, and non-reproducibility. The discarding-based post-processing technique was devised in two steps, and it is largely divided into an algorithm that discards the cell with the worst performance and a bit with poor randomness, individually. The algorithm for discarding cells is mainly focused on solving the process variation issue, and bit discard is designed to eliminate bits with poor randomness due to aging of the TRNG. In the cell-discard algorithm, the cell with the worst performance is discarded by taking advantage of the characteristic that the performance is different for each manufactured cell, as illustrated in
Figure 4. In the bit-discard process, bits generated by TRNG undergo a Hamming weight (HW) test and a
test, and bits that do not pass these two tests are discarded. Here, HW is the Hamming weight used in information theory, and it can be used as an index to determine the randomness of a TRNG. The
HW can be expressed as follows:
where the
i-th bit in an arbitrary bit string composed of
N bits is
. For example, given that the number of non-zero components in the bit string listed as 0010111 is 4, the
HW is 57.14% (=4/7). For an ideal TRNG, the
HW converges to 50%.
4.1. Cell-Discard Algorithm
A cell-discard algorithm is designed for removing biased cells. In this algorithm,
N bits of data are accumulated for each TRNG cell. If the value of the total HW exists within the range of the condition, it is determined that there is no cell with sufficiently random or biased values of random numbers generated from all TRNG cells, and the algorithm for discarding cells is terminated. An example is shown in
Figure 4. If the value of the HW does not exist within the range of the condition, the algorithm to discard the cell proceeds. In the algorithm for discarding cells, the HW is calculated for each cell of the TRNG composed of
M cells. The cell with the worst HW is discarded, as it is considered to be a biased cell. The cell-discarding algorithm is repeated until the value of the HW satisfies the condition after discarding.
4.2. Bit-Discard Algorithm
An algorithm for enhancing the performance of a cell-discarded TRNG is an algorithm for discarding bits. In the bit-discard algorithm, there are two major bit-discarding processes: discard from a HW test and discard from a Chi-square test. In a bit discard from a HW test, bits that do not satisfy the condition among N bits generated from M TRNG cells are discarded. Bits generated from a TRNG follow the shape of a probability distribution. Therefore, these bits are composed of bits within the range of conditions selected in this paper and bits outside of the range of conditions. If this condition is not satisfied, the corresponding bit string is discarded. If the condition is satisfied, the test, which is a uniformity test of the p-value, is conducted. During the test, the p-value of the bits is calculated to verify how evenly the p-value is distributed, and the test proceeds in the following order (i.e., N = 10,000).
- (1)
All N bits are composed in the form of 100-by-100.
- (2)
Calculate the p-value for 100 bits corresponding to each bit string.
- (3)
Store the distribution values of each p-value from to (number of samples that satisfy the p-value of the bit).
- (4)
Calculate
, the
p-value from the following function: (igamc: see
Appendix A)
- (5)
Bits with a p-value of less than 0.0001 are discarded, and bits with a value of 0.0001 or more are accepted as the final random number.
5. TRNG Topology
One of the simplest and most widely used TRNG circuits is a cross-coupled inverter. Here, the back-to-back connected inverter has meta-stability or bi-stability, resulting in an opposite digital code at each output terminal. According to the positive feedback paths of each inverter, any form of asymmetric noise during a power-up sequence contributes to generate random output bits [
7]. The cross-coupled inverter-based TRNG has the advantage of a simple structure; however, the degree of entropy used by the circuit to generate a random number is too low, making this type vulnerable to the prediction of the security key by an external attacker. In order to increase the level of entropy while generating a random number, time-domain noise can be used along with a supply voltage disturbance during the start-up process. An oscillator-based TRNG is a typical topology which determines random output bits while comparing the frequency difference between two oscillators [
23,
24,
25,
26].
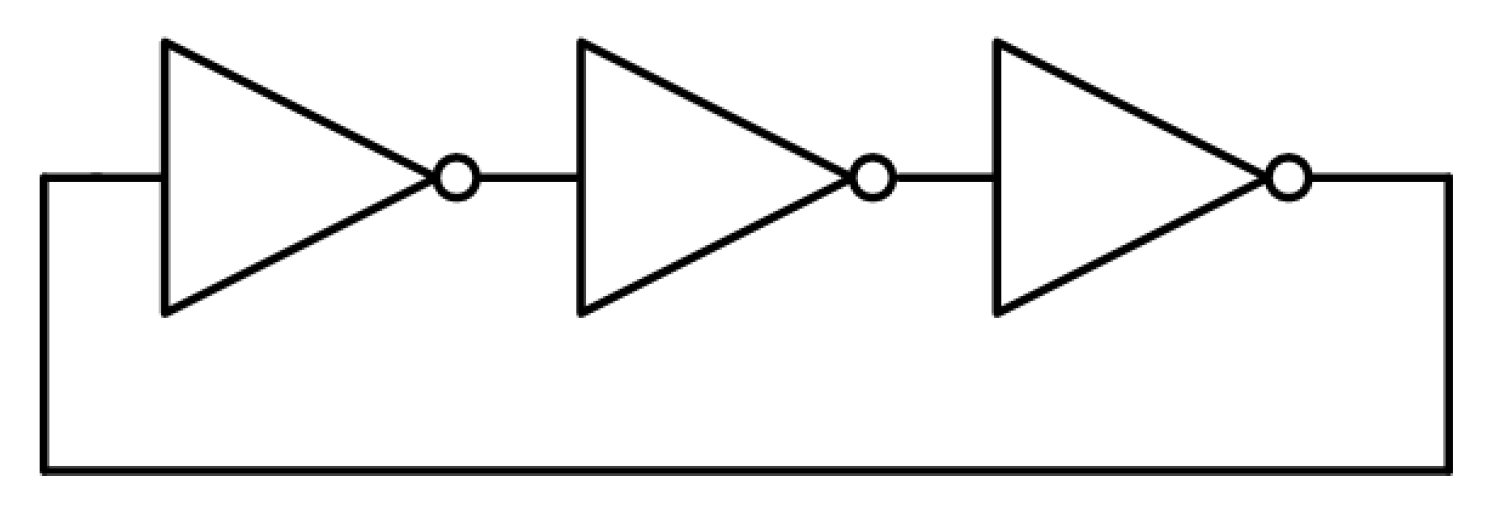
In this work, a ring-oscillator-based TRNG was designed using a general 65nm CMOS process.
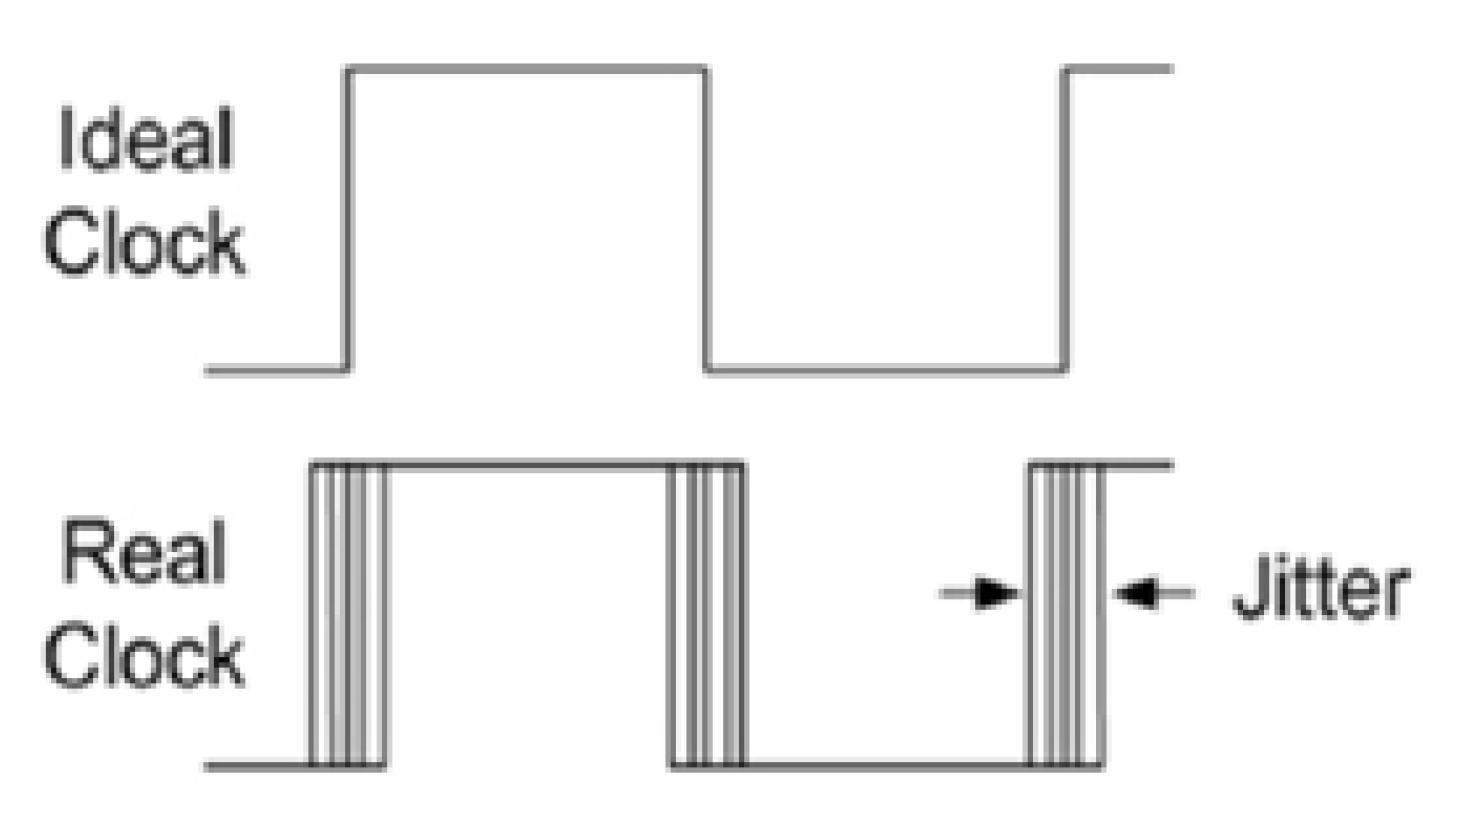
Figure 5 shows the basic ring oscillator structure. The three-stage ring oscillator has a structure in which the input and output are connected to each other such that the oscillator continues to oscillate after power is applied. During the oscillation of the ring oscillator, the unpredictable jitter component that arises in the real clock signal is accumulated, as shown in
Figure 6. Jitter affects the oscillation frequency of the ring oscillator and is considered a source of entropy. A TRNG with a ring oscillator structure has a simple structure compared to a TRNG with other types of structures, making it easy to access and easy to implement.
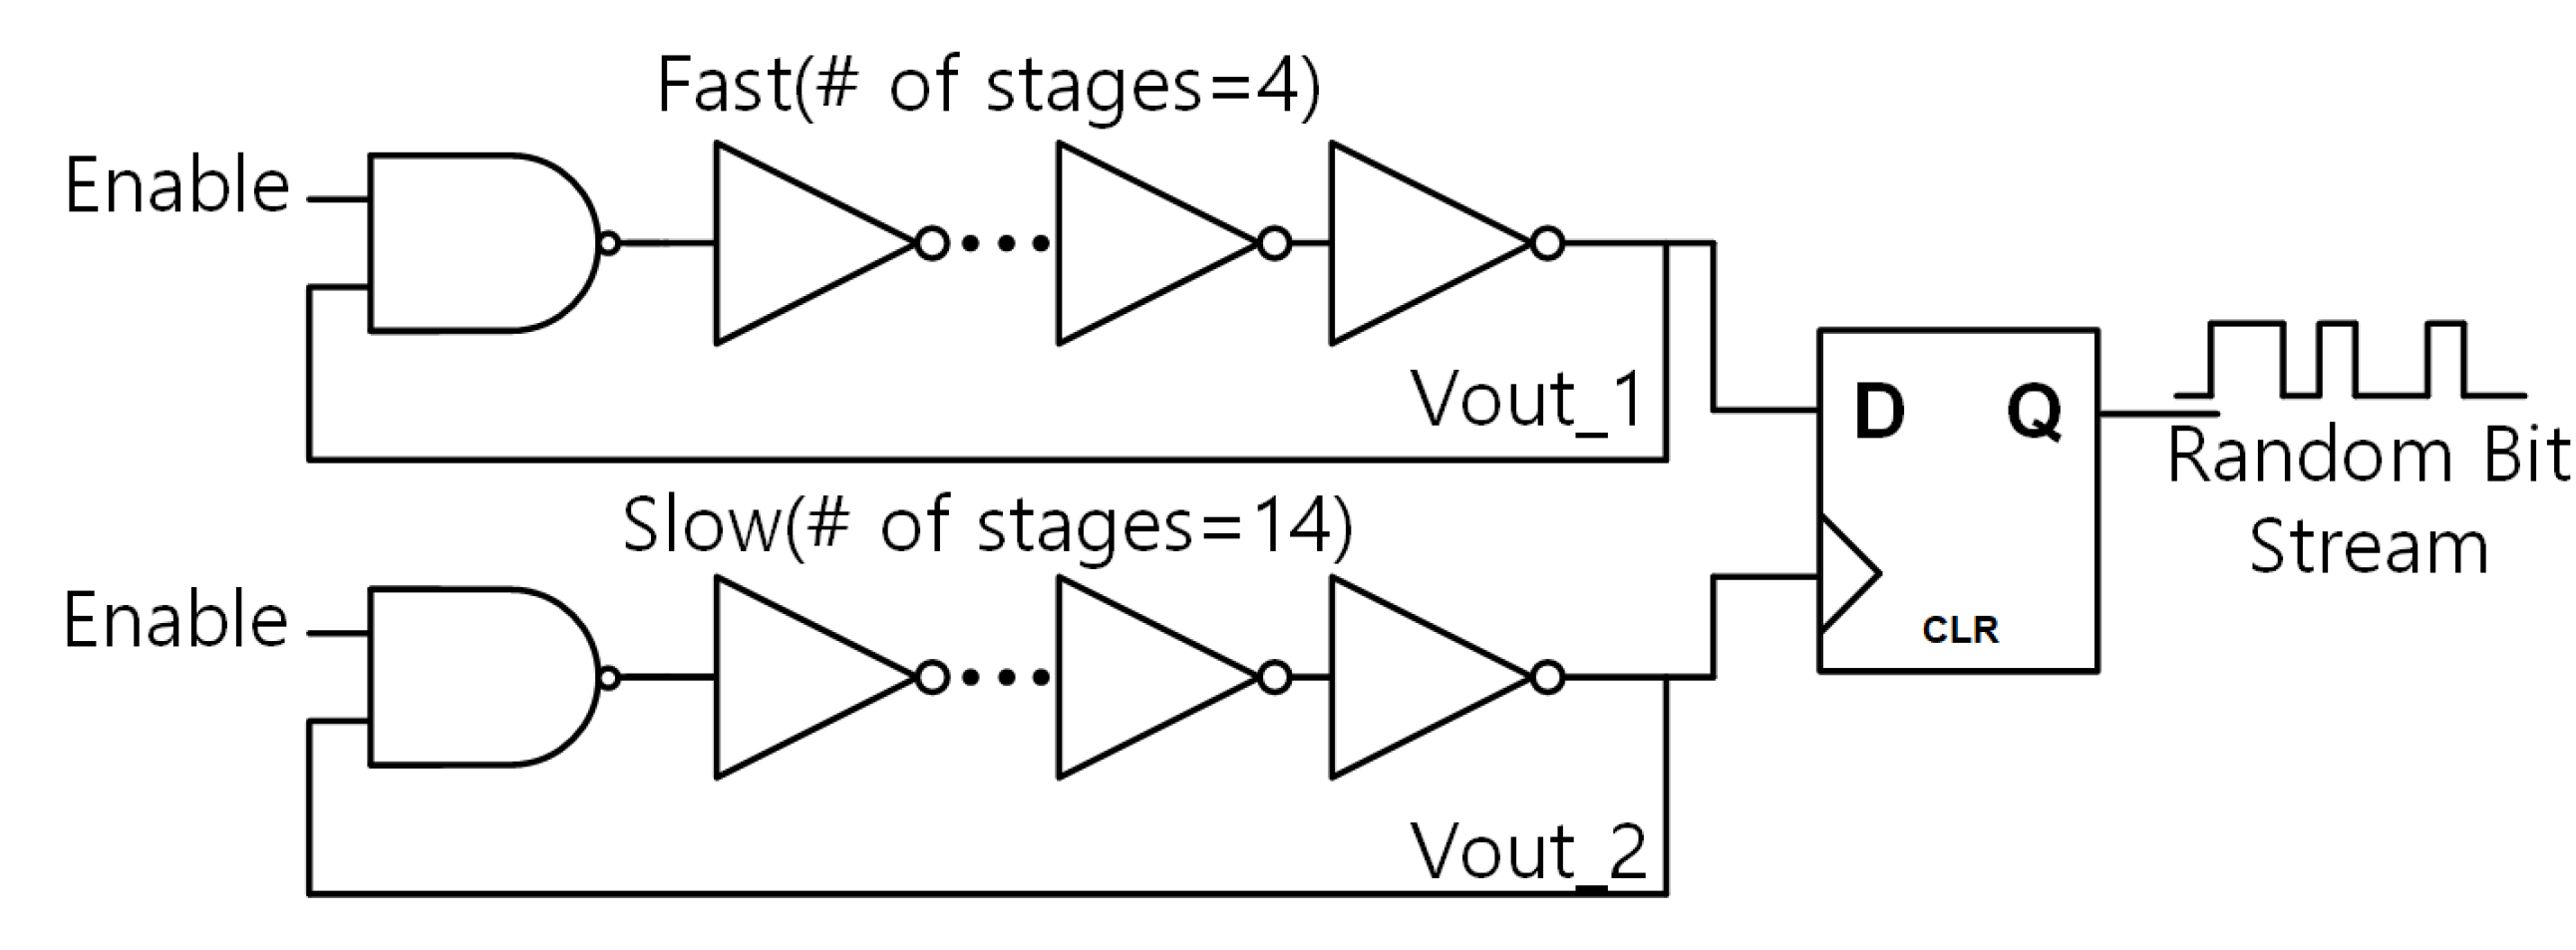
Figure 7 shows the entire schematic of the TRNG. Two ring oscillators with different oscillation frequencies enter the D flip-flop input and the clock (CLK) signal to sample the output of the rear stage, finally producing an output, such as a random number. The TRNG is composed of a 32-bit array in this work. Because the TRNG uses noise existing in the CMOS process as an entropy source, the performance of the 32-bit TRNG structure is better than that of the 1-bit TRNG structure. However, implementing a high-bit TRNG incurs both greater power dissipation and a larger area required.
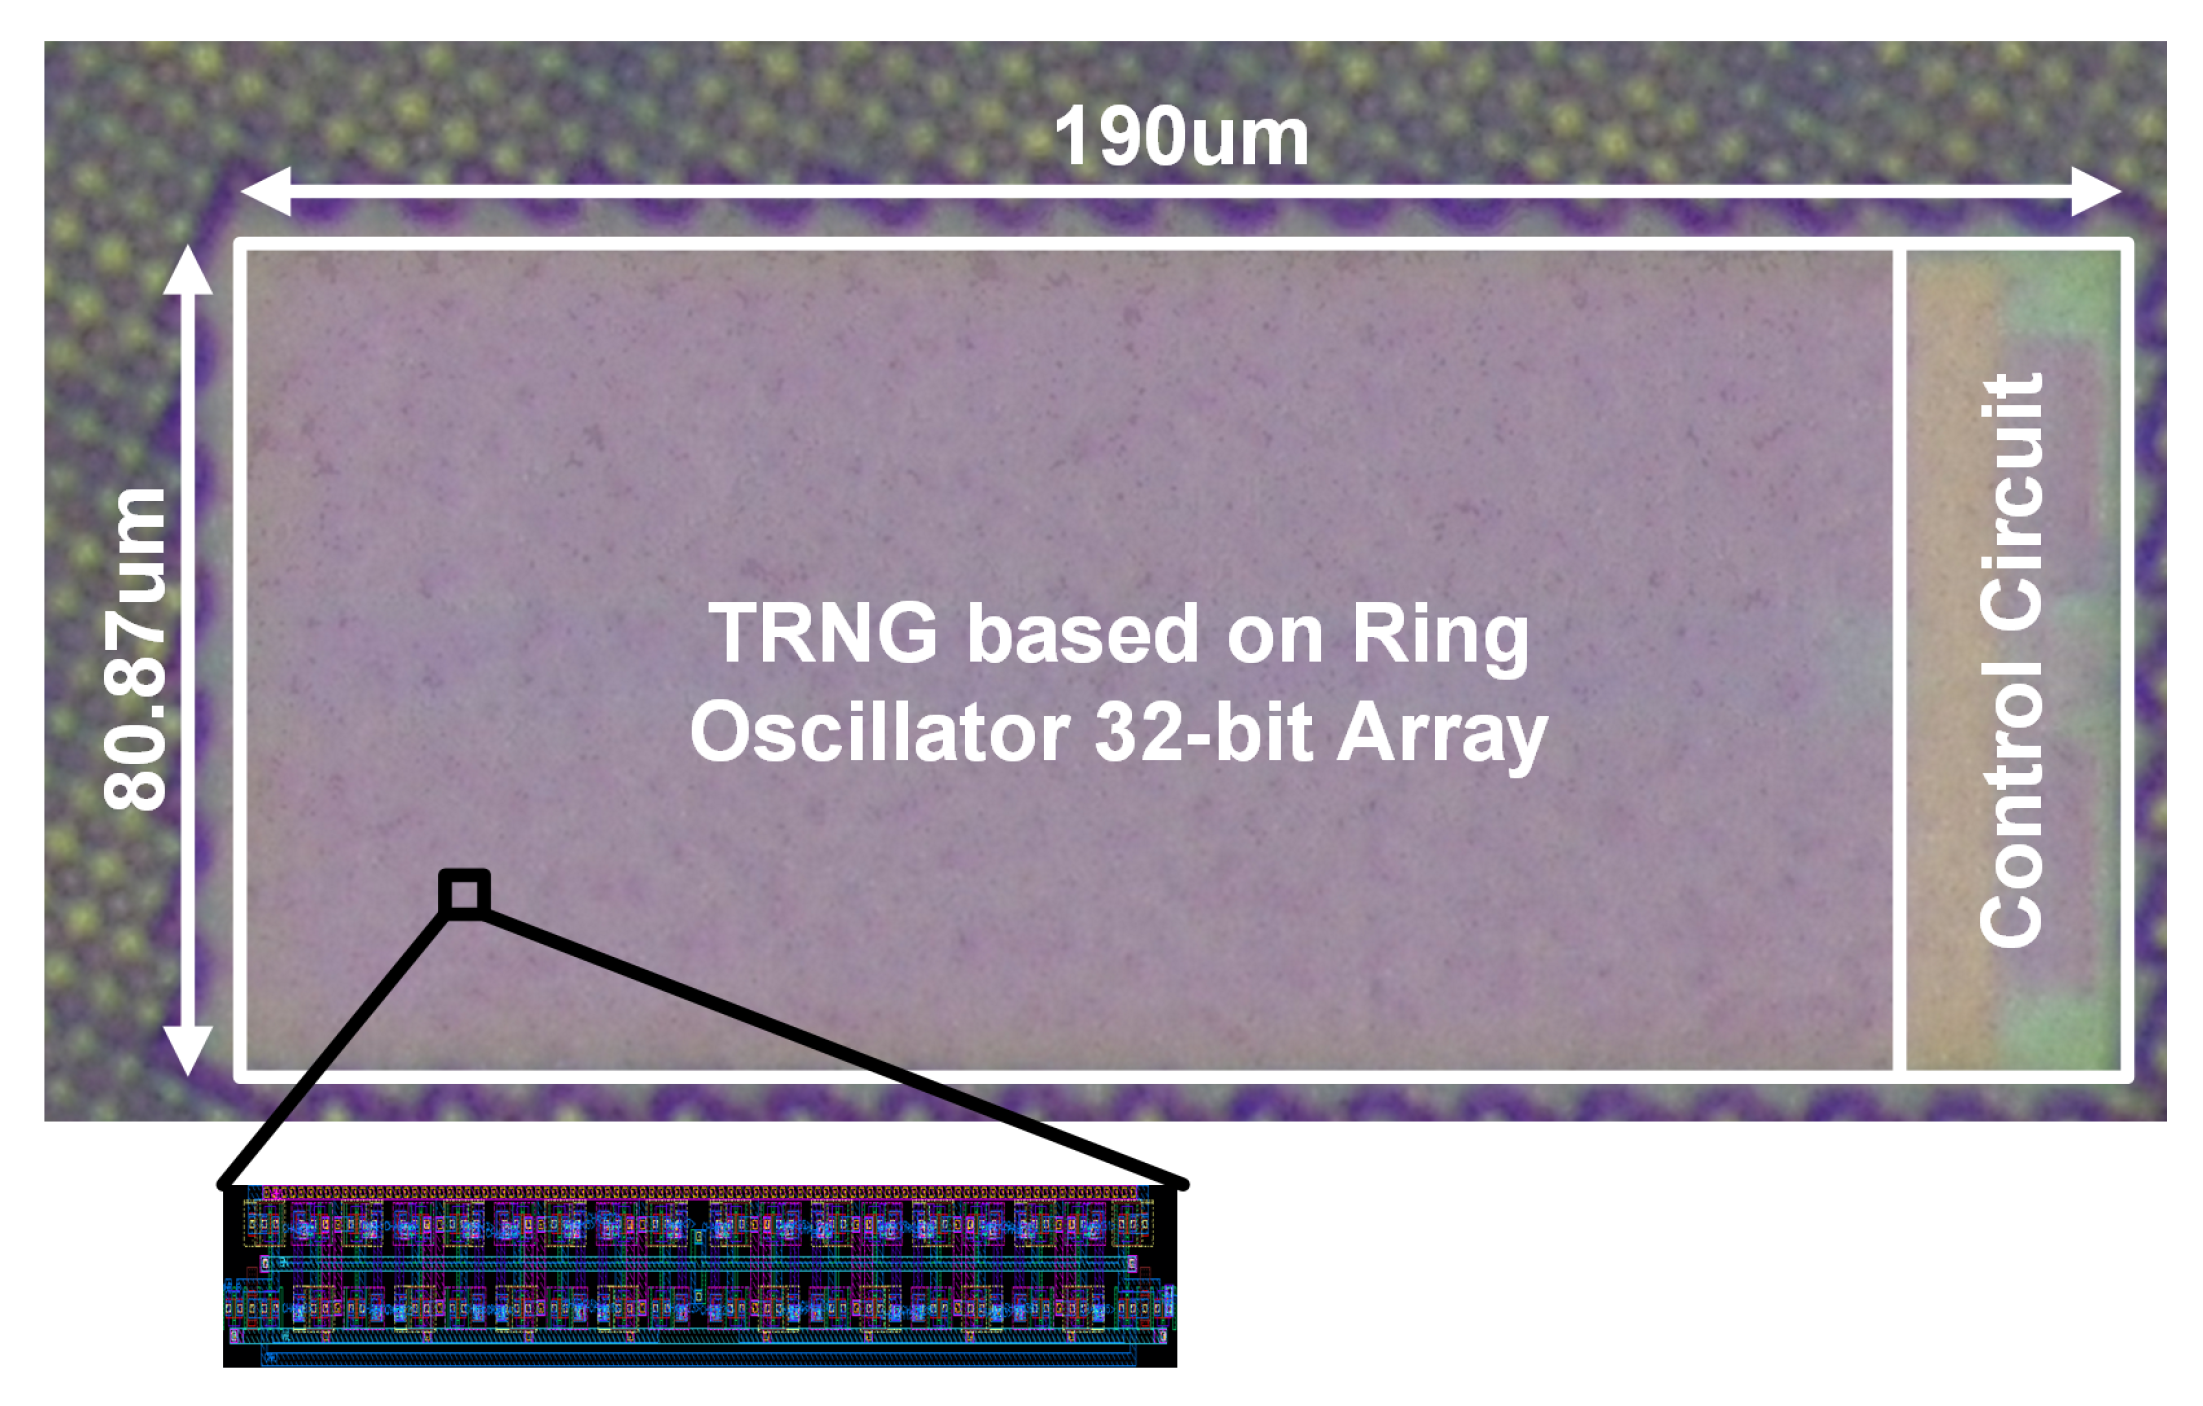
Figure 8 is a chip micrograph of the proposed TRNG prototype. It is fabricated in the 65nm CMOS process, and the RNG occupies an area of 0.015
m
with a width of 190
m and length of 80.87
m.
6. Measurements
Figure 9 shows a block diagram of the measurement process and testing environment. The equipment required for the measurements includes the manufactured chip, an interconnection between the evaluation board and external computing resources, an evaluation board to execute the TRNG function based on supervised control, a computer to store the output response, and a power supply unit. In order to perform real-time post-processing according to the initial TRNG bit sequences, MATLAB software is used with on-board memory and a Xilinx FPGA processor (XC351000). The FPGA is programmed by the ISE design suite, which implements a scan-chain function in the testing interface (i.e., the UART interface in this work).
A NIST 800-22a test was performed by acquiring random numbers from a TRNG prototype. The test was implemented in C language [
16] and was conducted on the Linux operating system. The collected random number bit sequence is 10
bits, and the significance level of
was set to 0.01 (i.e.,
N = 100).
The test results indicate remarkable performance in terms of unpredictability and non-reproducibility of the random numbers, such as in Rank and FFT tests among 15 NIST 800-22a tests as summarized in
Table 2. However, some random number tests, such as frequency and cumulative sums, could not meet the desired performance level. The goal of the discarding-based post-processing circuit method proposed in this paper is the passing of all tests by improving the randomness of random numbers by erasing bits that do not meet the test requirements.
Before applying the cell-discard algorithm, it is necessary to calculate the values required for the testing condition.
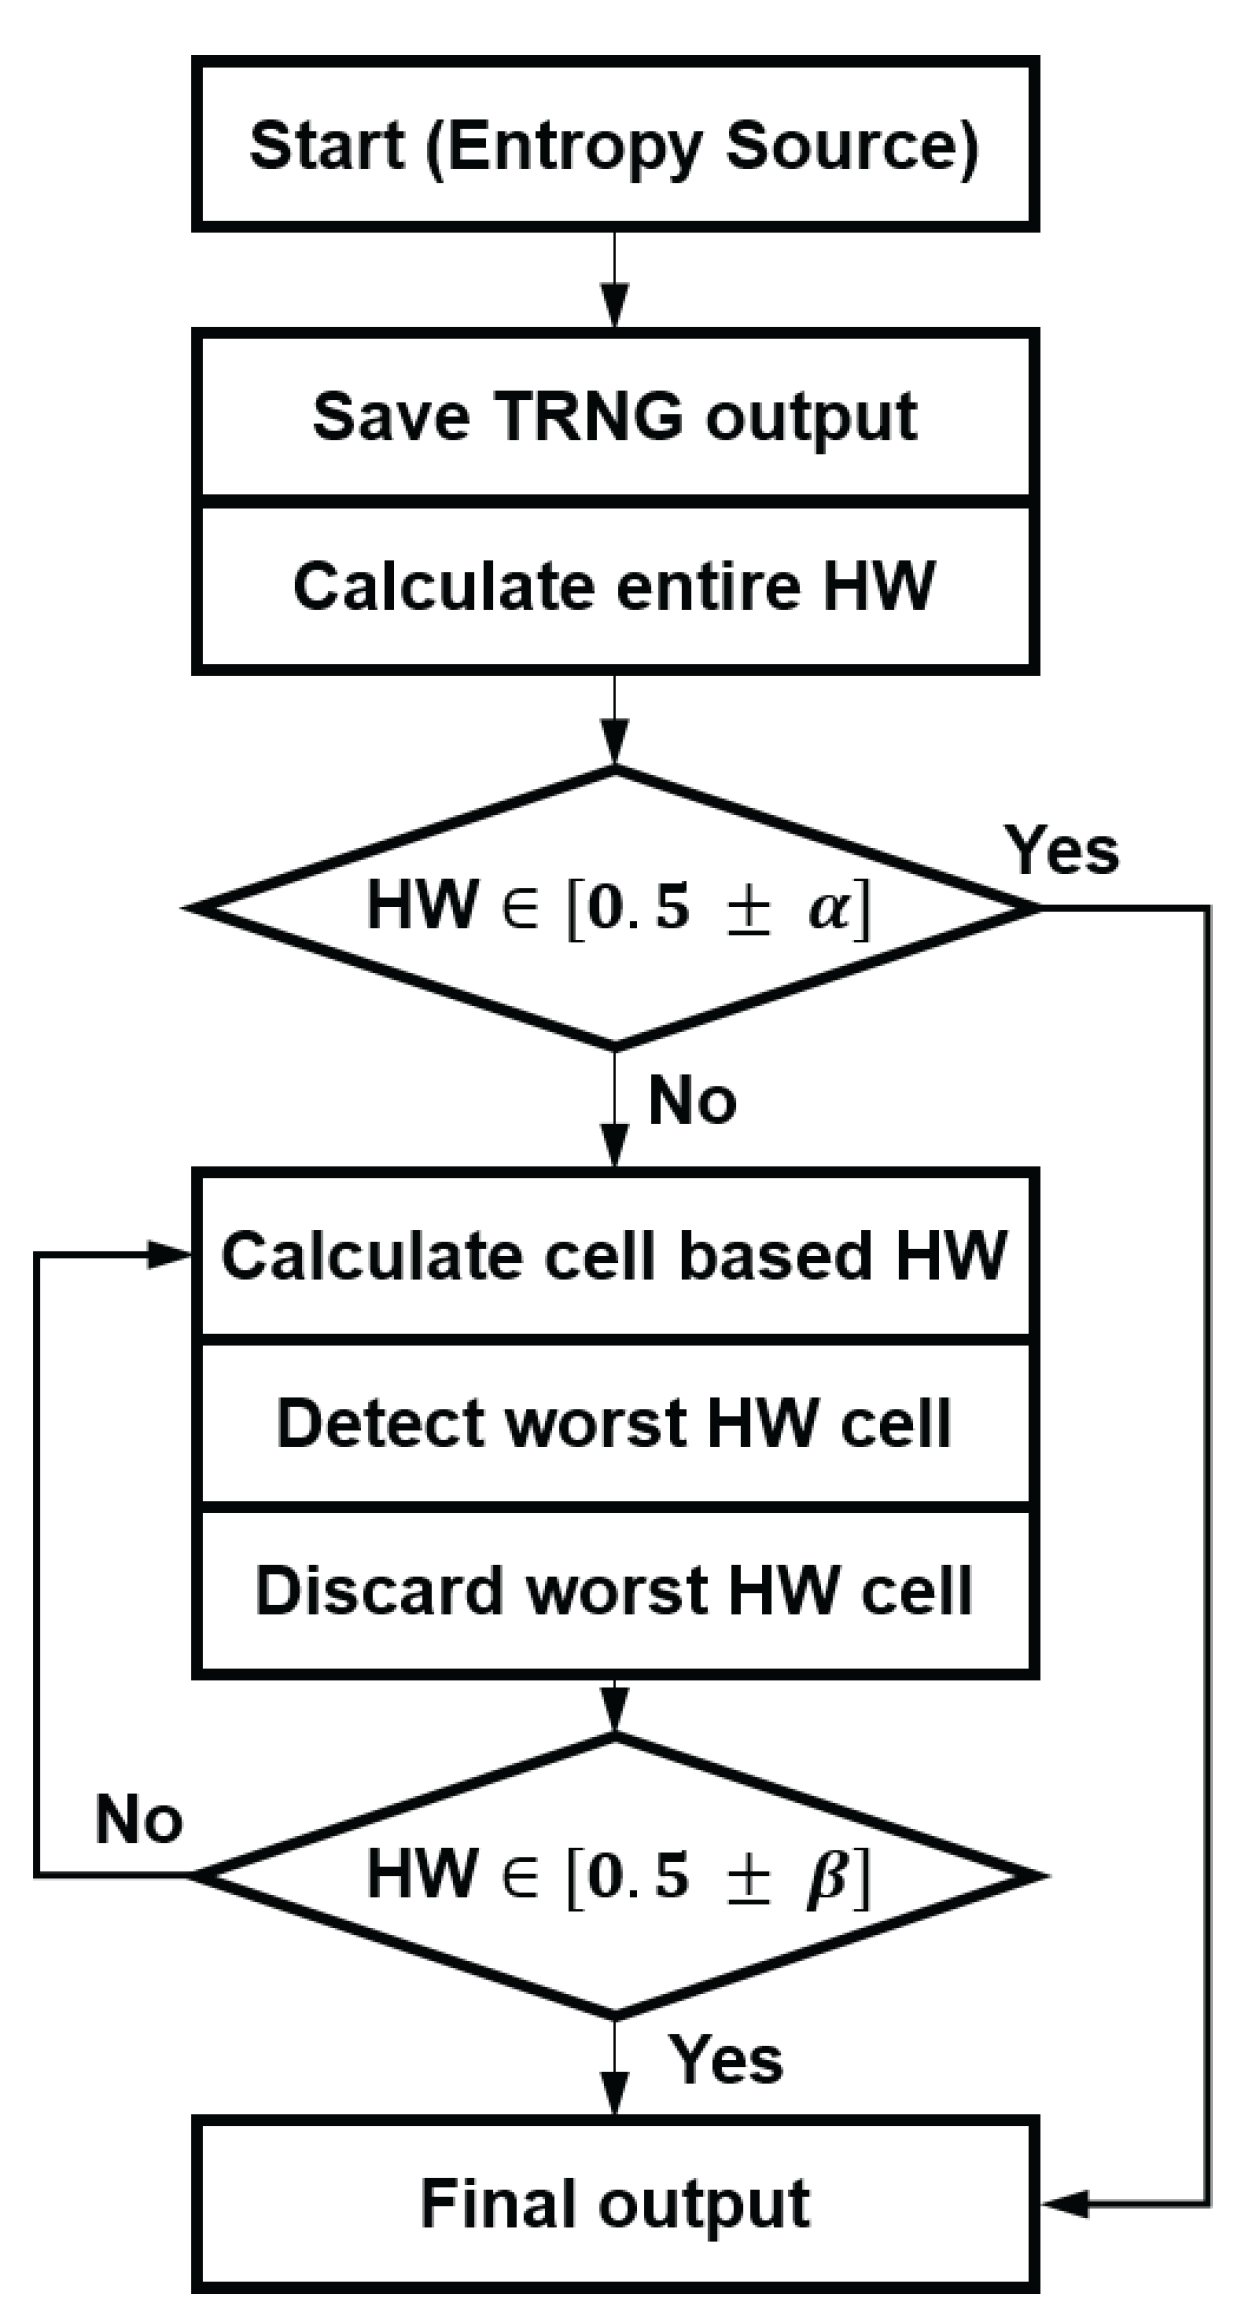
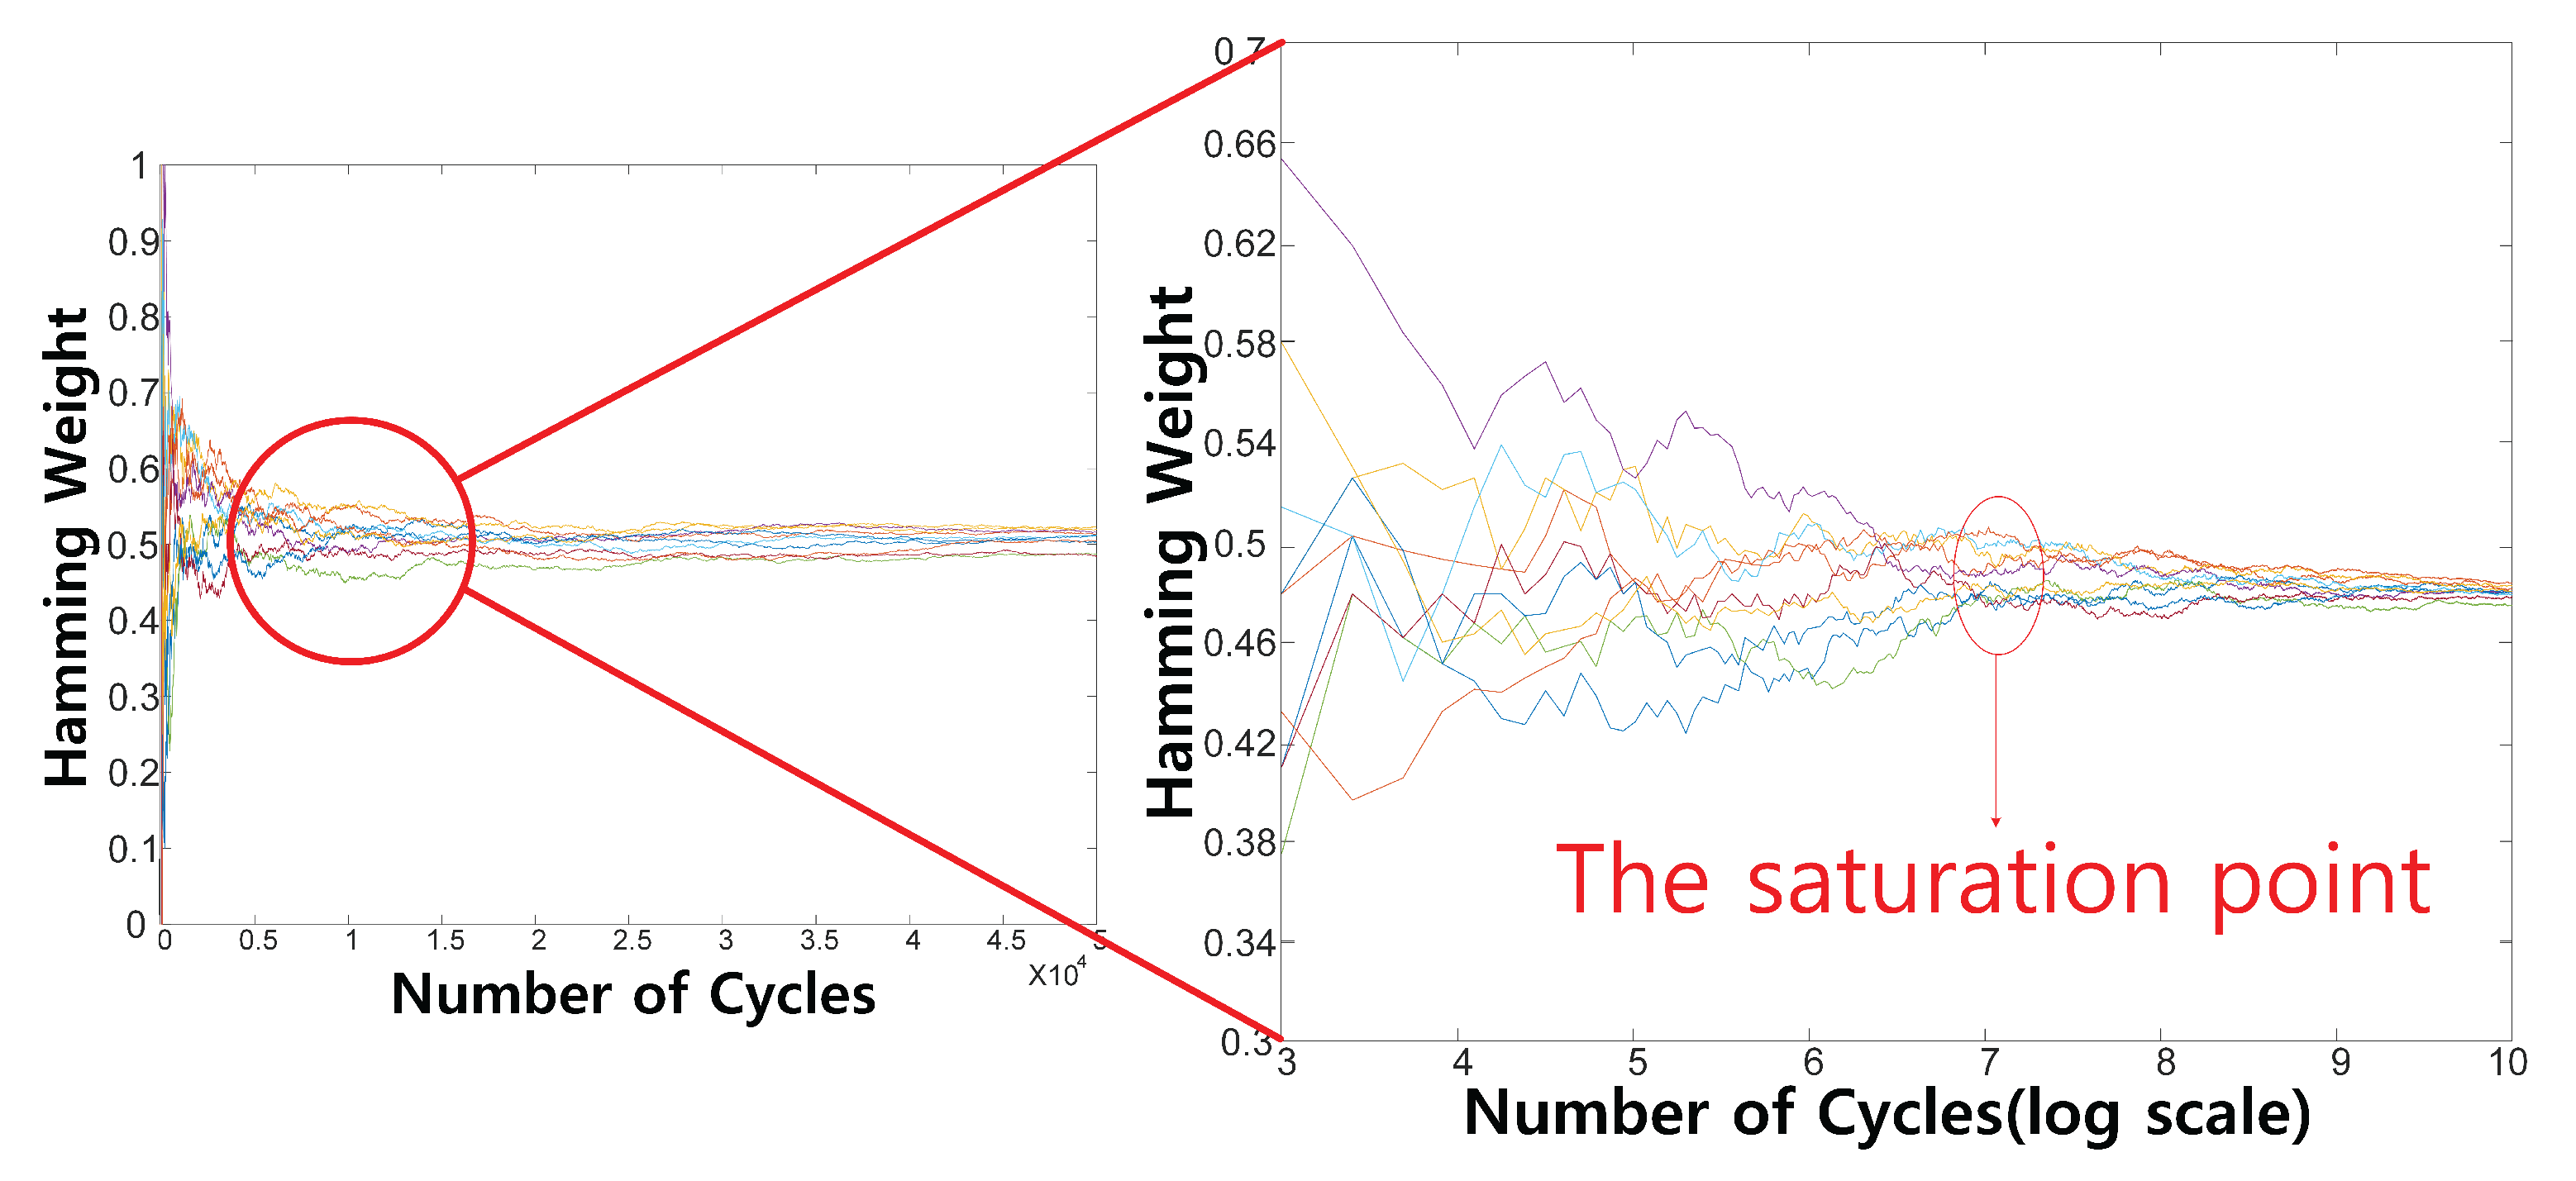
Figure 10 presents a flow chart of the cell-discard algorithm. First,
N-bit data are accumulated for each cell of the TRNG. According to the number of operating cycle (
N) sweeps, the calculated HW for each cell becomes saturated at around 1000, as shown in
Figure 11; thus, we decided to set
N to 1000 in this work. Next, it is necessary to determine the condition value for determining the randomness of the bits generated in each cell. The condition value is the minimum Hamming weight for all bits (
M is the number of TRNG cells), and the first condition value of
can be calculated as 0.072 when
M = 32 according to the following equation:
where erfc is an error function and
B is the length of the random number bit sequence. Assuming that the cell-discard algorithm has progressed and a single cell has been discarded,
M = 31, and the second condition value
is calculated as 0.073. The cell-discard algorithm continues until the condition value of the entire HW is meets the requirements.
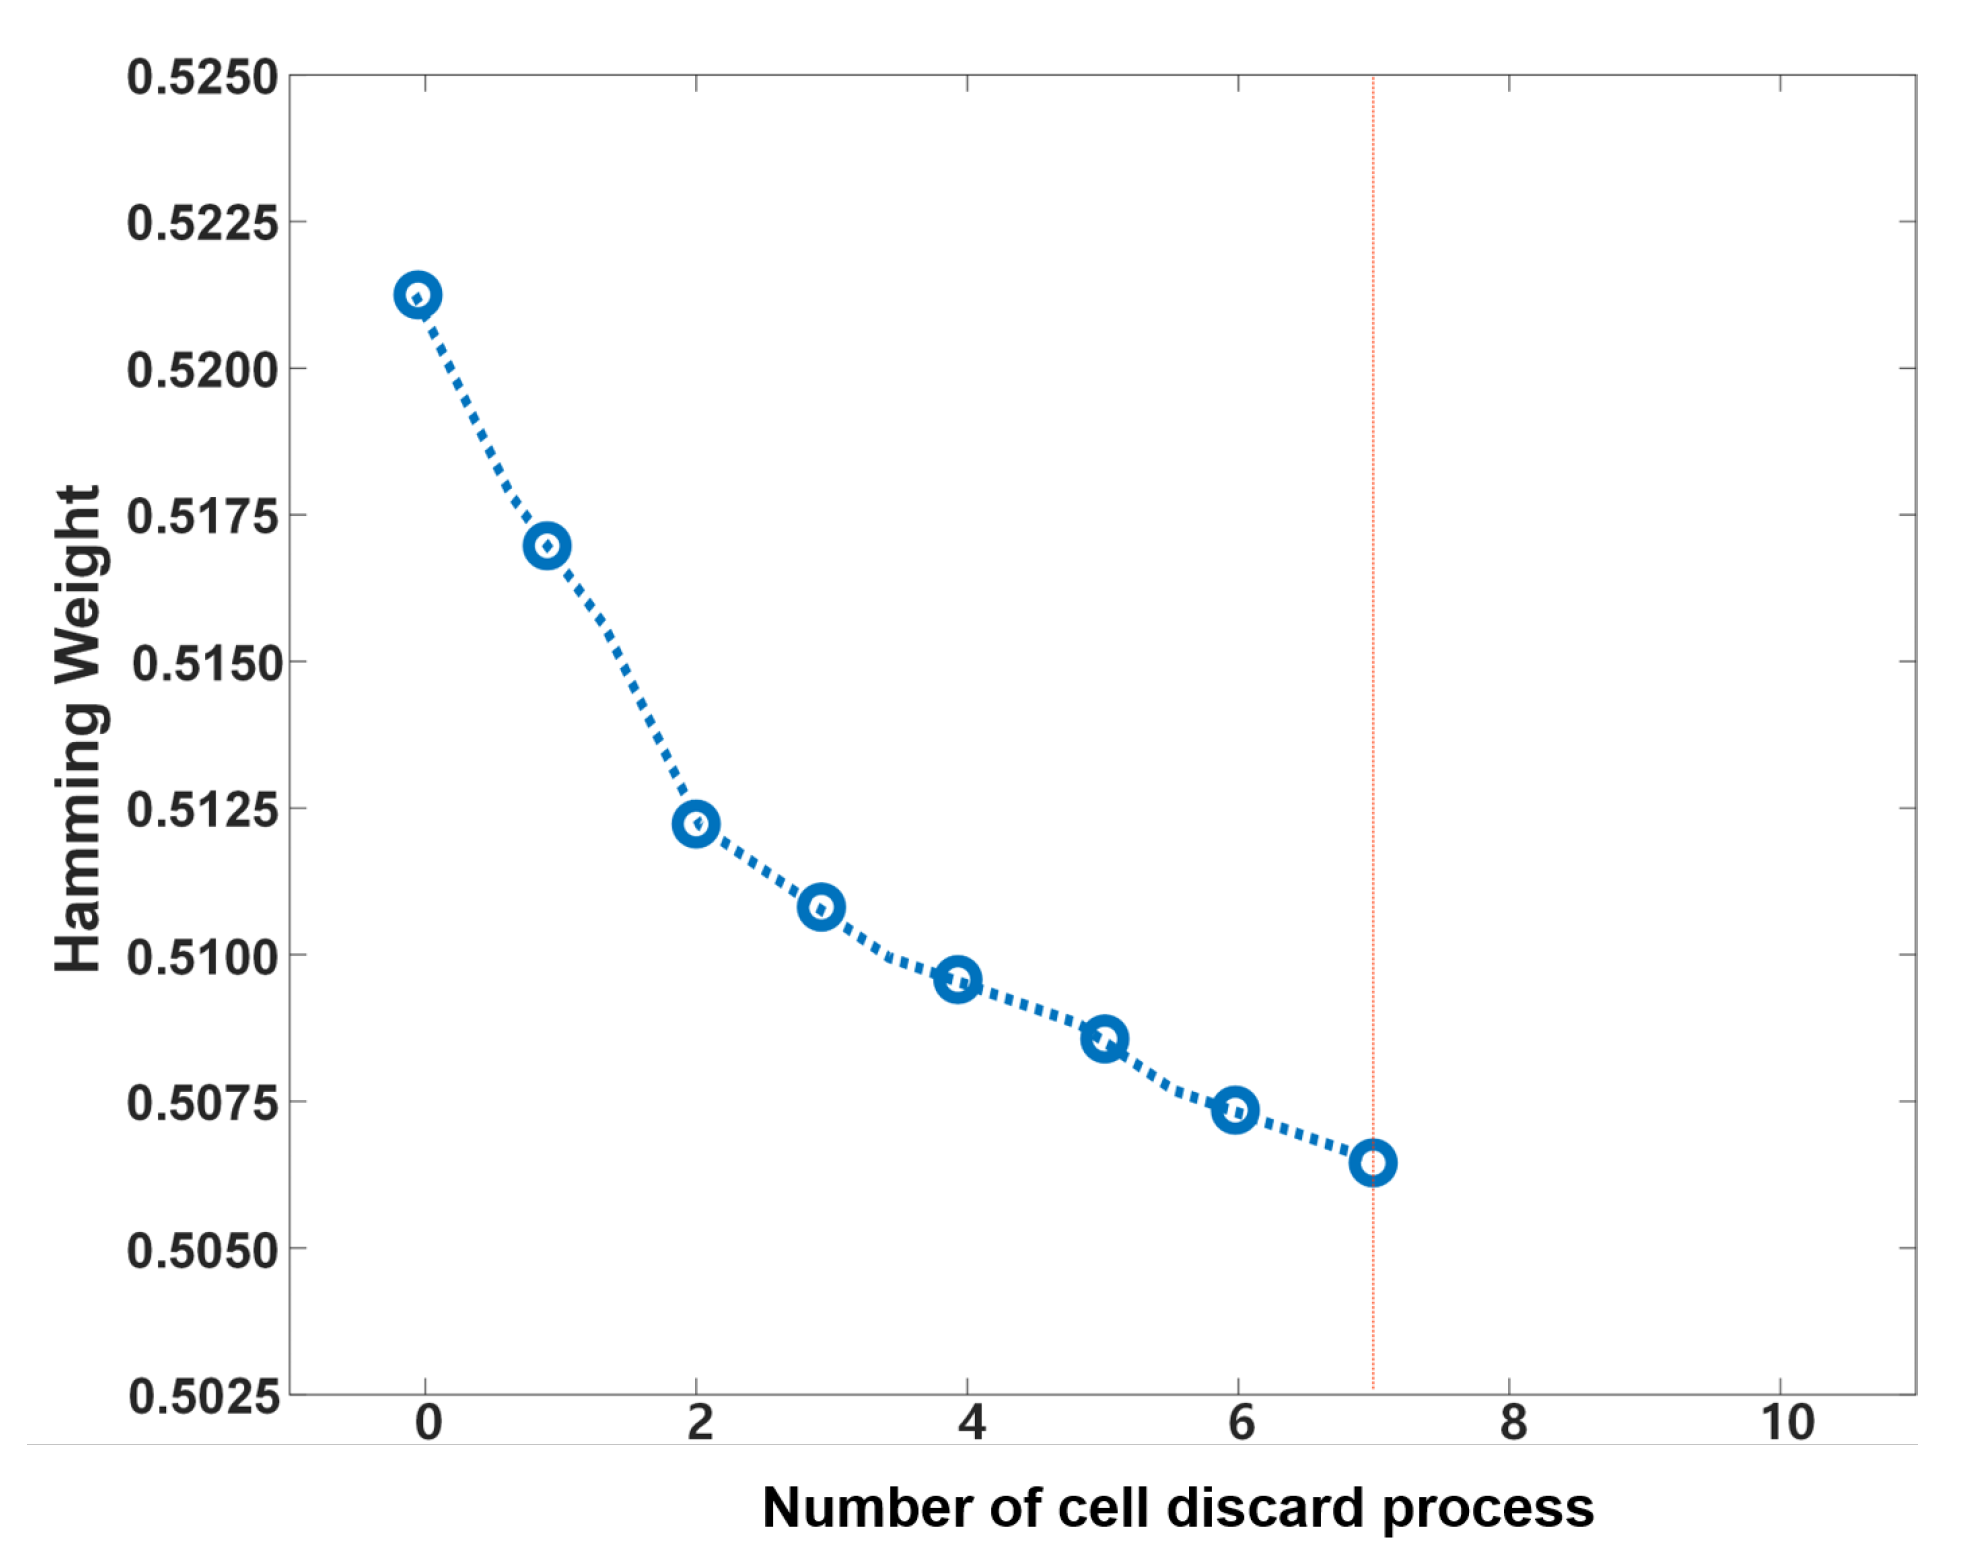
Figure 12 shows the result when applying the proposed cell-discard algorithm. The HW for each bit before applying the cell-discard algorithm reached the target range of the HW (
) after performing the cell-discard process seven times. Because seven cells were discarded, the total number of discarded bits is
bits, and approximately 21% of the bits were discarded.
Table 3 shows the results of the NIST test using bits after applying the cell-discard algorithm. The performance of the HW was improved compared to that before the discard algorithm was applied (see
Table 2); however, the performance was not improved enough to pass all of the NIST tests.
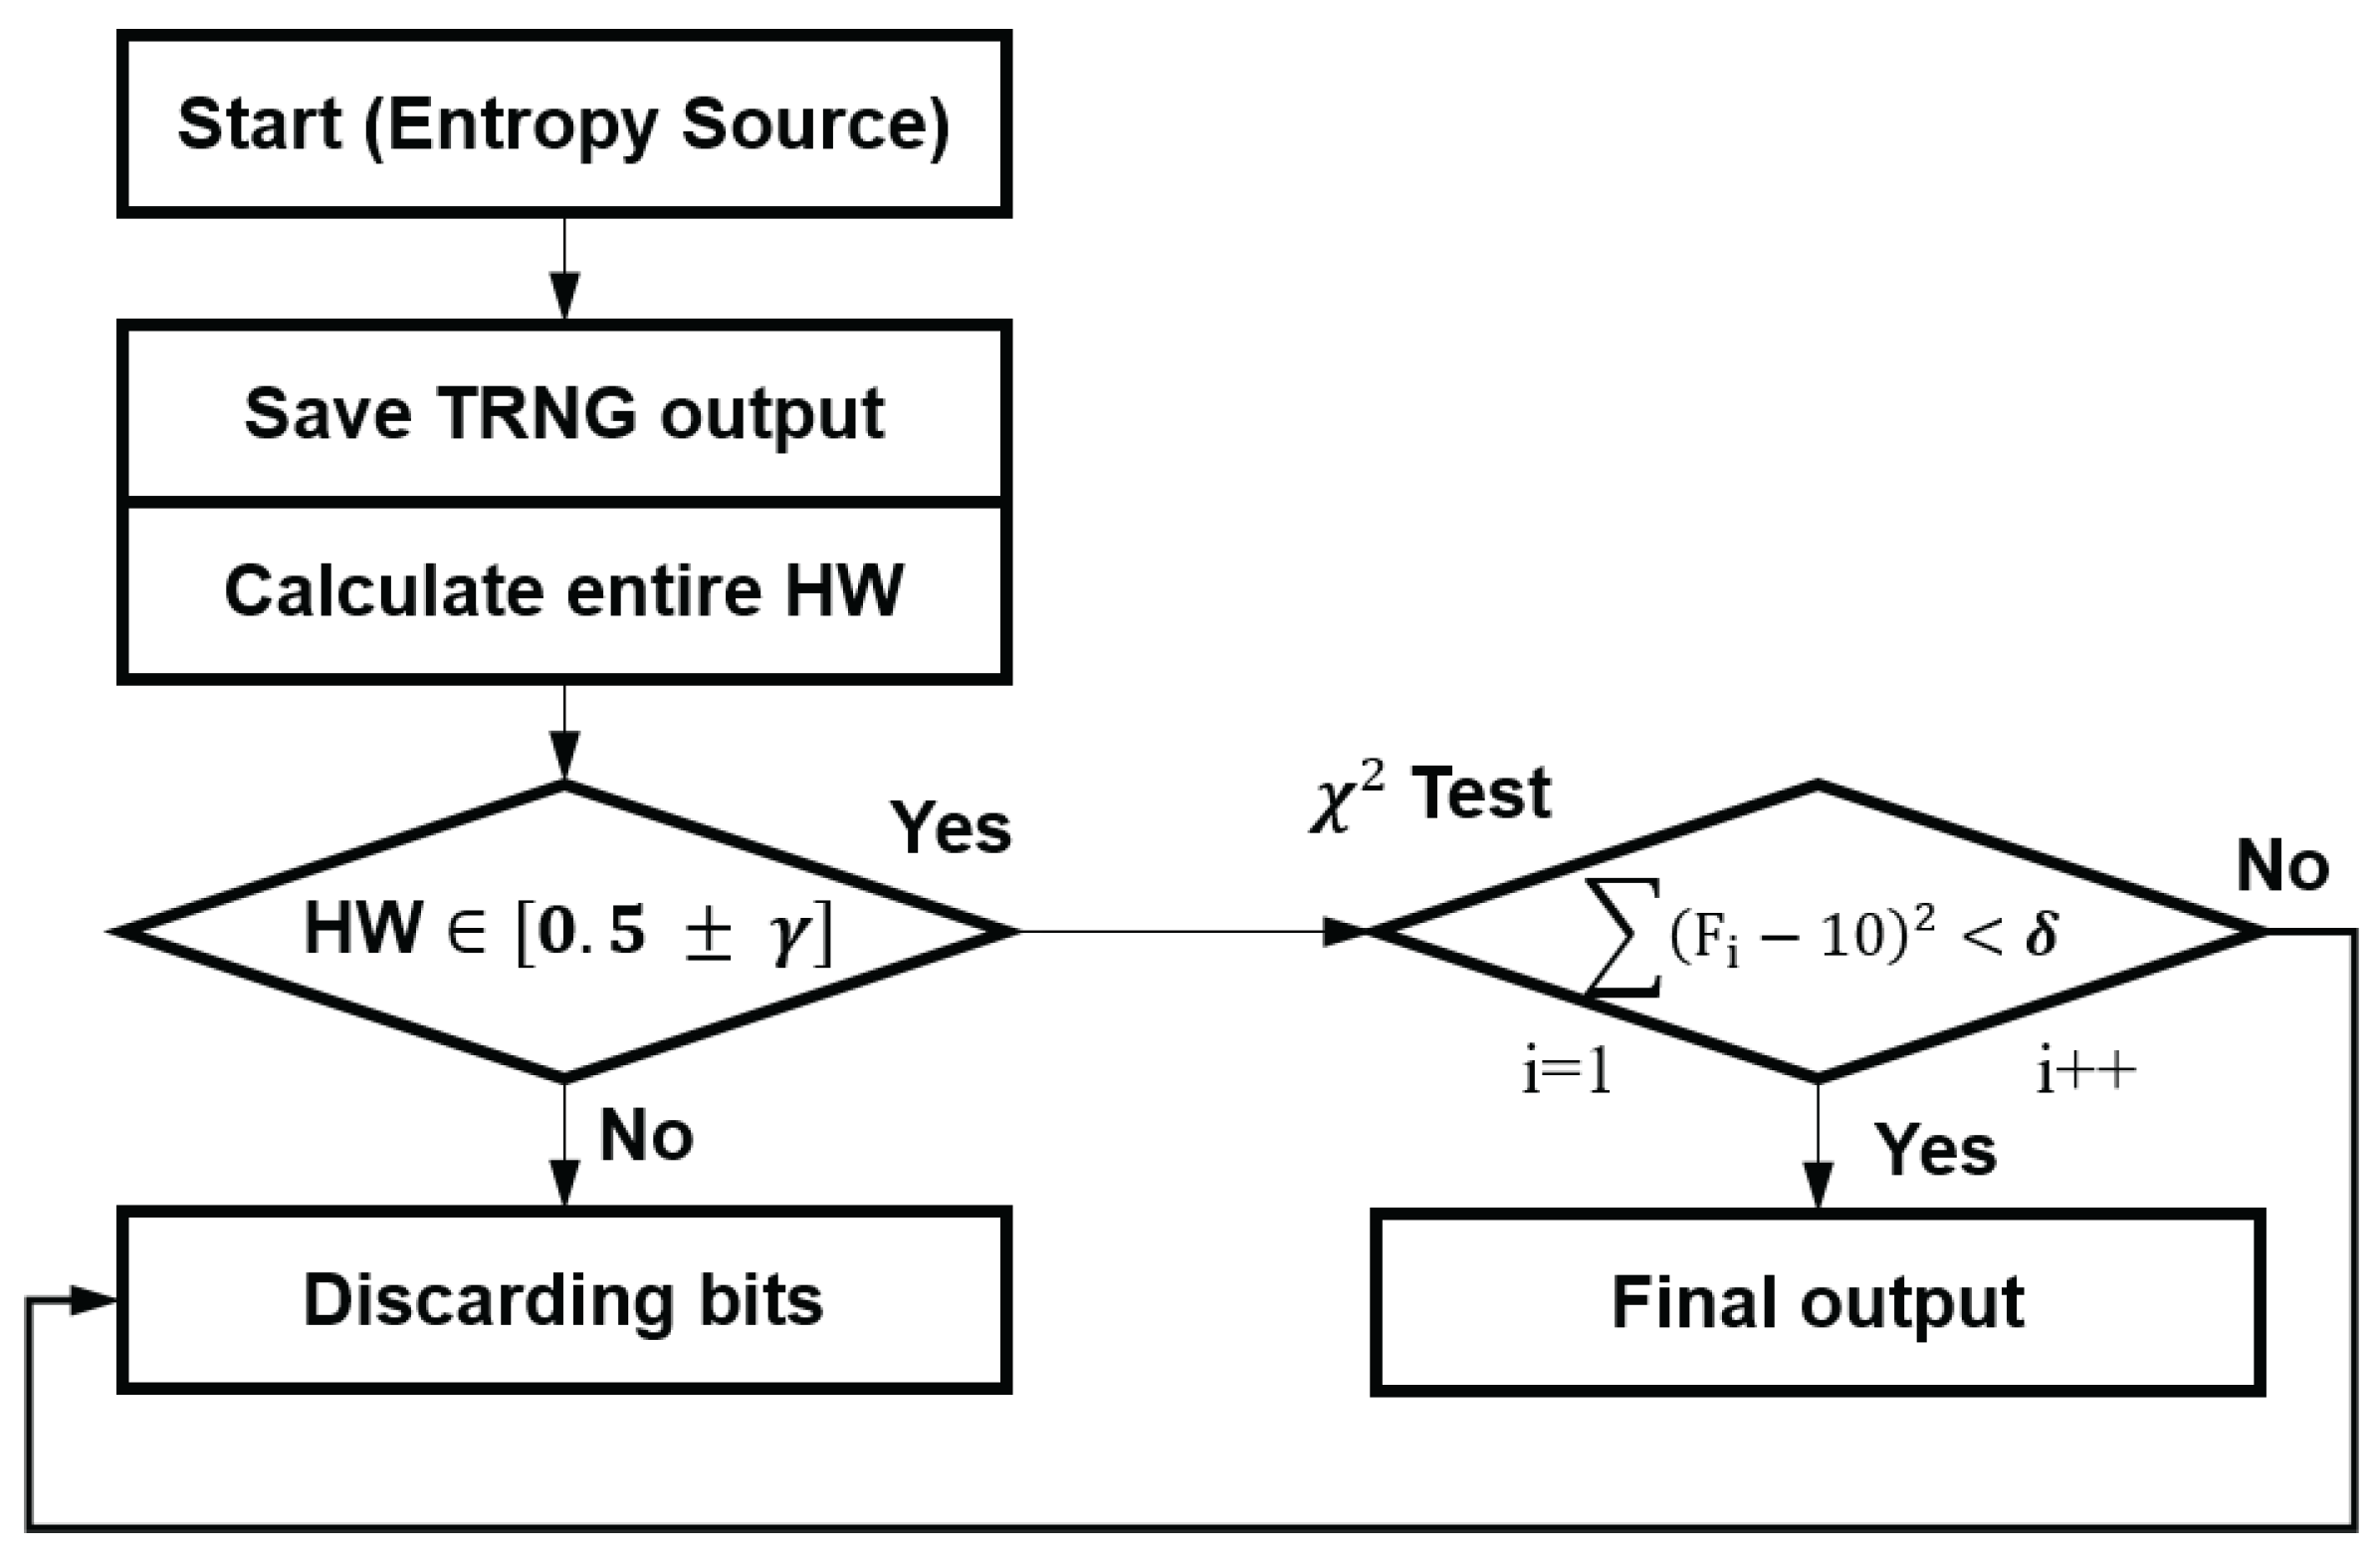
Before applying the bit-discard algorithm, it is necessary to calculate the values required for the condition.
Figure 13 presents the bit-discard algorithm. In order to proceed with the bit-discard algorithm,
N bits must initially be obtained from the TRNG. The bit-discard algorithm is mainly divided into a HW test and a
test. According to
Section 4.2, the minimum number of tests required for the
test is 100, and it is necessary to calculate the HW per test, as in the cell-discard algorithm. Because the minimum number of bits is 1000, the value of
N is set to 100,000. When all 100,000 data instances are collected, the HW test is performed. The HW test requires a conditional value,
, and
for 100,000 bits is 0.0041. Therefore, if the condition (
) is not satisfied, the generated random number sequence is discarded. If the condition is satisfied, the HW test of the bit-discard process is finished, and the
test that determines the uniformity of the
p-value is conducted. The
test proceeds in the order of (1) to (5), as introduced in
Section 4.2. The bit string that has passed the
test is adopted as the final random number.
As a result of applying the bit-discard algorithm, the HW for all bits before applying the algorithm was improved from 0.5215 to 0.5025. The total number of discarded bits is
, and approximately 21% of the bits was discarded. In the HW test, the overall HW was improved from 0.5215 to 0.5050, and about 15% of
bits was discarded. In the
test, the HW was improved from 0.5050 to 0.5025, and about 6% of
bits was discarded additionally.
Table 4 shows the results of the NIST test using bits after applying the bit-discard algorithm. Compared to the initial NIST test (see
Table 2), the performance of the HW was improved, and more tests were passed. However, the performance was still not improved enough to pass all of the NIST tests.
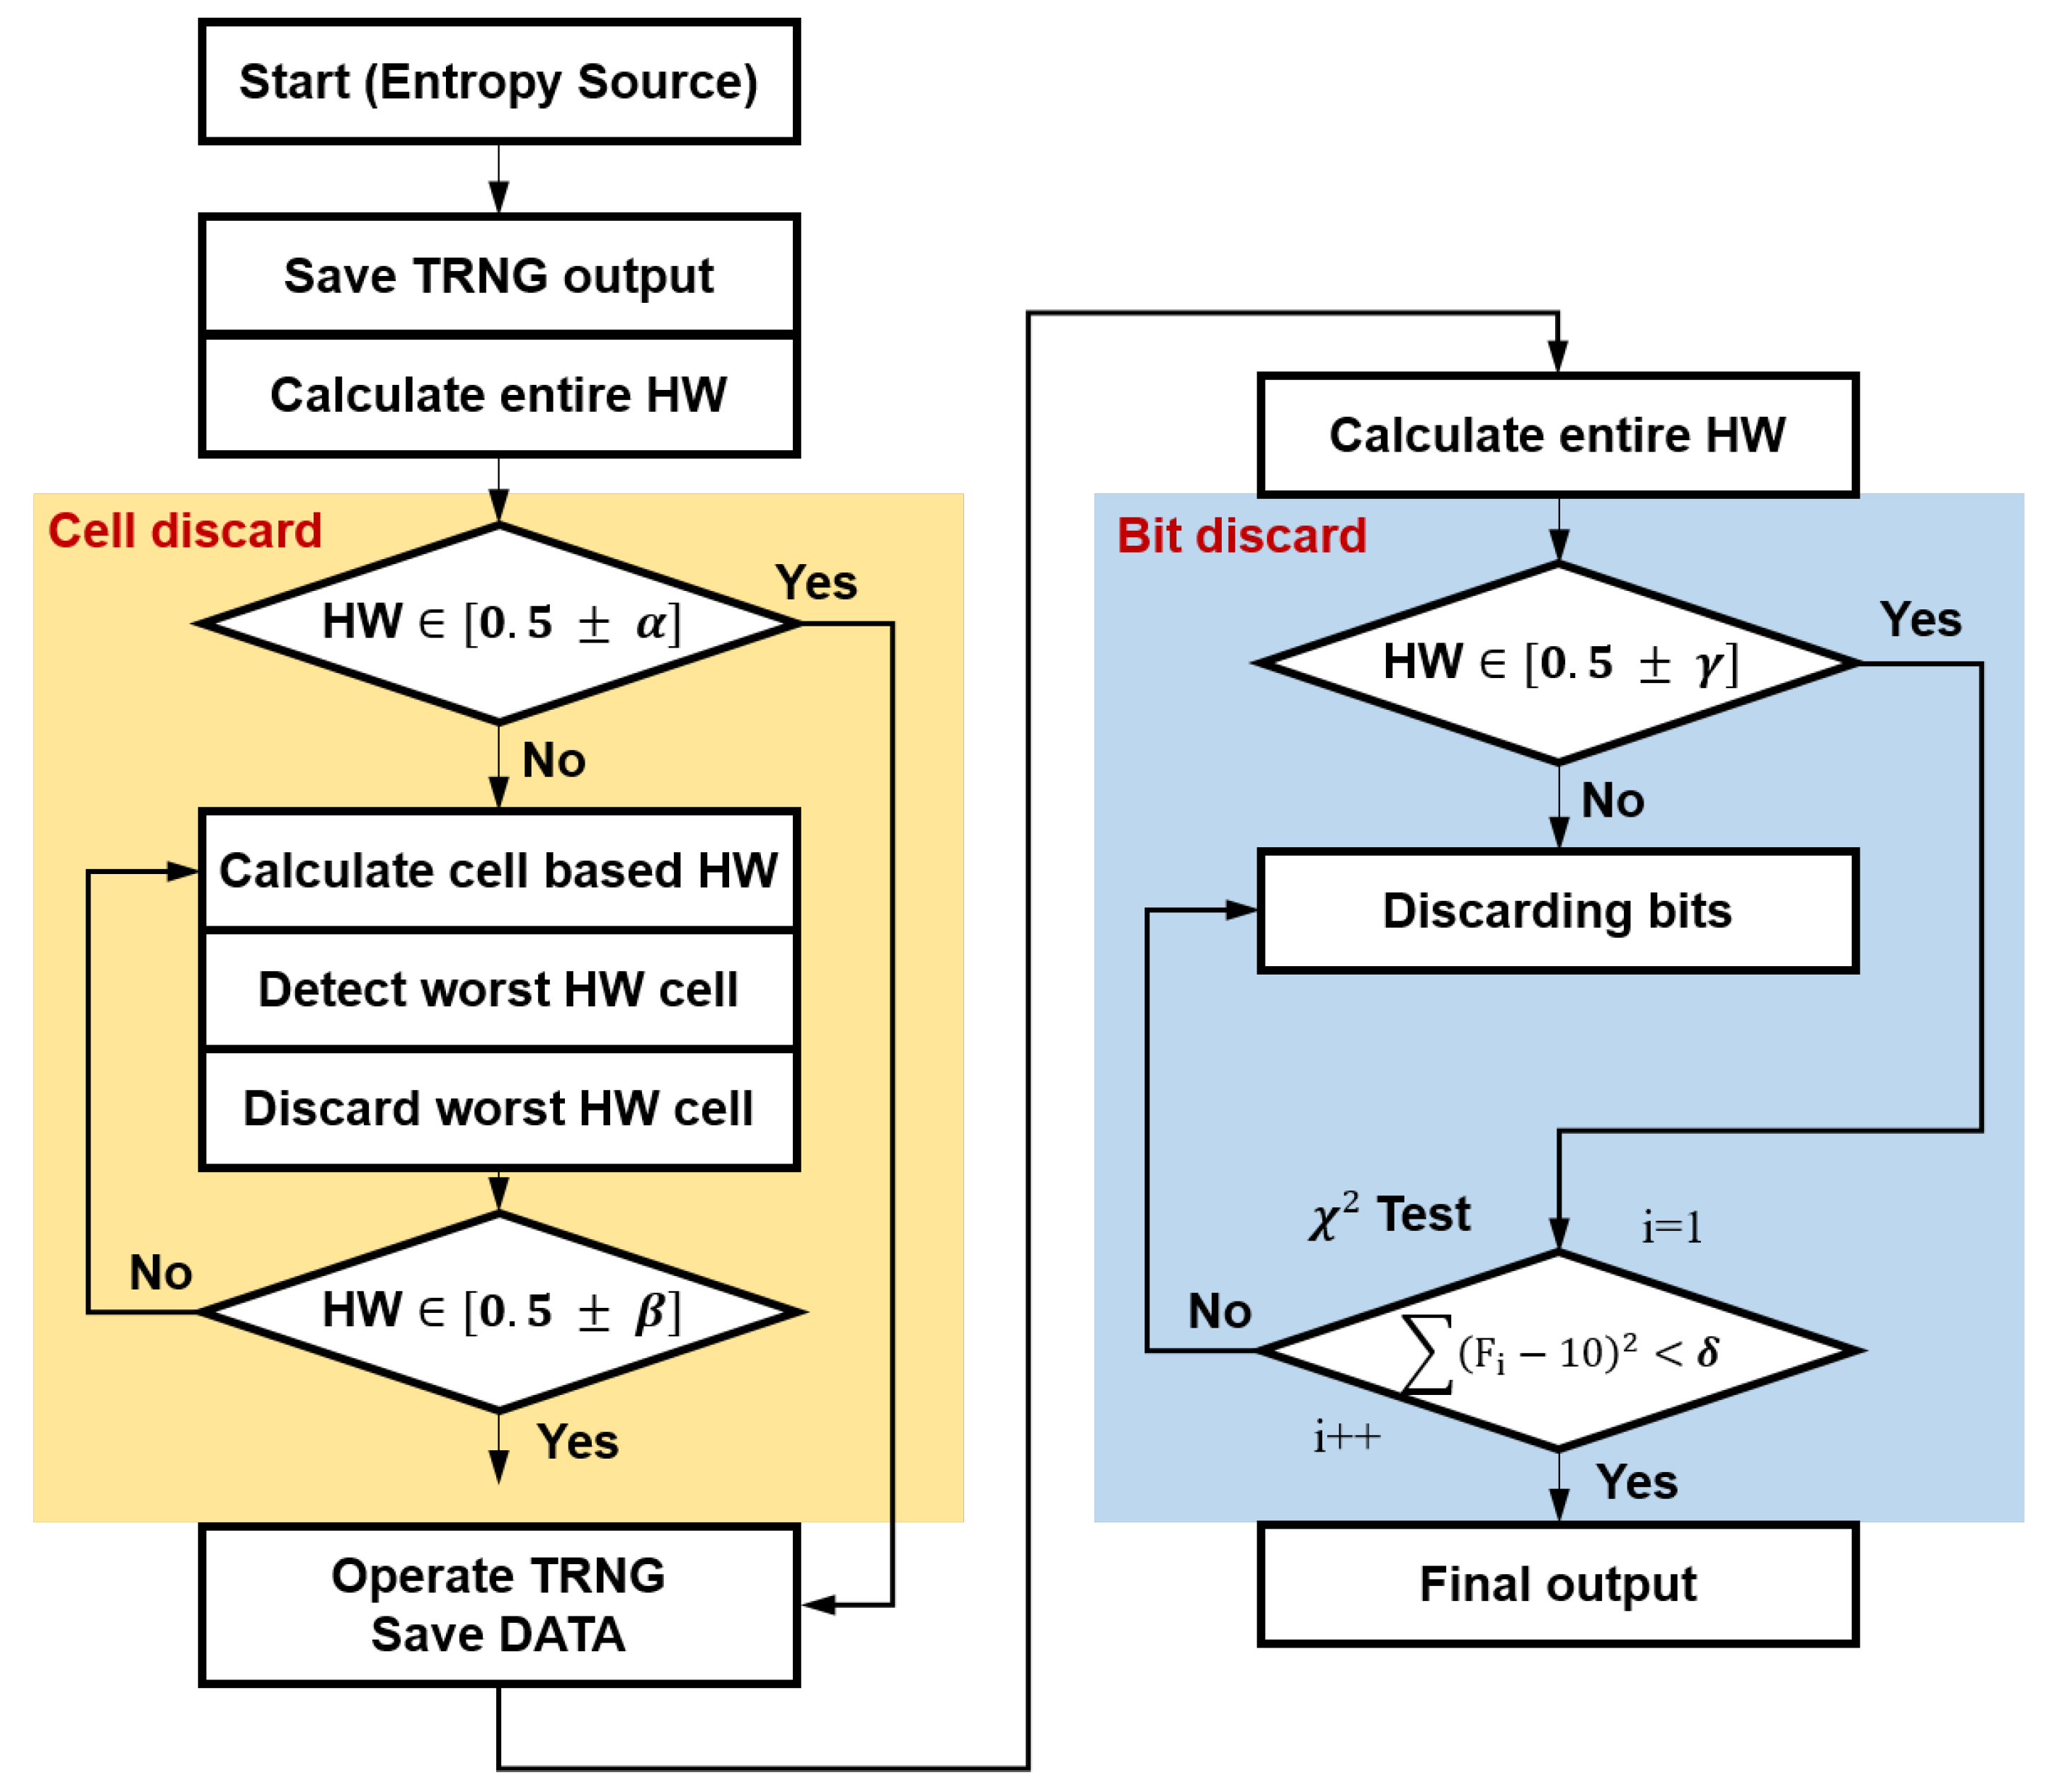
Figure 14 shows the algorithm when both the cell- and bit-discard algorithms are applied. The HW for 1E8 bits before application was improved from 0.5215 to 0.5003. The total number of discarded bits is
, and about 25% of the bits were discarded. In the cell-discard algorithm, the overall HW was improved from 0.5215 to 0.5070, and about 21% of
bits was discarded. In the bit-discard algorithm, the HW was improved from 0.5070 to 0.5003, and about 4% of
bits was discarded.
Table 5 shows the NIST test results for random numbers after applying both the cell- and bit-discard algorithms in the proposed discarding-based post-processing technique. The
p-value of the tested random number must be 0.0001 or higher, and the Proportion value must be 96/100 or higher to pass the test. After applying the post-processing technique, all 15 tests were passed.
Table 6 is a comparison table of the results of the HW and NIST 800-22a tests before and after applying the proposed discarding-based post-processing algorithms to each chip manufactured via an identical process. When only the cell-discard algorithm is applied, the performance of the HW is improved; however, the post-processed bit sequences could not pass the NIST requirements, and the bit-discard algorithm also produces results identical to those in the stand-alone cell-discarded case. When both the cell and bit-discard algorithms are applied together, the Hamming weight approaches the ideal value and the post-processed bit stream can pass all of the NIST tests. For chip-2, which had the best performance in terms of the Hamming weight, the Hamming weight was improved to 0.5003 after applying the post-processing technique. In the case of chip-5, where the performance of the Hamming weight without the post-processing technique was the worst, however, it was improved to 0.5008 after the application of post-processing. As a result, we satisfied all NIST tests performed on five different prototype chips.


