Article

Multi-Hop Routing Protocols for Oil Pipeline Leak Detection Systems

1
Department of Computer Science, Faculty of Computing and Information Technology, King Abdulaziz University, Jeddah 21589, Saudi Arabia
2
Institute of Informatics and Telecommunications, National Centre for Scientific Research "Demokritos", 15341 Athens, Greece
3
Department of Mechanical Engineering, Massachusetts Institute of Technology (MIT), Cambridge, MA 02139, USA
*
Author to whom correspondence should be addressed.
Electronics 2022, 11(13), 2078; https://doi.org/10.3390/electronics11132078
Submission received: 4 June 2022 / Revised: 24 June 2022 / Accepted: 28 June 2022 / Published: 2 July 2022
(This article belongs to the Topic Wireless Sensor Networks)

Abstract

:
In recent years, various applications have emerged requiring linear topologies of wireless sensor networks (WSN). Such topologies are used in pipeline (water/oil/gas) monitoring systems. The linear structure has a significant impact on network performance in terms of delay, throughput, and power consumption. Regarding communication efficiency, routing protocols play a critical role, considering the special requirements of linear topology and energy resources. Therefore, the challenge is to design effective routing protocols that can address the diverse requirements of the monitoring system. In this paper, we present various wireless communication technologies and existing leak detection systems. We review different routing protocols focusing on multi-hop hierarchical protocols, highlighting the limitations and design issues related to packet routing in linear pipeline leak detection networks. Additionally, we present a LoRa multi-hop model for monitoring aboveground oil pipelines. A set of model parameters are identified such as the distance between sensors. In addition, the paper determines some calculations to estimate traffic congestion and energy consumption. Several alternative model designs are investigated. The model is evaluated using different multi-hop communication scenarios, and we compare the data rate and energy to provide an energy-efficient and low-cost leak detection system.

1. Introduction

Pipelines are cost-effective; clean in transporting water, oil, or gas; and provide greater supply rates and capacity. There are different pipelines in terms of topology, design, fluid type, and operational condition. The pipe may carry water, gas, or oil. Some pipelines are underground, and others are aboveground [1]. Considering the length of the pipelines and the state of the terrain, many problems can occur, such as pipeline leakage and corrosion [2]. A leak in oil and gas pipelines causes extreme environmental pollution and economic losses. Hence, the need for pipeline monitoring and leak detection systems is immense.
A Wireless Sensor Network (WSN) is suitable for monitoring the pipeline to provide leakage detection and has many advantages. Wireless sensors can cover the area where there are no wired connections, and sensors are low in cost and easy to deploy and maintain, which increases network reliability and security [2]. There are many challenges in using WSNs in oil and gas pipelines, such as minimizing energy consumption, avoiding congestion in large-scale networks, and dealing with the constraints imposed by the linear topologies [2]. Sensors consume energy during their long duty cycle. A massive number of sensors leads to huge energy consumption that affects network lifetime and reliability. The network congestion leads to delay, packet loss, and high load. When the number of packets increases the network throughput decreases. In a linear topology, the sensors are deployed in a linear formation. Such linear topologies impose challenges, such as long-distance, high-energy consumption, long delay, and low reliability [2]. Multi-hop communication is used in linear topologies, so the packets are sent from the source node to the destination node through other nodes that act as relay nodes [2].
This study includes problem specifications from the public information available on oil pipelines deployed in Saudi Arabia. This will give a sense of the unique nature of leak detection, such as the pipeline measurements and the kind of area it may pass through.
Crude oil and gas pipelines are above ground and run across Saudi Arabia from the east coast to the west coast [3]. It is a twin pipeline; one part runs from the city of Abqaiq to the city of Yanbu, and the other from the city of Al Jubail to the city of Yanbu. The length of the pipe reaches up to 1200 km, and its diameter reaches up to 56 inches. It is deployed along an area that has desert characteristics [3].
A leak in an oil or gas pipeline leads to different temperature values along the pipe and changes the pressure. There are several methods to detect the leak, which are classified as external and internal techniques [3]. External techniques detect a leak from outside the pipe, such as periodic walk-through and vapor detection. Internal techniques can detect the leak from inside the pipe by measuring flow, pressure, and temperature. Internal techniques are useful in the long-range system and have lower costs [3]. Different sensors can detect the leak, such as pressure sensors, temperature sensors, flow sensors, negative pressure wave sensors, and acoustic sensors [4].

1.1. Wireless Communication for Linear-Based Topology Applications

In this subsection, we present Linear Wireless Sensor Networks (LSNs) and their application. The linear topologies assume fixed infrastructures, which means the gateways and sensors have fixed arrangements. Problems could include network coverage, lifetime, and routing, but mobility may not be an issue. In the pipeline network, the nodes are arranged along a straight line [5] LSNs have many applications, such as pipeline leak detection [4], road monitoring [6], and tunnel monitoring [7]. In [6], the road monitoring system is used for post-disaster road monitoring and demonstrates high reliability. For monitoring, the authors considered seismic motion sensors, sound sensors, and images. Furthermore, [7] proposed a tunnel monitoring system using a cluster-based routing (PUAR) for providing a low-energy monitoring system.
WSN technologies enable network communication and allow devices to share and transport data inside the network [4]. Related standards specify the formats for sharing data, routing, etc. Based on the radio spectrum usage, WSN networks may use either licensed or unlicensed bands which correspond to specific standards [8]. The licensed technology operates on dedicated lower frequency bands, covers a wide area, and consumes high power. The cellular networks are examples of the most popular licensed technology. In comparison, unlicensed technologies use a shared frequency band that is available for various systems and usage scenarios. Such technologies also use higher frequency bands and require less power than a licensed spectrum. Some of the technologies used in unlicensed spectrums are Wi-Fi, Bluetooth, Zigbee, and LoRa [8]. As discussed previously, pipelines run through Saudi Arabia from the east to the west. In populated places, the cellular network can be used, whereas unlicensed wireless communication technologies can be used in unpopulated areas. In our research, we focus on unlicensed wireless communication technologies. In the following, a brief description of these technologies is given.
  • RFID and NFC
The Radio Frequency Identifications (RFID) network consists of two types of device readers and tags. The reading device (reader) knows the tags’ locations and tracks the tags during the communication. The radiofrequency transponder (RF tag) is embedded inside objects such as animals or goods. The passive tags cover ranges up to 1 m, whereas the active tags extend to 200 m [9]. The network consumes low power and transmits a small block of data [9]. Near Field Communication (NFC) is short-range communication and secure [10]. NFC is similar to the RFID network; however, there are some differences. RFID range is up to 200 m whereas NFC is 1 m. The spectrum bands used in RFID are unlicensed. On the other hand, NFC uses both licensed and unlicensed bands [10].
  • Bluetooth
Bluetooth transmits data over a shortrange with low power and works on a 2.4 frequency band. It is the IEEE 802.15.1 standard. The range of communication is between 10 m and 100 m. The data rate is 24 Mbps [11]. Bluetooth Low Energy (BLE) is the fourth version of Bluetooth designed for short-range, low-power applications. It is significant in the IoT domain for many reasons, such as low power, low cost, and low latency. BLE uses the same Bluetooth topology but adds a separate channel between the master and each device [11]. BLE enhanced power consumption and star topology are supported by a massive number of devices [12]. Bluetooth and BLE are used in wireless control systems and communication between mobile devices [12]. Some examples of this application are the communication between the phone and wireless headset and controlling car systems.
  • Zigbee
Zigbee is widely used on the Internet of Things (IoT) because of its low power, low data rate, and large range. These characteristics are very useful in many applications. Additionally, it is designed for a personal, low-power network. The topology can be a star, mesh, or tree. Zigbee is based on the IEEE 802.15 standard, used in short-range up to 100 m and low data rate of 250 kbps. Adding more routers can increase the range [13].
  • Wi-Fi
It is designed to be used in the local area, such as homes, offices, and hospitals. It ranges up to 250 m. The data rate is high, around 600 Mbps. On the other hand, it needs a large amount of energy. Wi-Fi uses a star topology, where all communications go through the access point. This standard is easy to use and very common in IoT applications [14].
  • Sigfox
Sigfox is a wide-area low-power technology. It uses an ultra-narrow band. The Sigfox structure is similar to the cellular network, but it consumes less power and transmits small data packets [15]. The topology is a single-hop star, the area is divided into cells, and each cell has a base station. Sigfox provides low-noise communication and a wide range of up to 30 km. The data rate is around 100 bps. It is suitable for low data rate applications. Streetlights are an example of the Sigfox application [15,16].
  • DASH 7
DASH7 Alliance supports mid-range communication where the range reaches 5 km. It requires low power and provides a 20-kbps data rate. The DASH7 network is similar to the star LoRa network; however, it commonly uses a tree topology [16]. It provides good results in applications that need low latency. DASH7 is used, for example, in the location-based application and tracking cars [17].
  • LoRa
LoRa is a low-power, long-range topology. LoRa networks consist of the node, gateway, network server, and application server. The node senses the data and sends them to the gateway, then to the network server where the data packets are processed. After that, the data are sent to the application [18]. LoRa-WAN is responsible for communication protocols. The data rate reaches up to 50 kbps. The technology provides a range of 2–15 km [19]. LoRa has many uses, such as environmental applications, healthcare, oil and gas pipelines, and smart farms [20]. Table 1 shows a comparison between the technologies.
The pipeline network requirements are low power, wide range, and low cost. The most suitable technologies for pipeline monitoring are Zigbee, Sigfox, and LoRa. The Zigbee range can be extended using more routers, yet even so, it does not cover hundreds of kilometers. Sigfox can address the wide-range requirement; however, it needs subscriptions. In contrast, LoRa covers large ranges, consumes low energy, and does not require a subscription, which means there is no cost to use this technology, as it is open software.

1.2. Routing in Wireless Sensor Networks

Communication in WSNs can follow single-hop or multi-hop routing. In a single hop routing, the packet is sent from source to destination through the central point (access point), and the coverage range is fixed, whereas, in multi-hop routing, there is no central point. The packets are sent from one device to another. Additionally, it extends the coverage area and preserves energy.
In multi-hop communications, the nodes can perform both sensing and data relaying. Routing protocols are used to discover an efficient path to transmit data from source to destination. Additionally, the protocols provide reliable and energy-efficient communication [21]. This section provides an overview of the classification of routing protocols based on network topology and route processing. There are two types of network topology: flat and hierarchical [22].
  • Flat routing is a simple structure. The node senses the data and acts as a relay node. It reduces the communication overhead but consumes a large amount of power. In a flat topology, examples of the routing protocols are AODV, DSDV, OLSR, STAR, and ETSP [22]. This type of routing consumes energy.
  • In hierarchical routing, the area is divided into sub-areas or clusters. Each one has a cluster head (CH). The sensors send the data to the CH, and CH sends it to the destination. Hierarchical topology is efficient and increases scalability [23].
In route processing, there are three types: static routing protocols, dynamic routing protocols, and hybrid protocols [21].
  • In static routing, the network administrator generates the static routing protocols. The routing table is built before the communication takes place, and it is fixed. Hence, it requires low energy. The IPv4 protocol uses static routing. Static routing is not suitable if the network changes [24].
  • The dynamic routing protocol is used in environmental applications. The nodes know the routes and the paths from their neighbors. It uses two ways to discover the route: proactive and reactive [24]. Proactive routing, also known as table-driven routing, is one in which all routing information is stored in a table. To discover the paths, each node sends a broadcasting message to all nodes. These paths are stored in the routing table, which is continually updated [24]. There are many proactive protocols, such as DSDV, STAR, OLSR, HOLSR, and RPL. Reactive protocols discover the route on demand. Unlike proactive routing, reactive routing reduces the communication overhead. AODV, DSR, and TORA are examples of reactive protocols [24]. The dynamic protocol is adaptable and scalable. However, it needs more energy because of the routing process and additional resources like bandwidth, memory, and CPU, which may decrease network performance [24].
  • Hybrid routing combines both static and dynamic routing, such as link-state routing (LSR). It has a low overhead. These protocols do not work well in large-scale networks [24].
The next section mentions some of the existing leak detection systems and routing protocols. Additionally, we present some studies that applied multi-hop communication with the LoRa network.
This paper focuses on the multi-hop routing protocols, which can be applied to linear oil pipelines and focuses on LoRa multi-hop topologies along the pipelines. The paper also aims to provide essential technological elements and concepts needed to support a monitoring system for oil leak detection. More specifically, it addresses issues from the point of view of energy efficiency. We define the network parameters and estimate network density and energy. Additionally, we test various multi-hop scenarios at different system parameters such as packet sizes and transmit ranges.
The rest of this paper is organized as follows: Related work in multi-hop routing protocols used in the pipeline monitoring networks is described in Section 2. Section 3 presents the LoRa multi-hop technology model, results, and analysis. Section 4 concludes the paper.

2. Related Work

In this section, we present the related systems that are used in pipeline leakage detection and specifically the routing protocols that are used in these systems.

2.1. Related Leak Detection Systems

Over the last years, researchers have proposed pipeline leak detection systems based on WSNs. The systems use different types of sensors to monitor the different types of pipelines. Additionally, they use diverse communication technologies such as ZigBee and Bluetooth. In this part, we highlight some of these leak detection systems to define the main specifications of these systems such as the type of sensors they used, WSN technology, and the type of communication being they applied.
In [25], the Steamflood and Waterflood Pipeline Monitoring System (SWATS) design is presented. The system detects leakage in aboveground pipelines. It provides good coverage but consumes energy. The system uses temperature and pressure sensors. A different system for underwater applications was proposed in [26]. The channel-aware routing protocol (CARP) enhances the link quality by using the link state as one of the parameters to select the route. This system can be used in underwater oil pipes and monitoring pollution in the sea. CARP uses multi-hop routing.
A hierarchical network was proposed as a solution with single-hop communication as in [27,28] and with multi-hop communication [29,30]. In [27], a hierarchical representation of LSN was proposed. Dividing the networks into layers, first, they have the Basic Sensor Node (BSN), then the Relay Node (RN), Data Dissemination Node (DDN), and finally Network Control Center (NCC). Each layer uses different wireless standards, the first one uses Zigbee, and Bluetooth and the layer after that used culler technology. An improved scheme was designed, along with a routing protocol and an addressing scheme considering the Zigbee standard [27]. In this work, they used different standards at each layer. That can be used in our pipeline system. The author in [28] introduced monitoring systems for underground water pipelines (PIPENET) using Bluetooth considering a hierarchical topology with different standards that are different from the ones used in the previous work. The disadvantages are high delay and energy consumption, as well as low reliability. Another system that is described in [29] is magnetic induction-based wireless sensor networks. This study addressed the requirements of an underground pipeline monitoring (MISE-PIPE) system using a hierarchical, cluster-based system including pressure, acoustic, and temperature sensors. Additionally, the work in [31] presented a Sensor-based Pipeline Autonomous Monitoring and Maintenance System (SPAMMS) for monitoring an aboveground water pipe using a heterogeneous network (the network has three devices basic sensors, mobile sensors, and robot agent). SPAMMS requires a large amount of energy. Furthermore, the authors in [32] present an oil and gas leakage detection system, called Reliable Monitoring of Oil and Gas Pipelines using Wireless Sensor Network (REMONG), which was designed for above-ground pipes. It uses two types of sensors for temperature and pressure. It uses Zigbee technology and AODV routing protocol. The limitations are low scalability and the network lifetime, and the fact that when the density of the network increases it consumes high energy. Table 2 shows detailed specifications of these systems.

2.2. Multi-Hop Routing Protocols for Leak Detection Systems

As mentioned in the previous section, the oil and gas pipelines laid over hundreds of miles can be monitored using multi-hop linear sensor networks in a fixed infrastructure of nodes, statically arranged in a line like a chain. The data can be transmitted from a source node to the destination through intermediate nodes [33]. In this section, we present multi-hop routing protocols and review their energy consumption, delay, scalability, and network traffic. The protocols apply either linear routing or hierarchical routing. The author in [34] proposed a hierarchical multi-hop routing called Chain-Based protocol. The protocol divides the area into multiple vertical chains according to x-coordinates (x-coordinates are similar in all subarea nodes). The top node of each chain is the leader node. The communication inside the chain is from one node to another up to the leader node, and it is multi-hop. In contrast, the connection between the leader and the base station is done via a single hop. The protocol exhibits low delays and traffic volumes. However, the leader nodes require high energy, and the scalability of the protocol has not been tested. In [35], an alternative scheme was proposed to reduce transmission energy. The protocol creates a new chain between the leader nodes. The communication between the leader and the base station is done in a multi-hop fashion. Packets are sent to the base station through the chain’s leader node, which transmits from one leader node to another until reaching the nearest leader node from the base station. The protocol provides low delay, but the network exhibits unbalanced energy consumption among the sensors. There are many data packets generated which create considerable network traffic. The work [36] suggested a hierarchical Chain-Cluster Based Routing Protocol (RFC+) to avoid unbalanced energy consumption along the chain of sensors. The authors assumed that the base station has complete knowledge of the nodes’ power characteristics and locations. When the communication begins, the base station calculates the energy and delay, then selects suitable cluster heads, and then defines each cluster’s size. The process repeats in each communication which causes a high overhead [36]. The RFC+ consumes low energy and has good scalability, but in some cases, it is not applicable, because nodes cannot always connect directly to the BS. Additionally, the base station does not always have complete information about the sensors. Low-Energy Adaptive Clustering Hierarchy (LEACH) is another cluster-based routing protocol. The cluster heads aggregate the received packets before sending them to the base station to reduce the data packets. The CH dynamically changes during the communications to save the node’s energy. LEACH is presented as for single-hop communications in [37]. A multi-hop LEACH variant was proposed in [38]. First, the data are sent from the source sensor node to the CH. After that, CH aggregates and relays the data to the base station through other CHs. This protocol increases the range of transmission without consuming more power. However, although it provides scalability and low energy, it increases network traffic. Additionally, the author in [39] introduced a Distributed Algorithm for Multi-Hop Communication (MH-LEACH). This protocol reduces energy by decreasing the transmission ranges. The CH sends the data packets to the nearest neighbor MH-LEACH has low power consumption, at the cost of generated network traffic volumes. Table 3 shows a comparison of Hierarchical Multi-Hop Routing Protocols. For inter and intra-communication, each protocol may apply single-hop or multi-hop routing. The route from the node to the leader node is an intra-communication, and the inter communication is from the leader node and the base station.

2.3. LoRa Multi-Hop

LoRaWAN technology can address the pipeline system requirements in terms of range and power. LoRaWAN systems have been mainly introduced for single-hop topologies, but in recent years many studies have applied them for multi-hop communication as well. In [40] it is discussed that LoRa multi-hop and mesh solutions require targeted design to address the specific requirements from each use case scenario, highlighting scalability, management, and complexity issues. In [41] the authors studied the various deployment options of LoRa mesh and multi-hop topologies, denoting the use of nodes as intermediate relays and additionally highlighting power consumption and optimum sensor placement tradeoffs. In [42] a multi-hop protocol for LoRa is presented, which also considers an SDN network architecture, which demonstrated acceptable trade-offs among performance and scalability. In [43], the authors suggested the use of multi-hop LoRa in Smart City applications to extend the range and reduce the energy dissipated in each sensor node. The authors compared LoRa single-hop and multi-hop communication, and the results showed that the multi-hop option provides better performance, with some concerns about the achieved scalability. In [44], the authors compared the packet delivery in single-hop and multi-hop LoRa to monitor a large area using mesh topology. This system consumed excessive energy and had many limitations in terms of security and latency. The work in [45] proposed routing protocols to minimize the latency, using LoRa multi-hop hierarchical routing and assuming tree-based topologies. The system increased reliability and provided low latency. However, energy issues are not addressed. Additionally, a new multi-hop LoRa communication was proposed in [46] for a linear network. The system enhanced the packet delivery and delay, but when the network scalability increased, it led to low performance in terms of delay. Additionally, the work did not evaluate the system’s energy requirements. In [47], an underground monitoring system was studied considering a linear sensor topology. The authors considered a multi-hop LoRa network, consisting of various sensors for measuring water and air indicators and developed an energy cost per sensor.
Using multi-hop extends the LoRa network coverage and provides reliability. How- ever, some constraints must be considered to achieve energy efficiency and low overhead routing. The proposed networking protocol assumes LoRa multi-hop links serving a linear topology of deployed sensors over the pipeline, considering the tradeoffs presented in the related state of the art research. The system is described in the next section.

3. System Architecture, Scenarios of Multi-Hop LoRa, and Results

In our envisaged system for monitoring the oil transport infrastructures, the pipeline is considered to run through the desert where wired connections and power supplies are not usually available. The pipeline length is up to 1200 km. Furthermore, 266 km of the pipeline run through the desert where there are no cities around [3]. In this research, the system is designed supposed to use a WSN consisting of two types of sensors: temperature and pressure sensors, both battery-powered. The sensors send the measurements to the gateway (GW) in a multi-hop fashion. The GW needs a power source, so it is under consideration for placement in the nearest town. The data are sent from the GWs to the control center where they are analyzed to detect leakages. LoRaWAN multi-hop technology will be considered, assuming a bandwidth of 125 kHz.
Three different scenarios are tested to build and evaluate our model. The first scenario is the simplest multi-hop formation, according to which the source node sends the packet to its neighbor (and then on each node to its immediate neighbor) until reaching the GW. The node only connects to the previous and next neighbors. This type of communication is easy to develop. In this scenario, all nodes will be involved in the communication. In the second scenario, not all nodes cooperate in the communication. Each node will send packets to the third neighbor. In the last scenario, the node will transmit packets to its ninth neighbor. Both scenarios 2 and 3 increase the time of sleep state for network nodes. Figure 1 shows the three scenarios. In each scenario, we estimate network capacity and coverage planning and calculate the energy consumed when receiving and sending packets of various sizes towards the gateway. In LoRa technology, sending the packets to a specific neighbor node is done in two ways, either by broadcasting using address 0 or using the neighbor node’s address [47]. Since in our scenario the node may send the packets to its second or third neighbor, the communication in our model is achieved through the node’s addresses.
Furthermore, a comparison between flat and two hierarchical topologies is presented. In flat topologies, the nodes are arranged in a line, and each node connects with its adjacent neighbors (next and previous). The packets are sent from one node to another until they reach the GW. On the other hand, in the first hierarchical topologies, the area is divided into clusters. Each cluster has a cluster head (CH) and three nodes. The communication is done from each node to its CH and then from the CH to the GW through other CHs. In the second hierarchical scenario, each cluster has nine nodes instead of three. The two hierarchical scenarios are shown in Figure 2. As can be seen, in each scenario, nodes are numbered sequentially, and cluster heads nodes are labeled with CH and a number representing their order in the sequence of all nodes of the scenario.
We evaluate our model to validate the network parameters and assumptions. In this section, we show and discuss our results. We compare the consumed energy and number of bytes for different transmission ranges.
The results will be presented in the following four sections. The first section studies the measurement ranges and the traffic size, whereas the second section focuses on the energy consumption of LoRa devices. The third section examines two different types of sensors, and the last section compares the energy consumption of LoRa devices in a flat and hierarchical topology. All tests focus on flat topology, except the fourth one; it compares flat and hierarchical topologies.

3.1. Flat Topology Calculations

3.1.1. Measurement Ranges and Traffic Size Calculations

We calculate the measurement range and the density along 10 km of linear pipeline. Table 4 shows the three scenarios of the different multi-hop routing, where the system may deploy one of the available packet sizes: 1 byte and 255 bytes. Various distances between sensors from 10 m to 500 m are analyzed. For each distance, the number of hops is calculated for one packet. The network density and the number of hops give a good indication of the different possible traffic sizes. For the density of the sensor’s calculation, we must consider the measurement types, since they have different requirements in terms of measurement ranges and consequently network densities. Based on the inner distances between the devices, we spread the devices along the 10 km of the pipeline and calculate the number of devices required for each distance [10 m, 50 m,…, 500 m]. The number of hops was obtained for the three communication scenarios. For example, at the distance of 200 m (the inner distance between the devices), we need 50 sensors to cover all the 10 km of the pipeline. If we are using the second communication scenario, fewer sensors cooperate, so there are 17 hops to transmit data to the gateway. When we deploy more sensors with less distance between them, it increases the number of packets generated, which leads to more energy being consumed. The amount of energy consumption also depends on the sensor’s role within the communication chain: if it only transmits its data or if it is a cluster head.
Figure 3 compares the number of generated and transmitted bytes via the sensor network according to scenarios 1, 2, and 3 where packet size is 255 bytes at different distance ranges, starting from 50 m to 500 m. To find the number of transmitted bytes in one day, we determine the number of packets forwarded at each hop. Each sensor will send its packets and resend its neighbors’ packets. For each inner distance, there is a different number of hops and a different number of transmitted packets. The following equation was used:
Number   of   packets = ( p i p e l i n e   l e n g t h   d i s t a n c e ) × p a c k e t   s i z e
Results show an increase in the traffic that will be generated as the inner-sensor distance decreases. Scenario 3 has a lower number of bytes than other scenarios. To design a sensor network with low requirements in terms of the number of generated bytes, we can decrease the network density (use a large inner distance ex. 200 m) and send it through a smaller number of hops (scenario 3 has minimum hops).

3.1.2. The Energy Consumption of LoRa Nodes Calculations

In Figure 4 and Figure 5, we calculate the energy consumption per node for one day. We consider energy consumption only for the send and receive modes. We select 200 m as the distance between sensors based on the previous traffic calculations. From [47], we used the same value of the current for send and receive mode. The energy value in joules was calculated; for sending mode, it is 0.323 joule, and for receiving mode, it is 0.218 joule. To calculate the energy consumption for a single node, we use Equation (2), where N is the sequence number of the sensor in the communication, ERm is the energy for receiving mode, ESm is the energy needed to send the packets, and Ps is the packet size.
E = [(N − 1) ERm + N ESm] Ps
Each sensor sends one byte every 3 h. As an example, node 2 in the first scenario will send the two packets (packet of node 1 and its packet) and receive one packet, so it consumes around 1 joule per day. Table 5 shows energy assumptions.
In Figure 4, the energy consumption per node is presented. The node IDs (1, 10, and 40) are shown in the x-axis where the distance between sensors is 200 m. The nodes which cooperate for the communication in the three scenarios are selected. The amount of energy consumed per node is shown in Figure 5. The x-axis shows the node’s IDs, on the other hand the values of the y-axis are presented in logarithmic-scale. We calculate the energy consumption to show the difference between the three communication scenarios. We first determine the number of received and transmitted packets for each node included in the communication, then apply Equation (1) to find the nodes’ energy consumptions. Device 1 consumes around 0.2 joules in all three scenarios, depicted in Figure 5. Device 40 consumes around 440 joules in the first scenario whereas it consumes around 10 joules in scenario 3, which are shown in Figure 5. Less energy consumption is observed in scenario 3 due to the smaller number of hops.
Moreover, to show the communication scenarios’ effect on energy consumption, we applied Equation (2) on the 50 nodes and calculate the total energy per day in the three scenarios. For example, in scenario 1, the devices consume around 11,674 joules, whereas in the third scenario the devices consume 148 joules. This can be observed in Figure 6, where the y-axis shows the number of the scenarios, and the x-axis shows the total amount of energy consumed by the nodes of the corresponding scenario. When the number of hops decreases, the total required energy decreases, as shown in Figure 6. We observed that the second scenario improve energy by 88% and the third scenario by 98%.
The three scenarios have different results because of the number of nodes involved in the communication (number of hops). In scenario 1, all nodes cooperate, which leads to more energy consumption in each node, whereas in the second scenario, less than half of the nodes are involved in forwarding other nodes’ packets, so the average energy consumption is less. Furthermore, the smaller number of hops leads to lower end-end delay and higher throughput. This is via either appropriate dimensioning of their transceivers and processors or via appropriate scheduling of the transmitted packets by different cluster nodes to avoid packet collisions and packet queuing. Moreover, the distance between sensors is related to the application type and requirements. For example, in LoRa underground monitoring applications, the maximum distance is 200 m and, in some cases, is 150 m, as in [48], whereas the distances are larger in aboveground applications. Calculations in Table 4 show that the communication range can reach 500 m, which is within the achievable range defined for LoRa-WAN via link budget calculations, such as those mentioned in [49].

3.1.3. Temperature and Pressure Sensor Calculations

We performed another set of tests on temperature and pressure sensors and compared the results to determine the optimal inner distance between the sensing devices (sensor) and the suitable number of bytes for both sensor types. We set the packet size to be 255 bytes, and the pipeline length to be 10 km. The temperature sensors were assumed to transmit a sample every 3 h, and the pressure sensors sent a measurement every 1 h for one day. The test calculated the network density, the energy transmitting and receiving packets, and the total number of bytes at different distances between sensors. Each type of sensor generates a different number of bytes, The pressure sensors need a higher sampling rate and lower distances between sensors than temperature sensors [48,49]. Figure 7 presents the energy consumed by all nodes located within the inner distances specified by the x-axis, for both pressure and temperature sensors. As can be observed from the figure, the pressure sensors need more energy than the temperature sensors for the same network density. For inter-sensor distances between 200 m and 500 m, the energy consumption is low for both sensor types. Figure 8 shows the total number of bytes for all nodes located within the inner distances specified by the x-axis, for both pressure and temperature sensors. Pressure sensors have a higher number of bytes than temperature sensors, as can be seen in Figure 8. Therefore, pressure sensors require high energy consumption.

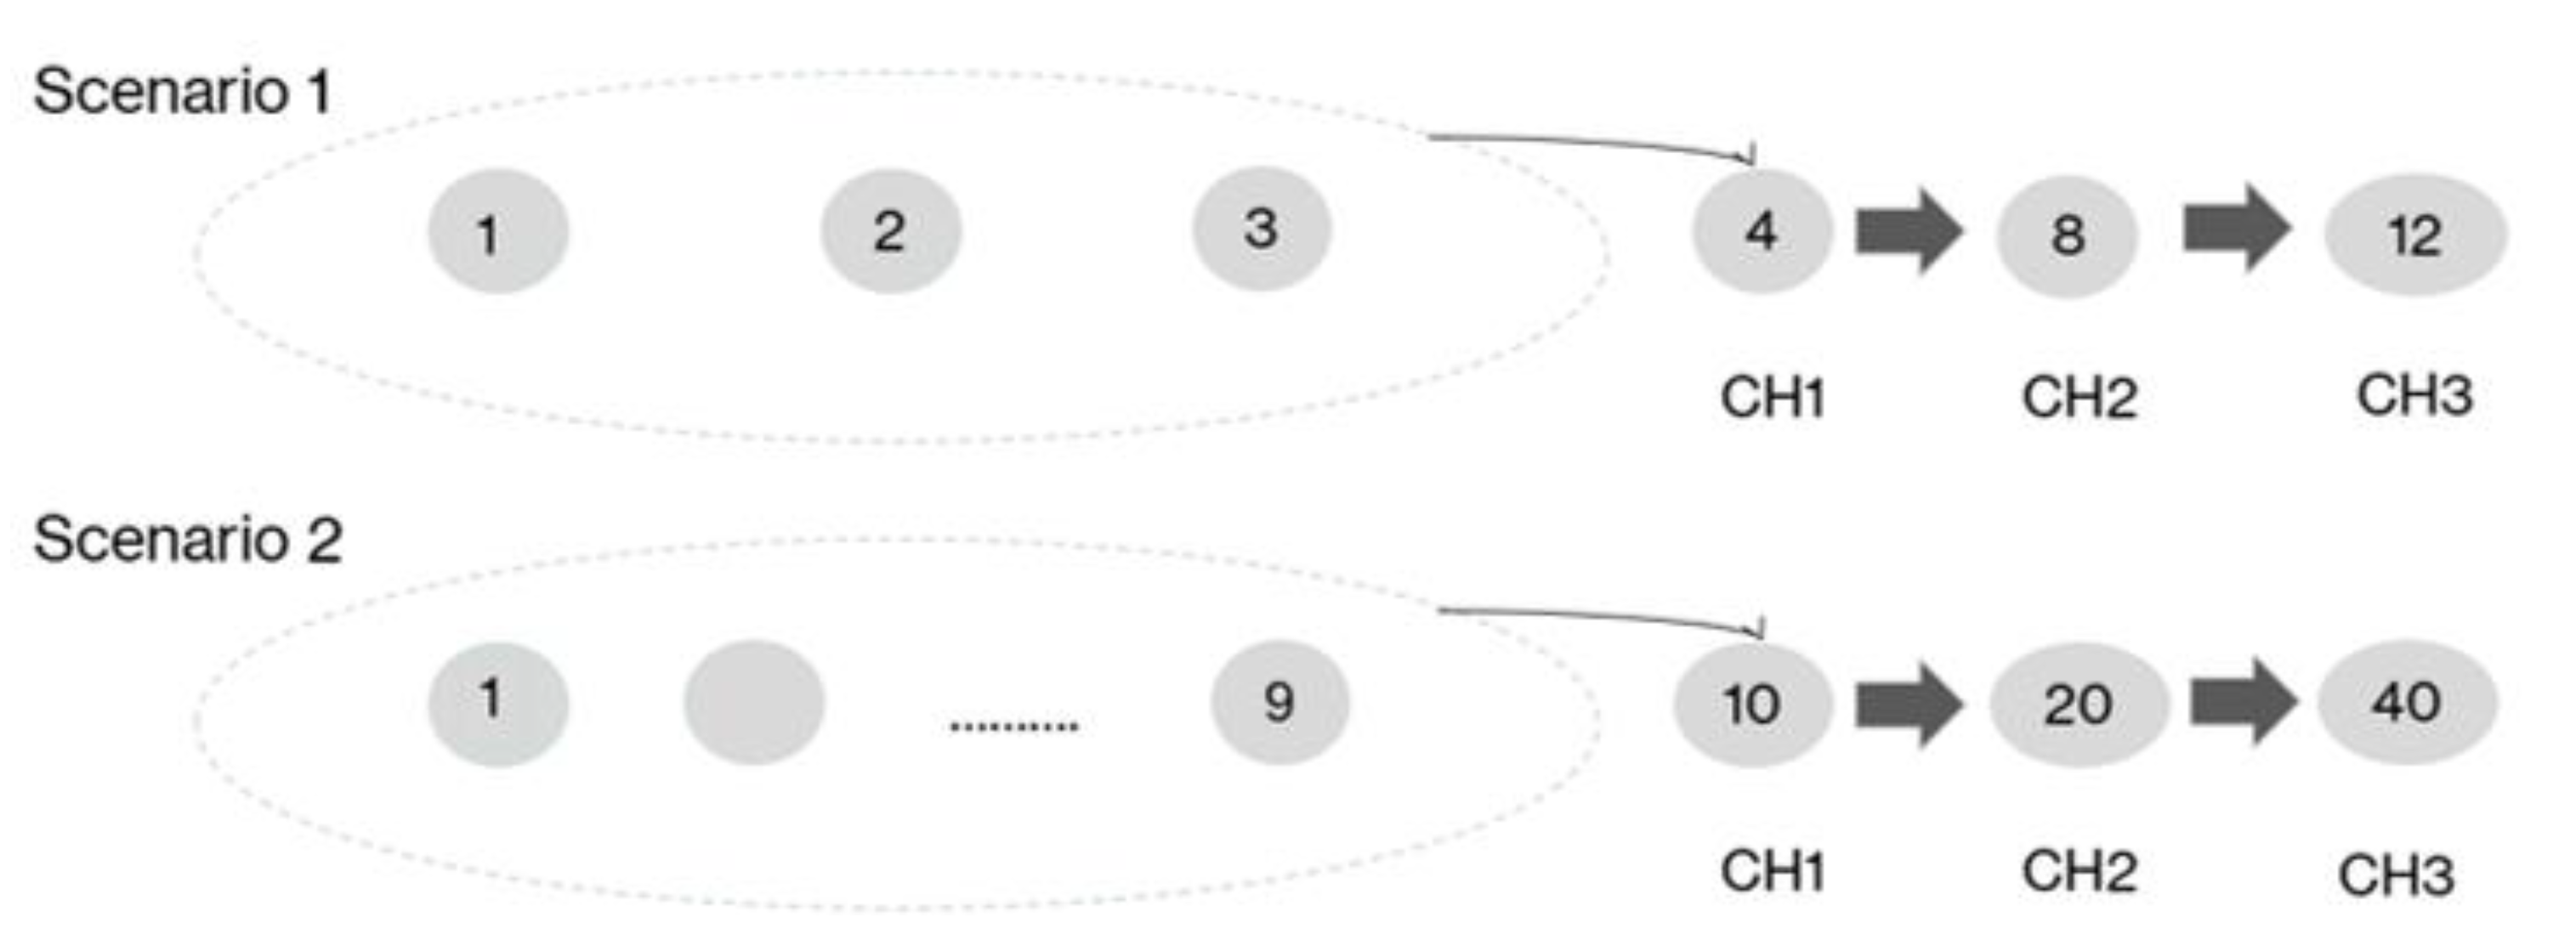
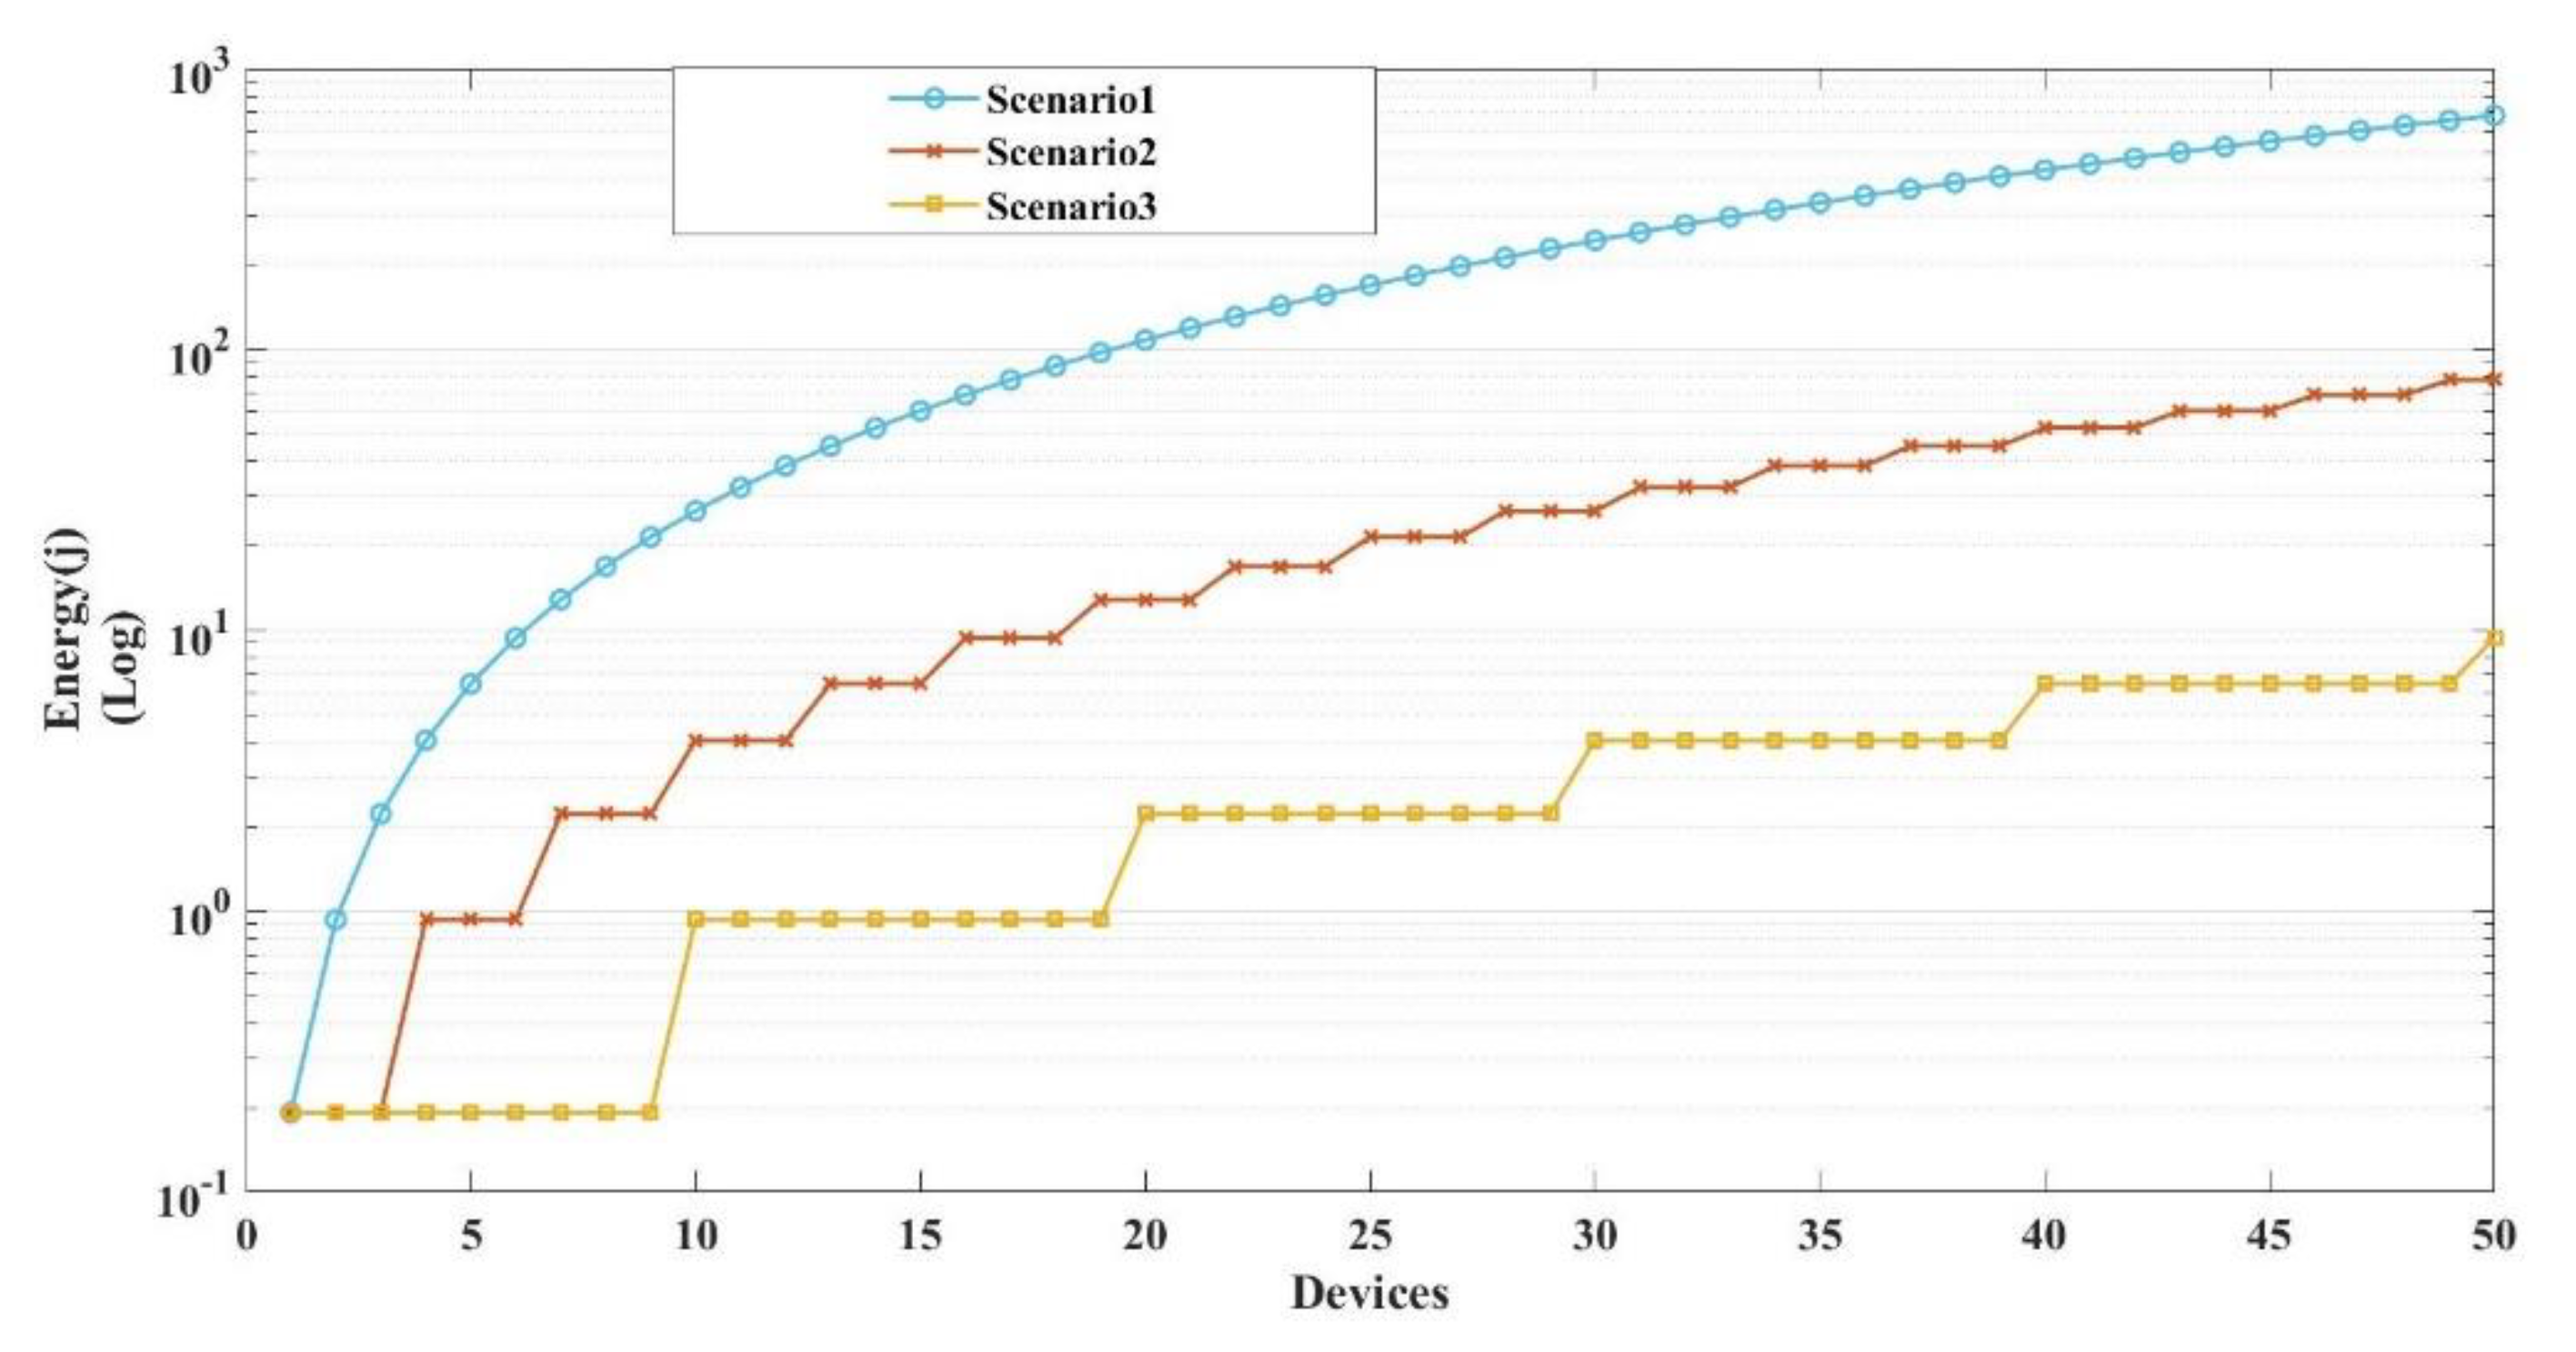
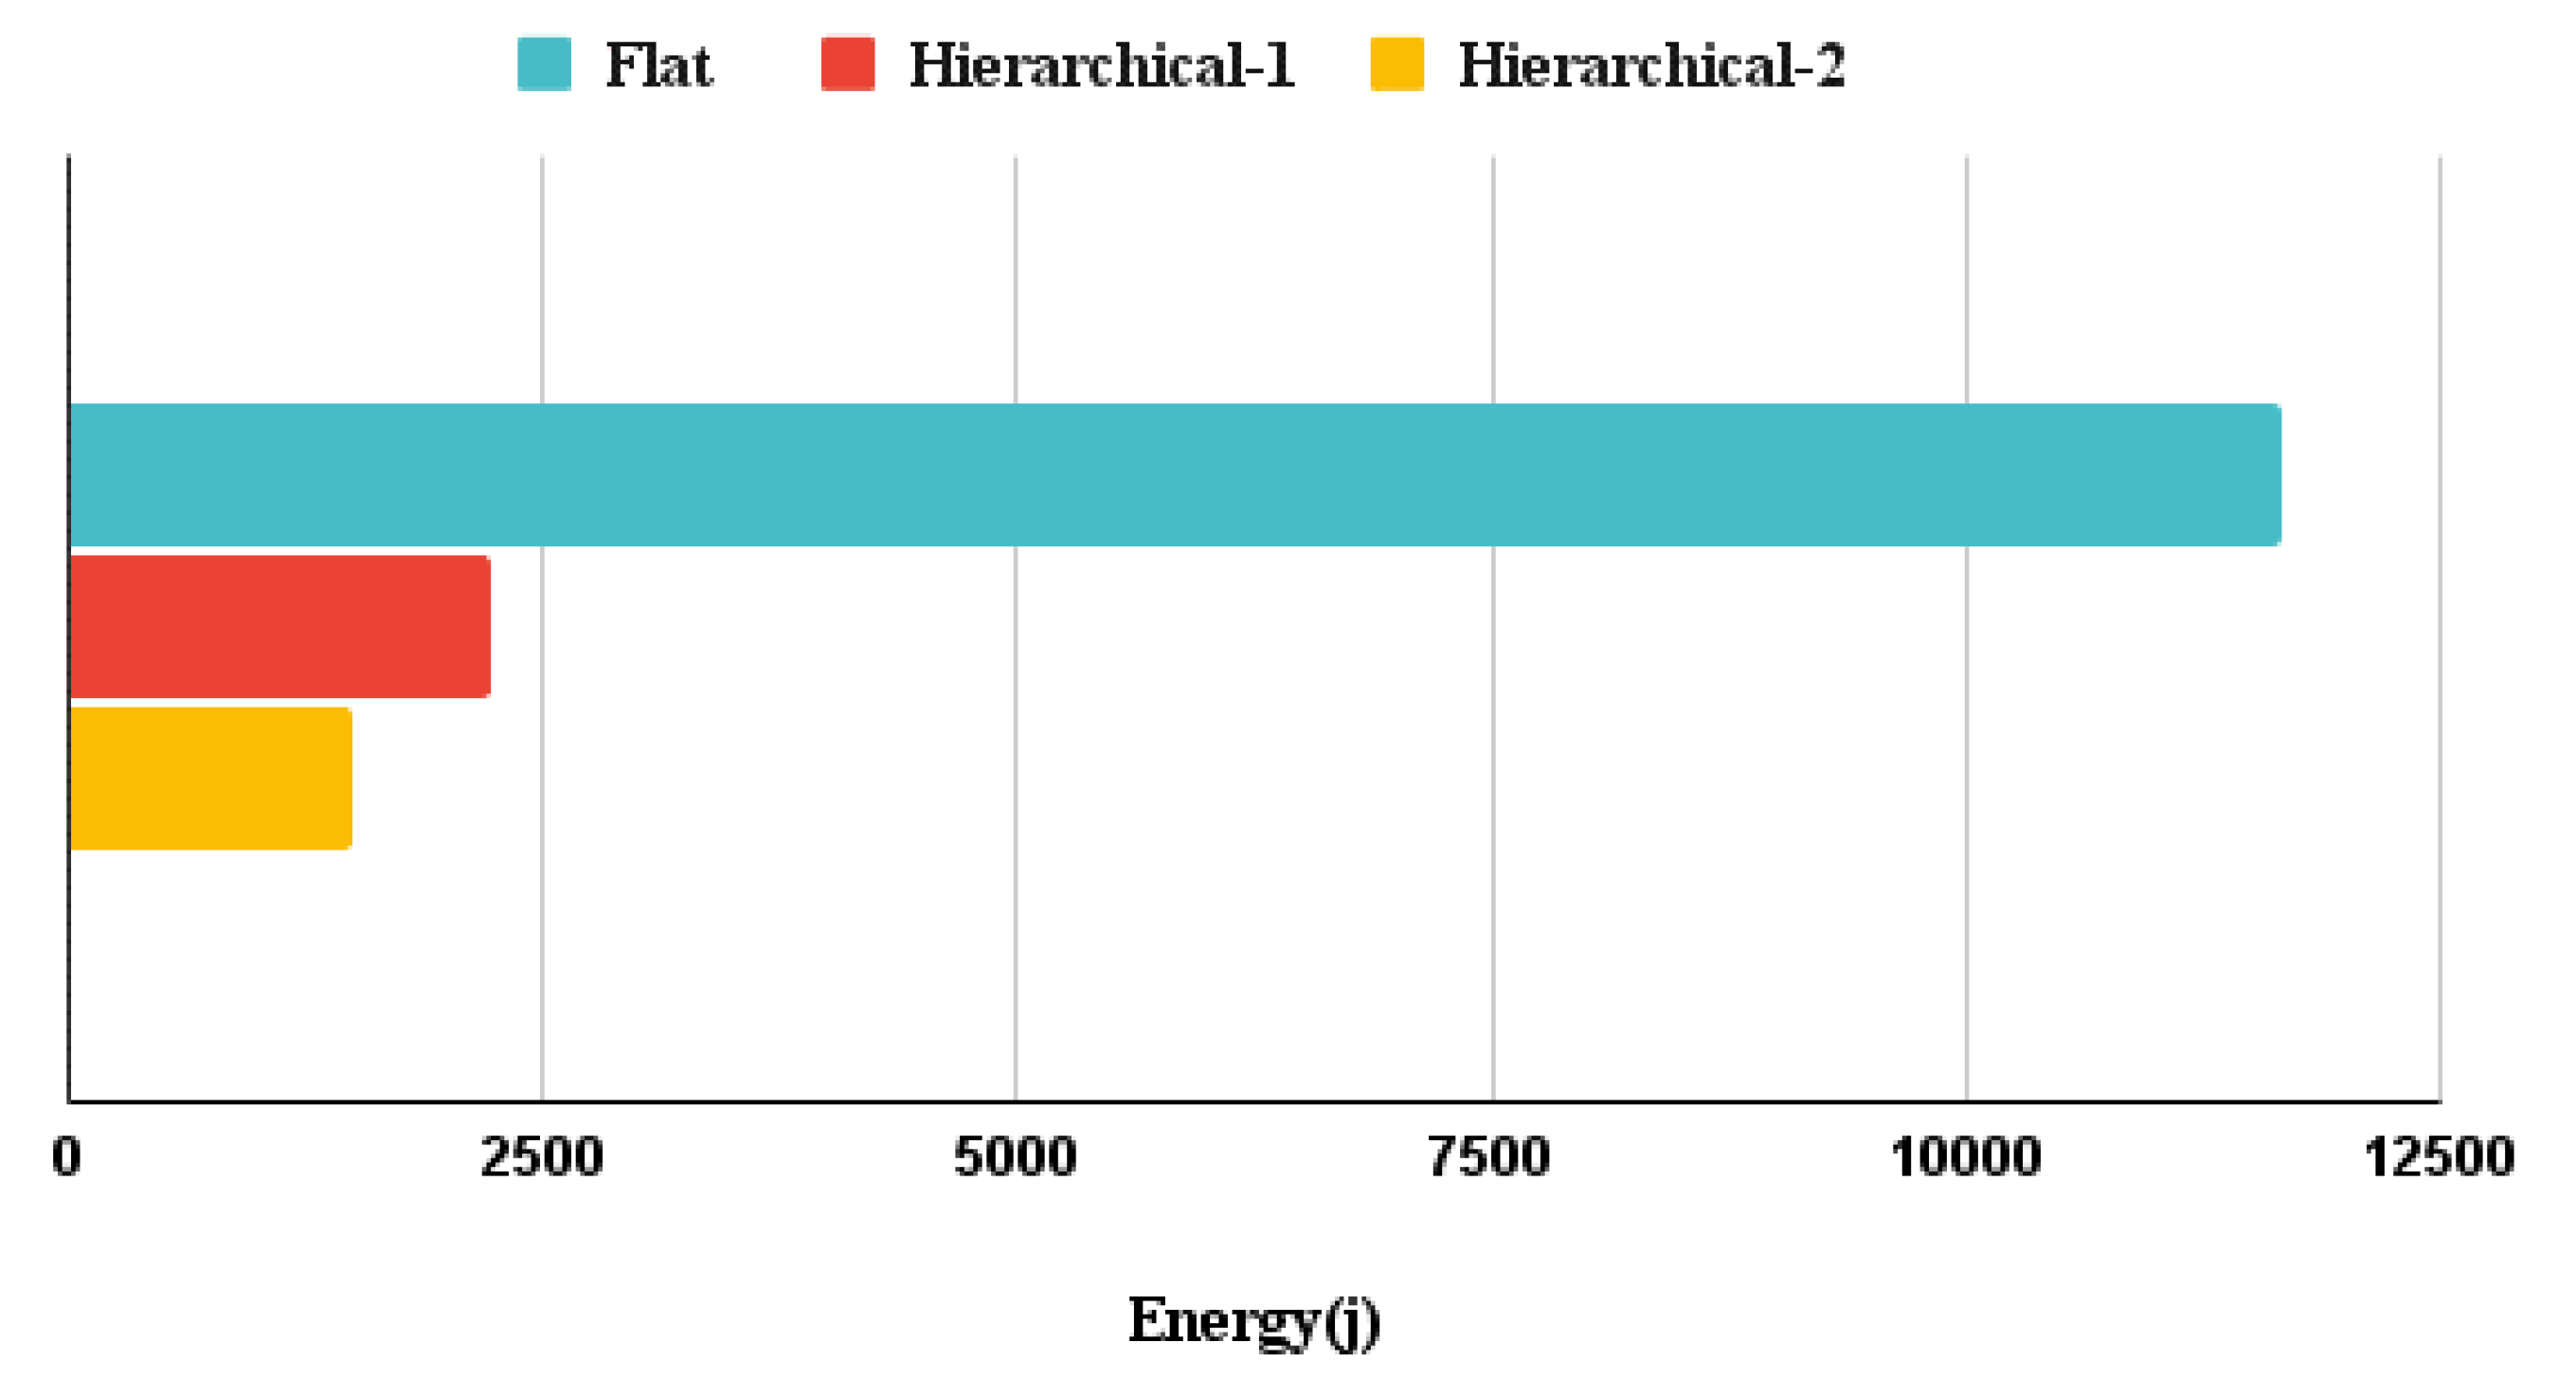
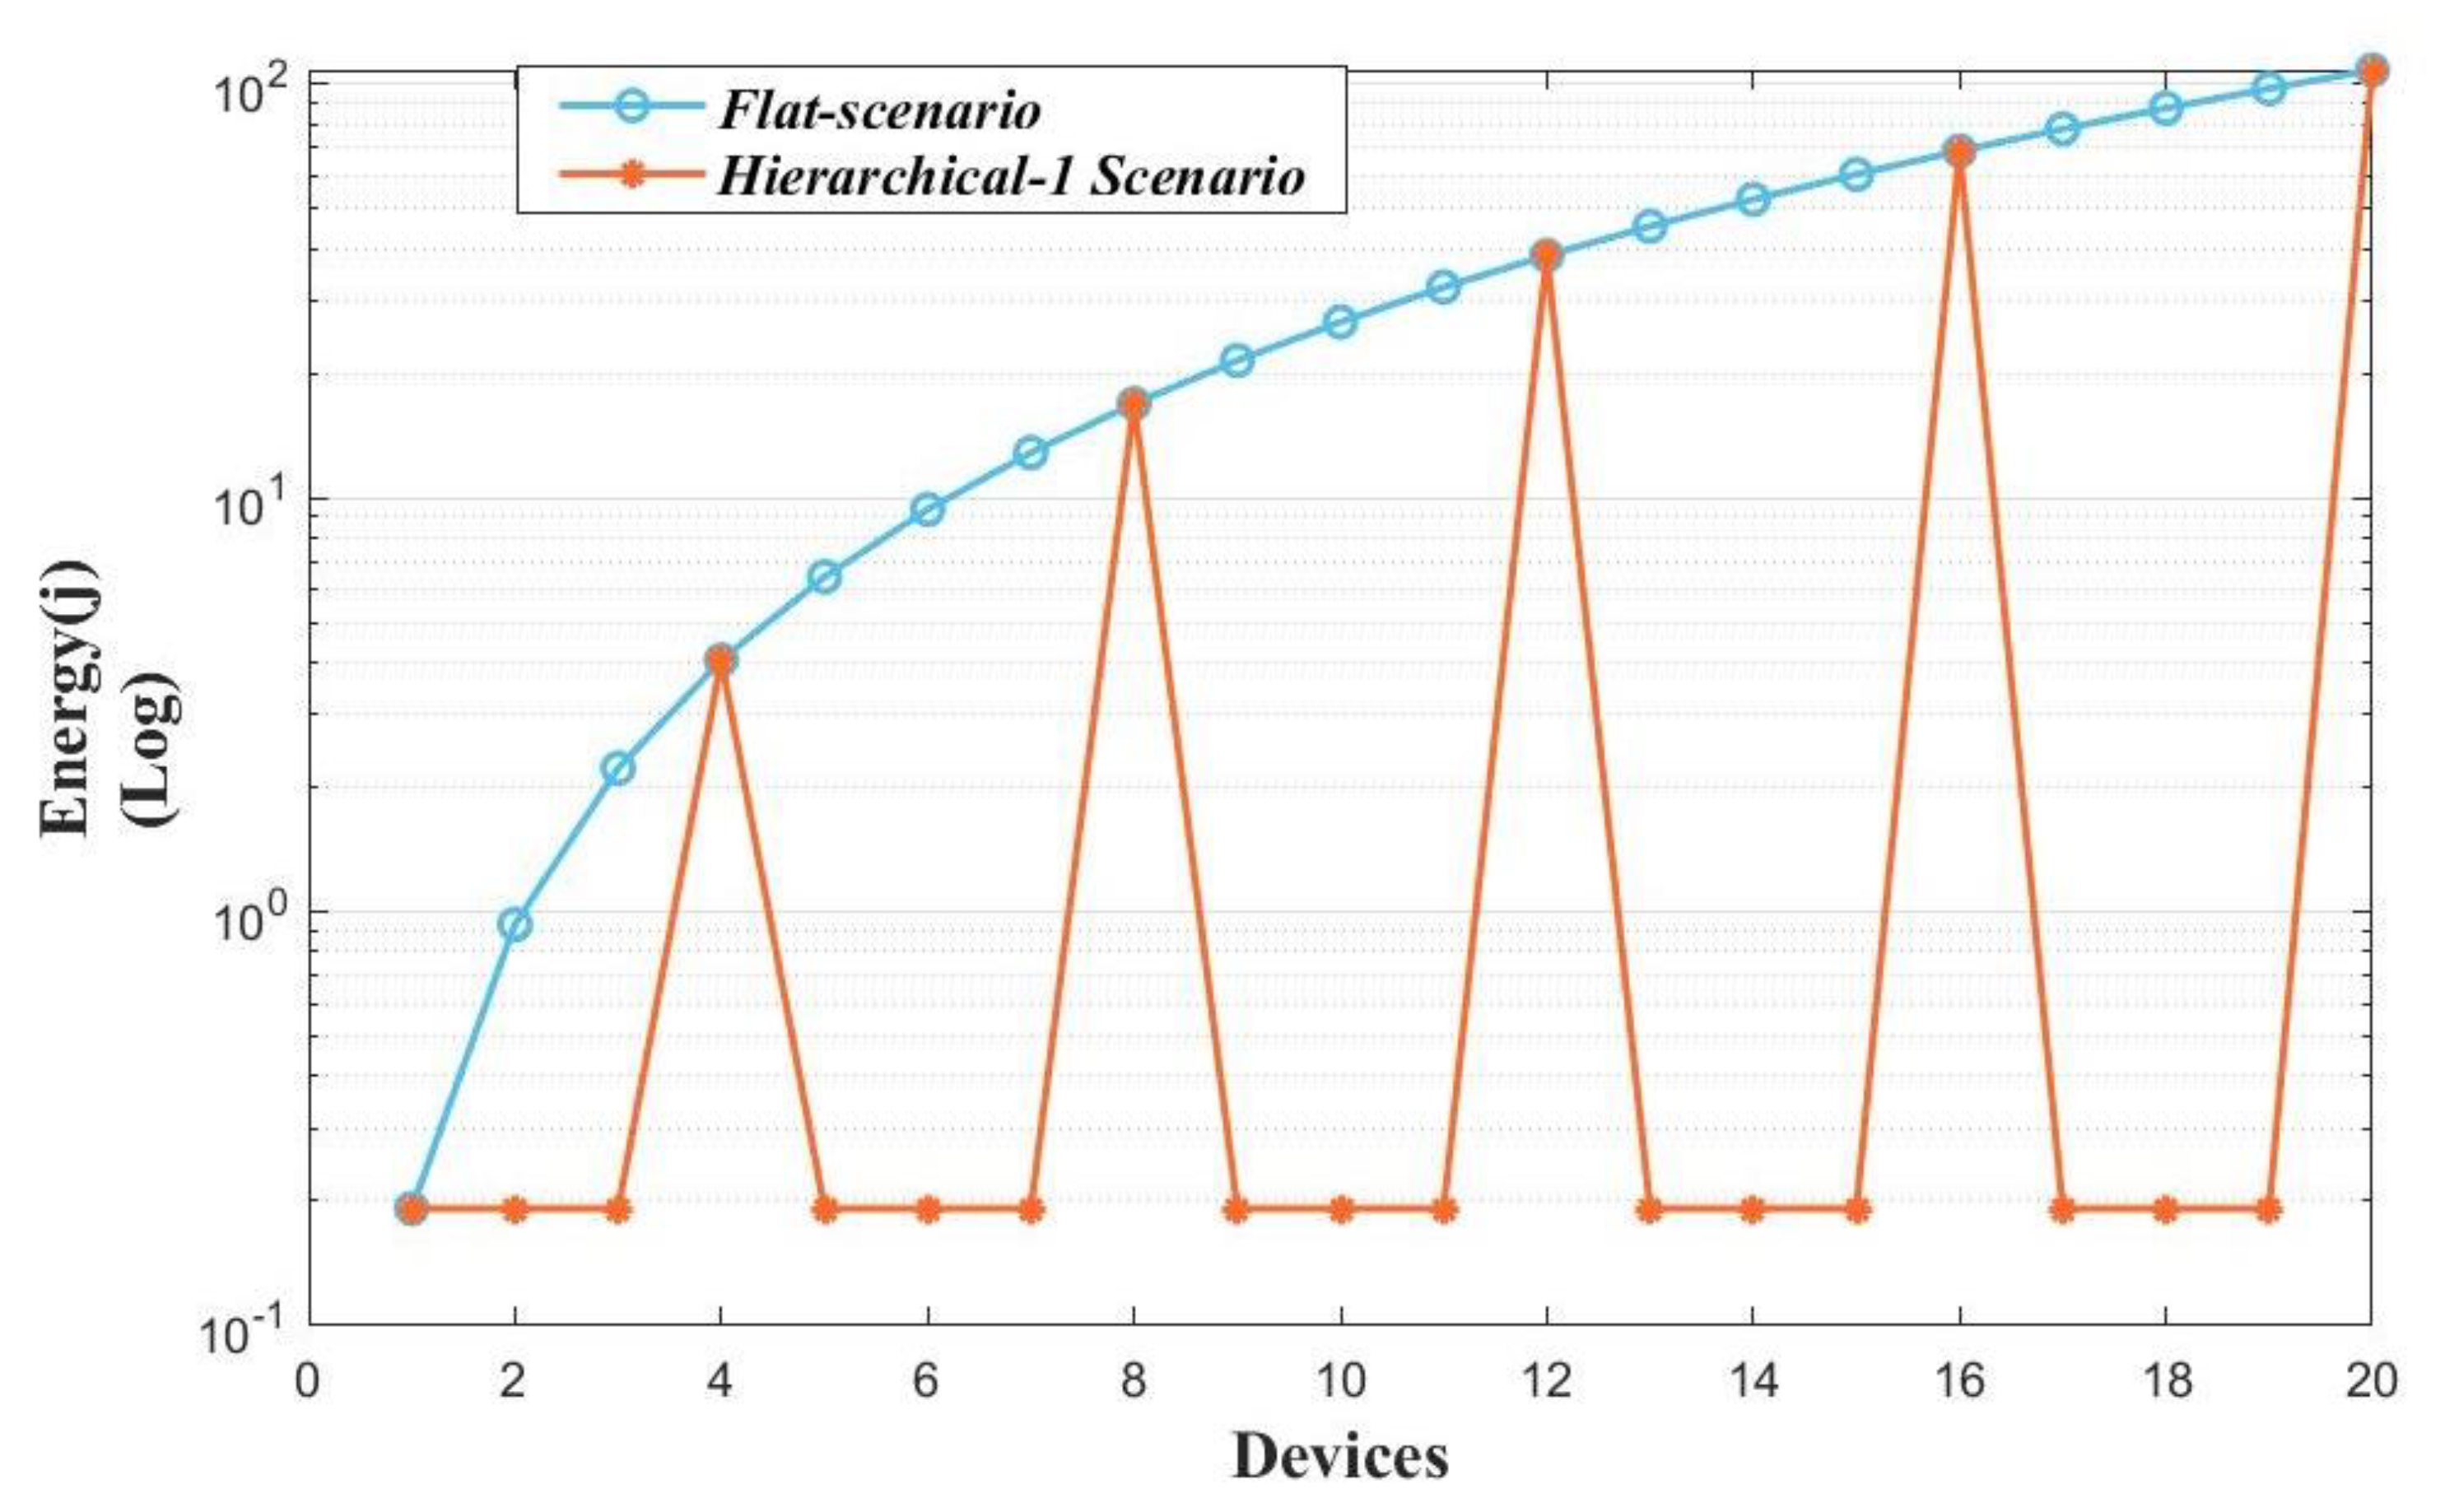
3.2. Hierarchical Topology calculations

Energy Consumption per Node for Flat and Hierarchical Topology
A further test has been conducted for comparing the flat and hierarchical (cluster) topologies with similar parameters: the distance between sensors is 200 m, and the calculations assume one day where sensors send 1 byte every 3 h and multi-hop communication mode as described in scenario 1 (shown in Figure 2). The network has 50 nodes. Three topologies are analyzed: The first topology is flat, and the other two are hierarchical. In the first hierarchical scenario, devices are divided into 12 clusters. Each cluster has four sensors. The cluster head is the last node in the cluster (sensor IDs 4, 8, 12, 16, 20, 24, 28, 32, 36, 40, 44, 48). In the second hierarchical scenario, there are five clusters. Each cluster has 10 sensors. The cluster head also is the last node in the cluster (sensor IDs 10, 20, 30, 40, 50). Figure 9 depicts the energy consumed by each node—represented with its ID—for all three topologies. The energy levels for the cluster heads of the hierarchical topologies—represented as orange and yellow dots—are interleaved with the energy levels of the flat topology. The energy levels, of the other nodes within the clusters of both hierarchical topologies are shown overriding each other—the yellow dots overriding the orange dots. The total amounts of energy consumed by the network of the three topologies are shown in Figure 10. The results show that the sensors consume high energy in the flat topology compared with the hierarchical topology. Clustering improved the energy consumption by 80% in the first hierarchical scenario and by 87% in the second hierarchical scenario. In a hierarchical topology, only the cluster heads need more energy. Hierarchical topology provides better energy efficiency, as shown in Figure 9 and Figure 10. In Figure 9, the hierarchical-1 chart is hidden by the scenario hierarchical-2 chart.
Moreover, to show the energy consumption for simple sensors (cluster members), we calculated the energy per node for 20 sensors in the first hierarchical scenario (hierarchical-1) and compared the result with the flat scenario. In the hierarchical-1 scenario, the simple sensors also consume energy, but it is much lower than in the flat scenario (worst case), as shown in Figure 11. The energy required for simple sensors in the hierarchical topology is improved by 69% compared with the energy needed for the flat topology. (In Figure 11, devices IDs (4, 8, 12, 16, and 20) are cluster heads).
To have an effective network for different requirements, in terms of applications that we need to run across the pipeline, we must optimize the traffic generated and energy consumed, considering parameters such as measurement type and rate, sensor ranges and coverage, capacity limit, and the required density for each type of sensor.
In this paper, we determined the parameters of the model such as throughput, energy consumption, number of sensors, and the inner distance between sensors to show how the parameters selection affect the model performance. As an example, we noticed that setting the size of the packet to the maximum size (255 bytes) resulted in the estimated energy consumption of around 1800 joule within a day for pressure sensors (when the inner distance is 200 m). We also determined the possible values and limitations of the model parameters. For example, we cannot set distances more than 500 m, even though LoRa Technology has the capability of higher coverage. However, due to application requirements, setting the distance between sensors to more than 500 m will have the risk of missing the existence of leakage along the pipeline [48,49].
There is a tradeoff involving different issues related to measurement precision, network capacity, network coverage, and energy efficiency; therefore, multi-hop communication may enhance coverage, but it is important to design the network in such a way that balances energy consumption and network traffic volumes.

4. Conclusions—Future Work

This paper discussed wireless communication solutions and multi-hop routing as solutions for pipeline networks’ leak detection systems. The main objectives of the survey presented in this study are to review the existing multi-hop systems and routing protocols and define the limitations, like the network energy and the volume of data traffic. We studied how the various network parameters, which are important for WSN multi-hop networks, are deployed along oil pipelines.
In future work, we will focus on investigating energy-efficient, reliable routing protocols for the oil pipeline use cases, including throughput, energy, and reliability performance indicators. It would be desirable to have sensors spaced quite close to each other to detect with high accuracy inconsistencies caused by various events such as leaks, fire, loss of pressure, corrosion, impact, etc. Such dense sensor deployment may lead to the generation of excessive measurement traffic leading to congestion, packet collisions, interference, and loss of communication for various nodes within the networks. Additionally, a dense network using multi-hop connections (either flat or hierarchical) may lead to heavy-duty operation of devices that will have to relay the packets of their neighbors towards the destination gateway, affecting their energy autonomy and operational efficiency. There are multiple approaches to addressing such challenges. For example, we could space the sensors further apart and reduce the network node density, or we could schedule specific devices to relay the generated measurements. We must also consider other criteria, such as delay criticality of data and the “coherence time” of the different measurement types to ensure that the network optimizes its operation according to the transported information. This tradeoff will be investigated in future work that will expand on the presented methodology.

Author Contributions

Conceptualization, H.A. and N.D.; methodology, H.A. and N.D.; validation, N.D., M.F. and H.B.; investigation, H.A.; writing—original draft preparation, H.A.; writing—review and editing, N.D., M.F. and S.A.; visualization, H.A.; supervision, M.F. and N.D.; project administration, G.A.; All authors have read and agreed to the published version of the manuscript.

Funding

This research received no external funding.

Conflicts of Interest

The authors declare no conflict of interest.

References

  1. Midani, M.; Technologies, P.; Arabia, S. Pipeline Leak Detection Technologies and Selection Criteria. In Proceedings of the Pipeline Technology Conference 2019, Berlin, Germany, 18–21 March 2019; pp. 1–12. [Google Scholar]
  2. Yu, H.; Guo, M. An efficient oil and gas pipeline monitoring systems based on wireless sensor networks. In Proceedings of the 3rd International Conference on Information Security & Intelligent Control, ISIC 2012, Yunlin, Taiwan, 14–16 August 2012; pp. 178–181. [Google Scholar] [CrossRef]
  3. Al-Ahmari, S.A. Saudi Aramco Experience towards Establishing Pipelines Integrity Management System (PIMS); Rio Pipeline Conference and Exposition, Technical Papers, Energy Technology Data Exchange (ETDEWEB): Washington, DC, USA, 2009; pp. 1–6. [Google Scholar]
  4. Anupama, K.R.; Kamdar, N.; Kamalampet, S.K.; Vyas, D.; Sahu, S.; Shah, S. A wireless sensor network based pipeline monitoring system. In Proceedings of the 2014 International Conference on Signal Processing and Integrated Networks, SPIN 2014, Delhi, India, 20–21 February 2014; pp. 412–419. [Google Scholar] [CrossRef]
  5. Subramaniam, S.K. Novel Design of Reliable Static Routing Algorithm For Multi-hop Linear Networks. Ph.D. Thesis, Brunel University London, London, UK, 2017. [Google Scholar]
  6. Sun, X.; He, J.; Chen, Y.; Ma, S.; Zhang, Z. A new routing algorithm for linear wireless sensor networks. In Proceedings of the 2011 6th International Conference on Pervasive Computing and Communications, ICPCA 2011, Pisa, Italy, 21–25 March 2011; pp. 497–501. [Google Scholar] [CrossRef]
  7. He, B.; Li, G. PUAR: Performance and Usage Aware Routing Algorithm for Long and Linear Wireless Sensor Networks. Int. J. Distrib. Sens. Netw. 2014. [CrossRef] [Green Version]
  8. Bhuvaneswari, V.; Porkodi, R. The internet of things (IOT) applications and communication enabling technology standards: An overview. In Proceedings of the 2014 International Conference on Intelligent Computing, ICICA 2014, Nanchang, China, 3–6 August 2014; pp. 324–329. [Google Scholar] [CrossRef]
  9. Sarawi, S.; Anbar, M.; Alieyan, K.; Alzubaidi, M.S. Internet of Things (IoT) Communication Protocols: Review. In Proceedings of the 2017 8th International Conference on Information Technology, Singapore, 27–29 December 2017; pp. 685–690. [Google Scholar] [CrossRef]
  10. Coskun, V.; Ok, K. A Survey on Near Field Communication (NFC) Technology. Wirel. Pers. Commun. 2014, 71, 2259–2294. [Google Scholar] [CrossRef]
  11. Gomez, C.; Oller, J.; Paradells, J. Overview and evaluation of bluetooth low energy: An emerging low-power wireless technology. Sensors 2012, 12, 11734–11753. [Google Scholar] [CrossRef]
  12. Čolaković, A.; Hadžialić, M. Internet of Things (IoT): A review of enabling technologies, challenges, and open research issues. Comput. Netw. 2018, 144, 17–39. [Google Scholar] [CrossRef]
  13. Jawhar, I.; Mohamed, N.; Shuaib, K. A framework for pipeline infrastructure monitoring using wireless sensor networks. In Proceedings of the 2007 Wireless Telecommunications Symposium, WTS 2007, Pomona, CA, USA, 26–28 April 2017; pp. 1–7. [Google Scholar] [CrossRef]
  14. Bhoyar, P.; Sahare, P.; Dhok, S.B.; Deshmukh, R.B. Communication technologies and security challenges for internet of things: A comprehensive review. AEU Int. J. Electron. Commun. 2019, 99, 81–99. [Google Scholar] [CrossRef]
  15. Durand, T.G.; Visagie, L.; Booysen, M.J. Evaluation of next-generation low-power communication technology to replace GSM in IoT-applications. IET Commun. 2019, 13, 2533–2540. [Google Scholar] [CrossRef]
  16. Stoynov, V.; Poulkov, V.; Valkova-Jarvis, Z. Low Power Wide Area Networks Operating in the ISM Band—Overview and Unresolved Challenges; Springer: Berlin, Germany, 2019; Volume 283. [Google Scholar]
  17. Ismail, D.; Rahman, M.; Saifullah, A. Low-Power Wide-Area Networks: Opportunities, Challenges, and Directions. In Proceedings of the International Conference on Distributed Computing and Networking, Varanasi, India, 4–7 January 2018; pp. 1–6. [Google Scholar]
  18. Bor, M.; Vidler, J.; Roedig, U. LoRa for the Internet of Things. In Proceedings of the 2016 International Conference on Embedded Wireless Systems and Networks, Graz, Austria, 15–17 February 2016; pp. 361–366. [Google Scholar]
  19. De Poorter, E.; Hoebeke, J.; Strobbe, M.; Moerman, I.; Latré, S.; Weyn, M.; Lannoo, B.; Famaey, J. Sub-GHz LPWAN Network Coexistence, Management and Virtualization: An Overview and Open Research Challenges. Wirel. Pers. Commun. 2017, 95, 187–213. [Google Scholar] [CrossRef] [Green Version]
  20. Zhou, Q.; Zheng, K.; Hou, L.; Xing, J.; Xu, R. Design and Implementation of Open LoRa for IoT. arXiv 2018, arXiv:1812.09012. [Google Scholar] [CrossRef]
  21. Toor, A.S.; Jain, A.K. A survey of routing protocols in Wireless Sensor Networks: Hierarchical routing. In Proceedings of the 2016 International Conference on Recent Advances and Innovations in Engineering, ICRAIE 2016, Jaipur, India, 23–25 December 2016; pp. 1–6. [Google Scholar] [CrossRef]
  22. Randhawa, S.; Verma, A.K. Comparative analysis of flat routing protocols in wireless sensor networks: Which one is better? In Proceedings of the 2017 International Conference on Intelligent Computing and Control, Madurai, India, 15–16 June 2017; pp. 1–8. [Google Scholar] [CrossRef]
  23. Mehta, D.; Saxena, S. A Comparative Analysis of Energy Efficient Hierarchical Routing Protocols for Wireless Sensor Networks. In Proceedings of the 4th International Conference on Computer Science, ICCS 2018, Wuxi, China, 11–13 June 2018; pp. 53–58. [Google Scholar] [CrossRef]
  24. Marietta, J.; Mohan, B.C. A Review on Routing in Internet of Things. Wirel. Pers. Commun. 2020, 111, 209–233. [Google Scholar] [CrossRef]
  25. Yoon, S.; Ye, W.; Heidemann, J.; Littlefield, B.; Shahabi, C. SWATS: Wireless sensor networks for steamflood and waterflood pipeline monitoring. IEEE Netw. 2011, 25, 50–56. [Google Scholar] [CrossRef] [Green Version]
  26. Basagni, S.; Petrioli, C.; Petroccia, R.; Spaccini, D. CARP: A Channel-aware routing protocol for underwater acoustic wireless networks. Ad Hoc Netw. 2015, 34, 92–104. [Google Scholar] [CrossRef]
  27. Jawhar, I.; Mohamed, N.; Mohamed, M.M.; Aziz, J. A routing protocol and addressing scheme for oil, gas, and water pipeline monitoring using wireless sensor networks. In Proceedings of the 5th IFIP International Conference on Wireless and Optical Communications Networks, WOCN 2008, Surabaya, Indonesia, 5–7 May 2008. [Google Scholar] [CrossRef]
  28. Stoianov, I.; Nachman, L.; Madden, S.; Tokmouline, T. PIPENETa wireless sensor network for pipeline monitoring. In Proceedings of the Sixth International Symposium on Information Processing in Sensor Networks, IPSN 2007, Cambridge, MA, USA, 25–27 April 2007; pp. 264–273. [Google Scholar] [CrossRef]
  29. Sun, Z.; Wang, P.; Vuran, M.C.; Al-Rodhaan, M.A.; Al-Dhelaan, A.M.; Akyildiz, I.F. MISE-PIPE: Magnetic induction-based wireless sensor networks for underground pipeline monitoring. Ad Hoc Netw. 2011, 9, 218–227. [Google Scholar] [CrossRef]
  30. Sadeghioon, A.M.; Metje, N.; Chapman, D.N.; Anthony, C.J. SmartPipes: Smart wireless sensor networks for leak detection in water pipelines. J. Sens. Actuator Netw. 2014, 3, 64–78. [Google Scholar] [CrossRef]
  31. Kim, J.H.; Sharma, G.; Boudriga, N.; Iyengar, S.S. SPAMMS: A sensor-based pipeline autonomous monitoring and maintenance system. In Proceedings of the 2010 2nd International Conference on COMmunication Systems & NETworkS, COMSNETS 2010, Bangalore, India, 5–9 January 2010. [Google Scholar] [CrossRef]
  32. Saeed, H.; Ali, S.; Rashid, S.; Qaisar, S.; Felemban, E. Reliable monitoring of oil and gas pipelines using wireless sensor network (WSN)—REMONG. In Proceedings of the 9th International Conference on System of Systems Engineering, SoSE 2014, Glenelg, Australia, 9–13 June 2014; pp. 230–235. [Google Scholar] [CrossRef]
  33. Faragó, A. Network topology models for multihop wireless networks. Int. Sch. Res. Not. 2012. [CrossRef] [Green Version]
  34. Marhoon, H.A.; Mahmuddin, M.; Nor, S.A. Chain-based routing protocols in wireless sensor networks: A survey. ARPN J. Eng. Appl. Sci. 2015, 10, 1389–1398. [Google Scholar]
  35. Hadjila, M.; Guyennet, H.; Feham, M. A chain-based routing protocol to maximize the lifetime of wireless sensor networks. Wireless Sensor Network 2013, 5, 116–120. [Google Scholar] [CrossRef] [Green Version]
  36. Taghikhaki, Z.; Meratnia, N.; Havinga, P.J.M. A reliable and energy-efficient chain-cluster based routing protocol for Wireless Sensor Networks. In Proceedings of the 2013 IEEE Eighth International Conference on Intelligent Sensors, Sensor Networks and Information Processing, Singapore, 21–24 April 2013; pp. 248–253. [Google Scholar]
  37. Aslam, M.; Javaid, N.; Rahim, A.; Nazir, U.; Bibi, A.; Khan, Z.A. Survey of extended LEACH-based clustering routing protocols for wireless sensor networks. In Proceedings of the 2012 IEEE 14th International Conference on High Performance Computing and Communication & 2012 IEEE 9th International Conference on Embedded Software and Systems, Liverpool, UK, 25–27 June 2012; pp. 1232–1238. [Google Scholar] [CrossRef] [Green Version]
  38. Kaur, A.; Grover, A. LEACH and Extended LEACH Protocols in Wireless Sensor Network—A Survey. Int. J. Comput. Appl. 2015, 116, 1–5. [Google Scholar] [CrossRef]
  39. Neto, J.H.B.; Rego, A.; Cardoso, A.R.; Celestino, J. MH-LEACH: A distributed algorithm for multi-hop communication in wireless sensor networks. In Proceedings of the 1st ACM conference on Information-centric Networking (ICN 2014), Paris, France, 24–26 September 2014; pp. 55–61. [Google Scholar]
  40. Centelles, R.P.; Freitag, F.; Meseguer, R.; Navarro, L. Beyond the Star of Stars: An Introduction to Multihop and Mesh for LoRa and LoRaWAN. IEEE Pervasive Comput. 2021, 20, 63–72. [Google Scholar] [CrossRef]
  41. Cotrim, J.R.; Kleinschmidt, J.H. LoRaWAN Mesh networks: A review and classification of multihop communication. Sensors 2020, 20, 4273. [Google Scholar] [CrossRef]
  42. Farooq, M.O. Multi-hop communication protocol for LoRa with software-defined networking extension. Internet Things 2021, 14. [Google Scholar] [CrossRef]
  43. Aslam, M.S.; Khan, A.; Atif, A.; Hassan, S.A.; Mahmood, A.; Qureshi, H.K.; Gidlund, M. Exploring Multi-Hop LoRa for Green Smart Cities. IEEE Netw. 2020, 34, 225–231. [Google Scholar] [CrossRef] [Green Version]
  44. Lee, H.C.; Ke, K.H. Monitoring of Large-Area IoT Sensors Using a LoRa Wireless Mesh Network System: Design and Evaluation. IEEE Trans. Instrum. Meas. 2018, 67, 2177–2187. [Google Scholar] [CrossRef]
  45. Mai, D.L.; Kim, M.K. Multi-hop LOra network protocol with minimized latency. Energies 2020, 13, 1368. [Google Scholar] [CrossRef] [Green Version]
  46. Triwidyastuti, Y.; Musayyanah, M.; Ernawati, F.; Affandi, C.D. Multi-hop Communication between LoRa End Devices. Sci. J. Inform. 2020, 7, 125–135. [Google Scholar] [CrossRef]
  47. Abrardo, A.; Pozzebon, A. A multi-hop lora linear sensor network for the monitoring of underground environments: The case of the medieval aqueducts in Siena, Italy. Sensors 2019, 19, 402. [Google Scholar] [CrossRef] [Green Version]
  48. Mikhaylov, K.; Petaejaejaervi, J.; Haenninen, T. Analysis of capacity and scalability of the LoRa low power wide area network technology. In Proceedings of the 22th European Wireless Conference, Lisbon, Portugal, 3–5 July 2016; pp. 1–6. [Google Scholar]
  49. Shirtliff, J.G.; Leid, M. Reliable and Efficient Information Forwarding and Traffic Engineering in Wireless Sensor Networks. In Wireless Sensor Networks and Applications; Springer: Berlin, Germany, 2009; Volume 3. [Google Scholar]
Figure 1. Multi-hop communication scenarios.
Electronics 11 02078 g001
Figure 2. Hierarchical multi-hop communication scenarios.
Electronics 11 02078 g002
Figure 3. The number of bytes/days at different sensor distances (packet size is 255 bytes).
Electronics 11 02078 g003
Figure 4. Energy consumption for nodes 1, 10, and 40—when distance is 200 m.
Electronics 11 02078 g004
Figure 5. Energy consumption for the 50 devices—where the distance is 200 m.
Electronics 11 02078 g005
Figure 6. The total energy consumption in the multi-hop scenarios.
Electronics 11 02078 g006
Figure 7. Energy for temperature and pressure sensors at different distances.
Electronics 11 02078 g007
Figure 8. The number of bytes for temperature and pressure sensors at different distances.
Electronics 11 02078 g008
Figure 9. Energy consumption for different topologies.
Electronics 11 02078 g009
Figure 10. The total energy consumption (for all devices) for different topologies.
Electronics 11 02078 g010
Figure 11. Energy consumption for simple sensors in different topologies.
Electronics 11 02078 g011
Table 1. A Comparison Between Wireless Communication Technologies.
TechnologyTopologyData RateFrequency BandPowerRange
NFCP2P4–8 kbps120–150 kHz50 mA10–20 cm
RFIDP2P40–640 Kbps3.11 GHzN/AUp to 200 m
BluetoothP2P24 Mbps2.4 GHz30 mAUp to 100 m
BLEP2P1 Mbps2.4 GHz15 mAUp to 50 m
ZIGBEEStar-mesh-tree250 kbps2.4 GHz30 mAUp to 100 m
LoRaStar -MeshUp to 50 kbps434–868 MHz12–40 mAUp to 15 km
SigfoxStar100 bps868 MHz45 mAUp to 30 km
DASH7Star-TreeUp to 200 kbps433–868–915 MHz31 mAUp to 5 km
Table 2. WSN Pipeline Leak Detection Systems.
SystemFluid TypePipelineMeasurements TypeWSN Communication TechnologyRouting Type
PIPENETwaterunder-groundhydraulic-acoustic/ vibrationBluetooth Wi-FiSingle-hop
CARPoilunderwaterN/availableN/availableMulti-hop
ROLS [27]water–gas–oilN/availableN/availableZigbee, Bluetooth Cellular, Wi-MaxSingle-hop
SWATSwater-steamabove-groundtemperature pressureLow Power WSN Wi-FiMulti-hop
SPAMMSwaterabove-groundpressureRFIDSingle-hop
MISE- PIPEwater–oilunder-groundtemperature, acoustic pressureN/AvailableMulti-hop
Smart- Pipewaterunder-groundtemperature pressureN/AvailableMulti-hop
RE- MONGoilabove-groundtemperature-pressureZigbeeMulti-hop
Table 3. Comparison of Hierarchical Multi-Hop Routing Protocols.
ProtocolIntra/inter ClusterAdvantageDisadvantage
Chain-based 1Multi-hop/Single-hopLow delayUnbalanced CH energy
Chain-based 2Multi-hop/multi-hopLow delayUnbalanced energy
RFC+Multi-hop/multi-hopReduce the CH consumption energyOverheadNot applicable
Multi-Hop LEACHSingle-hop/multi-hopScalabilityIncrease network traffic
MH-LEACHSingle-hop/multi-hopReduce the transmission energyIncrease network traffic
Table 4. Multi-Hop Communication Scenarios’ Parameters.
Scenario 1Scenario 2Scenario 3
Pipeline length10 km
Communication ScenariosHop-by-hopThe third neighborThe ninth neighbor
Distances (m)1050100150200500105010015020050010501001500200500
Devices100020010067502010002001006750201000200100675020
No. Hops10002001006750203406834231771002010752
Packets1 byte/ 255 bytes
Table 5. Energy consumption specifications.
98 mADrawing current of send mode
66 mADrawing current of receive mode
1 packet each 3 hPackets
1-dayTotal assumed duration
50 NodeNumber of Nodes
Publisher’s Note: MDPI stays neutral with regard to jurisdictional claims in published maps and institutional affiliations.

