Article

Uniform Circular-Array-Based Borehole Pulsed Eddy-Current System for Asymmetry Defect Inspection in Downhole Casings

1
Shaanxi Key Laboratory of Measurement and Control Technology for Oil and Gas Wells, Xi’an Shiyou University, Xi’an 710065, China
2
School of Resources and Environment, University of Electronic Science and Technology of China, Chengdu 611731, China
3
Shengli Oilfield Company, SINOPEC, Dongying 257000, China
*
Authors to whom correspondence should be addressed.
Electronics 2022, 11(13), 2030; https://doi.org/10.3390/electronics11132030
Submission received: 8 May 2022 / Revised: 21 June 2022 / Accepted: 25 June 2022 / Published: 28 June 2022
(This article belongs to the Special Issue Advances in Inspection and Sensing Technologies)

Abstract

:
The inspection of wellbore casings has been extensively investigated owing to the increasing concern for safety in oil and gas production. However, efficient techniques for inspecting asymmetry defects have not been achieved. In this study, we developed a uniform circular array (UCA) to address the problem of borehole pulsed eddy current (PEC) techniques for asymmetry defect inspection in downhole casings. Based on the borehole PEC system model, the UCA developed with multiple independent probes was designed to achieve asymmetry defect inspection, and the three-dimensional magnetic field data of borehole depths, circumferential azimuths, and sampling times could be obtained. Furthermore, a multichannel data acquisition circuit, which guarantees downhole operation at 150 °C, was developed for the synthesized UCA. Using azimuth dimension information from the synthesized UCA at a certain borehole depth, we obtained an inspection approach for the width and penetration depth of asymmetry defects in the circumferential and radial directions, respectively. Simulations and field experiments were conducted, and the results demonstrate the effectiveness of the proposed method in inspecting asymmetry defects.

1. Introduction

Recently, the inspection of wellbore casings has been extensively investigated with an increasing concern for safety in oil and gas production [1,2,3,4]. There are several techniques for detecting and quantifying various defects in wellbore casings. For example, multiple-finger caliper and downhole video can be used to inspect the internal shape of a casing or tubing string [5,6,7]. Acoustic tools accurately assess both the inner and outer surfaces of tubing strings [8]. Electromagnetic (EM) techniques are used to measure properties sensitive to pipe thickness, with wall thinning associated with corrosion and other pipe defects. Various EM methods [9,10,11,12,13,14], including magnetic flux leakage (MFL) [9,10] and eddy current (EC) measurements [11,12], have been reported for pipeline inspections and downhole monitoring. MFL is considered a quasi-DC (magnetostatic) measurement because it employs strong permanent magnets or low-frequency electromagnets to magnetize a section of a pipe string, and EC enables the test by exciting EM waves with rich frequencies that can penetrate metallic pipes and thick insulators. EM technologies can be classified into two primary types, the continuous wave (also known as frequency-domain) and pulsed eddy current (PEC, also known as time-domain) [13,14]. Among these methods, PEC has evolved rapidly and remarkably improved the nondestructive test for downhole casings, especially for quantitatively evaluating of multiple pipe strings in complex wells and for inspecting in challenging environments with any type of wellbore fluid, owing to its excitation, which utilizes short pulses with a high current containing a wideband frequency spectrum.
Various casing-inspection methods based on PEC techniques have been reported [15,16,17,18,19,20,21,22,23]. Numerical methods for calculating the analytical model of PEC for pipelines have been investigated [15,16,17], and the models have been improved for the transient response of a coil system in a cylindrical configuration to improve the calculation efficiency of PEC methods [18,19]. When using such models, time constants can easily be derived from the decay rate of PEC signals to develop methods for thickness measurement, where the quantitative evaluation of up to four concentric pipes can be achieved [20,21,22]. Moreover, some previous studies focused on optimizing the PEC probe design for defect detection and revealed that the level of sensitivity of PEC probes can be improved by optimizing the probe design parameters and using magnetic sensors in place of conventional pickup coils [23,24]. Based on this, considering the limited space and high temperatures, approaches for designing PEC sensors and processing signals have been proposed to improve the performance of borehole PEC systems [25,26,27]. In [25,26], a probe with a single transmitter and multiple receivers was designed, and the array output was weighed to eliminate the influence of transmitting–receiving distance and correct the baseline wander caused by the variation in the temperature and motion measurement. Authors in [27] employed multiple transmitters to realize the magnetic focusing by weighing the current of each transmitter. The above-mentioned methods are effective in inspecting defects in downhole casings assuming a symmetrical PEC model. However, affected by the inhomogeneous pressure distribution of formation, in practice, casing defects usually occur asymmetrically; thus, it is difficult to extract the detailed defect characteristics, such as the orientation, size, and shape, directly from the PEC response.
Currently, only a few attempts have been made to inspect asymmetry defects in downhole casings. Traditionally, longitudinal and transverse PEC probes [28] are combined to inspect corrosion and cracks. Each probe is wound around a ferrite core to obtain a strong magnetic field. Similar to transverse probes, a cylindrical coil whose axis is perpendicular to the borehole axis and coincides with the borehole radius has been investigated [29], and a biorthogonal rectangular probe was used to improve the inspection resolution of the PEC system [30]. In [31], tilted coil antennas were employed to acquire the directional (azimuth) information of wellbore casings, where the directional sensitivity is closely related to the azimuthal angle. In [32], the arbitrary position of sensor coils was investigated theoretically and experimentally, with the coils located as close to the pipe wall as possible to cover their entire circumference. As an alternative, an excitation coil and a pickup coil were installed in a circumferential eccentric rotatable device [33], where an axial scan for the axial location of defects and a circumferential rotating scan for more details of defects were executed. However, a stepper motor is required to rotate the magnetic field, which is complex to implement in downhole environments. To detect all defect orientations without the motor, a three-phase alternating current power source is used to drive the excitation coil to generate a rotating magnetic field [34], where a circular giant magnetoresistance (GMR) sensor array is also employed to enable the identification of defects in both axial and circumferential directions. The use of a GMR sensor array offers a new method for asymmetry defect inspection [34]; however, the number of GMR sensors in traditional circular arrays is limited by the probe size and affects the resolution along the circumferential direction.
In this study, we synthesized a uniform circular array (UCA)-based borehole PEC system for asymmetry defect inspection in downhole casings. Based on the borehole PEC model, we designed a UCA structure synthesized with multiple independent probes and GMR sensors. It has a multichannel data acquisition circuit for 150 °C downhole operations, from which the three-dimensional (3D) dataset of borehole depths, circumferential azimuths, and sampling times can be obtained. Moreover, by using azimuth-time data of the synthesized UCA, we propose an inspection approach for the width and penetration depth (PD) of asymmetry defects in the circumferential and radial directions, respectively, at a certain borehole depth, where the shapes of the defects can be further determined. To verify the effectiveness and accuracy of the proposed method, we applied it to an oil borehole PEC system to inspect the oil-well casing.
The rest of this paper is organized as follows. The borehole PEC model with an asymmetric defect is presented in Section 2. In Section 3, a synthesized UCA-based borehole PEC system is designed, the corresponding borehole PEC circuits for UCA are presented, and the 3D dataset is analyzed. The shape inspection method for asymmetry defects in downhole casings is analyzed in Section 4. The experimental results are discussed in Section 5. Finally, the paper is concluded in Section 6.

2. Borehole PEC Model

Consider a borehole PEC system equipped with transmitting coils wound around a soft magnetic core in a cylindrical layered medium, where the magnetic core and the transmitting coils are the innermost and second layers with radii of r1 and r2, respectively, and the center of the transmitting coils coincides with the borehole axis. All other layers with radii of r3 to r7, including the air, tool housing, well liquid, casing, and formation, are located outside the transmitting coils (Figure 1). Actually, the effect of well liquid can be ignored in the process of the casing inspection by considering the large conductivities difference. Due to the harsh downhole environment, different types of defects, such as holes, cracks, and erosion, may appear on the wellbore casings, and most of them are asymmetric. For example, we assume that a hole-type defect exists in the casing, whose center in the borehole direction is approximately at z = 0, and the normal direction is toward the positive direction of the x-axis. Figure 1a shows a schematic of the borehole PEC model with such a hole defect.
As shown in Figure 1a, considering that erosion usually occurs from the outer to the inner wall of downhole casings due to the high formation pressure, we assume that the thickness of the wall decreases outside the casing. Considering the cross-section of the model at z = 0 (Figure 1b), the shape of the hole-type defect can be described by a quadrilateral ABCD with intersection points of the defect and the casing marked as A, B, C, and D. Herein, for simplicity, we assume AB = CD and AD = BC. Notably, for other types of asymmetry defects, such as cracks and irregular shapes, even though the 3D shapes are different, the cross-section can also be represented as in Figure 1b. In general, we use the lengths AB and AD to represent the width and PD in the circumferential and radial directions, respectively. The shape of the asymmetry defect at a certain depth can be represented by the width and PD in the circumferential and radial directions, respectively.
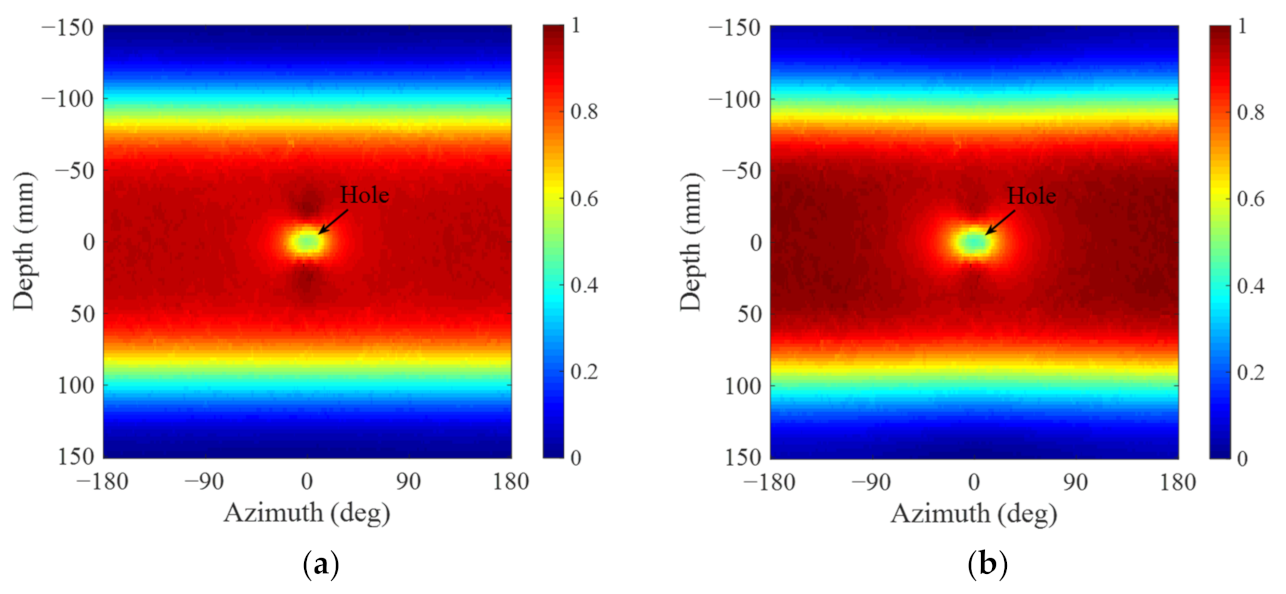
To further investigate the inspection of asymmetry defects, we conducted simulations using the magnetic module of COMSOL 5.5 to calculate the magnetic flux density (MFD) distribution of the borehole PEC model with AB = 20 mm and AC = 4.585 mm (50% of the casing thickness), and the number of turns of the transmitting coils was set to 1000. The parameters were set as follows: r1 = 12 mm, r2 = 13 mm, r3 = 17.25 mm, r4 = 21.5 mm, r5 = 60.68 mm, r6 = 69.85 mm, r7 = 90 mm, h1 = h2 = 150 mm, h3 = h4 = h5 = h6 = h7 = 300 mm, where h1 to h7 denote the heights from the innermost to the outmost layer, respectively. With the parameters of the transmitting coils above, a maximum size of 7-inch casing (the outer diameter of 177.8 mm) can be inspected effectively. If a larger casing needs to be inspected, it is necessary to increase the radius and the length of the transmitting coils, which will substantially increase the outer diameter of the borehole PEC system. Notably, the size of the borehole PEC system is restricted by the physical limitations of the downhole conditions and will have influence on the inspection performance. Given a ramp signal with a transmitting current of 0.5 A and a turn-off time of 30 μs, the secondary magnetic field can be obtained after turning off the excitation, with which the nondestructive testing of downhole casings can be realized [1]. Taking MFDs on the cylindrical surface with r = 15 mm as examples, the depth-azimuth images of the normalized MFD with azimuth from −180° to 180° at sampling times of 10 ms (early time) and 20 ms (late time) are shown in Figure 2a and Figure 2b, respectively, where the horizontal axis denotes the circumferential azimuths, and the vertical axis represents the borehole (longitudinal) depth of the PEC model.
As shown in Figure 2a,b, the depth-azimuth images of normalized MFDs vary with the sampling time due to the broad frequency range [13,14] of the PEC system. The MFD shape of the defect becomes larger from the sampling time of 10 to 20 ms due to the diffusion of the eddy-current field. Although this offers more information for the inspection of asymmetry defects to determine the width and PD in the circumferential and radial directions, respectively, it is difficult to implement such an inspection system. Specifically, to obtain a high-resolution depth-azimuth image (Figure 2), a very large and complex cylindrical magnetic observation array for different depths and azimuths around the transmitter in Figure 1a is required, which is difficult to realize in practice due to the narrow underground confined space.

3. Synthesized UCA-Based Asymmetry Defect Inspection in Metal Casings

As mentioned in Section 2, based on the PEC signals for different depths and sampling times, asymmetry defects can be inspected by acquiring the azimuth information of downhole casings. However, limited to the downhole space, in practice, it is difficult to obtain the cylinder array data shown in Figure 2. In this section, considering the motion of the PEC system during casing inspections, we develop a synthesized UCA by employing the motion measurement for the inspection of asymmetry defects.

3.1. Synthesized UCA-Based Borehole PEC System

Considering a regular cased-hole logging tool with an outside diameter of 43 mm, its actual inner diameter is only 34.5 mm, and the thickness of the tool housing is 4.25 mm. To reduce the size of the PEC system, we used a miniature GMR sensor AAH002-02 from Nonvolatile Electronics [34] as the receiver. Even though the GMR sensor is small enough (6.2 mm × 5 mm × 1.3 mm), no more than 10 GMR sensors can be uniformly installed in such a limited space to form a circular array, which can offer at most 36° of azimuth resolution. Besides the cylinder array, it is difficult to design a high-resolution circular array for asymmetry defect inspection. To overcome this challenge, we developed a synthesized UCA for motion measurements instead of using a cylinder array. The structure of the synthesized array is shown in Figure 3.
Based on the structure in Figure 3, multiple independent probes can be utilized in the PEC system. Taking four probes as examples, each probe is composed of one transmitter and eight GMR sensors. Similar to the case described in Section 2, the transmitting coils are wound around a magnetic core. As an alternative, eight GMR sensors are uniformly distributed on the circle with a radius of 15 mm in the longitudinal center of the transmitter. The parameters of the magnetic core and transmitter in Figure 3 are the same as those in Figure 2.
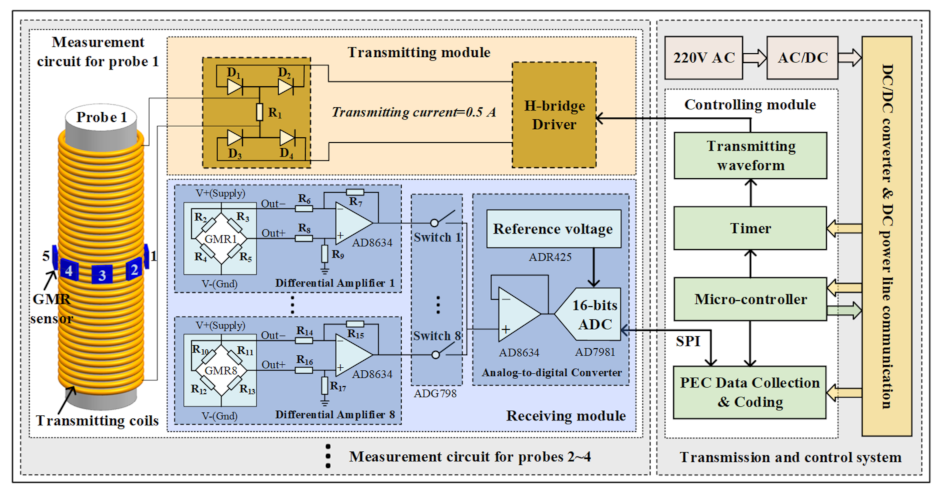
As shown in Figure 3, four probes are installed with an azimuth interval of 11.25° such that the normal directions of the first sensor of each probe (with indexes of 1, 9, 17, and 25) become 0°, 11.25°, 22.5°, and 33.75°, respectively. To avoid mutual electromagnetic interferences, we set a center spacing of Δz = 40 cm between two adjacent probes, and the corresponding differences in the longitudinal depths are compensated for different probes. Then, UCA with 32 GMR sensors and azimuth resolution of 11.25° could be synthesized, which can be used to inspect asymmetry defects in downhole casings. Notably, the resistance, number of turns, and transmitting signals of the four transmitters must be identical to ensure consistency in the synthesized array signals. Based on the synthesized UCA structure, high-temperature borehole PEC circuits, which guarantee operations at temperatures up to 150 ℃, are shown in Figure 4.
As shown in Figure 4, the borehole PEC circuits are designed to realize the acquisition, transmission, and processing of the received signal of the synthesized UCA for asymmetry defect inspection. Specifically, the borehole PEC circuits for each probe comprise an excitation circuit and a multi-channel receiving circuit for eight GMR sensors. At the transmitting end, to avoid mutual electromagnetic interference in the case of individual excitation of each probe, the four probes are excited simultaneously, and a direct-current (DC)/DC converter with at least 20 W is required. At the receiving end, we employ an 8-1 switcher (ADG798) for each probe to realize the multi-channel acquisition, and four pieces of AD8634 corresponding to eight differential amplifiers are used for signal conditioning. Then, a high-speed analog-to-digital converter (AD7981) is used to sample the PEC responses of different sensors at different sampling times. Finally, the sampled data of the synthesized UCA are collected and sent to the surface system through a power-line communication system using a digital signal controller.

3.2. 3D Dataset of the Borehole PEC Array

Based on the synthesized UCA model described in Section 3.1, we assume that the MFD measured by each GMR sensor is discretely sampled with a sampling length L. We also assume that the number of probes and GMR sensors for each probe is K and M, respectively. Then, the MFD collected by the kth probe of the synthesized UCA with a borehole depth z1 + (k − 1)Δz can be expressed as
B k t l , z 1 + ( k 1 ) Δ z = B k t l , z 1 + ( k 1 ) Δ z B k + K t l , z 1 + ( k 1 ) Δ z B k + ( M 1 ) K t l , z 1 + ( k 1 ) Δ z M × 1
where z1 + (k − 1)Δz denotes the longitudinal center depth of the kth probe, tl the sampling time of the kth probe, and Bk+(m−1)K the MFD of k + (m − 1)Kth GMR sensor of the synthesized UCA. By compensating the center spacing of Δz, UCA with KM GMR sensors can be synthesized, in which all the probes would be corrected to have the same borehole depth of z1. Then, the MFD of the synthesized UCA with a borehole depth z1 can be expressed as
B t l , z 1 = B 1 T t l , z 1 B 2 T t l , z 1 B K T t , z 1 K M × 1 T
We can observe that by rearranging Equation (2), it is equivalent to the receiving signal using KM GMR sensors in only one probe, which can make the azimuth resolution of the PEC system reach 360/KM degrees (11.25° herein). In the case of motion measurements, the array output for all depths can be obtained by staking Equation (2), such that
B = B t 1 , z 1 B t 1 , z 2 B t 1 , z D B t 2 , z 1 B t 2 , z 2 B t 2 , z D B t L , z 1 B t L , z 2 B t L , z D K M × L × D
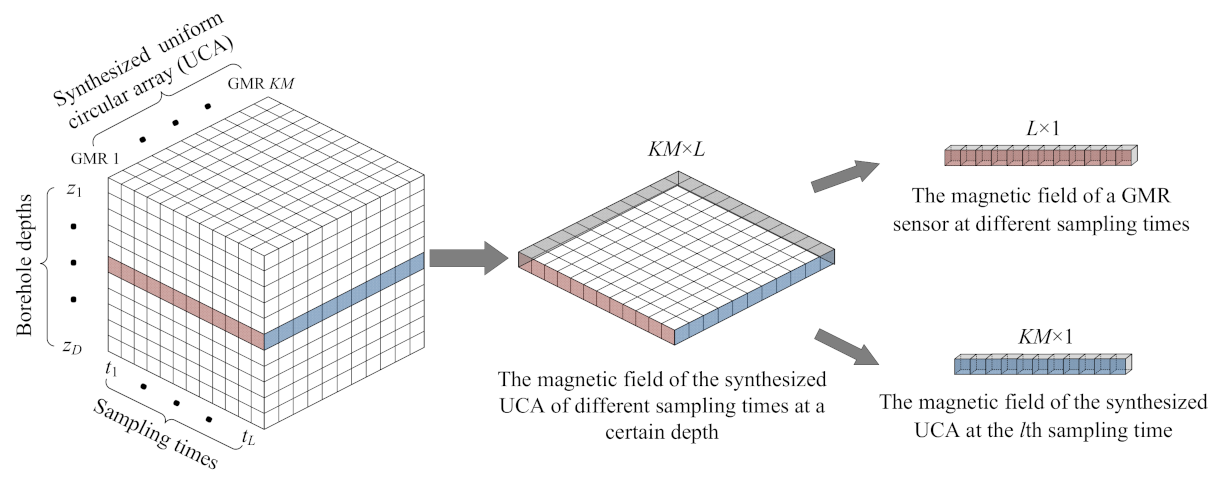
where the moving depth of the first probe along the borehole axis ranges from z1 to zD. Equation (3) shows that the MFD of the synthesized UCA would form a 3D data structure in the case of motion measurements, as shown in Figure 5. The three axes represent the receiving signals of KM GMR sensors (corresponding to KM discrete azimuths), L sampling times, and D depths.
Figure 5 shows that, for asymmetry defect inspection in downhole casings, the synthesized UCA in motion measurements can achieve a similar 3D dataset of azimuths, longitudinal depths, and sampling times compared with those of the cylinder array in Figure 2. However, since the 3D data are obtained depth by depth independently by moving the probes, the large radiation range of the excitation probe distorts the inspected shape of asymmetry defects along the borehole axis. Herein, we focus on determining the shape of asymmetry defects at a certain borehole depth based on the width and PD in the circumferential and radial directions, respectively; we shall investigate the determination of the longitudinal shape in our future studies.

4. Asymmetry Defect Inspection Using Azimuth-Time Data of the Synthesized UCA

By introducing the azimuth dimension information using the synthesized UCA, as described in Section 3, the traditional time dimension data of the PEC system can be expanded into azimuth-time dimensions so that the shape and location of asymmetric defects can be determined. In this section, based on the synthesized UCA, we use azimuth-time dimension data to determine the width and PD of asymmetry defects in the circumferential and radial directions, respectively, at a certain borehole depth.
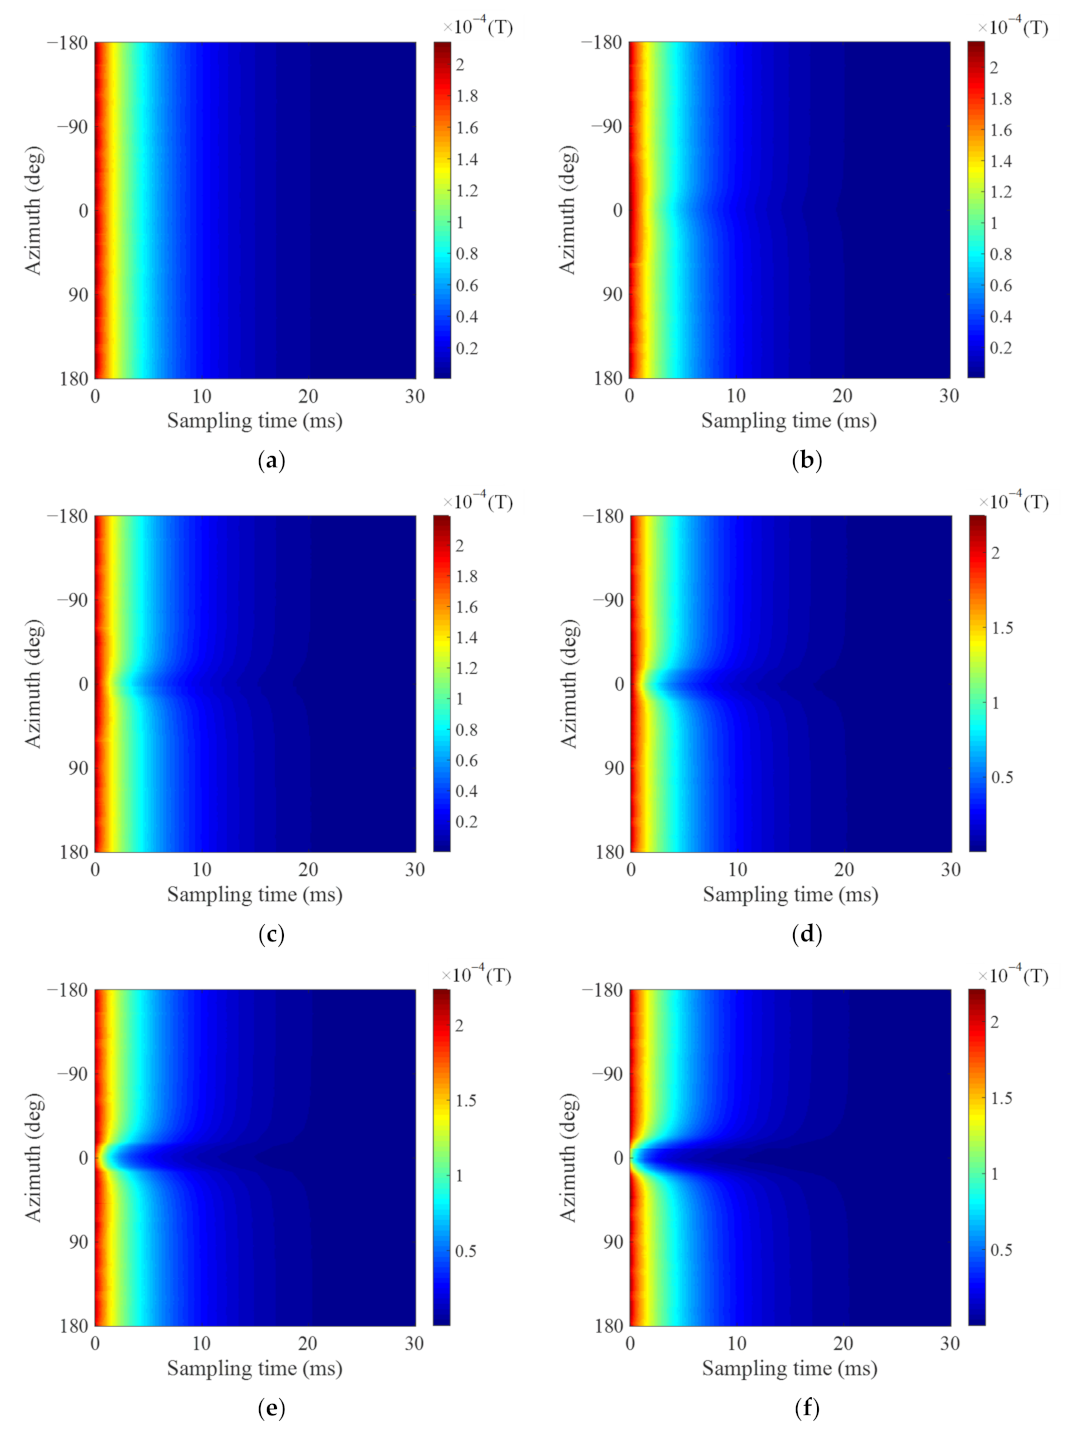
Based on the simulation results of the borehole PEC model in Section 2, we extend the simulation to six different cases. Each case is simulated with the same hole radius but different PDs in the radial direction, including 0% (no defect), 20% (1.834 mm), 40% (3.668 mm), 60% (5.502 mm), 80% (7.336 mm), and 100% (9.17 mm) of the casing thickness of 9.17 mm. Similar to Section 2, we analyzed the MFDs on the circle with a radius of 15 mm at z = 0. The azimuth-time images of MFD with different PDs are shown in Figure 6a–f.
A null exists at the same position of azimuth-time images of MFD for all PDs, and its shape differs with different PDs; thus, the shape and position of asymmetry defects of downhole casings can be determined. Moreover, the values of MFD at different sampling times show typical time-decay trend due to the diffusion of the eddy-current field. In the radial direction, to obtain the PDs of hole defects, we analyze the original azimuth dimension curves at observation times of 10 and 20 ms, as shown in Figure 7a and Figure 7b, respectively.
The amplitude of the null in the original MFD curves at the center (0 degrees) is inversely proportional to the PDs of the defects. Moreover, due to the time-decay characteristic of the PEC system, the MFD curves decrease with an increase in the observation time. Notably, for the above PD identification, the center position of the defect must be determined first. However, in practice, the information in this position may not be accurately obtained. For example, the azimuth interval of the 32 elements of the borehole PEC system described in Section 3 is 11.25°. When the defect center is located at the middle azimuth of the two sensors, the obtained orientation has a maximum error of 11.25/2° from the actual defect center, which introduces some error to the determined PDs of asymmetric defects. The effectiveness and performance of the proposed synthesized UCA with azimuth errors are verified and discussed in the following section.
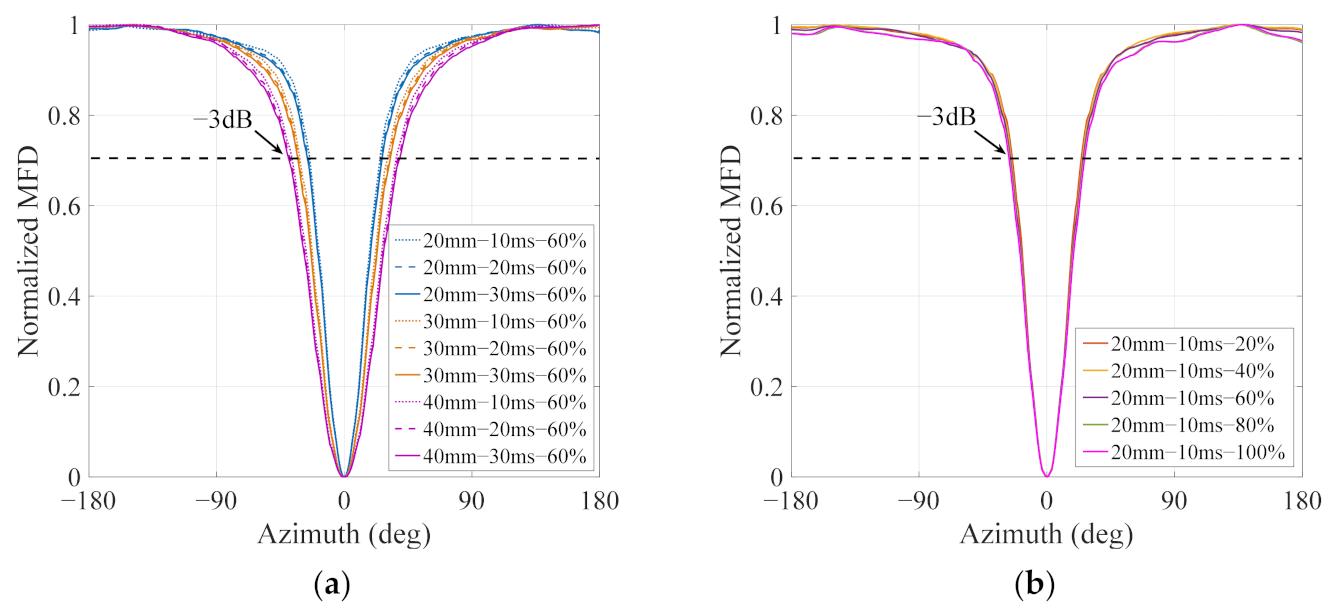
In the circumferential direction, to further determine the widths of the asymmetric defects of downhole casings, we analyze the normalized azimuth dimension curves for different sampling times and PDs (Figure 6). Considering the PD of 60% casing thickness, Figure 8a compares the normalized azimuth dimension curves for three kinds of hole defects with widths (AB) of 20, 30, and 40 mm, respectively, at different sampling times of 10, 20, and 30 ms. Figure 8b shows the normalized azimuth dimension curves of all PDs for the 20-mm hole defect at a sampling time of 10 ms.
The null widths of the azimuth curves are proportional to the widths of the hole defects in the circumferential direction (Figure 8a). Thus, we can use the null width (−3 dB width for example) to calibrate the width of an asymmetry defect. Moreover, although the null widths for the late observation times and large perpetration depths are wider than those of the early observation times and small PDs for each hole defect, the difference is negligible when an azimuth interval of only 11.25° of the adjacent GMR sensors of the synthesized UCA is considered.

5. Simulations and Experiments

The validity of the proposed synthesized UCA was confirmed by both indoor and field experiments. A standard 5.5-inch casing with a thickness of 9.17 mm was used for the experiments. For the indoor experiments, a casing with five kinds of asymmetry hole-type defects was inspected. To investigate the effect of the synthesized UCA, field experiments were conducted in a production oil well in Shengli Oilfield, China. The parameters for the indoor and field experiments are the same as those used for the simulations in the previous sections. Figure 9a shows the 8-element UCA structure of one of the four probes described in our simulations and experiments, and Figure 9b and Figure 9c show the corresponding data acquisition and transmitting and receiving circuits of the probe, respectively.
Each of the four probes has one transmitter and eight GMR sensors. The transmitting coils are wound around a magnetic core, and eight GMR sensors are uniformly installed on the circle with a radius of 15 mm in the longitudinal center of the transmitter. The four probes are installed with an included angle of 11.25° to form a synthesized UCA with 32 GMR sensors, as shown in Figure 3.

5.1. Indoor Experiments

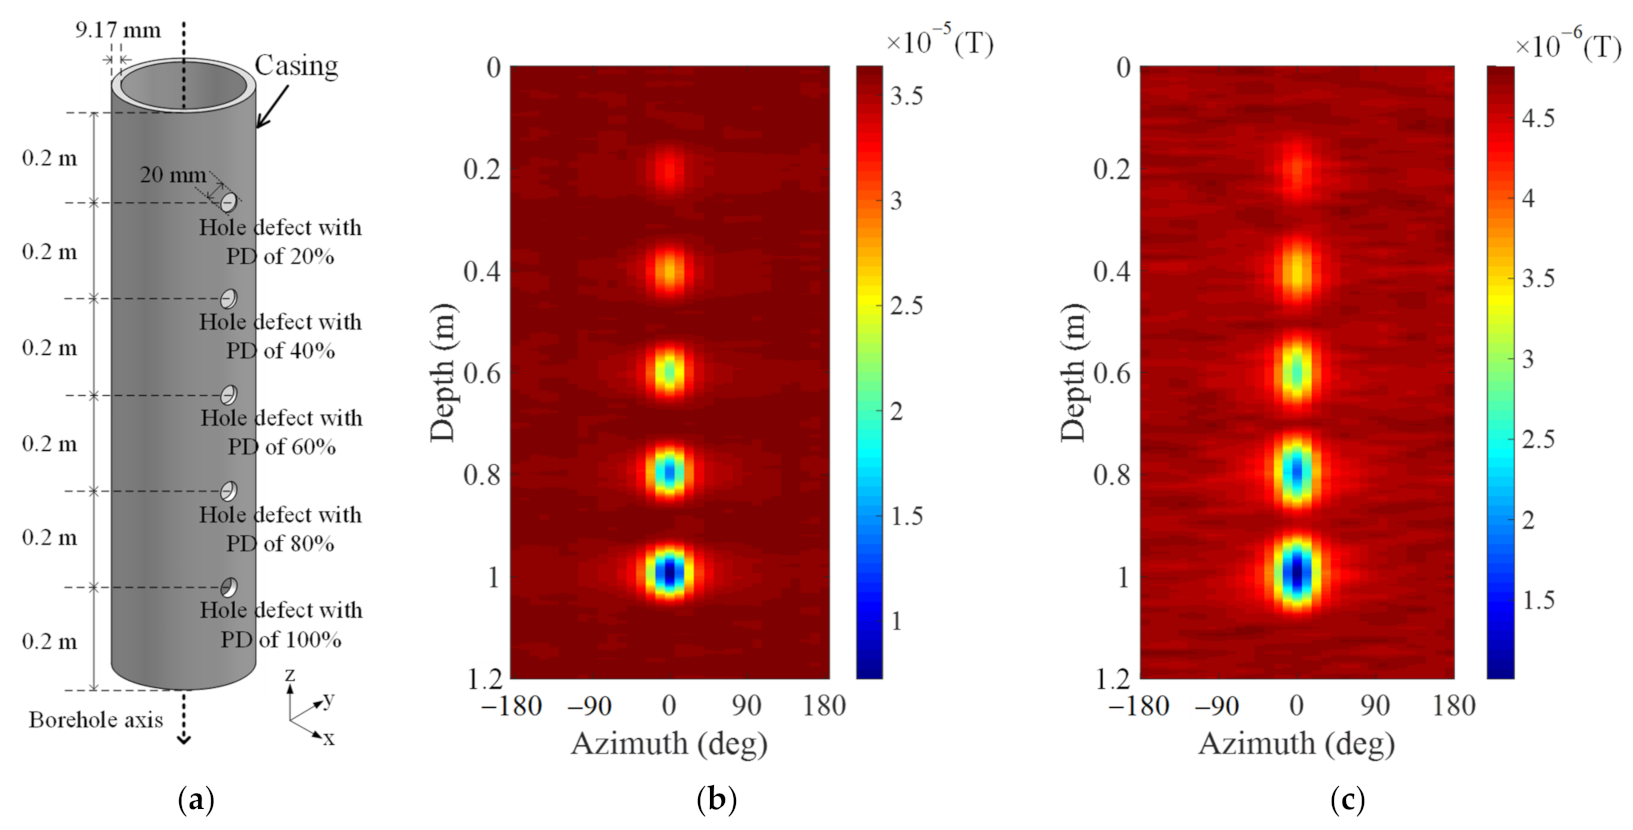
To provide more details of the proposed method, we conducted indoor experiments on five kinds of asymmetry hole-type defects for five PDs (20%, 40%, 60%, 80%, and 100%) of casing thicknesses. For convenience, we set all the defects on the same side of the casing to make the normal direction of the defects the same as that of the first GMR sensor of the synthesized UCA (0 degrees), as shown in Figure 10a. In our experiments, the period of the PEC system and the motion velocity were set to 200 ms and 10 cm/s, respectively, and the influence of the motion effect was ignored because of the low velocity. Using the synthesized UCA of the borehole PEC system in Section 3, MFD at each borehole depth was obtained after compensating for the center spacing of each probe. The experimental results after canceling the magnetostatic field of the downhole casing at early and late sampling times of 10 and 20 ms are shown in Figure 10b and Figure 10c, respectively. The horizontal axis denotes the discrete azimuths for the GMR sensor index of the synthesized UCA.
By introducing the azimuth dimension information using the synthesized UCA, five ‘nulls’, which correspond to the hole defects with different PDs, are observed at both sampling times of 10 and 20 ms. The received signals of the 32 GMR sensors of the synthesized UCA differ as they are in different azimuths with respect to the asymmetry defects. At the sampling time of 10 ms, the inspection results for the five defects are more distinguishable than those obtained at 20 ms. Although the widths of the nulls are proportional to PD in the radial direction of the hole defects, their −3 dB width changed slightly with both PD and sampling time, as shown in Section 4. For comparison, we considered the depths corresponding to the center of each null and used the azimuth dimension data of the synthesized UCA at 10 and 20 ms to further illustrate the circumferential and radial information of the hole defects, as shown in Figure 11.
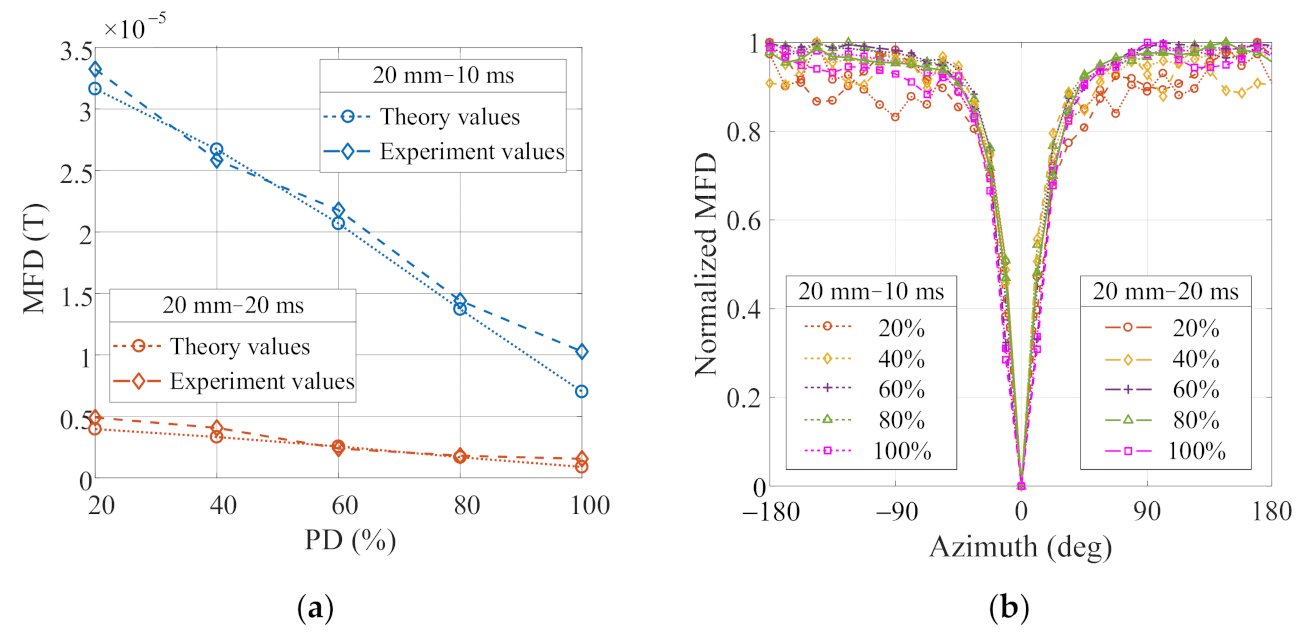
Figure 11a shows the center values of the null of the theoretical and experimental MFDs, and Figure 11b shows the normalized MFDs of the synthesized UCA for hole defects with different PDs at different sampling times with borehole depths of 0.2, 0.4, 0.6, 0.8, and 1.0 m. The measured values of the null center for different PDs are close to the theoretical values, and there are ‘nulls’ in the same position as the normalized MFDs for asymmetry defects with different PDs, which are consistent with the casing structures. Notably, although the measured signals of the synthesized UCA are distorted and much coarser than the simulated results due to the limited number of GMR sensors and system noise, the PDs of the different hole defects can still be effectively distinguished by the ‘nulls’. On the one hand, with an increase in PD in the radial direction of the hole defects, the MFD of the center of nulls decreases monotonically regardless of the sampling times. On the other hand, using the calibration for the width of the asymmetry defects described in Section 4, the range of the inspected width ranges from 23.7 to 24.4 mm, and the differences between different PDs and sampling times are negligible.
Considering that, in practice, the normal direction of the first GMR sensor may not align with that of the hole center, we compare the inspection results for several hole-type defects with different included angles between the normal direction of the defects and the first GMR sensor of the synthesized UCA. Since the included angle of each pair of adjacent elements is 11.25°, the maximum included angle was set to 5.625°, and the results are shown in Figure 12. System noise was ignored to obtain the theory value.
Figure 12a and Figure 12b show the average errors in the inspection results for the widths and PDs with included angles in all sampling times, respectively, with reference to the case where the normal direction of the hole defect coincides with the first GMR sensor. The vertical axes in Figure 12a and Figure 12b represent the errors of the widths and PDs for various hole defects with different radii and PDs, respectively. There are some errors in the inspection results when the normal direction of the first GMR sensor is not aligned with that of the hole, and the errors are proportional to the included angles for both the width and PD. With the same included angles, the errors of PD increase monotonically with the actual PD, whereas the errors of the width decrease monotonically with the actual defect width. The errors for the case with a PD of 100% and 20-mm width are the highest.

5.2. Field Experiment Discussion

To further verify the effectiveness of the proposed method, we conducted field experiments in an oil well in Shengli Oilfield, Dongying, China. The outer and inner diameters of the inspected casing are 139.7 and 121.36 mm, respectively. Before the inspection, there were leakage points in the wellbore casing, and the leakage depths range from 65.5 to 67.6 m and 86.4 to 89.9 m. The detailed shapes of the defects were unknown. After the inspection, we used a cutting tool to cut out the casing from 0–100 m in the well to verify the inspection performance of the synthesized UCA-based PEC system.
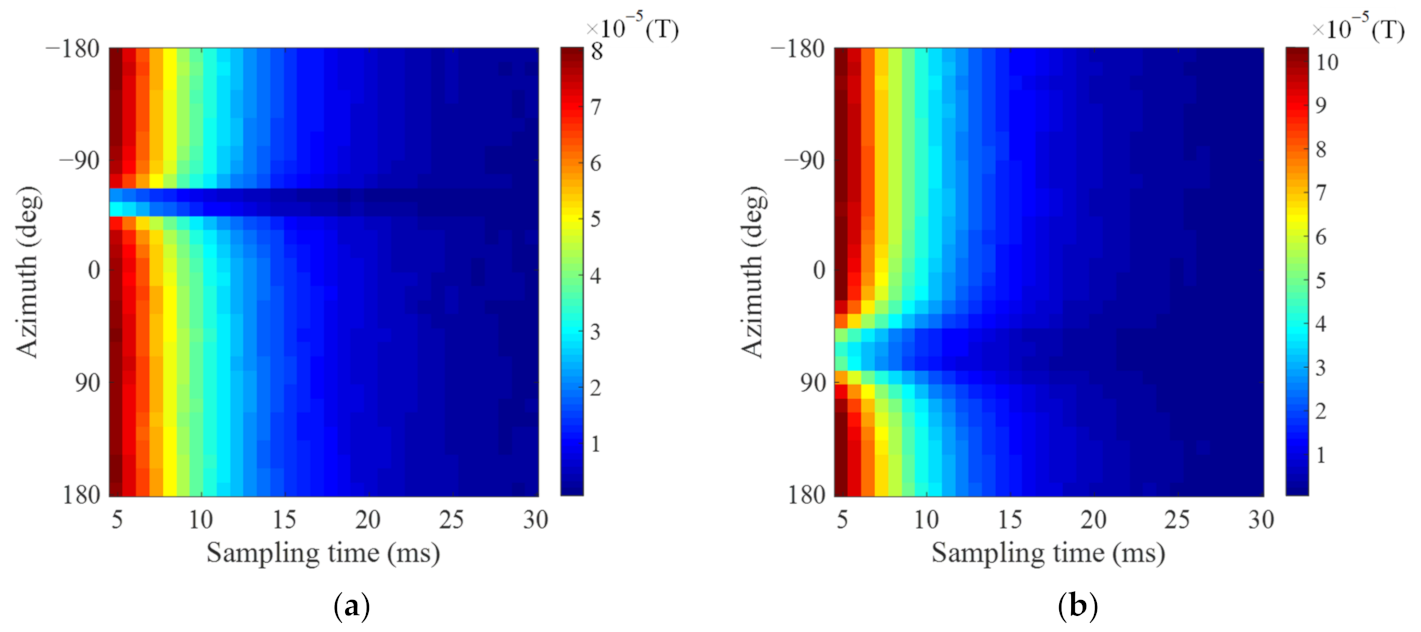
During the experiments, we first compensated for the depth of the original signals near the defects and then inspected the shape of the defects at each measurement depth by analyzing the azimuth-time images of the MFD of the synthesized UCA. The defect shape was determined using the width in the circumferential direction and PD in the radial direction of the downhole casing. The inspection results for two asymmetry defects at borehole depths of 66.5 and 88.7 m are shown in Figure 13a and Figure 13b, respectively. The included angles between the normal direction of the defect and the first GMR sensor were unknown during the downhole measurement, which may introduce some errors to the inspection results.
Figure 13a and Figure 13b show azimuth-time images at borehole depths of 66.5 and 88.7 m, respectively, obtained using the synthesized UCA-based borehole PEC method. Figure 14a shows the inspected PDs for two asymmetry defects at different sampling times, and Figure 14b shows the normalized azimuth dimension curves at a sampling time of 10 ms. From Figure 14a,b, we infer that the casing was penetrated at the two points since the PDs of the two asymmetry defects were penetrated for almost all the sampling times. The −3 dB widths of the two asymmetry defects using the calibration method described in Section 4 correspond to the widths of 14.3 and 34.5 mm, respectively (Figure 14b). Figure 15 shows the actual shapes of two asymmetry defects at borehole depths of 66.5 and 88.7 m after taking out the casing. The measurement velocity in the field experiment was set to 600 m/h. The actual width of the first asymmetry defect is 12 mm, whereas that of the second asymmetry defect is 28 mm due to its unpenetrated area and irregular shape.
The two asymmetric defects correspond to two leakage points in the wellbore casing, indicating that they all penetrate the inner and outer walls of the casing with PDs of 100%. The first defect in the casing is an almost circular hole with a smooth edge, whereas the second defect looks more like a crack with irregular and uneven edges. The inspected shapes are comparable to the actual shapes at a certain depth (Figure 14 and Figure 15), and the largest error of the width in the circumferential direction is 6.5 mm, as shown in Figure 14b. The inspection error in Figure 14b is higher than that of the first asymmetry defect in Figure 14a, which is attributed to the unpenetrated area and irregular shape. In general, the shape of the single asymmetry defect of the downhole casing can be accurately inspected using the synthesized UCA-based PEC system with the measurement velocity of about 600 m/h. However, there could be multiple asymmetry defects at the same depth in some of the field experiments. At present, there are still great errors in the inspection of multiple defects at the same depth. There is a need for further studies on asymmetric defect inspection.

6. Conclusions

In this study, we synthesized a UCA-based borehole PEC system for inspecting the shape of asymmetry defects of downhole casings. Based on the MFD distribution of the borehole PEC model with an asymmetry defect, we designed a UCA structure synthesized using multiple independent probes with multiple GMR sensors and a multichannel data acquisition circuit for inspection during high-temperature downhole operations (150 °C). Using the synthesized UCA, the 3D dataset of borehole depths, circumferential azimuths, and sampling times can be obtained. Moreover, by employing the azimuth dimension information of the synthesized UCA, we developed a shape inspection approach to determine the width and PD of asymmetry defects in the circumferential and radial directions of downhole casings, respectively. Simulations and experiments on standardized oil-well casings with asymmetry defects demonstrated the effectiveness of the proposed system.

Author Contributions

Conceptualization, Z.R.; data curation, J.D.; formal analysis, Y.Z.; funding acquisition, B.D.; investigation, L.Y.; methodology, R.D.; project administration, B.D.; resources, Z.R.; software, C.L.; validation, B.A.; writing—original draft, L.Y.; writing—review and editing, L.Y. All authors have read and agreed to the published version of the manuscript.

Funding

This work was supported in part by the National Natural Science Foundation of China under Grant 51974250 and Grant 41874158, in part by the Youth Science and Technology Nova Project in Shaanxi Province, China, under Grant 2020KJXX-018 and in part by the Postgraduate Innovation and Practical Ability Training Program of Xi’an Shiyou University under Grant YCS22111001.

Institutional Review Board Statement

Not applicable.

Informed Consent Statement

Not applicable.

Data Availability Statement

All the details of this work, including data and algorithm codes, are available by contacting the corresponding author: [email protected].

Acknowledgments

The authors would like to thank the reviewers for their helpful suggestions, which have considerably improved the quality of the manuscript.

Conflicts of Interest

The authors declare no conflict of interest.

References

  1. Brill, T.M.; Shaposhnikov, P.; Valstar, D.; Singh, K. Well integrity evaluation using acoustic and electromagnetic measurements. Lead. Edge 2022, 41, 122–133. [Google Scholar] [CrossRef]
  2. Salem, A.M.; Yakoot, M.S.; Mahmoud, O. Addressing Diverse Petroleum Industry Problems Using Machine Learning Techniques: Literary Methodology—Spotlight on Predicting Well Integrity Failures. ACS Omega 2022, 7, 2504–2519. [Google Scholar] [CrossRef] [PubMed]
  3. Zhu, P.; Li, Z.; Chen, M.; Dong, Y. Study on forward and inversion modeling of array laterolog logging in a horizontal/highly deviated well. Acta Geophys. 2019, 67, 1307–1318. [Google Scholar] [CrossRef]
  4. Wilt, M.J.; Um, E.S.; Nichols, E.; Weiss, C.J.; Maclennan, K. Casing Integrity Mapping using Top-Casing Electrodes and Surface Based Electromagnetic Fields. Geophysics 2019, 85, 1–51. [Google Scholar] [CrossRef]
  5. Ewy, R.T. Well Shear Associated with Conventional and Unconventional Operations: Diagnosis and Mechanisms. SPE Drill. Completion 2021, 36, 427–444. [Google Scholar] [CrossRef]
  6. Liu, Y.; Xing, X.; Wang, Y.; Xu, W.; Liu, K.; Lv, Y. Application of Downhole Camera Technology in Fault Diagnosis of Coalbed Methane Wells. J. Phys. Conf. Ser. 2021, 1894, 012046. [Google Scholar]
  7. Ashby, S.; Al-Shamrani, S.; Hansen, J.; Almutairi, T.; AI-Mulhim, A. Coiled tubing conveyed video camera and multi-arm caliper liner damage diagnostics post plug and perf frac. In Proceedings of the SPE Milddle East Oil & Gas, Manama, Bahrain, 8–11 March 2015. [Google Scholar] [CrossRef]
  8. Gao, X.; Shi, Y.; Zhu, Q.; Li, Z.; Zhang, W. Domain Adaptation in Intelligent Ultrasonic Logging Tool: From Microseismic to Pulse-Echo. IEEE Trans. Instrum. Meas. 2021, 70, 2505014. [Google Scholar] [CrossRef]
  9. Um, E.S.; Commer, M.; Newman, G.A.; Hoversten, G.M.M. Finite element modelling of transient electromagnetic fields near steel-cased wells. Geophys. J. Int. 2015, 202, 901–913. [Google Scholar] [CrossRef] [Green Version]
  10. Rourke, M.; Jin, Y.; Dong, Q. Algorithm development and case study for a 1-11/16 pulsed eddy current casing inspection tool. In Proceedings of the SPWLA 55th Annual Logging Symposium, Abu Dhabi, United Arab Emirates, 18–22 May 2014. [Google Scholar]
  11. Le, M.; Wang, D.; Luong, V.S.; Lee, J.; Joo, S.H. Cylinder-type magnetic cameras and their coverage performance evaluation for inspection of heat exchanger tubes. J. Inst. 2020, 15, P12031. [Google Scholar] [CrossRef]
  12. Zeghlache, M.L.; Noui-Mehidi, M.; Rourke, M.; Ismail, M. Enhanced time domain EM technology for multiple casing corrosion monitoring. In Proceedings of the Abu Dhabi International Petroleum Exhibition, Abu Dhabi, United Arab Emirates, 9 November 2020. [Google Scholar]
  13. Jawed, R.; Maheshwari, K.; Jamali, J.; Rourke, M. Through tubing casing break detection: An EM thickness tool application. In Proceedings of the SPE Canada Heavy Oil Conference, Calgary, AB, Canada, 29 September–2 October 2020. [Google Scholar]
  14. Wang, C.; Wu, S.; Xin, J.; He, R.; Wang, D. Numerical simulation of oil and gas pipeline crack detection based on pulsed eddy current testing technology. In Proceedings of the 4th International Conference on Electron Device and Mechanical Engineering (ICEDME), Guangzhou, China, 19–21 March 2021. [Google Scholar] [CrossRef]
  15. Akbari-Khezri, A.; Sadeghi, S.H.H.; Moini, R.; Sharifi, M. An Efficient Modeling Technique for Analysis of AC Field Measurement Probe Output Signals to Improve Crack Detection and Sizing in Cylindrical Metallic Structures. J. Nondestr. Eval. 2016, 35, 9. [Google Scholar] [CrossRef]
  16. Bowler, J.R.; Theodoulidis, T. Boundary Element Calculation of Eddy Currents in Cylindrical Structures Containing Cracks. IEEE Trans. Magn. 2009, 45, 1012–1015. [Google Scholar] [CrossRef]
  17. Kozhevnikov, N.O.; Antonov, E.Y.; Kamnev, Y.K.; Olenchenko, V.V.; Plotnikov, A.E.; Stefanenko, S.M.; Shein, A.N. Effects of borehole casing on TEM response. Russ. Geol. Geophys. 2014, 55, 1333–1339. [Google Scholar] [CrossRef]
  18. Xue, Z.A.; Fan, M.B.; Cao, B.H.; Wen, D.D. A fast numerical method for the analytical model of pulsed eddy current for pipelines. Insight—Non-Destr. Test. Cond. Monit. 2020, 62, 27–33. [Google Scholar] [CrossRef]
  19. Theodoulidis, T.; Skarlatos, A. Efficient calculation of transient eddy current response from multi-layer cylindrical conductive media. Phil. Trans. R. Soc. A 2020, 378, 20190588. [Google Scholar] [CrossRef]
  20. Ulapane, N.; Thiyagarajan, K.; Hunt, D.; Miro, J.V. Quantifying the Relative Thickness of Conductive Ferromagnetic Materials Using Detector Coil-Based Pulsed Eddy Current Sensors. J. Vis. Exp. 2020, 155, e59618. [Google Scholar] [CrossRef] [PubMed]
  21. Dutta, S.; Iqbal, P.; Olaiya, J.; Hughes, B. Multi-sensor time-domain electromagnetic measurements for quantitative evaluation of multi-barrier corrosion. In Proceedings of the SPE Asia Pacific Oil & Gas Conference and Exhibition, Perth, Australia, 12 November 2020. [Google Scholar] [CrossRef]
  22. Ulapane, N.; Nguyen, L. Review of Pulsed-Eddy-Current Signal Feature-Extraction Methods for Conductive Ferromagnetic Material-Thickness Quantification. Electronics 2019, 8, 470. [Google Scholar] [CrossRef] [Green Version]
  23. Rifai, D.; Abdalla, A.N.; Ali, K.; Razali, R. Giant Magnetoresistance Sensors: A Review on Structures and Non-Destructive Eddy Current Testing Applications. Sensors 2016, 16, 298. [Google Scholar] [CrossRef] [Green Version]
  24. Rocha, T.J.; Ramos, H.G.; Lopes Ribeiro, A.; Pasadas, D.J.; Angani, C.S. Studies to optimize the probe response for velocity induced eddy current testing in aluminium. Measurement 2015, 67, 108–115. [Google Scholar] [CrossRef]
  25. Dang, B.; Yang, L.; Liu, C.Z.; Zheng, Y.H.; Li, H.; Dang, R.R.; Sun, B.Q. A Uniform Linear Multi-Coil Array-Based Borehole Transient Electromagnetic System for Non-Destructive Evaluations of Downhole Casing. Sensors 2018, 18, 2707. [Google Scholar] [CrossRef] [Green Version]
  26. Dang, B.; Liu, C.Z.; Yang, L.; Wang, G.; Wang, M.M.; Ren, Z.P.; Dang, R.R. EMD-based Borehole TEM Array Signal Denoising and Baseline Wander Correction for NDT of Downhole Casings. IEEE Access 2020, 99, 1. [Google Scholar] [CrossRef]
  27. Liu, C.Z.; Dang, B.; Wang, H.Y.; Shen, X.H.; Yang, L.; Ren, Z.P.; Dang, R.R.; Kang, Y.Z.; Sun, B.Q. Multiple-Transmit Focusing for the Nondestructive Testing of Downhole Casings Based on Borehole Transient Electromagnetic Systems. IEEE Access 2020, 8, 210978. [Google Scholar] [CrossRef]
  28. Fu, Y.; Yu, R.; Peng, X.; Ren, S. Investigation of casing inspection through tubing with pulsed eddy current. Nondestruct. Test. Eval. 2012, 27, 353–374. [Google Scholar] [CrossRef]
  29. Wu, T.; Bowler, J.R.; Theodoulidis, T.P. Eddy-Current induction by a coil whose axis is perpendicular to that of a Tube. IEEE Trans. Magn. 2017, 53, 1–9. [Google Scholar] [CrossRef]
  30. Zhou, H.T.; Hou, K.; Pan, H.L.; Chen, J.J.; Wang, Q.M. Study on the optimization of eddy current testing coil and the defect detection sensitivity. Procedia Eng. 2015, 130, 1649–1657. [Google Scholar] [CrossRef] [Green Version]
  31. Bai, Y.; Zhan, Q.W.; Wang, H.N.; Chen, T.; He, Q.L.; Hong, D.C. Calculation of Tilted Coil Voltage in Cylindrically Multilayered Medium for Well Logging Applications. IEEE Access 2020, 99, 1. [Google Scholar] [CrossRef]
  32. Marinov, S.G. Theoretical and experimental investigation of eddy current inspection of pipes with arbitrary position of sensor coils. In Review of Progress in Quantitative Nondestructive Evaluation; Thompson, D.O., Chimenti, D.E., Eds.; Springer: Boston, MA, USA, 1986; Volume 5A, pp. 225–232. [Google Scholar] [CrossRef] [Green Version]
  33. Yang, Q.N.; Xie, S.J.; He, K.; Chen, Y.; Chen, Z.M.; Uchimoto, T.; Takagi, T. A novel circumferential eccentric eddy current probe and its application for defect detection of small-diameter tubes. Sens. Actuators A Phys. 2021, 331, 113023. [Google Scholar] [CrossRef]
  34. Rifai, D.; Abdalla, A.N.; Razali, R.; Ali, K.; Faraj, M.A. An Eddy Current Testing Platform System for Pipe Defect Inspection Based on an Optimized Eddy Current Technique Probe Design. Sensors 2017, 17, 579. [Google Scholar] [CrossRef] [Green Version]
Figure 1. Downhole pulsed eddy current (PEC) system with a hole defect: (a) Schematic of a PEC model; (b) cross-section at z = 0.
Electronics 11 02030 g001
Figure 2. Depth-azimuth images of normalized magnetic flux density (MFD) at sampling times: (a) 10 ms; (b) 20 ms.
Electronics 11 02030 g002
Figure 3. Structure of a synthesized uniform circular array (UCA).
Electronics 11 02030 g003
Figure 4. Borehole PEC circuits for the synthesized UCA.
Electronics 11 02030 g004
Figure 5. Three dimensional data structure of the synthesized UCA.
Electronics 11 02030 g005
Figure 6. Azimuth-time images of MFDs for hole defects with different penetration depths (PD): (a) PD of 0% casing thickness; (b) PD of 20% casing thickness; (c) PD of 40% casing thickness; (d) PD of 60% casing thickness; (e) PD of 80% casing thickness; (f) PD of 100% casing thickness.
Electronics 11 02030 g006
Figure 7. Azimuth dimension curves of 20-mm hole defects with different PDs at sampling times: (a) 10 ms and (b) 20 ms.
Electronics 11 02030 g007
Figure 8. Comparison of different sampling times and PDs for different hole defects: (a) Comparison of different hole defects at different sampling times; (b) comparison of hole defects with different PDs.
Electronics 11 02030 g008
Figure 9. Probe structure and the corresponding circuit board for the synthesized UCA: (a) Probe structure of synthesized UCA; (b) data acquisition circuit; (c) transmitting and receiving circuit.
Electronics 11 02030 g009
Figure 10. Casing structure with five asymmetry hole-type defects and inspection results of the synthesized UCA: (a) Casing structure; (b) inspection results at 10 ms; (c) inspection results at 20 ms.
Electronics 11 02030 g010
Figure 11. Comparison of the theoretical and experimental MFDs using the synthesized UCA for hole defects with different PDs at different sampling times: (a) Comparison of null values between the theoretical and experimental MFDs; (b) comparison of normalized MFDs with different PDs in the experiment.
Electronics 11 02030 g011
Figure 12. Errors of the circumferential width and PD with an included angle: (a) Width error for hole defect with a PD of 60%; (b) PD error for hole defect with a width of 20 mm.
Electronics 11 02030 g012
Figure 13. Azimuth-time images of two asymmetry defects at different depths: (a) 66.5 m; (b) 88.7 m.
Electronics 11 02030 g013
Figure 14. Inspected PDs and normalized MFDs for two asymmetry defects: (a) Inspected PDs at different sampling times; (b) normalized MFDs at 10 ms.
Electronics 11 02030 g014
Figure 15. Actual shapes of two asymmetry defects at different depths: (a) 66.5 m; (b) 88.7 m.
Electronics 11 02030 g015
Publisher’s Note: MDPI stays neutral with regard to jurisdictional claims in published maps and institutional affiliations.