Article

Requirement Analysis and Teardrop-Based Design of High Antenna Isolation for FMCW Radar

1
School of Information Science and Technology, Southwest Jiaotong University, Chengdu 611756, China
2
Pontosense Inc., Waterloo, ON N2J4G8, Canada
3
College of Electrical and Information Engineering, Hunan University, Changsha 410082, China
4
Faculty of Computer and Information Sciences, Hosei University, Tokyo 184-8584, Japan
*
Authors to whom correspondence should be addressed.
Electronics 2022, 11(11), 1687; https://doi.org/10.3390/electronics11111687
Submission received: 30 April 2022 / Revised: 23 May 2022 / Accepted: 24 May 2022 / Published: 25 May 2022

Abstract

:
Frequency-modulated continuous wave (FMCW) radar is widely used in automotive and consumer electronics because of its range, velocity, and angle measurement functionality. In an FMCW radar system, the isolation between transmitting (Tx) and receiving (Rx) subsystems affects the sensitivity of the FMCW system, which directly impacts the system’s overall performance in target detection. The factors that affect system performance include transmitter-to-receiver on-chip coupling and Tx-to-Rx antenna coupling. The on-chip isolation performance is basically fixed once a radar chip is given, but the antenna isolation performance depends on a designed antenna array. Usually, a targeted antenna requirement is first specified, and then the corresponding Tx and Rx antenna array is designed. However, there is no general principle or criteria for specifying a proper antenna isolation requirement in the existing research. In this paper, first, we reveal that the antenna isolation requirement should be set to be almost the same as the given on-chip isolation value, which is very significant as a general guideline in setting a targeted antenna isolation requirement. All current antenna isolation methods cannot reach the level of on-chip isolation in a compactly designed radar system. We further propose a teardrop-based method to provide high antenna isolation. The principle of an antenna isolation requirement and a novel antenna design using teardrops are both analyzed and demonstrated based on a representative 24 GHz FMCW radar. Our teardrop-shaped structure in the mouth of the conventional Vivaldi antenna achieved greater than 50 dB isolation, while the distance between the Tx and Rx antennas could be reduced to 2.1 mm.

1. Introduction

Millimeter-wave radar has received extensive attention in many areas such as in-cabin monitoring [1], automotive [2], unmanned aerial vehicle [3], and healthcare [4] applications. Many applications of millimeter-wave radars need to extract weak signals in complex noise environments by reducing and filtering noise to improve radar performance. Millimeter-wave radars are categorized based on transmitting waveforms such as continuous wave (CW), frequency-modulated continuous wave (FMCW), and pulse radar. Among them, CW radar cannot measure distance; pulse radar can measure distance, velocity, and angle, but the farther the distance, the lower the distance resolution; FMCW radar can measure distance, velocity, and angle, and its measured distance accuracy is only related to the modulated frequency bandwidth. Therefore, FMCW radar is widely used [5,6].
The performance of FMCW radar is restricted by environmental ambient noise, intrasystem interference, and intersystem noise [7]. The system signal-to-noise ratio (SNR) is a figure of merit (FOM) for intrasystem noise. In target detection, a radar’s transmitting (Tx) power and receiving (Rx) sensitivity are important factors that determine detection distance, while the SNR is a single FOM that reflects Tx power and Rx sensitivity. According to the radar range equation, the system SNR is determined by factors such as transmission power, antenna gain, receiver’s noise figure (NF), and signal processing gain (PG). In addition, there are other factors that can affect the performance of FMCW radar, such as power coupled from Tx to Rx and transmitter phase noise [8]. High-resolution FMCW radar applications need to reduce noise from all aspects, especially the power coupling between Tx and Rx, which introduces intrasystem noise [7]. The Tx power coupled to the Rx increases the NF of the receiver and decreases the SNR which can reduce system resolution and can shorten the operation distance [8,9,10,11,12]. This power coupling includes transmitter-to-receiver on-chip coupling and Tx-to-Rx antenna coupling. The transmitter phase noise and transmitter-to-receiver on-chip coupling are the root cause of the NF of a chipset. The radar chipset’s NF or on-chip isolation performance is basically fixed once a chipset is selected, but the Tx-to-Rx antenna coupling must be reduced by optimizing isolation between antennas in the integration design stage.
Antenna isolation is a measure of the ratio that one antenna will pick up the energy from another antenna [13]. However, the antenna isolation effect is not well specified in the current FMCW radar design, in which the main considerations in antenna design are impedance, radiation pattern, and polarization in the operation bandwidth. The proper requirement for antenna isolation needs to be first specified in the system design stage so that the required isolation can be targeted for optimizing system performance. However, to date, it is generally unclear about such a proper antenna isolation requirement, since an investigation of the impact of antenna isolation on radar system performance is not readily available. Therefore, it is very necessary and significant to study the impact of antenna isolation on system performance and to further clarify the isolation requirement in designing FMCW radar. Our basic hypothesis is that the antenna isolation requirement should be set almost the same as the on-chip isolation value. It is known that the transmitter to receiver on-chip isolation is generally greater than 40 dB [14,15], thus, the antenna isolation must be over 40 dB if our hypothesis is true. One purpose of this research is to verify this hypothesis through experiments.
Achieving high antenna isolation is not trivial in the design of small-size FMCW radar. A traditional isolation method by providing a large distance between Tx and Rx antennas is a brute force solution, but it makes the radar product bigger and more expensive. Recently, other antenna isolation methods such as defected ground structures (DGS) [16] and electromagnetic band gap (EBG) [17,18,19] have been proposed and widely adopted. DGS will affect an antenna’s radiation characteristics due to the resonance characteristics, and thus, the isolation effect is relatively low. An EBG structure can effectively suppress surface wave propagation and can achieve relatively high isolation of an antenna, but it cannot prevent radiated coupling and it increases an antenna array’s overall size because a certain space between antenna elements is required. However, all the antenna isolations achieved by [16,17,18,19] are in the range of 24–36 dB, less than the current on-chip isolation. In the commercially available Antenna-on-Package (AoP) solution, the antenna isolation is about 25 dB to 30 dB over the interested bandwidth with EBG isolation enhancement [17]. Therefore, the other purpose of this research is to investigate a better antenna isolation method that can achieve higher isolation reaching 50 dB. The novel method proposed is based on adding teardrops in the board for more effective Tx and Rx antenna isolation.
Since 24 GHz FMCW radar is widely used, this research takes a 24 GHz FMCW radar as a representative case study to analyze the impact of isolation on the system noise floor and target detection performance to verify the proposed hypothesis. It is very significant as a general principle in setting a proper Tx and Rx antenna isolation requirement when the on-chip isolation is given. We further demonstrate a new compact-size Vivaldi antenna design with a teardrop-shaped structure in the mouth that has achieved 50 dB isolation, which is much superior to other existing isolation methods.
The remainder of this paper is organized as follows: in Section 2, we describe the working principle of FMCW radar and the theoretical analysis of the antenna coupling and impact on system performance; in Section 3, we verify the proposed hypothesis by analyzing the impact of different isolation settings on system performance based on experimental data from the 24 GHz FMCW radar; in Section 4, we introduce the teardrop-based isolation method and show its simulated isolation results; the conclusions are given in the last section.

2. FMCW Radar and Requirements for Antenna Isolation

To investigate the antenna isolation requirement in FMCW radar, it is natural to start from the theoretical approach followed by measurement verification. This section analyzes the influence of antenna isolation on system performance by introducing the working principle of FMCW radar. The theoretical analysis explains the relationship between antenna isolation and the system noise floor.

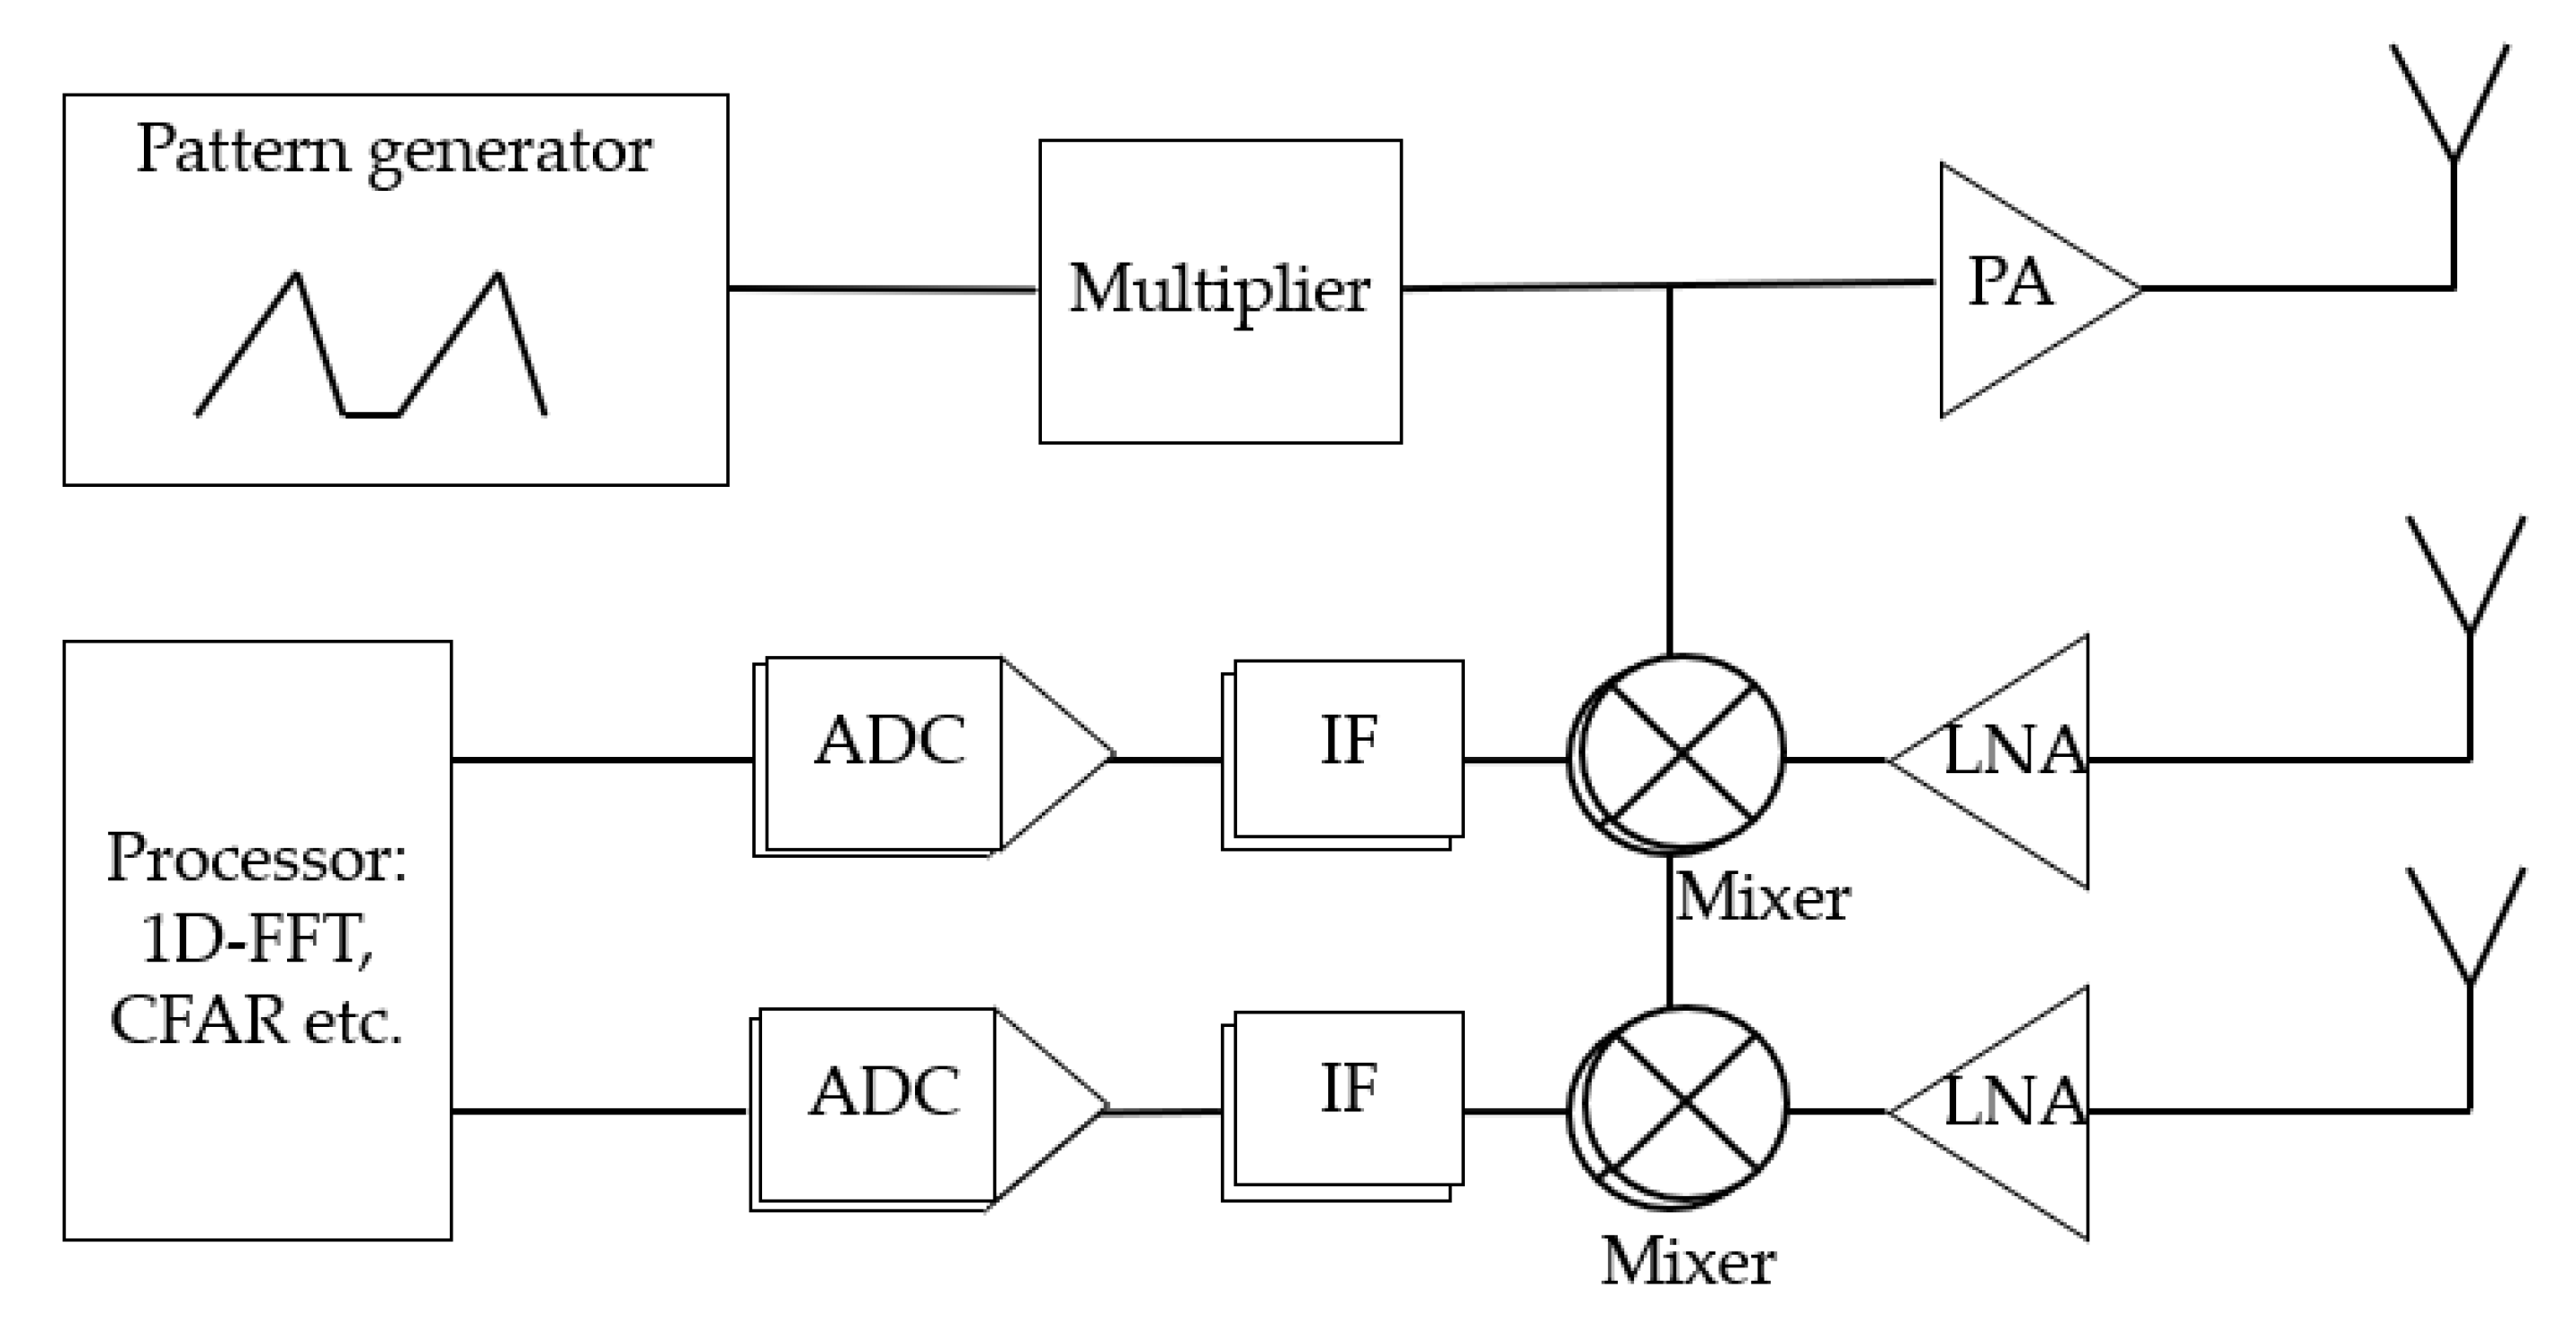
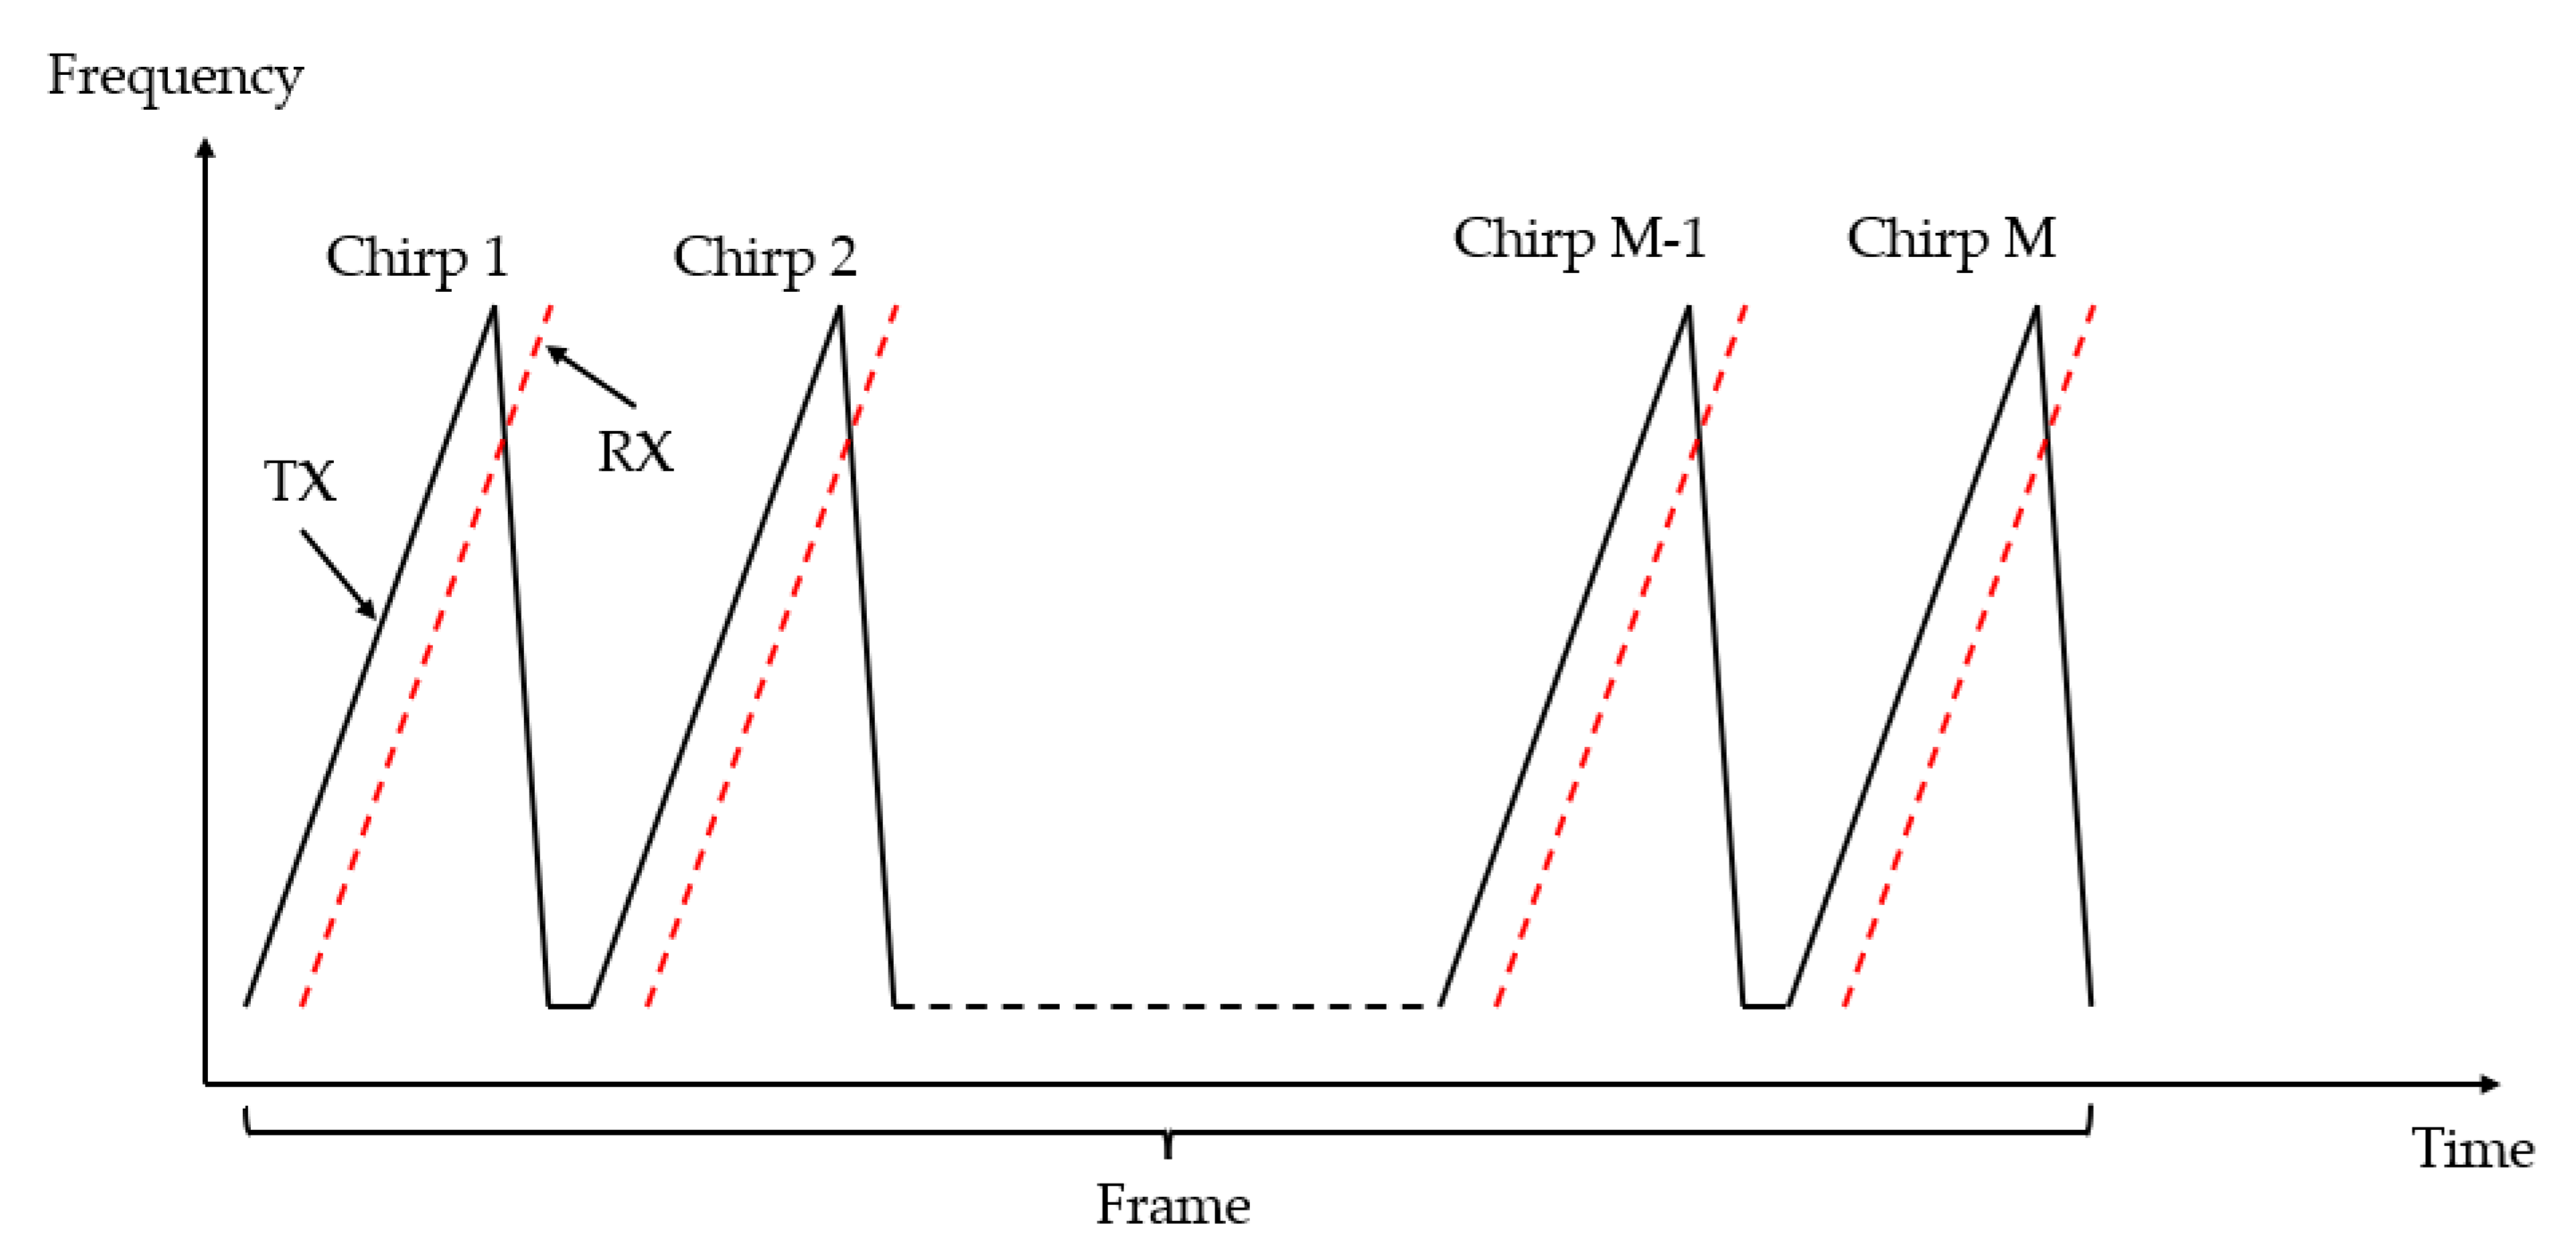
2.1. FMCW Radar Principle

The FMCW radar front-end consists of a transmitter and receiver, as shown in Figure 1. The function of the transmitter is to generate a continuous frequency sweep signal and transmit it. The power amplifier (PA) is used to enhance transmitter power. The frequency of the transmitted signal changes with time, as shown in Figure 2. The signal is reflected by the target and reaches the receiver. The received signal passes through the low noise amplifier (LNA) and the mixer to obtain an intermediate frequency (IF) signal. The analog to digital converter (ADC) samples the IF signal, and then transmits it to the processor for signal processing [8].
The transmit signal formula is:
s T X ( t ) = A T X cos [ ( w 0 + A b t ) d t ] = A T X cos [ ( w 0 + A b 2 t ) t ]
After a delay of T d , the reflected signal is received, and the received signal formula is:
s R X ( t ) = β s T X ( t T d ) = A R X cos [ ( w 0 + A b 2 ( t T d ) ) ( t T d ) ]
β is the loss factor of the signal during propagation.
The IF signal is obtained by passing the transmitted signal and the received signal through the mixer, and the carrier signal is removed. This process is also called “dechirping” or “deramping”. The deramping process produces the so-called “beat signal” at the mixer output. The signal formula after the mixer is:
s I F ( t ) = s R X ( t )   s T X ( t ) = A T X A R X 2 [ cos ( 2 w 0 t + A b t 2 A b T d t + A b 2 T d 2 w 0 T d ) + cos ( A b T d t + w 0 T d A b 2 T d 2 ) ]
The first cos function is the high frequency part, which is filtered by a low pass filter, and the second cos function is the low frequency part. The second cos function describes a beat signal at a fixed frequency. In T d = 2 R c , the R represents the distance from the radar to the target. IN S = A b 2 π , S represents twice the slope of the frequency modulation in each chirp. According to the formula, the frequency of the IF signal is related to Td:
f I F = S T d
The distance to the target corresponds to the frequency of the IF signal. One-dimensional FFT (1D-FFT) can be obtained by calculating the FFT after sampling by the ADC, that is, the spectral characteristics of the IF signal. In FMCW radar systems, the algorithms for distance, velocity, and angle estimation all require data based on 1D-FFT. The distance to the target is calculated by extracting the frequency of the target in the FFT spectrum. The 1D-FFT data can be fed to another FFT to get the 2D-FFT for extracting velocity information. The beamforming algorithm is also based on 1D-FFT data. The formula for an IF signal containing multiple reflected signals is:
s I F ( t ) = k = 0 A k cos ( 2 π f k t + k + n o i s e )
where k represents k different reflected signals received by the receiver, A k represents the reflected energy level of each target, and k is the phase of the transmitted signal minus the phase of the received signal. However, if power is coupled from Tx to Rx, due to its small propagation delay, a near-DC spectrum is produced in the IF domain, known as the DC offset problem. It should be emphasized that the DC offset problem will affect the DC level, and also the noise floor of the entire spectrum. Figure 3 shows the effect of Tx-to-Rx coupling on 1D-FFT. Figure 3 shows the result of the 1D-FFT after normalization; all results are divided by the value of the DC level, and then logarithmized. The abscissa is the conversion of the frequency result of the 1D-FFT into the distance. The frequency of the Tx-to-Rx coupling signal in the IF signal is 0 Hz (also known as the DC level). The results in Figure 3 include only the transmitter-to-receiver on-chip coupling, which has turned off the power amplifier switches of the transmit chain. Therefore, the IF signal only contains the on-chip coupling energy. Because of the spectral leakage of the FFT, the larger the value of the DC level, the larger the value of the other frequencies. Therefore, the coupled power raises the frequency spectrum of DC, as well as the value of other frequencies, which makes the system’s overall noise floor increase. The main effect of the energy leaked from Tx to Rx on the IF signal is to increase the low-frequency noise, which increases the noise of the entire 1D-FFT spectrum. The theoretical analysis illustrates that an increased DC level directly impacts the performance of the FMCW radar system.

2.2. Antenna Isolation Influence on the Radar Range Equation

The radar range equation is useful for estimating the maximum distance at which a particular radar can detect a target, and can serve as a means for understanding the factors influencing ranging performance.
The Friis transmission equation is shown in Equation (6):
P r = 10 lg ( P t λ 2 ( 4 π ) 3 ) 40 lg ( R ) + σ d B s m + 10 lg ( G r G t )
Equation (6) considers the signal of the receiver. In radar systems or wireless communication systems, the received power of the signal and the SNR of the signal determines the decodable signal quality. Different systems have different requirements for SNR, which are related to the modulation and demodulation methods. The radar range equation representing the SNR of the radar system is expressed as follows [20]:
S N R d B = 10 lg ( P t λ 2 ( 4 π ) 3 ) 40 lg ( R ) + σ d B s m + 10 lg ( G r G t ) 10 lg ( k T 0 B I F ) N F + P G
where σ d B s m is the radar cross section (RCS) of the reflecting target, R is the distance between the target and the radar, G r is the gain of the receiving antenna, G t is the gain of the transmitting antenna, P t is the transmit power of the chip, λ is the wavelength of the signal, NF is the Rx noise figure, k is the Boltzmann constant, T 0 is the temperature, B I F is the bandwidth of the IF signal, and PG is the processing gain of the FFT. Equation (7) consists of three parts. The first part is related to the space propagation loss of the signal. The signal is radiated into the space through the transmitting antenna and is received by the receiving antenna after being reflected by the target reflector. The factors that influence the received signal level include the space loss, the energy reflected by the reflecting surface, and the gain of the Tx antenna and the Rx antenna. The second part that affects the target detection is the reduction in SNR due to the thermal noise of the receiver and digital circuit noise. The third part is the PG of the signal processing [21]. NF is defined as the ratio of the input SNR to the output SNR, as shown in Equation (8):
N F = S N R i n S N R o u t = P i n k     T 0     B I F P i n     G r x N o u t
where S N R i n is the input SNR, S N R o u t is the output SNR, P i n is the input power of the receiver, G r x is the gain of the receiver, and N o u t is the noise power output by the receiver.
Equation (7) is a general equation for noise analysis, which does not consider the influence of antenna isolation on the system SNR. The system’s noise floor is a combined effect of input noise and internal receiver noise. If we consider any unwanted power as noise, the Tx and Rx coupling should be included in the input noise term. The transmitter power leaked into the receiver introduces intrasystem noise, leading to system performance degradation. Because Equation (8) does not consider the noise of the Tx-to-Rx antenna coupling, the classic expression for S N R i n in Equation (8) is no longer applicable. In this paper, we propose Equation (9), in addition to thermal noise ( k T 0 B I F ), the noise coupled from the Tx antenna to the Rx antenna ( N a n t ) and the internal transmitter-to-receiver coupling ( N o n _ c h i p ) of the chip need to be considered. It should be noticed that the N a n t   and   N o n _ c h i p are the additional noise that is higher than thermal noise:
N F = S N R i n S N R o u t = P i n k     T 0     B I F + N a n t + N o n _ c h i p P i n     G r x N o u t
The thermal noise is caused by the molecule’s Brownian motion, it is the lowest noise. When the antenna isolation is worse than the transmitter-to-receiver on-chip isolation, then the antenna isolation becomes a major limiting factor. If the antenna isolation is better than the on-chip isolation, the performance is limited completely by the on-chip isolation. In the next section, we illustrate the influence of coupling between Tx and Rx antennas on the FMCW radar system through experiments to compare the change in the system noise floor when N a n t is larger than N o n _ c h i p and when N a n t is smaller than N o n _ c h i p .

3. Experimental Analysis of the Isolation Impact on System Performance

In this section, we introduce the influence of antenna isolation on system performance through the experimental results of three different antenna isolation levels. Based on the theoretical analysis in the previous section, antenna isolation and on-chip transmitter and receiver isolation impact radar system performance. We further verified experimentally the radar system performance change with regard to antenna isolation change.
The experiment is based on a widely used ICLEGEND MICRO’s S5KM312CL chip [15], whose working frequency band is 24 GHz–24.25 GHz, and the transmitter-to-receiver on-chip isolation is 50 dB. The radar board contains an S5KM312CL chip and a microprocessor unit (MCU) STM32F429VET6. A USB cable connects the radar board and the laptop. The S5KM312CL has a built-in ADC and FFT engine. The S5KM312CL chip transmits the results of 1D-FFT to the MCU, which sends the 1D-FFT results to the laptop for data analysis. The distance resolution is 0.6 m. The period of the chirp is 1 ms, a frame contains 32 chirps, and the period of a frame is 32 ms. The number of calculation points for 1D-FFT is 256 points. Based on the S5KM312CL chip, three antennas with different isolation levels of 50 dB, 27 dB, and 18 dB are designed. The 27 dB antenna isolation is a typical specification for commercial radars. The 18 dB antenna isolation is set to a low bar for checking system functionality. The 50 dB antenna isolation level is to verify that when the antenna isolation reaches the transmitter-to-receiver on-chip isolation, the antenna isolation is no longer a limiting factor of system performance. Figure 4 shows three different levels of isolation within the operation bandwidth. The three isolation results in Figure 4 show slight variations in the isolation results within the operating bandwidth range, which is to compare the effects of different isolations more accurately.
The experiments are set up in two test scenarios, as shown in Figure 5. One test scenario is in an anechoic chamber, which is thermal equilibrium without reflections, to test the radar system’s noise floor. The baseline tests in an anechoic chamber set a reference for the noise level of the radar system. The other test scenario is conducted in an open environment to verify the influence of isolation on target detection performance with a known noise floor.

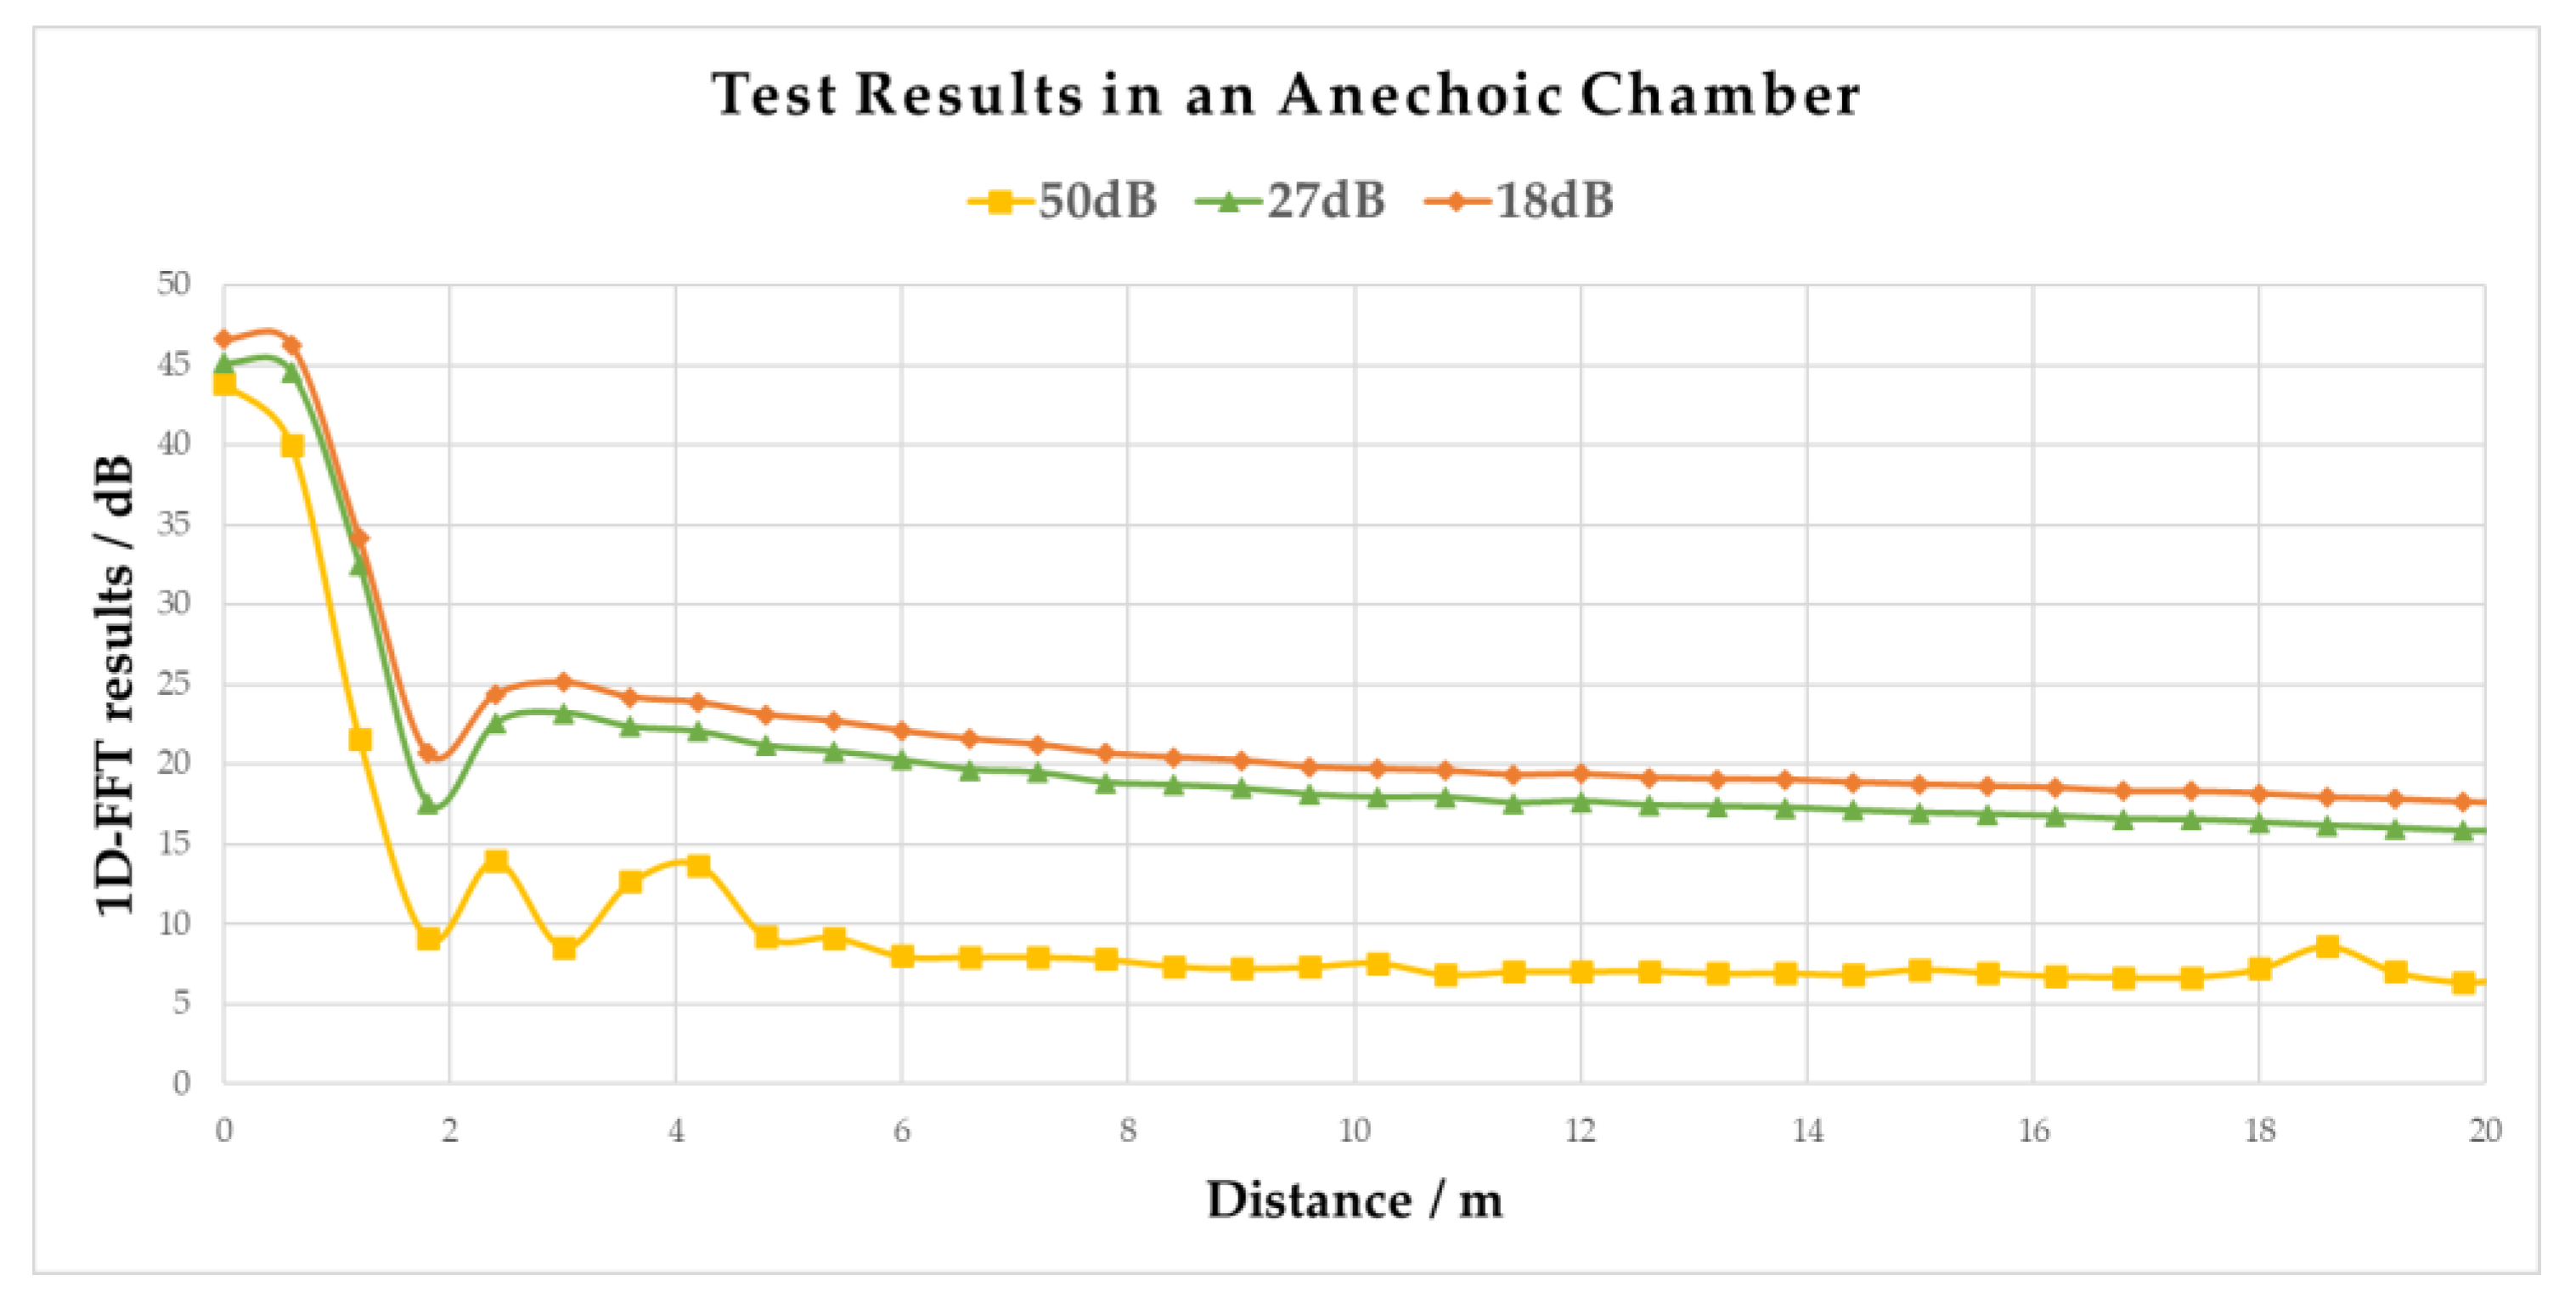
3.1. Experimental Results in an Anechoic Chamber

As shown in Figure 5, the radar board is installed in an anechoic chamber without reflectors. This setup is to isolate the environmental noise. In an anechoic chamber testing environment, the received noise energy is composed of thermal noise, digital noise, on-chip Tx-to-Rx coupling, and Tx and Rx antenna coupling. The thermal noise at room temperature is much lower than other noise sources and Tx-to-Rx on-chip isolation is 50 dB. Figure 6 shows the results of 1D-FFT for three different isolations. According to Formula (4), the frequency of 1D-FFT is converted into the distance, therefore, the abscissa of Figure 6 represents the distance, that is, the frequency of 1D-FFT; the ordinate is the logarithm of the amplitude result of 1D-FFT. The amplitude of the 1D-FFT is related to the energy of the IF signal at that frequency. It can be observed from Figure 6 that the worse the isolation, the greater the DC level of interference. This is due to more energy leaked from the Tx antenna to the Rx antenna. Figure 6 shows that the larger the 1D-FFT DC the higher the noise, which means the worse the isolation, the greater the noise floor. Considering the theoretical analysis in the previous section, this is understandable because the ratio of the main lobe to the side lobe of the FFT is fixed for a given system, and therefore, the larger the main lobe, the larger the value of the side lobe. When the antenna isolation is worse than the transmitter-to-receiver on-chip isolation, the antenna isolation determines the minimum detectable energy of the system. This also leads to a decrease in system sensitivity. Therefore, we conclude that the Tx and Rx antenna isolation specification for the FMCW radar system is that the antenna isolation should be equal or larger than the on-chip Tx and Rx isolation.

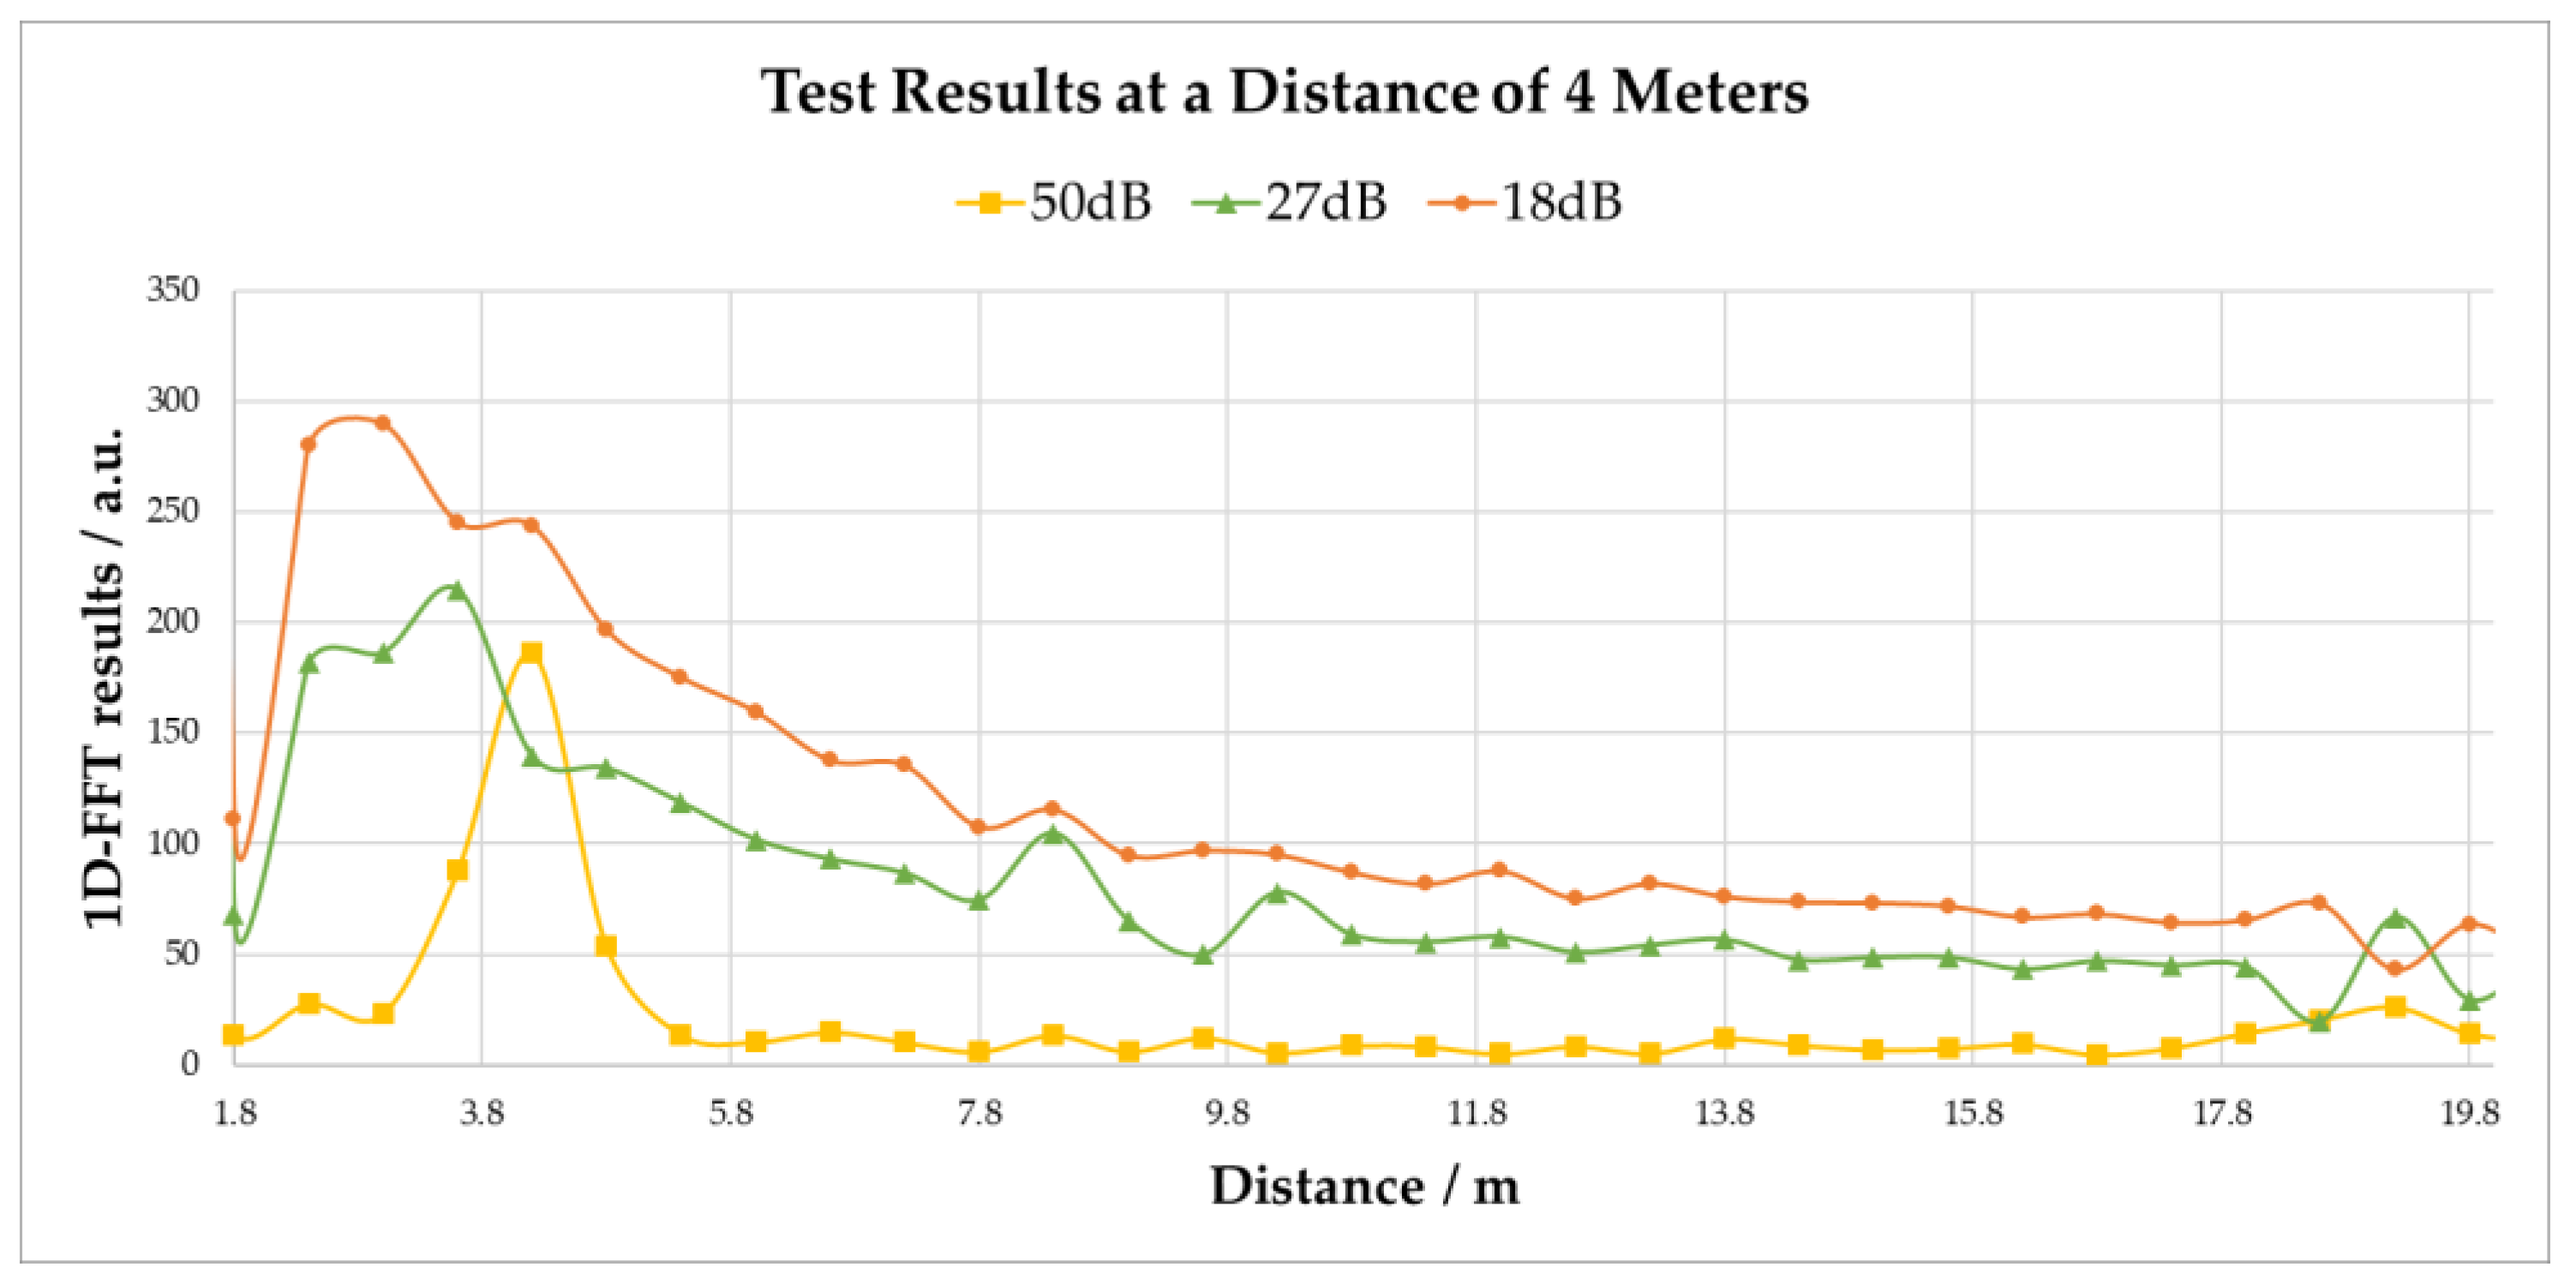
3.2. Experimental Results in an Open Environment

In Figure 5, a corner reflector with an RCS of 10 dBsm was used in an open environment as the reflection target to emulate the detecting object. To measure the antenna isolation effect on the range of detecting an object, the corner reflectors were placed at 2 m, 4 m, and 8 m for testing, and the radar antenna main beam was facing the corner reflectors.
The SNR of the target is obtained using the constant false alarm rate (CFAR) [22] algorithm. The CFAR is an algorithm that adaptively determines the threshold level. The threshold level is calculated by estimating the noise floor level around the cell under test. The experimental results given in Table 1 show that the worse the isolation, the lower the SNR. Because the worse the isolation, the greater the noise floor, the SNR becomes worse. When the SNR is less than 3 dB, the desired target and noise cannot be accurately distinguished. If we use 3 dB as the minimum SNR, when the isolation is 18 dB, the target cannot be accurately detected even at 2 m. When the isolation is 27 dB, the target cannot be accurately detected at 4 m. When the isolation is 50 dB, the target can still have an SNR greater than 6 dB at 8 m. Figure 7 shows the test results at a 4 m distance. Since the noise floor of the system is very large when the isolation is 27 dB and 18 dB, the energy of the target signal is submerged in the noise floor, and the target signal cannot be accurately extracted. When the isolation is 50 dB, the target can be accurately identified. When the antenna isolation is 50 dB, the antenna isolation reaches the transmitter-to-receiver on-chip isolation. The antenna isolation is not the limitation of system performance anymore, which suggests the design effort should be allocated to other factors, such as transmitter power and antenna gain.
The experimental results show that the isolation directly impacts the target detection performance of the radar. The transmitter-to-receiver on-chip isolation is a limiting factor of the system; once the antenna isolation reaches the transmitter-to-receiver on-chip isolation, there is no deterioration in the system’s performance. The experimental results also show that the system’s noise floor with 50 dB isolation is very low and has excellent target detection performance. An antenna system with 25–30 dB isolation is the normal specification for commercial radar products [15]. It is difficult for traditional antenna designs to achieve 50 dB isolation across the operating bandwidth. Therefore, in most cases, antenna isolation is one of the system’s limitations. If the antenna isolation is worse than the transmitter-to-receiver on-chip isolation, the coupling of the antenna leads to deterioration of the system’s performance or, in fact, it cannot work (the noise floor is too high or the receiver is saturated).

4. Vivaldi Antenna with Teardrop Loaded Design

Obtaining high antenna isolation of the chipset Tx and Rx on-chip isolation is our design target for the antenna subsystem. However, high antenna isolation is very challenging to achieve in a compact radar system. Traditional approaches for improving antenna isolation are based on either increasing the distance between antennas or using DGS/EBG design. The brute force of distance increasing results in enlarging the device size and increasing cost. The isolation effect of DGS and EBG are limited, since their performance is generally not able to reach on-chip isolation, as shown in Table 2. To prove the hypothesis, better isolated antennas are needed. We are proposing to improve increasing antenna isolation through antenna design. Considering that the Vivaldi antenna is one of the most popular antenna types for commonly used antenna for radar applications, this section introduces a new design that optimizes isolation, achieving good isolation performance even when the distance between the Tx and Rx antennas is close.

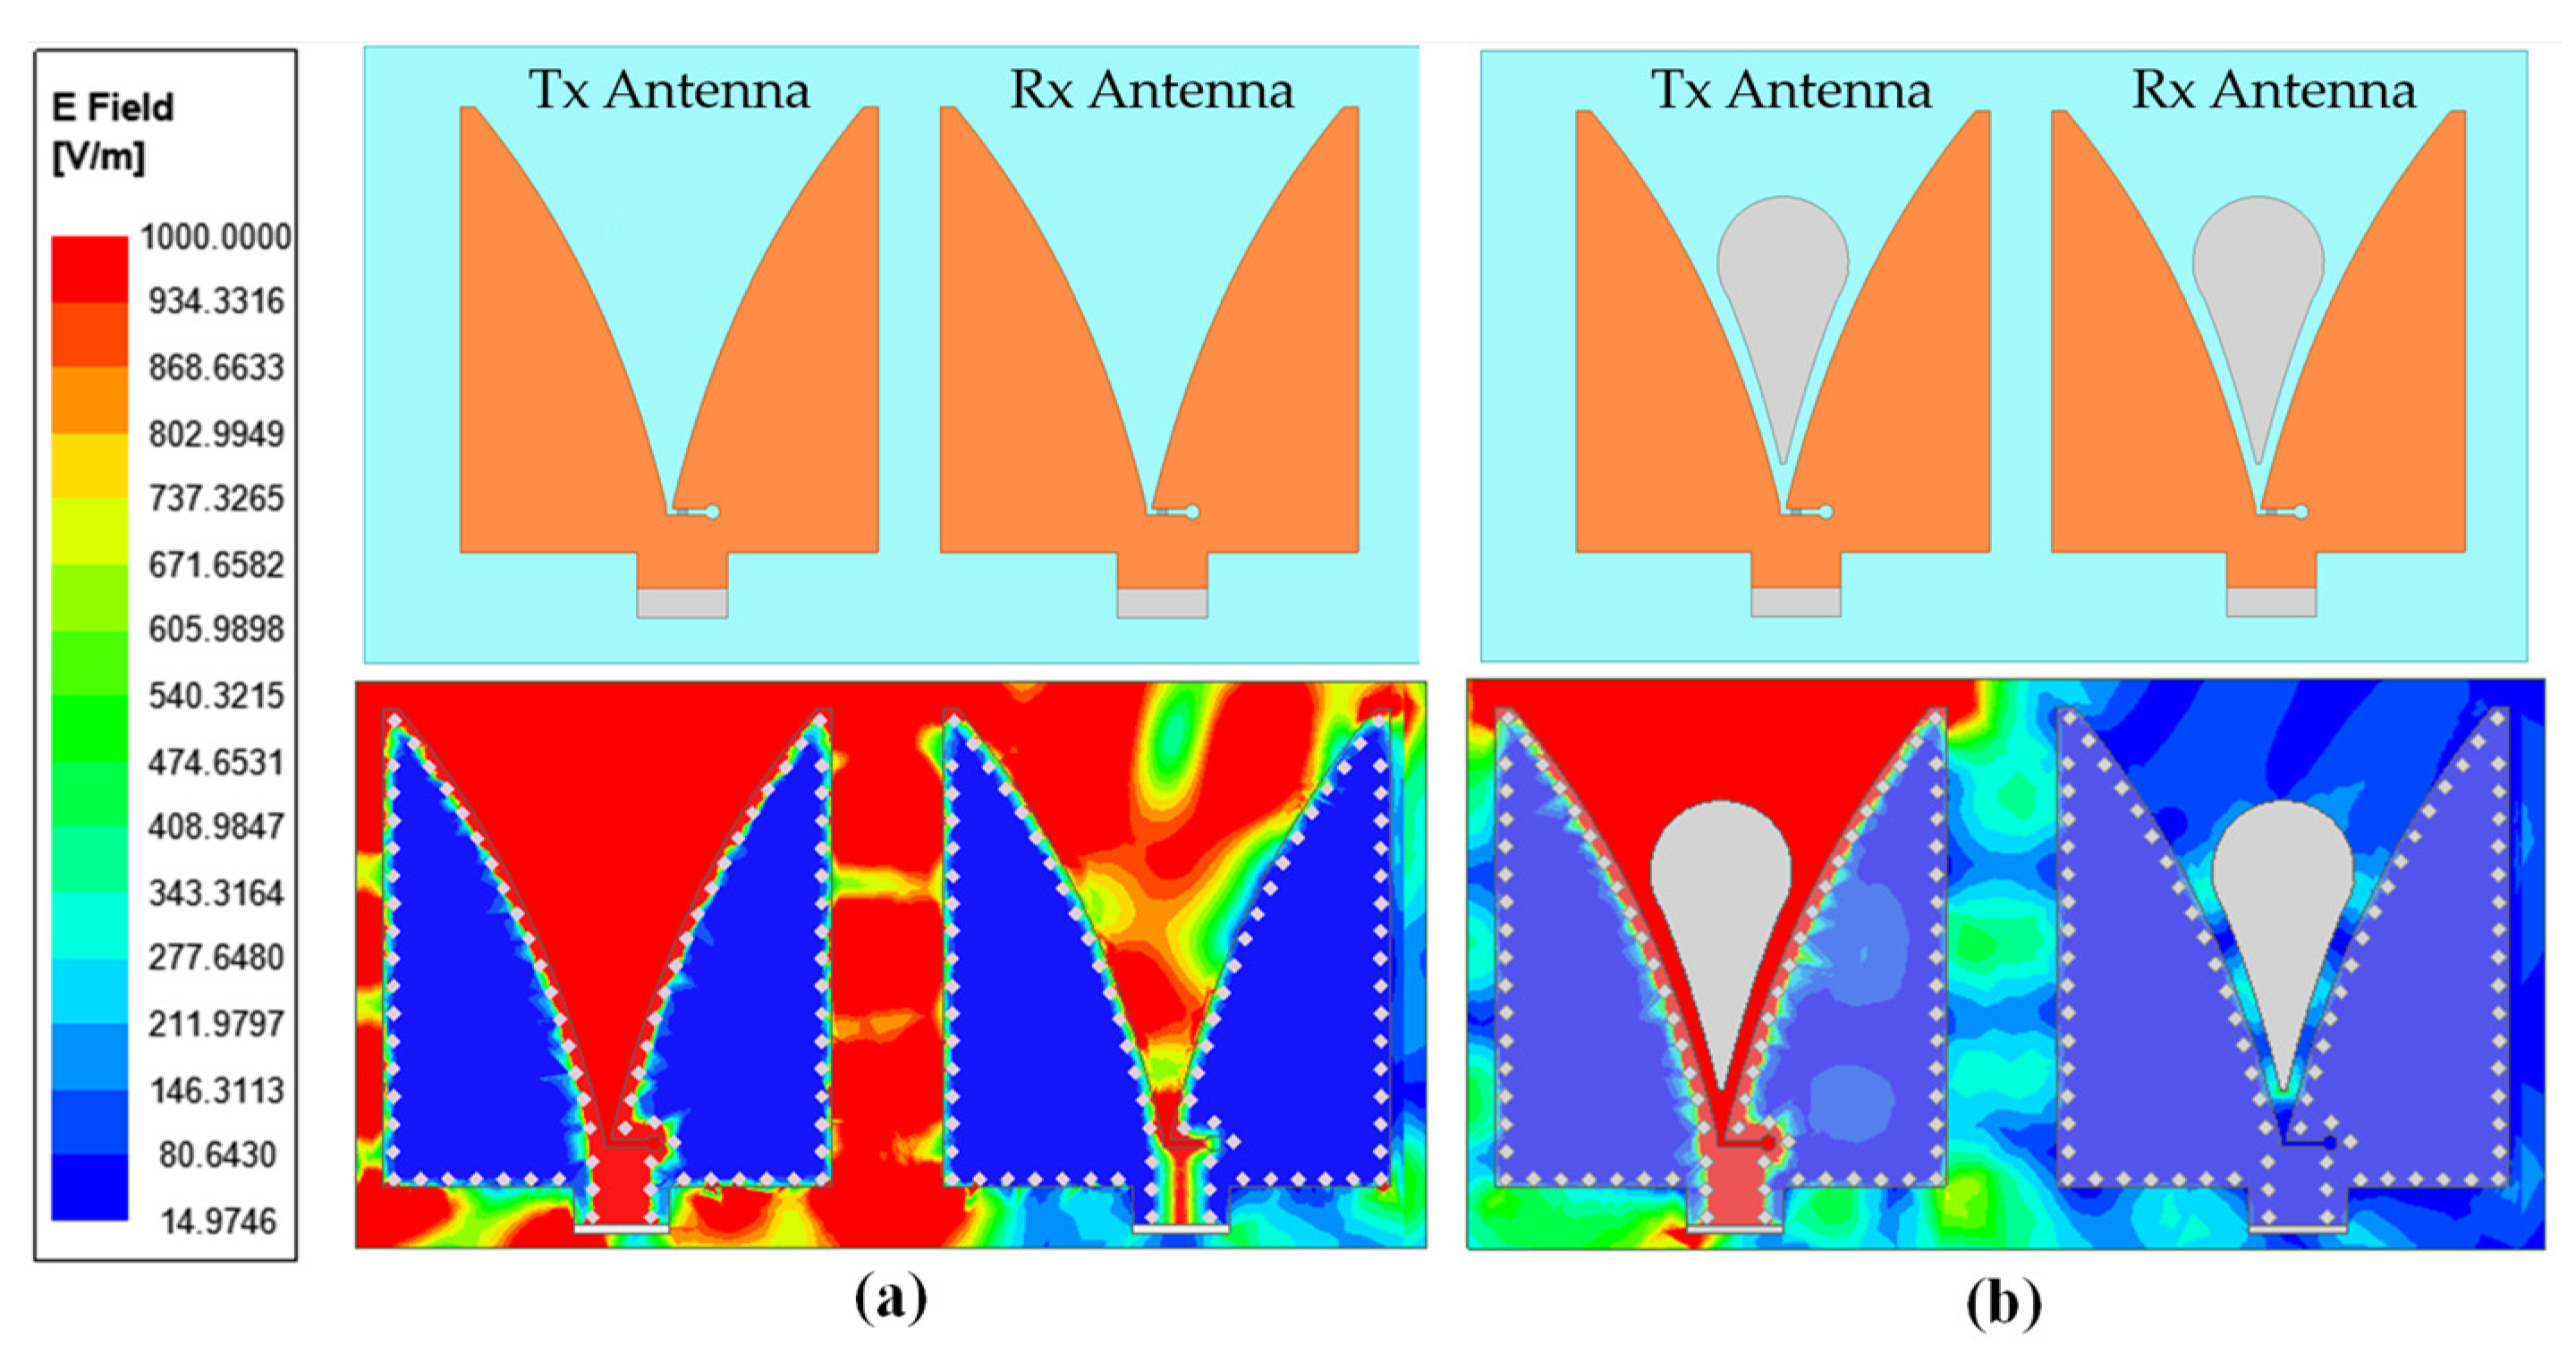
4.1. Teardrop Loaded Vivaldi Antenna Configuration

The root causes of antenna coupling are conducted coupling, surface wave coupling, and radiated coupling. Since isolation improvement is very challenging, we initially presented a Vivaldi antenna with a teardrop-loaded structure in the mouth of the antenna. The new structure effectively reduced antenna surface wave and diffraction on the antenna tips. There was no ground plan between the antennas, therefore, there was no conducted coupling. Figure 8 shows the configurations of the proposed antennas, where two identical Vivaldi antennas, working over 24–24.25 GHz, are presented for high isolation discussions. As shown in Figure 8a, different from the classic Vivaldi antenna, the proposed antenna has a teardrop-shaped structure in the mouth of the Vivaldi antenna to increase the isolation between the two Vivaldi antennas. The antennas are etched on the Rogers Ro 4350B substrate with a relative permittivity of 3.66. The exploded view of the antenna is shown in Figure 8b, where the antenna has four metal etched layers. The antenna is shielded with metal vias along its outline to avoid some undesired resonances; the undesired resonances degrade the isolation performance in some frequencies.

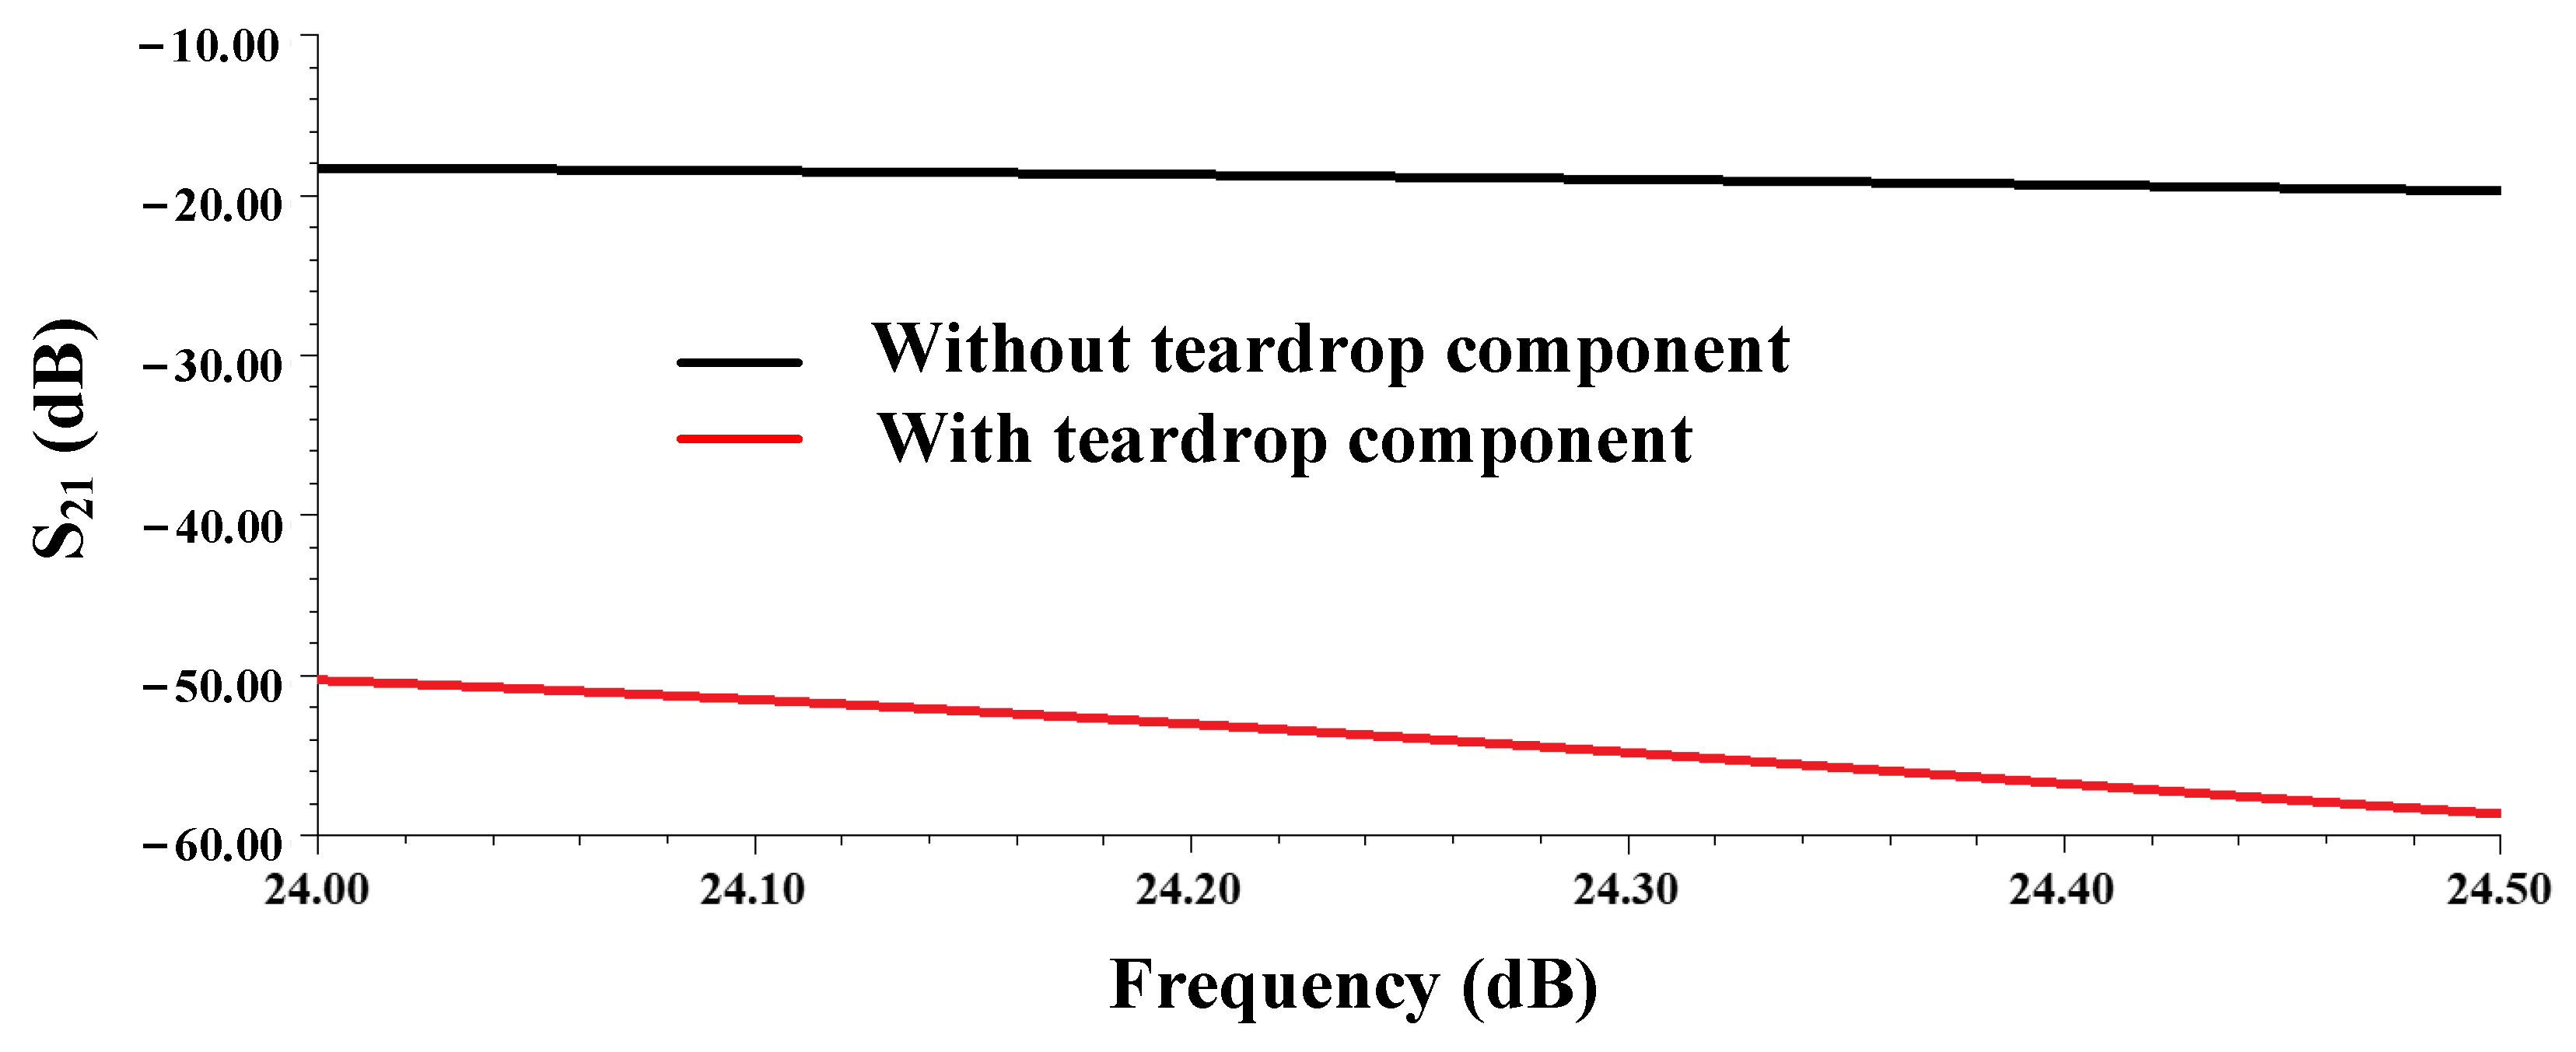
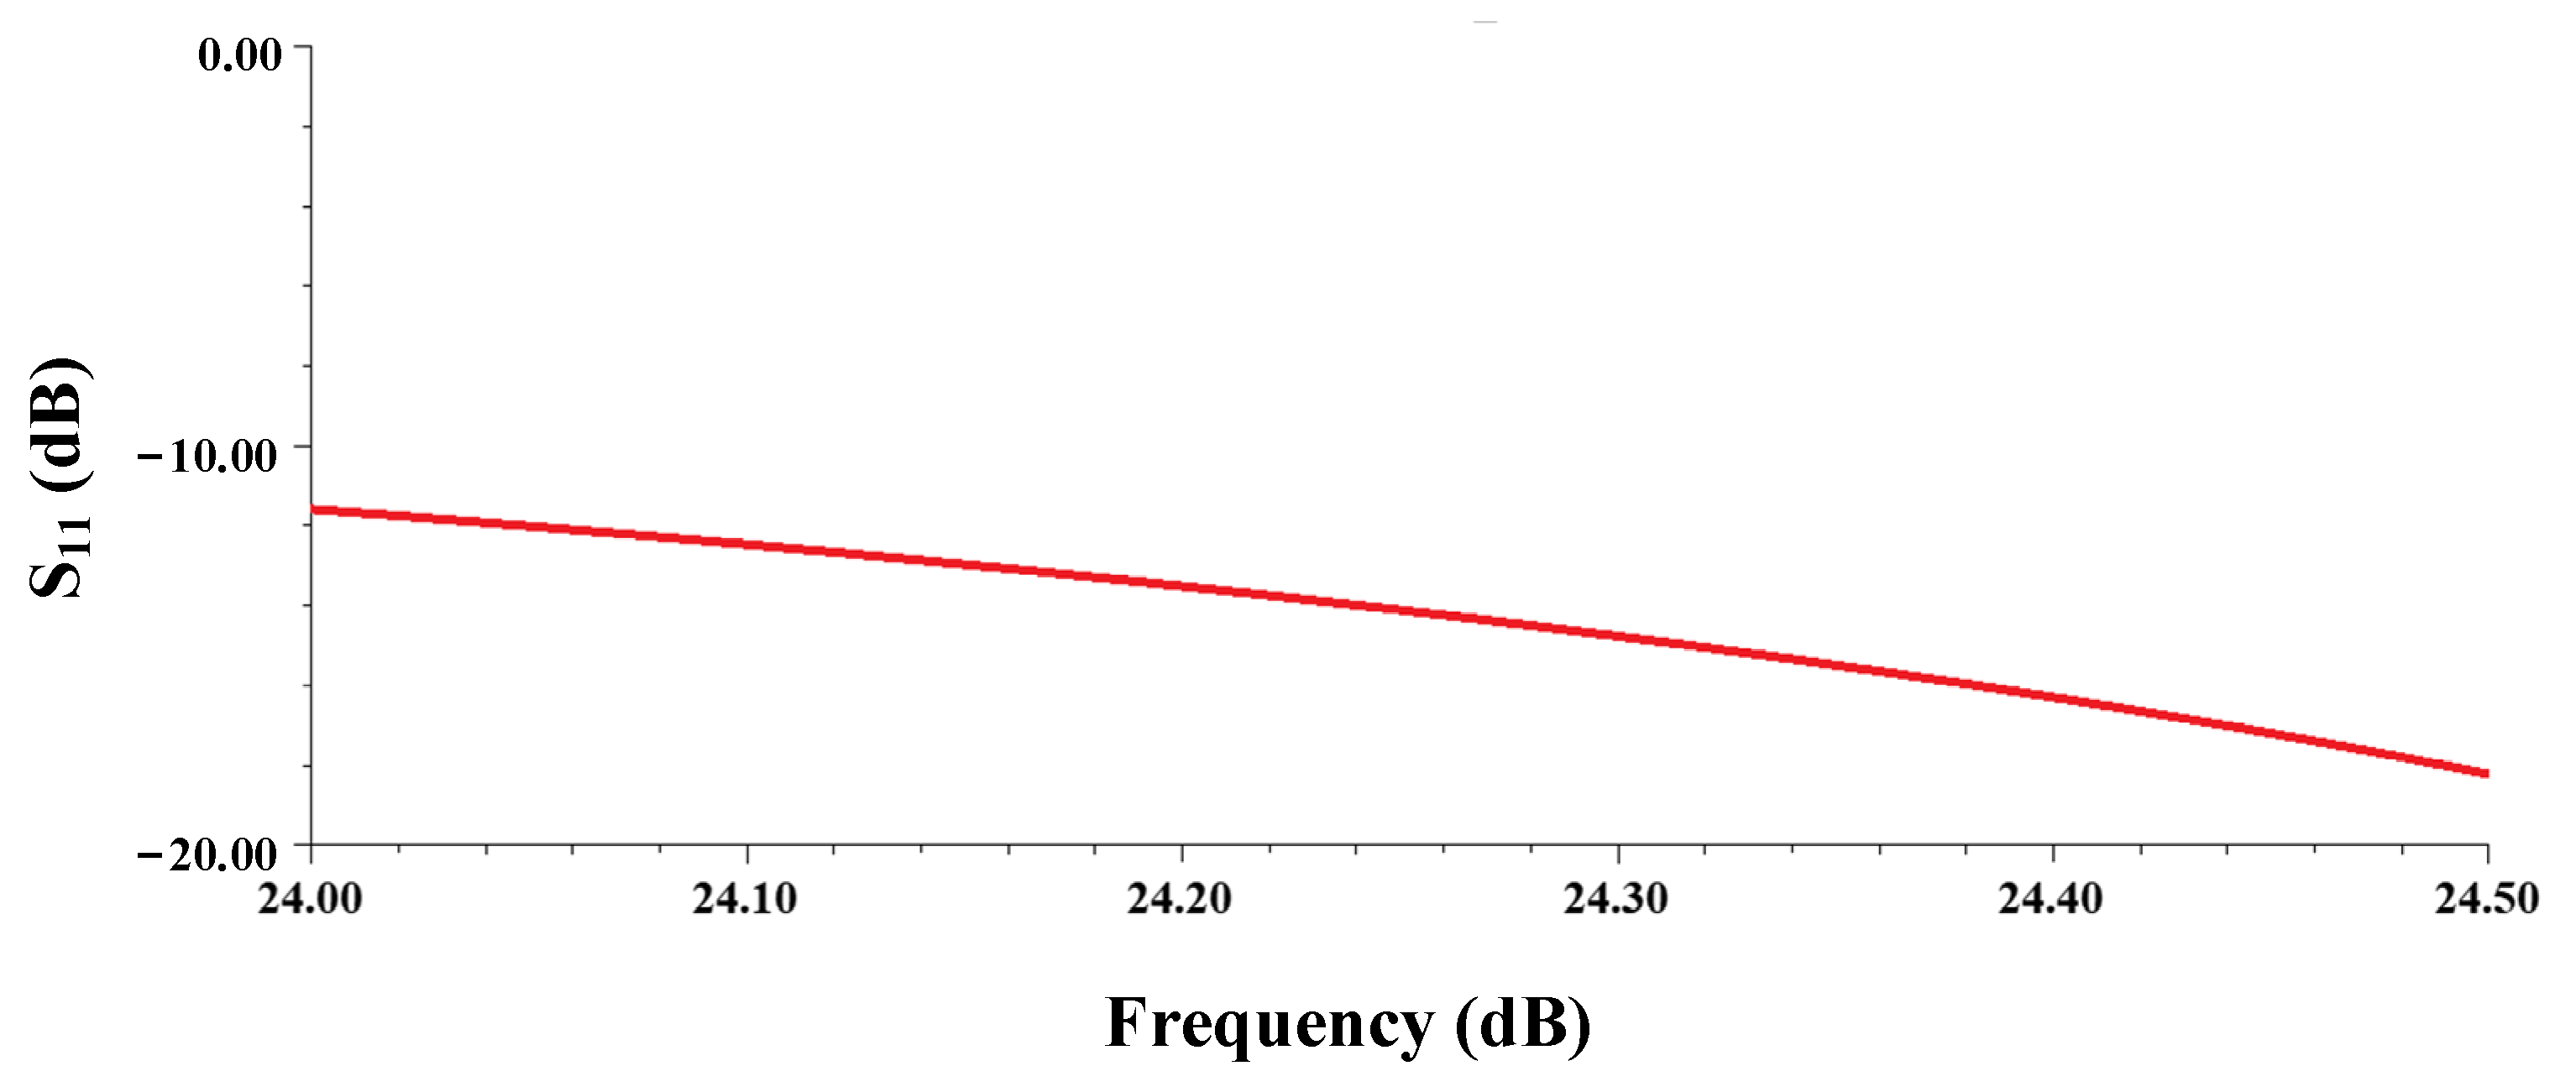
4.2. Antenna Results

To further investigate the decoupling characteristic of the proposed teardrop-shaped structure in applications of Vivaldi antennas, the simulated E-field distributions of the proposed antenna with and without the teardrop-shaped structure are shown in Figure 9. As shown in Figure 9a,b, the antenna on the left side is a Tx antenna that is excited, while the other antenna is an Rx antenna. From Figure 9, the teardrop-shaped structure chokes coupled E-field from the Tx antenna. With the help of the teardrop-shaped structure shown in Figure 9b, it can be seen from the vertical E-field scale on the left of the figure that the coupled E-field to the adjacent Vivaldi element decreases sharply as compared with the case without the teardrop-shaped structure shown in Figure 9a. Thus, the teardrop structure is proven to be an efficient decoupling component for arrays of Vivaldi antennas.
Figure 10 shows the performance of the proposed antenna with and without the teardrop-shaped component. The antennas of both structures have been optimized in detail. For antenna design, the antenna matches the feeding transmission line; antenna radiation pattern and antenna gain in the operation band are the antenna design parameters. In this paper, we also include isolation between the Tx and Rx antennas as a design specification. The antenna and isolation are best presented by S parameters [23], the antenna isolation is expressed in S21 and antenna match is shown in S11. From the figure, the antenna without the teardrop-shaped component obtains an S21 from −18.3 dB to −19.7 dB within the band of interest, while the case with the teardrop-shaped component achieves an S21 from −50.3 dB to −58.6 dB within the band of interest. With the teardrop-shaped component, the isolation of the Vivaldi antenna was increased by more than 30 dB in the band of interest. With the proposed components, the two Vivaldi antennas (one for Tx and the other for Rx) realize the isolation of more than 50 dB. As compared with the traditional design, the isolation is improved by more than 30 dB. Table 2 shows a comparison of the isolation results of different methods. The results show that the new design proposed in this paper has a greater degree of isolation in a compact size. Because the transmitter-to-receiver on-chip isolation of general commercial radar chips is from 40 dB to 50 dB, this design can be widely used in different scenarios and meets or exceeds the transmitter-to-receiver on-chip isolation requirements.
Figure 11 shows the return loss presented by S11 results of the proposed Vivaldi antenna. An S11 from −11.6 dB to −18.2 dB is obtained in the band of interest. The gain results are shown in Figure 12. The antenna realizes a gain of 8.5 ± 0.1 dBi within the band of interest. Figure 13 shows the patterns of the proposed antenna at the center frequency of 24.25 GHz. The antenna obtains 92.3 and 48.0 degrees 3 dB beamwidths in the E-plane and the H-plane, respectively.
The teardrop design in the mouth of the Vivaldi antenna has shown its performance, meeting all the requirements with isolation better than 50 dB. It also indicates that improving antenna design to optimize isolation is another approach worth considering.

5. Conclusions

High-quality, low-noise hardware systems are fundamental in millimeter-wave radar signal processing [7,24]. Isolation between Tx and Rx antennas is an important factor affecting the performance of radar systems. A high isolation system can reduce a system’s noise and improve a radar system’s sensitivity and target detection performance. In this paper, we conducted theoretical research on Tx and Rx isolation. The theoretical and measurement results show that when isolation is equal or better than the on-chip Tx and Rx isolation, the best intrasystem noise is achieved. This research is of practical use in assigning radar system antenna specifications for optimum system performance. Our measurement verifies that FMCW radar with 50 dB isolation has a low noise floor and good target detection performance. Since conventional Tx and Rx isolation in a compact system is worse than 40 dB, in this paper, we demonstrated a compact Vivaldi antenna with a teardrop-shaped component loaded on its mouth. The antenna design proposed in this paper can achieve more than 50 dB isolation from 24 GHz to 24.5 GHz bandwidth, even when the distance between the Tx antenna and the Rx antenna is only 2.1 mm, which effectively reduces system size and system cost. This improved antenna isolation is achieved by adding teardrops instead of traditionally space increasing between antennas and special isolation structures, such as EBG. The antenna proposed in this paper shows that high isolation is achievable through the teardrop-like innovative design. More systematic modeling and the design of innovative antenna isolation should be performed in the future for different antenna pattern requirements. The antenna proposed in this paper can also be extended to other frequencies. With different antenna isolations, the measurement results show that the radar detecting distance can be noticeably improved when antenna isolation reaches the on-chip isolation.

Author Contributions

Conceptualization, Y.L., L.C. and Y.Q.; methodology, Y.L., L.C. and Y.Q.; validation, Y.L. and L.C.; writing—original draft preparation, Y.L. and L.C.; writing—review and editing, J.M. and Y.Q.; supervision, Y.Q.; project administration, A.Q. All authors have read and agreed to the published version of the manuscript.

Funding

This research received no external funding.

Institutional Review Board Statement

Not applicable.

Informed Consent Statement

Not applicable.

Data Availability Statement

Not applicable.

Conflicts of Interest

The authors declare no conflict of interest.

References

  1. Lee, S.; Jeon, Y.; Park, G.; Myung, J.; Lee, S.; Lee, O.; Moon, H.; Nam, I. A 24-GHz RF Transmitter in 65-nm CMOS for In-Cabin Radar Applications. Electronics 2020, 9, 2005. [Google Scholar] [CrossRef]
  2. Senigagliesi, L.; Ciattaglia, G.; De Santis, A.; Gambi, E. People Walking Classification Using Automotive Radar. Electronics 2020, 9, 588. [Google Scholar] [CrossRef] [Green Version]
  3. Passafiume, M.; Rojhani, N.; Collodi, G.; Cidronali, A. Modeling Small UAV Micro-Doppler Signature Using Millimeter-Wave FMCW Radar. Electronics 2021, 10, 747. [Google Scholar] [CrossRef]
  4. Gouveia, C.; Loss, C.; Pinho, P.; Vieira, J. Different Antenna Designs for Non-Contact Vital Signs Measurement: A Review. Electronics 2019, 8, 1294. [Google Scholar] [CrossRef] [Green Version]
  5. Bhatia, J.; Dayal, A.; Jha, A.; Vishvakarma, S.K.; Joshi, S.; Srinivas, M.B.; Yalavarthy, P.K.; Kumar, A.; Lalitha, V.; Koorapati, S.; et al. Classification of Targets Using Statistical Features from Range FFT of mmWave FMCW Radars. Electronics 2021, 10, 1965. [Google Scholar] [CrossRef]
  6. Tang, T.; Wu, C.; Elangage, J. Analyze the FMCW Waveform Skin Return of Moving Objects in the Presence of Stationary Hidden Objects Using Numerical Models. Electronics 2021, 10, 28. [Google Scholar] [CrossRef]
  7. Qi, A.; Ma, M.; Luo, Y.; Fernandes, G.; Shi, G.; Fan, J.; Qi, Y.; Ma, J. WISe: Wireless Intelligent Sensing for Human Centric Applications. IEEE Wirel. Commun. 2022. [Google Scholar] [CrossRef]
  8. Cidronali, A.; Passafiume, M.; Colantonio, P.; Collodi, G.; Florian, C.; Leuzzi, G.; Pirola, M.; Ramella, C.; Santarelli, A.; Traverso, P. System Level Analysis of Millimetre-wave GaN-based MIMO Radar for Detection of Micro Unmanned Aerial Vehicles. In Proceedings of the 2019 PhotonIcs & Electromagnetics Research Symposium—Spring (PIERS—Spring), Rome, Italy, 17–20 June 2019. [Google Scholar]
  9. Melzer, A.; Onic, A.; Starzer, F.; Huemer, M. Short-Range Leakage Cancelation in FMCW Radar Transceivers Using an Artificial On-Chip Target. IEEE J. Sel. Top. Signal Process. 2015, 9, 1650–1660. [Google Scholar] [CrossRef]
  10. Adela, B.B.; van Zeijl, P.T.M.; Johannsen, U.; Smolders, A.B. On-Chip Antenna Integration for Millimeter-Wave Single-Chip FMCW Radar, Providing High Efficiency and Isolation. IEEE Trans. Antennas Propag. 2016, 64, 3281–3291. [Google Scholar] [CrossRef]
  11. Yoo, B.-Y.; Park, J.-H.; Yang, J.-R. Quasi-Circulator Using an Asymmetric Coupler for Tx Leakage Cancellation. Electronics 2018, 7, 173. [Google Scholar] [CrossRef] [Green Version]
  12. Wang, G.; Muñoz-Ferreras, J.; Gu, C.; Li, C.; Gómez-García, R. Application of Linear-Frequency-Modulated Continuous-Wave (LFMCW) Radars for Tracking of Vital Signs. IEEE Trans. Microw. Theory Tech. 2014, 62, 1387–1399. [Google Scholar] [CrossRef]
  13. Beck, C.; Ng, H.J.; Agethen, R.; PourMousavi, M.; Forstner, H.P.; Wojnowski, M.; Pressel, K.; Weigel, R.; Hagelauer, A.; Kissinger, D.; et al. Industrial mmWave Radar Sensor in Embedded Wafer-Level BGA Packaging Technology. IEEE Sens. J. 2016, 16, 6566–6578. [Google Scholar] [CrossRef]
  14. Nasr, I.; Jungmaier, R.; Baheti, A.; Noppeney, D.; Bal, J.S.; Wojnowski, M.; Karagozler, E.; Raja, H.; Lien, J.; Poupyrev, I.; et al. A Highly Integrated 60 GHz 6-Channel Transceiver with Antenna in Package for Smart Sensing and Short-Range Communications. IEEE J. Solid-State Circuits 2016, 51, 2066–2076. [Google Scholar] [CrossRef]
  15. S5 Series K-band mmWave Sensor. Available online: https://www.iclegend.com/en/sensor.html (accessed on 10 April 2022).
  16. Liu, K.; Liu, N.W.; Fu, G. Isolation Improvement of Dual-polarized Microstrip Array Antenna by Using DGS Scheme. In Proceedings of the ICEICT—2021 IEEE 4th International Conference on Electronic Information and Communication Technology, Xi’an, China, 18–20 August 2021. [Google Scholar]
  17. Moallem, M.; Crawford, Z.; Kulak, R.; Dewilde, M.; Chi, C.; Lin, A.; Ginsburg, B. High Performance mm-Wave MIMO Radar with Integrated Antenna-on-Package. In Proceedings of the 2020 IEEE 70th Electronic Components and Technology Conference (ECTC), Orlando, FL, USA, 3–30 June 2020. [Google Scholar]
  18. Kim, S.; Kim, D.K.; Kim, Y.; Choi, J.; Jung, K. A 24 GHz ISM-Band Doppler Radar Antenna with High Isolation Characteristic for Moving Target Sensing Applications. IEEE Antennas Wirel. Propag. Lett. 2019, 18, 1532–1536. [Google Scholar] [CrossRef]
  19. Yang, Y.; Chi, L.; Luo, Y.; Qi, A.; Miao, M.; Qi, Y. Antenna Design of Millimeter Wave Radar for Smart Toilet. In Proceedings of the 13th International Symposium on Antennas, Propagation and EM Theory (ISAPE 2021), Zhuhai, China, 1–4 December 2021. [Google Scholar]
  20. Ngo, A.; Bauer, M.P.; Resch, M. A Sensitivity Analysis Approach for Evaluating a Radar Simulation for Virtual Testing of Autonomous Driving Functions. In Proceedings of the 2022 7th Asia-Pacific Conference on Intelligent Robot Systems (ACIRS 2022), Singapore, 17–19 July 2020. [Google Scholar]
  21. Martínez-Vázquez, M. Overview of design challenges for automotive radar MMICs. In Proceedings of the International Electron Devices Meeting (IEDM), San Francisco, CA, USA, 11–16 December 2021. [Google Scholar]
  22. Gandhi, P.P.; Kassam, S.A. Analysis of CFAR processors in nonhomogeneous background. IEEE Trans. Aerosp. Electron. Syst. 1988, 24, 427–445. [Google Scholar] [CrossRef]
  23. David, M.P. Microwave Engineering; John Wiley & Sons, Inc.: Hoboken, NJ, USA, 2005. [Google Scholar]
  24. Luo, Y.; Qi, A.; Shi, G.; Miao, M.; Qi, Y.; Ma, J. Millimeters Wave Radar for Wireless Intelligent Sensing. In Proceedings of the 13th International Symposium on Antennas, Propagation and EM Theory (ISAPE 2021), Zhuhai, China, 1–4 December 2021. [Google Scholar]
Figure 1. System block diagram of FMCW radar.
Electronics 11 01687 g001
Figure 2. Transmitted and received frequency-modulated signals.
Electronics 11 01687 g002
Figure 3. Frequency response of FFT.
Electronics 11 01687 g003
Figure 4. Three different isolation levels.
Electronics 11 01687 g004
Figure 5. Experimental system block diagram.
Electronics 11 01687 g005
Figure 6. 1D-FFT test results in an anechoic chamber.
Electronics 11 01687 g006
Figure 7. 1D-FFT test results of the target distance of 4 m from the radar.
Electronics 11 01687 g007
Figure 8. The configuration of the proposed antenna of (a) the front view and (b) the exploded view.
Electronics 11 01687 g008
Figure 9. The simulated E-field distributions at 2.45 GHz of the antenna: (a) Without the teardrop-shaped structure; (b) with the teardrop-shaped structure.
Electronics 11 01687 g009
Figure 10. The simulated S21 results of the cases with and without the teardrop-shaped component.
Electronics 11 01687 g010
Figure 11. The S11 results of the proposed antenna.
Electronics 11 01687 g011
Figure 12. The gain results of the proposed antenna.
Electronics 11 01687 g012
Figure 13. The patterns at 24.25 GHz of the proposed antenna.
Electronics 11 01687 g013
Table 1. SNR results for different isolations.
DistanceSNR Corresponding to 50 dB IsolationSNR Corresponding to 27 dB IsolationSNR Corresponding to 18 dB Isolation
2 m11.67 dB3.5 dB0.96 dB
4 m10.09 dB2.16 dB0.77 dB
8 m6.24 dB1.13 dB0.03 dB
Table 2. Comparison of isolation optimization of different methods.
ReferenceIsolationIsolation
Improvement
Method
[16]24 dB6 dBDGS
[17]30 dB10 dBEBG
[17]25 dB6 dBEBG
[18]36.7 dB11 dBEBG
This work>50 dB>30 dBTeardrop structure
Publisher’s Note: MDPI stays neutral with regard to jurisdictional claims in published maps and institutional affiliations.

