1. Introduction
The covert transmission of radio frequency (RF) signals is required in various wireless systems, and mainly used for military purposes. These may include voice communication, data transmission, positioning, and radars [
1,
2,
3]. Such transmissions are termed as low probability of detection (LPD) signals. As opposed to cryptographic or physical layer security techniques, they are intended not only to protect the information from unauthorized access, but to disable a potential eavesdropper from knowing that transmission is actually conducted [
4].
Electronic reconnaissance units are obliged to monitor the RF spectrum in order to detect and intercept any illicit transmission potentially containing secret tactical or intelligence information. Thus, effective methods for detecting LPD signals are necessary. Moreover, knowledge about specific signal parameters is desired, which could be possibly used to intercept transmitted information or to locate the source of emission.
The aspect of detecting LPD signals has been analyzed mainly from an information-theoretic point of view. Most papers assume the transmission model in which Alice (A) covertly sends information to Bob (B) in the presence of warden Willie (W). The analyses provided in these papers mainly focus on the possibility of transmitting a finite amount of data through an additive white Gaussian noise (AWGN) channel with given energy-per-bit, depending on the extent of warden’s knowledge about channel parameters [
5,
6,
7,
8,
9,
10]. Such highly theoretic research provides useful information about the limits of undetected communication; still, it does not cover the methodology of detecting LPD signals.
This paper focuses on the problem from warden’s point of view as he monitors the RF environment, including channel A-W, being a branch of primary communication channel A-B. It is assumed that warden does not know the transmission parameters like transmit power, bandwidth, modulation, exact carrier frequency, etc. However, LPD transmission is intended to be hidden in ambient noise, thus, it is likely to follow the statistical properties of pseudorandom signals. Moreover, due to the presence of a harmonic carrier component, it is considered to be a cyclostationary process [
11]. These features may be exploited to develop detection methods for weak spread-spectrum signals [
12].
Besides the detection of LPD transmission, it is desired to locate its source or estimate the direction from which the covert signal arrives. Some authors recommend using a time difference of arrival (TDOA) method, where source location is determined based on relative propagation delays [
13,
14]. The delay between a given pair of receivers is estimated through cross-correlation. At least three spatially separated receivers are required in this case, which limits the scope of application. In [
15], the covariance information is used for beamforming optimization in MIMO systems. In this paper, the estimate of the covariance matrix is used to determine the direction of arrival (DOA) of the LPD signal.
Non-cooperative LPD detection methods (i.e., using a single receiver) may rely either on simple radiometric approach [
16] or on various transformations of received waveforms. In [
17], the detection is based on the analysis of correlation fluctuations. The authors of [
18,
19,
20] make use of higher-order statistics to detect spread spectrum phase shift keying (PSK) signals, where the order of statistic depends on the order of modulation, e.g., fourth-order for QPSK. In [
21], a power spectral density (PSD) reprocessing method is proposed to evaluate the period of pseudorandom code in weak spread spectrum signals. A detection method for a weak hydroacoustic signal is presented in [
22], where a correlation between segments of the received waveform is analyzed.
In this paper, a new scheme is proposed that may be applied to detect pseudo random spread spectrum signals with very low signal-to-noise ratio (SNR). The presented method is based on multi-antenna reception in order to exploit the spatial correlation properties of weak components. The application of antenna arrays is considered in some works to improve the covertness of LPD transmissions [
23,
24]. In [
25], a spatial correlation between stochastic signals is analyzed for SNR of −13 dB and higher. However, the potential of antenna arrays in detecting weak signals has not been fully recognized.
The performance of weak signal detection is strongly affected by the presence of other signals in an analyzed frequency band, especially narrowband interference. It is necessary to remove such components prior to an LPD detection procedure. Interference mitigation is typically performed in the frequency domain [
14,
19]. A multi-antenna receiver may mitigate interference in the spatial domain, however, due to excess hardware complexity caused by the requirement for a large number of antennas, this approach is not considered in this paper. A simple frequency-domain algorithm is proposed instead.
This paper shows that it is possible to detect pseudorandom LPD transmissions at SNR considerably lower than −20 dB and estimate their direction of arrival with root mean square error (RMSE) not exceeding 10° in presence of narrowband interference.
The remainder of this article is organized as follows. The next section describes the mathematical model used to represent LPD transmission, detection, and direction-of-arrival estimation. The third section describes the verification of proposed algorithms through simulations. Next, a comparison with other solutions is provided. Finally, conclusions and possible research directions are given.
2. System Model
It is assumed that LPD transmission has a form of direct-sequence spread spectrum (DS-SS) signal, where the carrier phase is keyed with a sequence being a modulo-2 sum of a data sequence and a pseudorandom code sequence. As the detector does not have knowledge about any of these sequences, the LPD signal may be simply modeled as an M-PSK signal being modulated with a pseudorandom sequence, assuming that the spreading code period is significantly longer than that the duration of a single bit of transmitted data. Low-order modulation schemes, i.e., BPSK or QPSK, are expected in LPD applications, as they provide a relatively low bit error rate (BER) for low SNR values, compared to higher order PSK or QAM modulations.
The complex form of transmitted BPSK signal is described as follows:
where
is the transmit power,
represents carrier frequency, and
is a bipolar sequence corresponding to modulo-2 sum of data sequence and the spreading code. As the LPD signal is spread on a wide frequency range, it is subject to inter-symbol interference (ISI) due to multipath propagation. In order to mitigate the effect of ISI, root-raised-cosine (RRC) filtering is applied to the baseband waveform of the transmitted signal [
26]. Thus, the
component may be modeled as:
where
is the
-th element of the pseudorandom sequence,
is the duration of a single chip, and
represents the impulse response of RRC filter. Similarly, a QPSK modulated signal may be modeled as combined binary modulations of in-phase (I) and quadrature (Q) carrier components:
where
and
represent independent pseudorandom baseband components.
2.1. Detection of LPD Transmission in AWGN Channel
Assuming transmission in AWGN channel, the received signal may be modeled as [
27]:
where
represents signal attenuation,
is the received signal power, and
is the propagation delay. Complex additive noise
has independent real and imaginary components which follow Gaussian distribution
. For a given SNR expressed in decibels, noise variance may be evaluated as:
The proposed detection method is based on the evaluation of cross-correlation function (CCF) between outputs of any two sensors of the receiving antenna array. It is assumed that the physical separation between sensors is small enough so that respective spatial channels between transmit antenna and each receive antenna are strongly correlated. In contrast, noise components at the sensors’ outputs are assumed to be independent from each other.
The CCF for sensor outputs
and
is generally defined as [
16]:
where
represents complex conjugate and
is the relative time delay between components. When processing digital waveforms of finite duration, CCF is usually calculated using forward and inverse fast Fourier transform (FFT/IFFT) [
28]:
where
is the sample index and is
the time offset between waveforms expressed in a number of samples.
If a signal is present on both sensor outputs, and SNR is high enough, a distinct peak is observed in the magnitude of CCF. Assuming that the relative propagation delay is much shorter than the sampling period, the maximum value occurs for .
The detection procedure may be formulated as a hypothesis test, where:
The decision whether
is true is based on the value of the parameter
is defined as the peak-to-floor ratio of the CCF magnitude:
where
is the average value of
after discarding 10% of the largest samples and 10% of the smallest samples.
The probability of correct detection is defined as:
where
is the decision threshold evaluated for the acceptably low probability of false alarm:
As a rule of a thumb, is expected to not exceed 1%, however, it may be set lower for more critical applications.
The analysis of as a function of SNR provides information about the lower bounds of signal quality required for confident detection, e.g., .
Apart from SNR, the value of changes with the duration of analysis. Assuming that LPD transmission is active throughout the whole period of reception, extending the duration of observation allows signal detection, with satisfactory confidence level, at lower SNR.
2.2. Direction-of-Arrival Estimation
Using an antenna array provides the means for spatial processing of received signals, which include DOA estimation. Subspace-based algorithms such as MUSIC [
29] or ESPRIT [
30] are commonly used in such applications. However, these are generally applied only to signals which are distinguishable from noise, especially narrowband ones. This case does not refer to low-power spread-spectrum signals. As an alternative, an approach based on phase interferometry is proposed. In this method, DOA is estimated by evaluating relative carrier phase delays between sensors of the array. Since the geometry of receiving antenna array is known, the given DOA corresponds to specific phase delays. If the carrier wavelength was known, two-element antenna array would be sufficient to estimate DOA in a 180 degree range. However, the carrier frequency of the LPD signal is generally unknown, thus, an additional sensor is required to create a set of equations.
A uniform circular array (UCA) consisting of three sensors was chosen, due to its symmetry and relatively small form factor. The arrangement of sensors is presented in
Figure 1.
The distance between array elements should be kept close to the half of expected carrier wavelength. It may be set to be the half of wavelength in the center of the analyzed frequency band, assuming that the bandwidth is at least one order of magnitude smaller than center frequency. Under this condition, phase delays relate to DOA according to the following equations:
where
is the relative phase delay between wave impinging on
j-th and
i-th sensor,
represents the DOA, and
is the carrier wavelength. It should be noted that there may exist a displacement between the phase center and physical center of each antenna. Thus, a proper array calibration is required [
31].
From the Equations (12) and (13), a formula for DOA calculation is derived:
The phase delays may be evaluated from the estimate of the input covariance matrix
, as arguments of its respective elements [
32]:
where
represents the samples vector of the signal received through the
i-th sensor,
is the mean value, and
is the Hermitian transpose.
As the distance between array sensors is approximately half-wavelength, when the signal arrives from the direction parallel to the baseline, the phase delay is close to or . In such a case, phase wrapping may affect the phase delay estimation and cause a significant error in the estimated DOA. To avoid such a situation, phase wrapping is corrected based upon the value of the phase delay between the other pair of sensors (see Algorithm 1).
![Electronics 10 02566 i001]()
2.3. Mitigation of Narrowband Interference
Signals with relatively high power spectral density residing in the analyzed frequency band need to be mitigated before the detection of low-power spread-spectrum signal is performed. Otherwise, a number of overlapping correlation peaks may exist, making it practically impossible to detect the peak corresponding to the LPD transmission and estimate the DOA.
A method based on FFT blanking is proposed to excise the frequency spectrum components that contain interferences. First, the FFT spectrum covering the whole analyzed frequency band is uniformly divided into a number of narrow sub-bands. The average value of the PSD is calculated in each sub-band, and a threshold is set as a median value from the results. Next, the frequency bins contained in sub-bands where the mean PSD exceeds the threshold value are nulled (their magnitude is set to zero). Nulling is performed in all three spectra of the outputs of respective sensors in the antenna array. Eventually, inverse FFT is performed to restore the time domain form of analyzed waveforms.
It is expected that the detection of LPD transmission should be possible when narrowband interferences occupy up to 15% of the analyzed frequency band.
3. Performance Evaluation
The performance of proposed methods was assessed through a series of simulations in MATLAB. First, the detection limits were evaluated in terms of the SNR and duration of analysis. Next, the DOA estimation error was estimated both in the AWGN channel and in the presence of narrowband interference.
3.1. Signal Detection
The initial conditions for simulation were set as follows. The test waveform of 1 s duration was generated with a sampling rate of 2 Ms/s. The noise PSD was uniform in the whole analyzed frequency band. The carrier frequency of the LPD signal was offset by −200 kHz from the center frequency, and the pseudorandom code chip rate was set to 0.5 Mchip/s. The RRC filter with a roll-off factor of 0.25 was applied, which limits the LPD signal bandwidth to approximately 640 kHz. The LPD signal was combined with Gaussian noise, and its variance was adjusted to obtain the desired SNR value between −30 dB and −10 dB.
Figure 2 shows a power spectrum of the LPD signal compared with spectrum of the same signal plus noise at SNR −20 dB. As the noise variance was significantly greater than the power of signal, the resulting frequency spectrum is flat, meaning that simple spectrum analysis does not discover the presence of the signal.
In the first simulation, the value of the
parameter was estimated as a function of SNR. A series of 1000 Monte Carlo trials was conducted for each SNR value. The results are presented in
Figure 3. Due to clarity of presentation,
is plotted in logarithmic scale. It is visible that for SNR above −26 dB, the relation is nearly linear. The lower bound is reached for the
value observed when white Gaussian noise is received without signal. This value was estimated to be approximately 6.6 dB, and is independent from noise variance and the duration of observation.
The influence of the LPD signal duration on
was evaluated as well. Simulations were repeated for durations between 0.5 s and 5 s with SNR −15 dB. The results plotted in
Figure 4 show that the
value grows proportionally to the square root of the signal duration. For example, if duration is extended four times,
doubles (increases by 3 dB). This means that a longer observation period may result in better detection performance. However, in practice, LPD transmissions are kept as short as possible to make the detection more difficult.
The simulations were conducted both for a BPSK and QPSK modulated LPD signal. In each case, the results were very similar, as shown in
Figure 5, proving that detection performance does not depend on the order of PSK modulation. It was also verified that the bandwidth of the LPD signal does not affect the value of
at a given SNR, as long as the signal spectrum is fully contained in an analyzed frequency band.
In order to estimate the probability
, detection threshold values were evaluated first. For probabilities of false alarm
of 1% and 0.1%, the approximate
values (in linear scale) are 5.1 and 5.4, respectively. For these threshold values, the probability of detection was estimated as a function of SNR. The results are presented in
Figure 6. It may be seen that probability of detection exceeds 99% at SNR of −24 dB for both
limits. When SNR is −25 dB,
is approximately 81% for
and approximately 64% for
. Thus, it may be stated that an SNR of −24 dB is the minimum signal quality level required for confident detection, assuming that the LPD signal is continuously received within a 1 s period.
3.2. Accuracy and Precision of DOA Estimation
The specific geometry of the antenna array and nonlinear equations relating DOA with carrier phase delays cause the accuracy or precision of DOA estimation to vary with the actual DOA. The mean error and root mean square error (RMSE) were investigated as functions of DOA. DOA was changed with 1° step in range from −180° to 179°. For each direction, 100 Monte Carlo trials were conducted, assuming that the LPD transmission is received during 1 s with an SNR of −15 dB. In the simulation, it was assumed that the center frequency
of the analyzed band is 1 GHz, and that the distance between array sensors is:
where
is the velocity of wave propagation. Like in the previous simulation, the carrier frequency of the LPD signal was offset by −200 kHz from
.
In case of a mean error, being a measure of estimation accuracy, it was found that, independently from DOA, it tends to zero when the number of trials is increased. This means that in the AWGN channel, for perfectly calibrated sensor array, there is no systematical error between the estimated DOA and true DOA.
On the other hand, the precision of estimation, represented by RMSE, depends on the true DOA. The results plotted in
Figure 7 show that error changes harmonically within a 180° period. A maximum RMSE of approximately 0.42° is observed for DOAs −150° and 30°, i.e., when signal impinges on the array from the direction perpendicular to the baseline connecting sensors 2 and 3. In contrast, when the signal arrives from the direction parallel to this baseline, a minimum error of approximately 0.25° occurs.
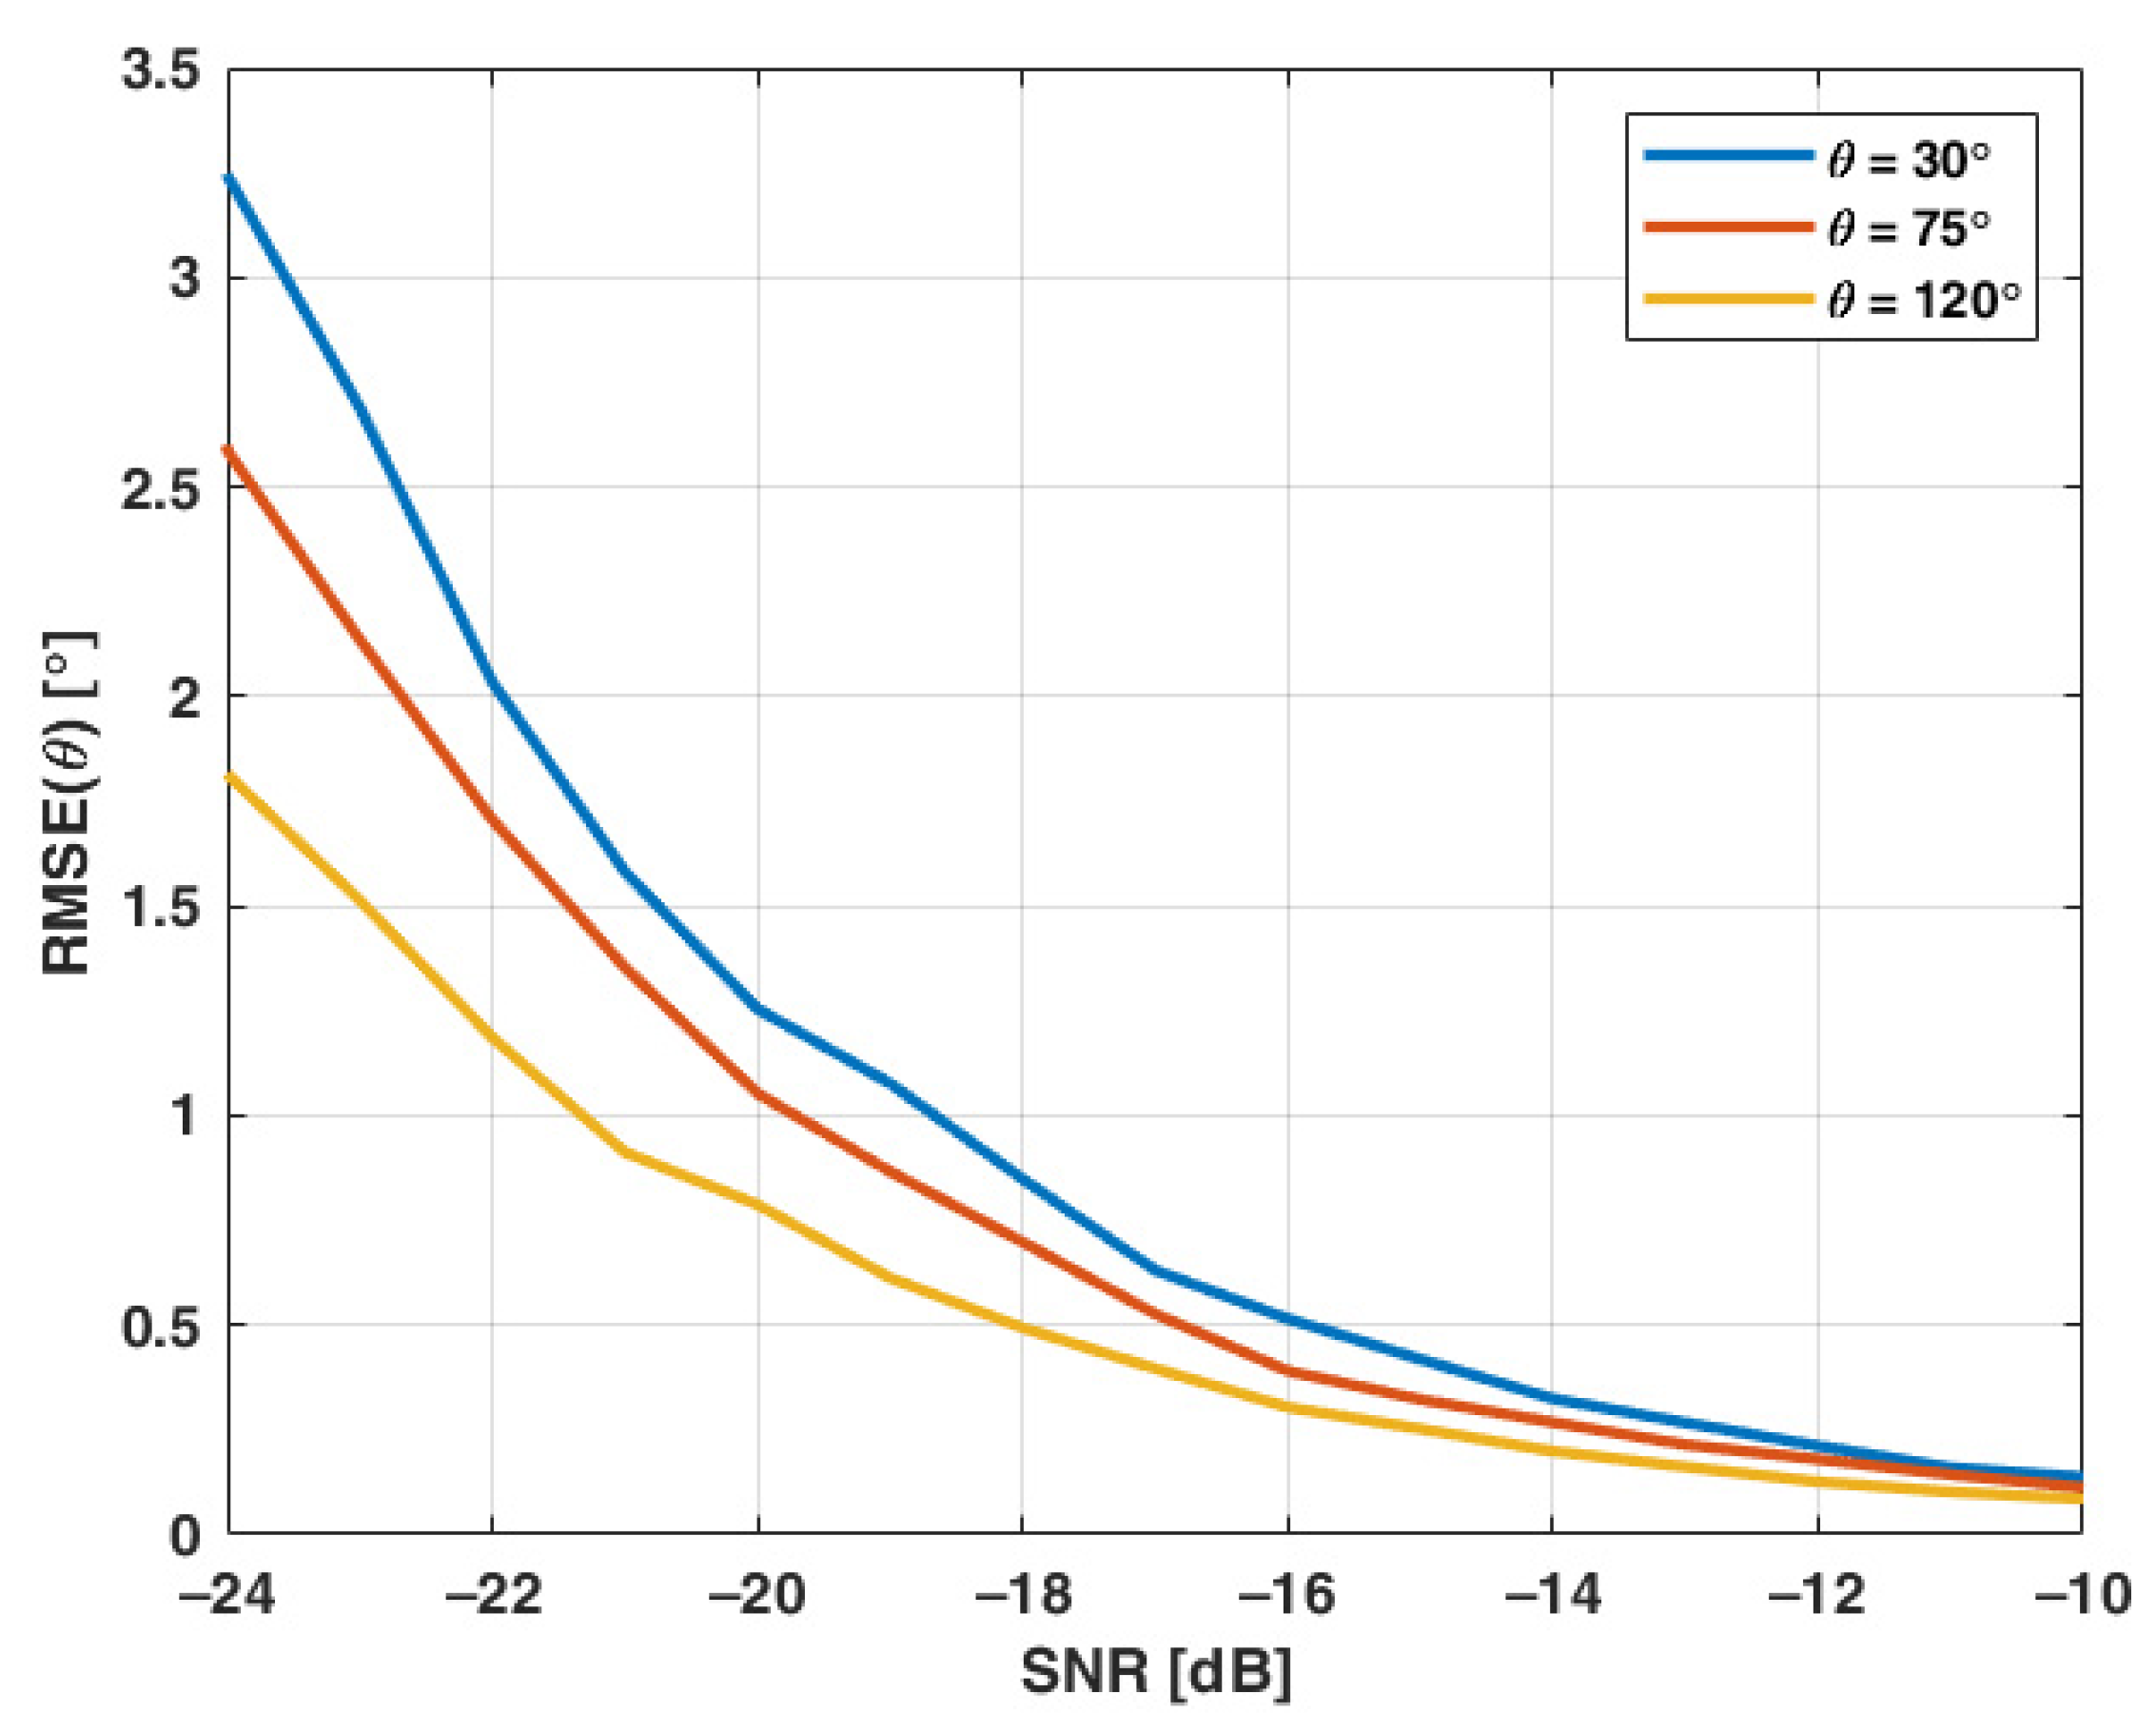
In further simulation, the influence of SNR on DOA estimation precision was investigated. Three DOAs were selected, respective to different RMSE levels, i.e., 30°, 75°, and 120°. The results are shown in
Figure 8. It may be seen that DOA may be estimated with RMSE not exceeding 1° when the SNR is not lower than −18 dB.
3.3. Narrowband Interference Mitigation
When multiple signals are present in an analyzed frequency band, each of them contributes to the peak of CCF. This results in an increase in the false detection rate. Interference cancellation techniques are applied to mitigate the impact of undesired signals, but their residuals may still affect the correlation peak. This presents difficulty in assessing the actual performance of LPD detection. However, DOA estimation may still be evaluated, assuming that an angular separation exists between the source of interference and the source of the LPD signal.
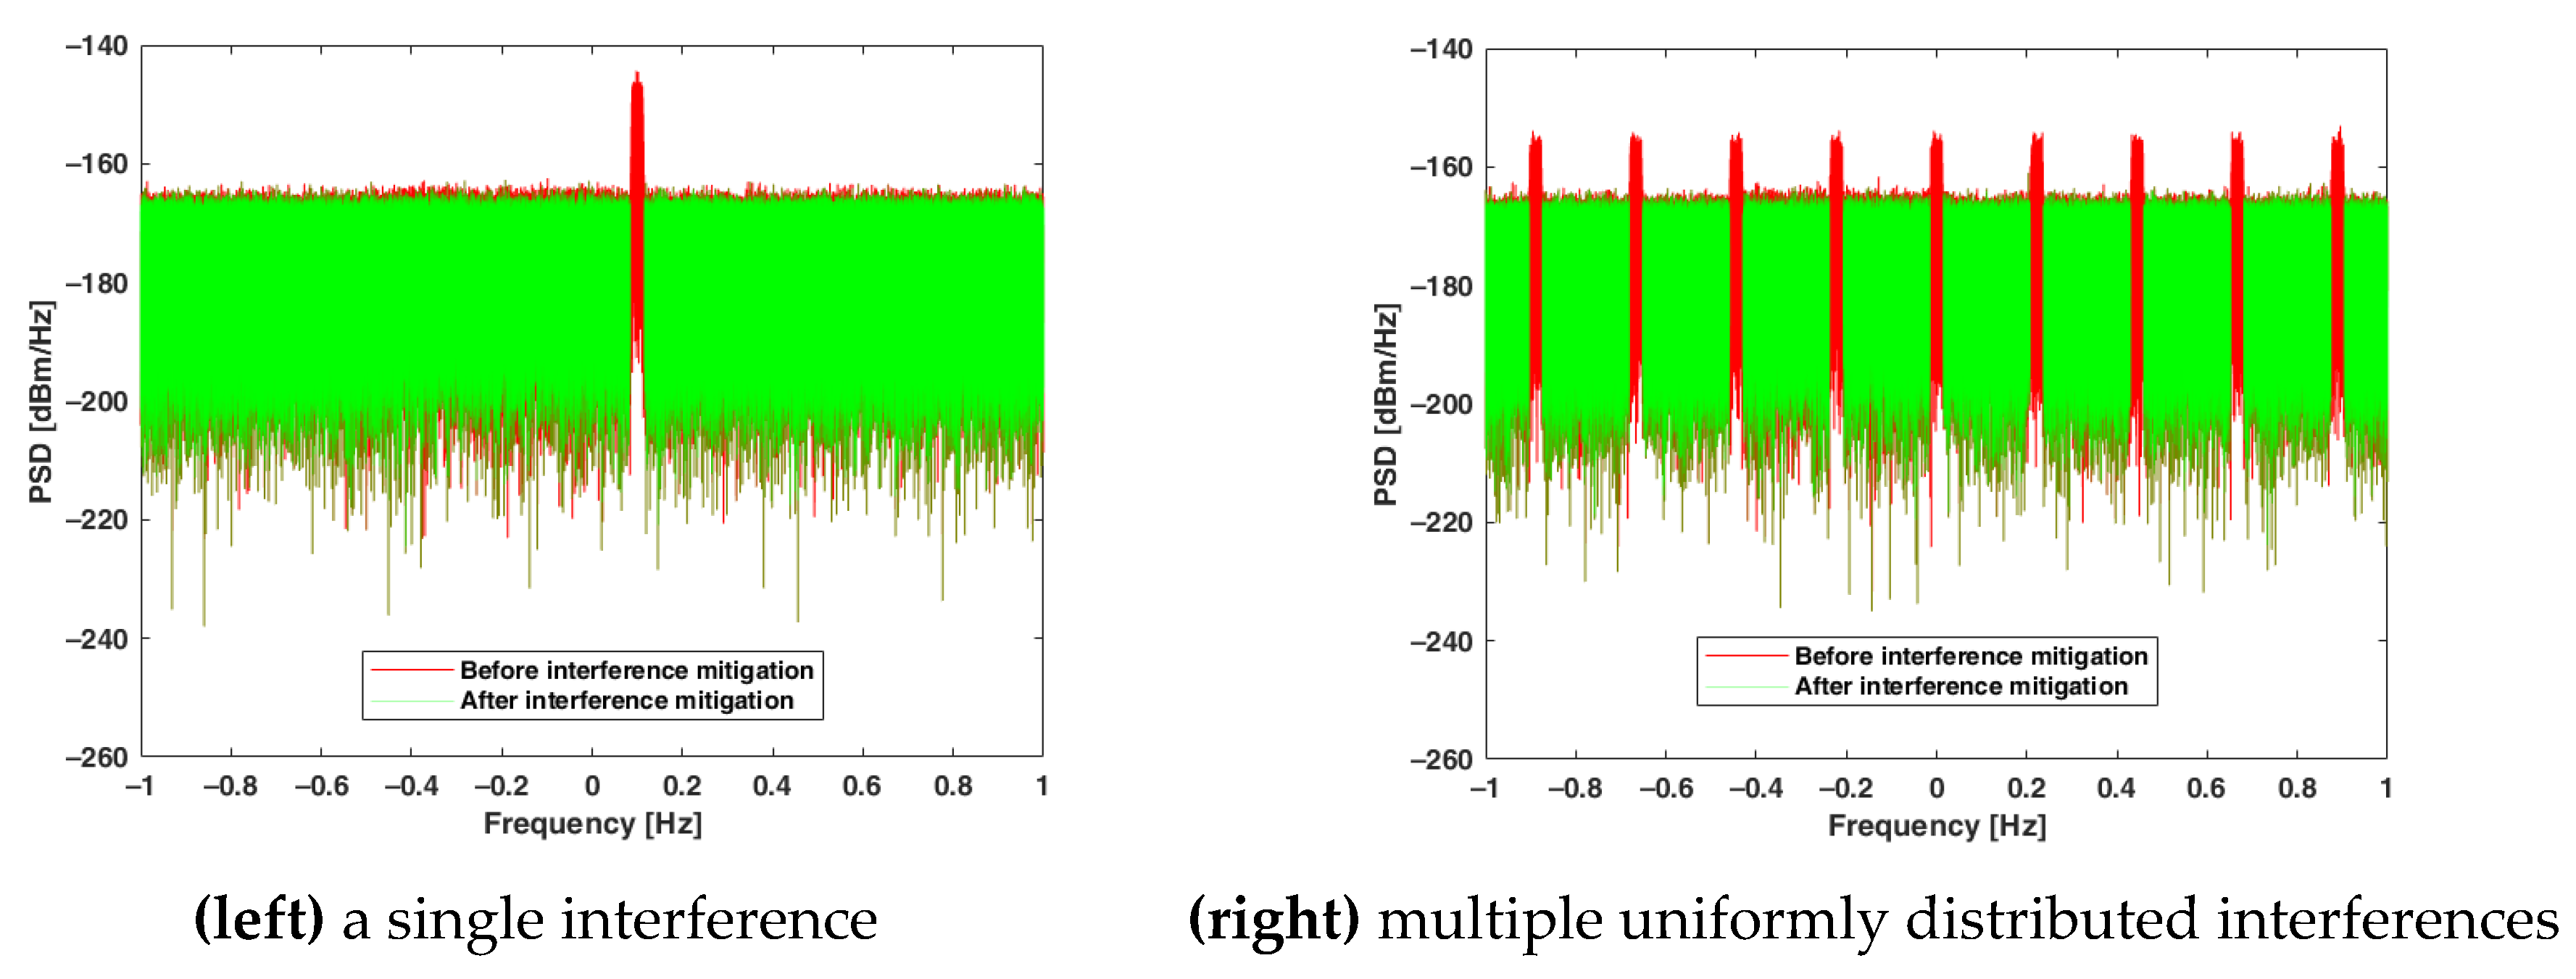
Simulations were conducted for two scenarios. In the first case, a single narrowband interference was introduced with an interference-to-noise ratio (INR) of 0 dB. Its waveform was generated similarly to an LPD signal, while the symbol rate was set to 25 ksymb/s, which resulted in approximately 32 kHz bandwidth after RRC filtering. The carrier frequency was offset by +100 kHz with respect to the center frequency and +300 kHz with respect to the carrier frequency of LPD signal.
In the second scenario, it was assumed that interferences occupy approximately 15% of the analyzed frequency band. The interference from the previous scenario was replicated nine times and located uniformly within the analyzed frequency band. It may be seen in
Figure 9 that three interference components exist in the band occupied by the LPD signal. As each interference is approximately 32 kHz wide, they all occupy 288 kHz, which corresponds to 14.4% of the 2 MHz band. The power of the combined interferences was adjusted to keep 0 dB INR level. The INR represents the ratio between the total power of interference and the variance of noise in the whole analyzed frequency band.
In both scenarios, the LPD signal arrived from direction = 30°, while interference DOA was set to 100°.
The result of interference mitigation is visible in the frequency spectrum for both scenarios as shown in
Figure 10. The bins in the green plot are nulled in the frequency ranges where the original PSD (red plot) exceeds the threshold level. At the same time, all bins where PSD is below the threshold, including the majority of the bins in the LPD signal band, are preserved.
The performance of interference mitigation was assessed through simulations for various INR levels at SNR −15 dB. The RMSE of the estimated DOA was evaluated for three angles of arrival mentioned in p. 3.2. The INR range was set from −20 dB to 20 dB. For each angle and each INR value, 100 trials were conducted. The results are presented in
Figure 11. In case of a single narrowband interference, the RMSE for INR lower than 5 dB does not exceed 1° in most cases. For larger INR, the error increases to approximately 3° when interference power is 20 dB above noise. The deterioration of interference mitigation in this case is caused by the fact that, although the main spectral lobe of interference is nulled, its side lobes are too low to be effectively nulled, still causing substantial distortion to the LPD signal.
In the second scenario, a local maximum is visible in the RMS error plot. It is caused by the fact that the power of interference is equally distributed into nine frequency components. When the INR is approximately at −17 dB, the PSD of interference is too low to fully mitigate it, yet it is high enough to negatively affect the DOA estimation. Similar to the first scenario, the increase in the DOA estimation error is observed when the INR exceeds 5 dB. In general, the RMSE in the second scenario is greater than in the first scenario, but does not exceed 9°. Assuming Gaussian distribution, it may be considered that individual DOA estimates are in the sector of approximately ±27° from true DOA. The accuracy of estimation may be further improved through averaging the results.
4. Comparison with Other Solutions
In order to assess the described method of LPD signal detection, it is compared with other solutions proposed in the literature. The comparison is based on the minimum SNR value which is required to obtain the acceptable probability of correct detection, i.e., .
According to the results given in [
13], an SNR of at least −15 dB is required to obtain 60% probability of detection with 5% false alarm probability. The duration of observation is not specified. The approach proposed in this paper requires approximately 10 dB lower SNR to achieve the same result at a 1% false alarm rate for one-second of continuous transmission.
Some LPD detection procedures are based on the observation of peaks at detector output. In [
16], an SNR of at least −14 dB is required to observe a clear peak. However, the probability of false alarm is not evaluated.
The method proposed in [
17] is analyzed in time and frequency domains. The latter performs better, providing a 50% probability of detection at −25 dB. This is similar to the results obtained in this paper. However, it has some drawbacks. It is applicable only to QPSK modulation, and it requires a large number of accumulations over time. Without accumulations, a
of 50% is achieved for SNR −20 dB.
The approach given in [
19] achieves similar detection performance to the method described in this paper, yet it is applicable only for QPSK signals.
In [
21], a
of over 90% is achieved for an SNR above −5 dB, which is a relatively high value. However, the results are obtained for hydroacoustic signals in a real-world environment, which substantially differs from an AWGN channel.
The above comparison proves that the proposed method outperforms other approaches in terms of the probability of detection and independence of PSK modulation order. Moreover, it is joint with DOA estimation, which is unprecedented in LPD detector solutions.
5. Challenges and Further Research
The outcome of this paper is intended to be further verified through laboratory and real-world experiments with the use of a multi-channel phase-coherent software-defined radio (SDR) receiver.
It should be noted that the performance of DOA estimation depends on the distance between array elements. The typical spacing between sensors is kept approximately at half carrier wavelength. In practice, the carrier frequency of the LPD signal is unknown, and it is necessary to scan various frequency bands in a possibly wide range. This complicates the design of antenna array in terms of element spacing. One solution to this problem is to mechanically adjust the sensor separation, depending on the center frequency of the currently scanned band. Another possibility is using a switchable antenna array, composed of sub-arrays designed for different frequency bands. Eventually, special processing techniques for sparse arrays may be applied to resolve phase ambiguity, e.g., [
33]. It must also be noted that elements of the array should be properly designed to cover a possibly wide frequency band and provide high efficiency [
34].
The limitation of the proposed method is that it only provides information about the DOA of LPD transmission, while its other parameters, including carrier frequency and bandwidth, remain unknown. The carrier frequency estimation based on wavelength , derived from (12) or (13), is inaccurate. Thus, it is recommended to combine the proposed method with other techniques aimed at evaluating other parameters of interest.


