Article

Implementation of an Environmental Monitoring System Based on IoTs

1
Department of Electronic Communication Engineering, National Kaohsiung University of Science and Technology, Kaohsiung 811213, Taiwan
2
Department of Electrical Engineering, National Sun Yat-Sen University, Kaohsiung 80424, Taiwan
*
Author to whom correspondence should be addressed.
Electronics 2022, 11(10), 1596; https://doi.org/10.3390/electronics11101596
Submission received: 3 April 2022 / Revised: 6 May 2022 / Accepted: 10 May 2022 / Published: 17 May 2022
(This article belongs to the Special Issue Intelligent Signal Processing and Communication Systems)

Abstract

:
The objective of this paper is to study smart home network systems and the application of LabVIEW to develop a human machine interface (HMI), so that traditional instrument panels can be replaced with virtual panels to reduce the consumption of hardware resources. For energy efficiency, MATLAB’s fuzzy toolbox is used as the computing center, which is applied to the lighting system and air-conditioning system. This paper also uses LabVIEW’s common gateway interface (CGI) tools to develop remote monitoring functions, as well as to embed the network-related syntax into the web pages. The user can not only use computer equipment, but can also use their mobile devices to connect to the networks and conduct remote monitoring, which enhances convenience and security. This paper is finally tested with actual cases, and the electricity consumption with and without fuzzy logic control is compared. The test results show that fuzzy logic control can reduce electricity consumption. As well as using computers to test the remote monitoring functions, cell phones and pads were used.

1. Introduction

A smart home is an automated home with artificial intelligence. In addition to improving the quality of life, in terms of energy saving, it can also help a family to reduce energy consumption and reduce household expenses. The amount of electricity a family can save may not be much, but the combined reduction in energy consumption of every family in the world would be very significant. Therefore, how to turn an ordinary home into a smart home is an important focus of future development.
In terms of the Internet of Things (IoT) technology [1,2], it is no longer just a dream to realize a smart home. All kinds of home appliances are developing towards intelligence to realize comprehensive functions, such as energy saving and convenience. In the future, home appliances will no longer play a passive role, they will actively communicate with people and other home appliances, and have automated functions. In terms of control, this paper uses three types of control hardware to analyze their advantages, disadvantages and timing of use [3,4].
The aim of this paper is to develop an HMI with LabVIEW graphic control software [5]. The server-side interface has real-time monitoring and control-related objects, and manages all data, such as digital signals and control signals. In addition to the server-side interface, other user-side HMI are also developed. The server and the client use the local area network (LAN) or the internet for data transmission and object control to achieve the function of remote monitoring [6]. Less manpower and fewer material resources are required for remote monitoring than traditional monitoring, so the cost of system development can be reduced [7,8]. Working on the assumption that not every user has installed graphic control software, a real-time monitoring website was developed to allow users to monitor and control through their browser, without graphic control software, and reduce software-related costs. Graphic control software was used in conjunction with network syntax to transmit information to web pages in real time. Network security was enhanced through Common Gateway Interface (CGI), Active Server Pages (ASP) and other syntaxes to prevent people from invading web pages [9].
The paper uses the fuzzy logic control theory to achieve the purpose of energy saving. MATLAB’s fuzzy toolbox was combined with LabVIEW. Because MATLAB performs better calculations, it serves as the computing center for the entire system [10]. LabVIEW is based on the interface, as a bridge between the human and machine, making it easier for users to operate. The data can be analyzed clearly at a glance, and, therefore, the efficiency of processing data can be improved.
This paper aims to develop a smart home monitoring system. The software application developed by National Instruments (NI) adopts the LabVIEW graphic control software. Many virtual instruments can not only reduce the software development time and hardware resources for developing graphical control and human–machine interfaces, but can also be combined with other languages. In terms of instrument functions, it has more analysis functions than traditional instruments [3,4]. This paper is organized as follows: Section 2 illustrates architecture and hardware control methods; Section 3 describes fuzzy logic theory and algorithms; Section 4 provides the experimental results; and Section 5 describes this paper’s conclusions and lists future works.

2. Materials and Methods

This paper mainly explains three different hardware control methods, and the planning of each object on the relevant hardware. In addition to the real-time on-site monitoring of the server itself, the planned goal can also achieve remote monitoring through network technology, to reduce the consumption and related costs. The main components of the LabVIEW software are divided into front panel and block diagram. The front panel can also be called the human–machine interface. Through this panel, personnel can use and observe the changes in its output more conveniently, and can clearly understand the results. Usually, the input components are called control elements, and the output graphics are displayed. Each component of the front panel will find the corresponding block in the block diagram, which is called the formula of VI [5]. Figure 1 shows the basic architecture and login settings of CGI. Figure 2 shows the internal settings of the link structure diagram, which refers to the program structure linking HTML and HMI. When linking to a specific web page, the web page will ask the server to activate the program and start to receive the commands issued on the web page. When the command is received, it will start to search for the program and action to be executed.

2.1. PCI Card, Ethernet and Zigbee

PCI cards have PC-based functions, use a CPLD (Complex Programmable Logic Device) as the PCI interface and I/O control, and haves A/D and D/A functions. There are 8 groups of A/D channels and 2 groups of D/A channels in total, and these can be expanded to 8 groups of PCI cards with high stability. The voltage input range is 0~5 V, and the current output is about 0~30 mA. The hardware used in this paper is ICP DAS’s Ethernet host (I-7188EX) and three sets of extended control modules: analog output module (I-7024), analog input module (I-7017Z), and digital output module (I-7045). Lastly, a set of wireless ZigBee host ZB-2550 and a set of receiving terminal ZB-2060 [11,12] can be connected.

2.2. Circuit Design of Monitoring Objects

The monitoring objects developed in this paper process the signal via PCI card, Ethernet, ZigBee, and transmit it to the HMI. The monitoring objects of the main capture system are a brightness capture object and temperature capture object [13,14].

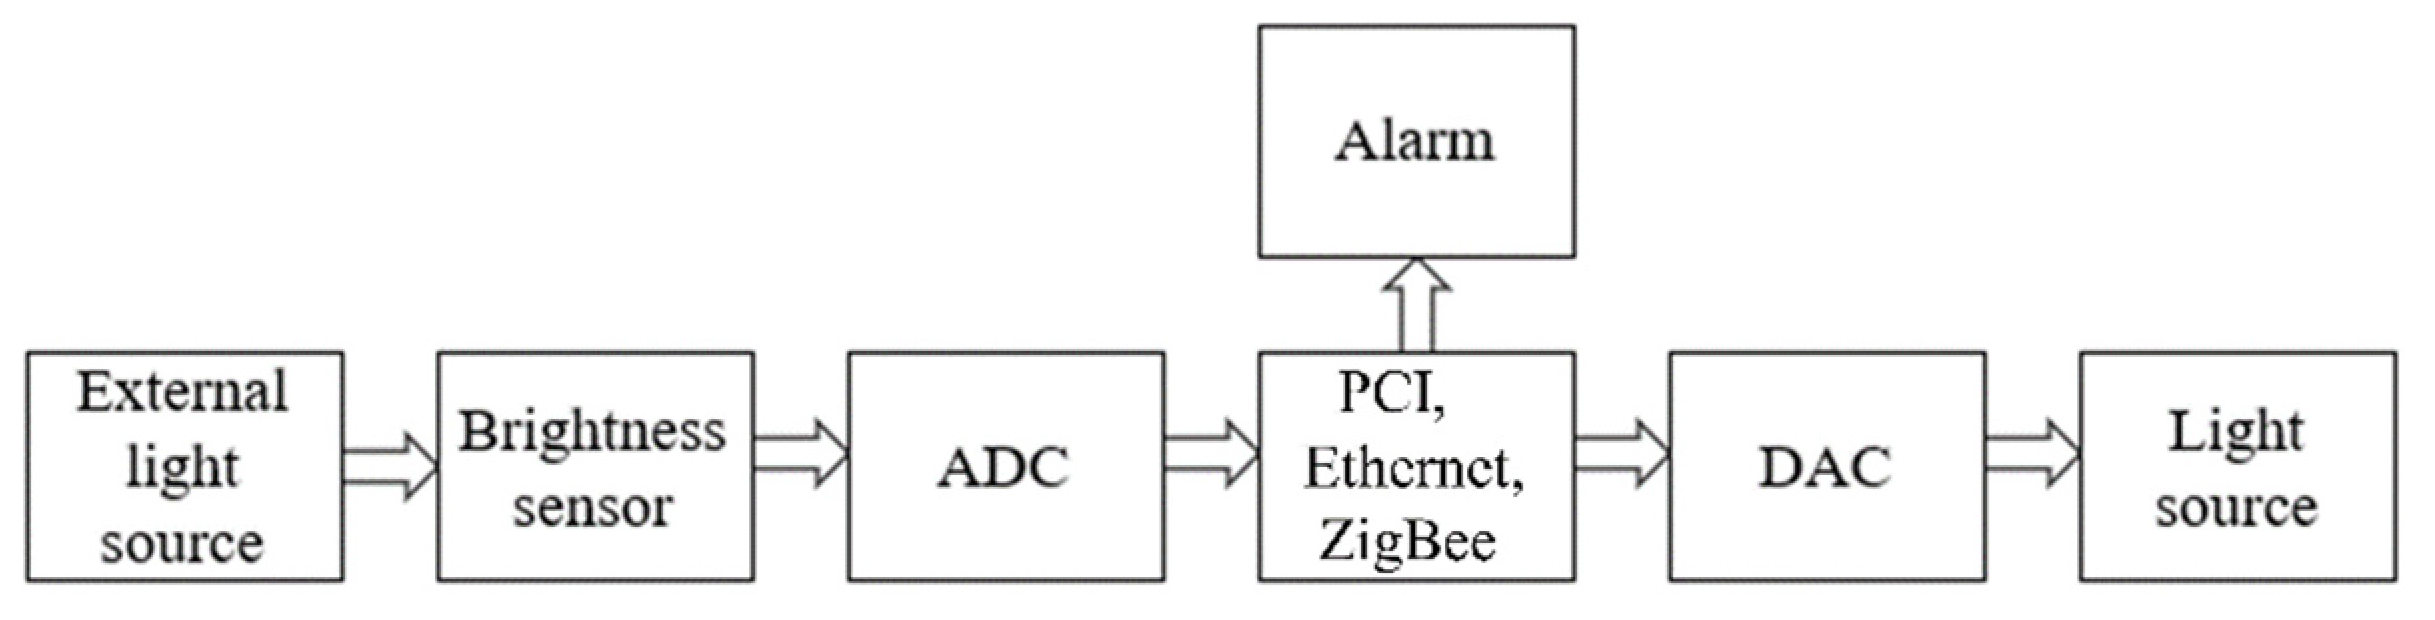
2.2.1. Brightness Capture System

Figure 3 shows the circuit flow chart of the brightness capture system. The external light source signal is transmitted to the A/D conversion circuit through the brightness sensor. The analog signal is converted into a digital signal and sent to the controller, and the signal output by the controller is sent to the D/A conversion circuit. The signal is converted from digital to analog and sent to the amplifier. The current signal is amplified and sent to the LED to control the brightness of the LED [15]. The brightness sensor used is S1133, which is a photodiode object, and its operating temperature is −10 °C to +60 °C.

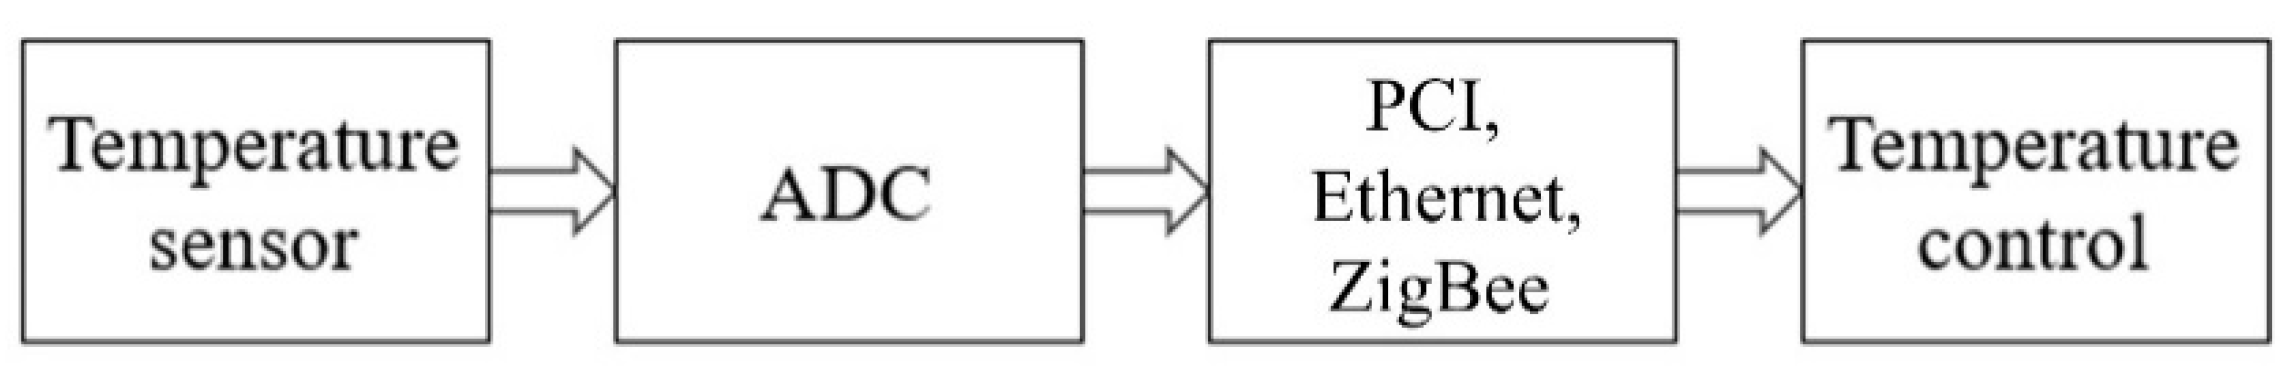
2.2.2. Temperature Capture System

Figure 4 shows the circuit flow chart of the temperature capture system. The external temperature signal is transmitted to the A/D conversion circuit through the temperature sensor. This circuit converts the analog signal to a digital signal and sends it to the computer.
The temperature sensor used is AD590, which is a current-type sensor that converts temperature into current. The AD590 has a temperature detection range of −55 °C to +150 °C; an excellent linearity value of ±0.3 °C; a power supply voltage range of 4 to 30 V, and can withstand a forward voltage of 44 V and a reverse voltage of 20 V; the parts will not be damaged if connected reversely, and better sensitivity.
The relationship between the temperature and current of AD590 is 1 μA/°C. When the temperature rises by 1 °C, the current rises by 1 μA.

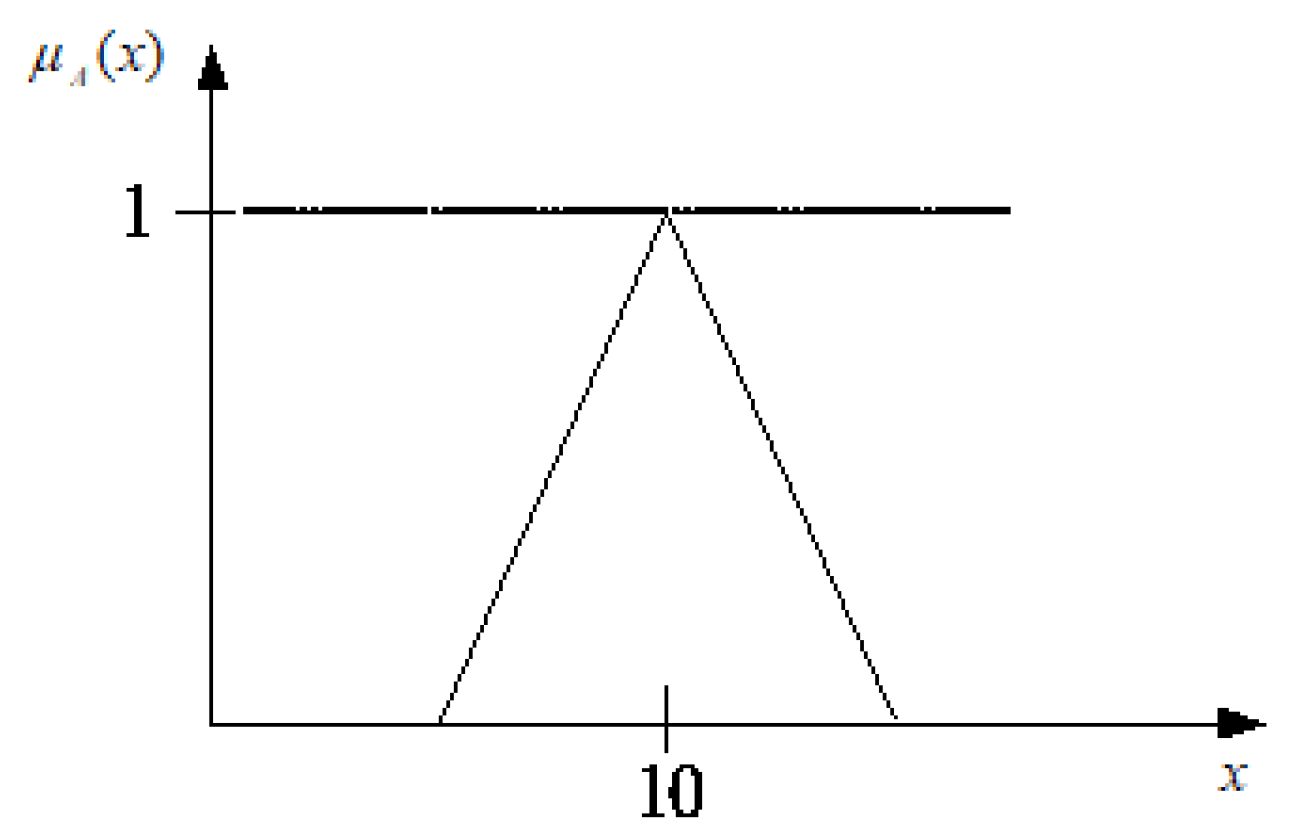
3. Fuzzy Logic Theory

3.1. Fuzzy Set

The biggest difference between fuzzy sets and crisp sets is that fuzzy sets do not belong to binary logic, nor can they clearly distinguish which set the elements belong to [16,17]. The so-called ambiguity is the existence of “yes” or “no”. At this time, it is represented by the interval of one (yes) and zero (no). In other words, it is the difference between “more” or “less” in degree. According to this argument, the number constituted by the evaluation value at the time of evaluation is a fuzzy number. When the evaluation value is 10, it means that the true degree of “is 10” is 1. On the contrary, when the evaluation value is not 10, it means that the true degree of “not 10” is between 0 and 1, as shown in Figure 5.
Some things in life can be clearly distinguished, while others are difficult to distinguish clearly, that is, they contain fuzzy and ambiguity. The fuzzy sets are similar to people’s thinking model, expanding each element from binary logic to many-valued logic. In addition to using zero and one to represent the attribution value, a value between zero and one can also represent this attribution degree. Considering that the characteristic function of the set A ˜ is between zero and one, the degree to which x belongs to the fuzzy set A ˜ is different. Therefore, when μ A ˜ ( x 1 ) < μ A ˜ ( x 2 ) , it means that the degree of x 1 A ˜ is smaller than the degree of x 2 A ˜ . When set A ˜ has an ambiguous element attribution relationship, it is called a fuzzy set. The function describing its fuzzy characteristics is often called the attribute function μ A ˜ ( x ) . When μ A ˜ ( x ) is closer to one, it means that x belongs to A ˜ more.
The fuzzy set can be defined as follows:
A ˜ = { ( x , μ A ˜ ( x ) ) | x X } , μ A ˜ ( x ) = [ 0 , 1 ]

3.2. Fuzzy Rules

For the entire fuzzy logic control system, fuzzy rules are the core of the system, because the control system uses fuzzy rules as the basis for judging output. A fuzzy logic control system is generally a system that uses rules for decision making, and the rules are formulated by human experience or system requirements. Generally speaking, the rules are represented by IF-THEN logic control instructions. The design of fuzzy rules is generally written as a simplified table to represent fuzzy rule statements, and this is called a fuzzy logic control decision table. Since fuzzy logic control is composed of rules in the form of language, the operation of the entire control system can be easily understood through the rules. The rules can be modified for a certain part of the system to improve the control of the system.
The above description explains that the system must fuzzify the input value; in other words, the clear value is converted into a fuzzy set. The same is true for the output of fuzzy logic control, transforming the fuzzy set into a clear value. If it is to be converted into a clear value, it must be defuzzified, as shown in Figure 6.

3.3. Application of Fuzzy System

This paper applies fuzzy logic control to smart homes and adds artificial intelligence to control home appliances. The home appliances controlled are electric lights and air conditioners. In terms of fuzzy characteristics, brightness, temperature and electricity consumption all have fuzzy characteristics.

3.3.1. Fuzzy Logic Control—Lighting

Electric lighting is one of the most indispensable household appliances in the home, and it can be used at any time. In the case of traditional lighting systems, the only way to control an electric light is to turn it on and off. There is no other choice; this system lacks flexibility and it must be controlled by personnel. At present, although there is dimmable lighting equipment, lighting systems are generally manual and there is no artificial intelligence. Therefore, this paper will add fuzzy logic control to a lighting system to provide it with artificial intelligence, and this shall be referred to as an intelligent lighting system.
This system will determine how much illuminance is currently needed, based on the brightness and electricity consumption. Not only can the illuminance be automatically adjusted, but unnecessary waste can also be reduced. For example, if the current outside illuminance is sufficient and the electricity consumption is moderate, the system will reduce the output voltage of the lighting system to reduce the indoor brightness and electricity consumption, thus reducing the indoor illuminance sufficiently to reach the recommended illuminance [18,19,20].
This system fuzzifies the clear values of the illuminance value and the electricity consumption as the fuzzy input value. After fuzzy inference, the output voltage value is used to control the electric light. The reason why LEDs are chosen for electric lights is because LEDs have excellent features, such as power saving and durability. This system uses the direct current as the output control, so LEDs are the main choice for light bulbs. The specification of the LED is a white LED. Because the light bulb is used for experimental purposes, a low-cost small LED is selected to reduce the experimental cost. The current is about 20 to 30 mA, and the maximum withstand voltage is about 4 V.
The fuzzy rules used in this experiment were established by studying the relevant literature and expert experience, as shown in Table 1.

3.3.2. Fuzzy Logic Control—Air Conditioner

Air conditioners are home appliances that consume a vast amount of electricity. Therefore, this system adds fuzzy logic control to the air-conditioning temperature setting. The temperature is set according to the electricity consumption and the indoor temperature. The user does not need to control the air conditioner. The system determines how many degrees the air conditioner should be set to, thus maintaining proper temperature and reducing the electricity consumption of the air conditioner.
The air conditioner is written by LabVIEW to simulate the condition of the air conditioner when it is running [21]. All parameters are hypothetical values, and there is no need to consider future applications, such as connecting to the real machine. The simulated air conditioner is an inverter air conditioner, and the maximum electricity consumption during operation is set to 900 W.
An inverter air conditioner is more energy efficient than a traditional air conditioner. The reason for this is that when the compressor starts in a traditional air conditioner, the speed is fixed at a certain speed and cannot be increased or decreased. Therefore, running and stopping are the only controls, and the electricity consumption at the start is 4 to 6 times that of running, which makes the electricity consumption larger. The inverter air conditioner can control the frequency of the power supply to change the speed of the compressor. When the temperature is sufficient, the compressor will run at a slower speed. There is no need to frequently start or shut down the compressor to reduce electricity consumption.
The fuzzy rules used in this experiment were established by studying the relevant literature and expert experience, as shown in Table 2.

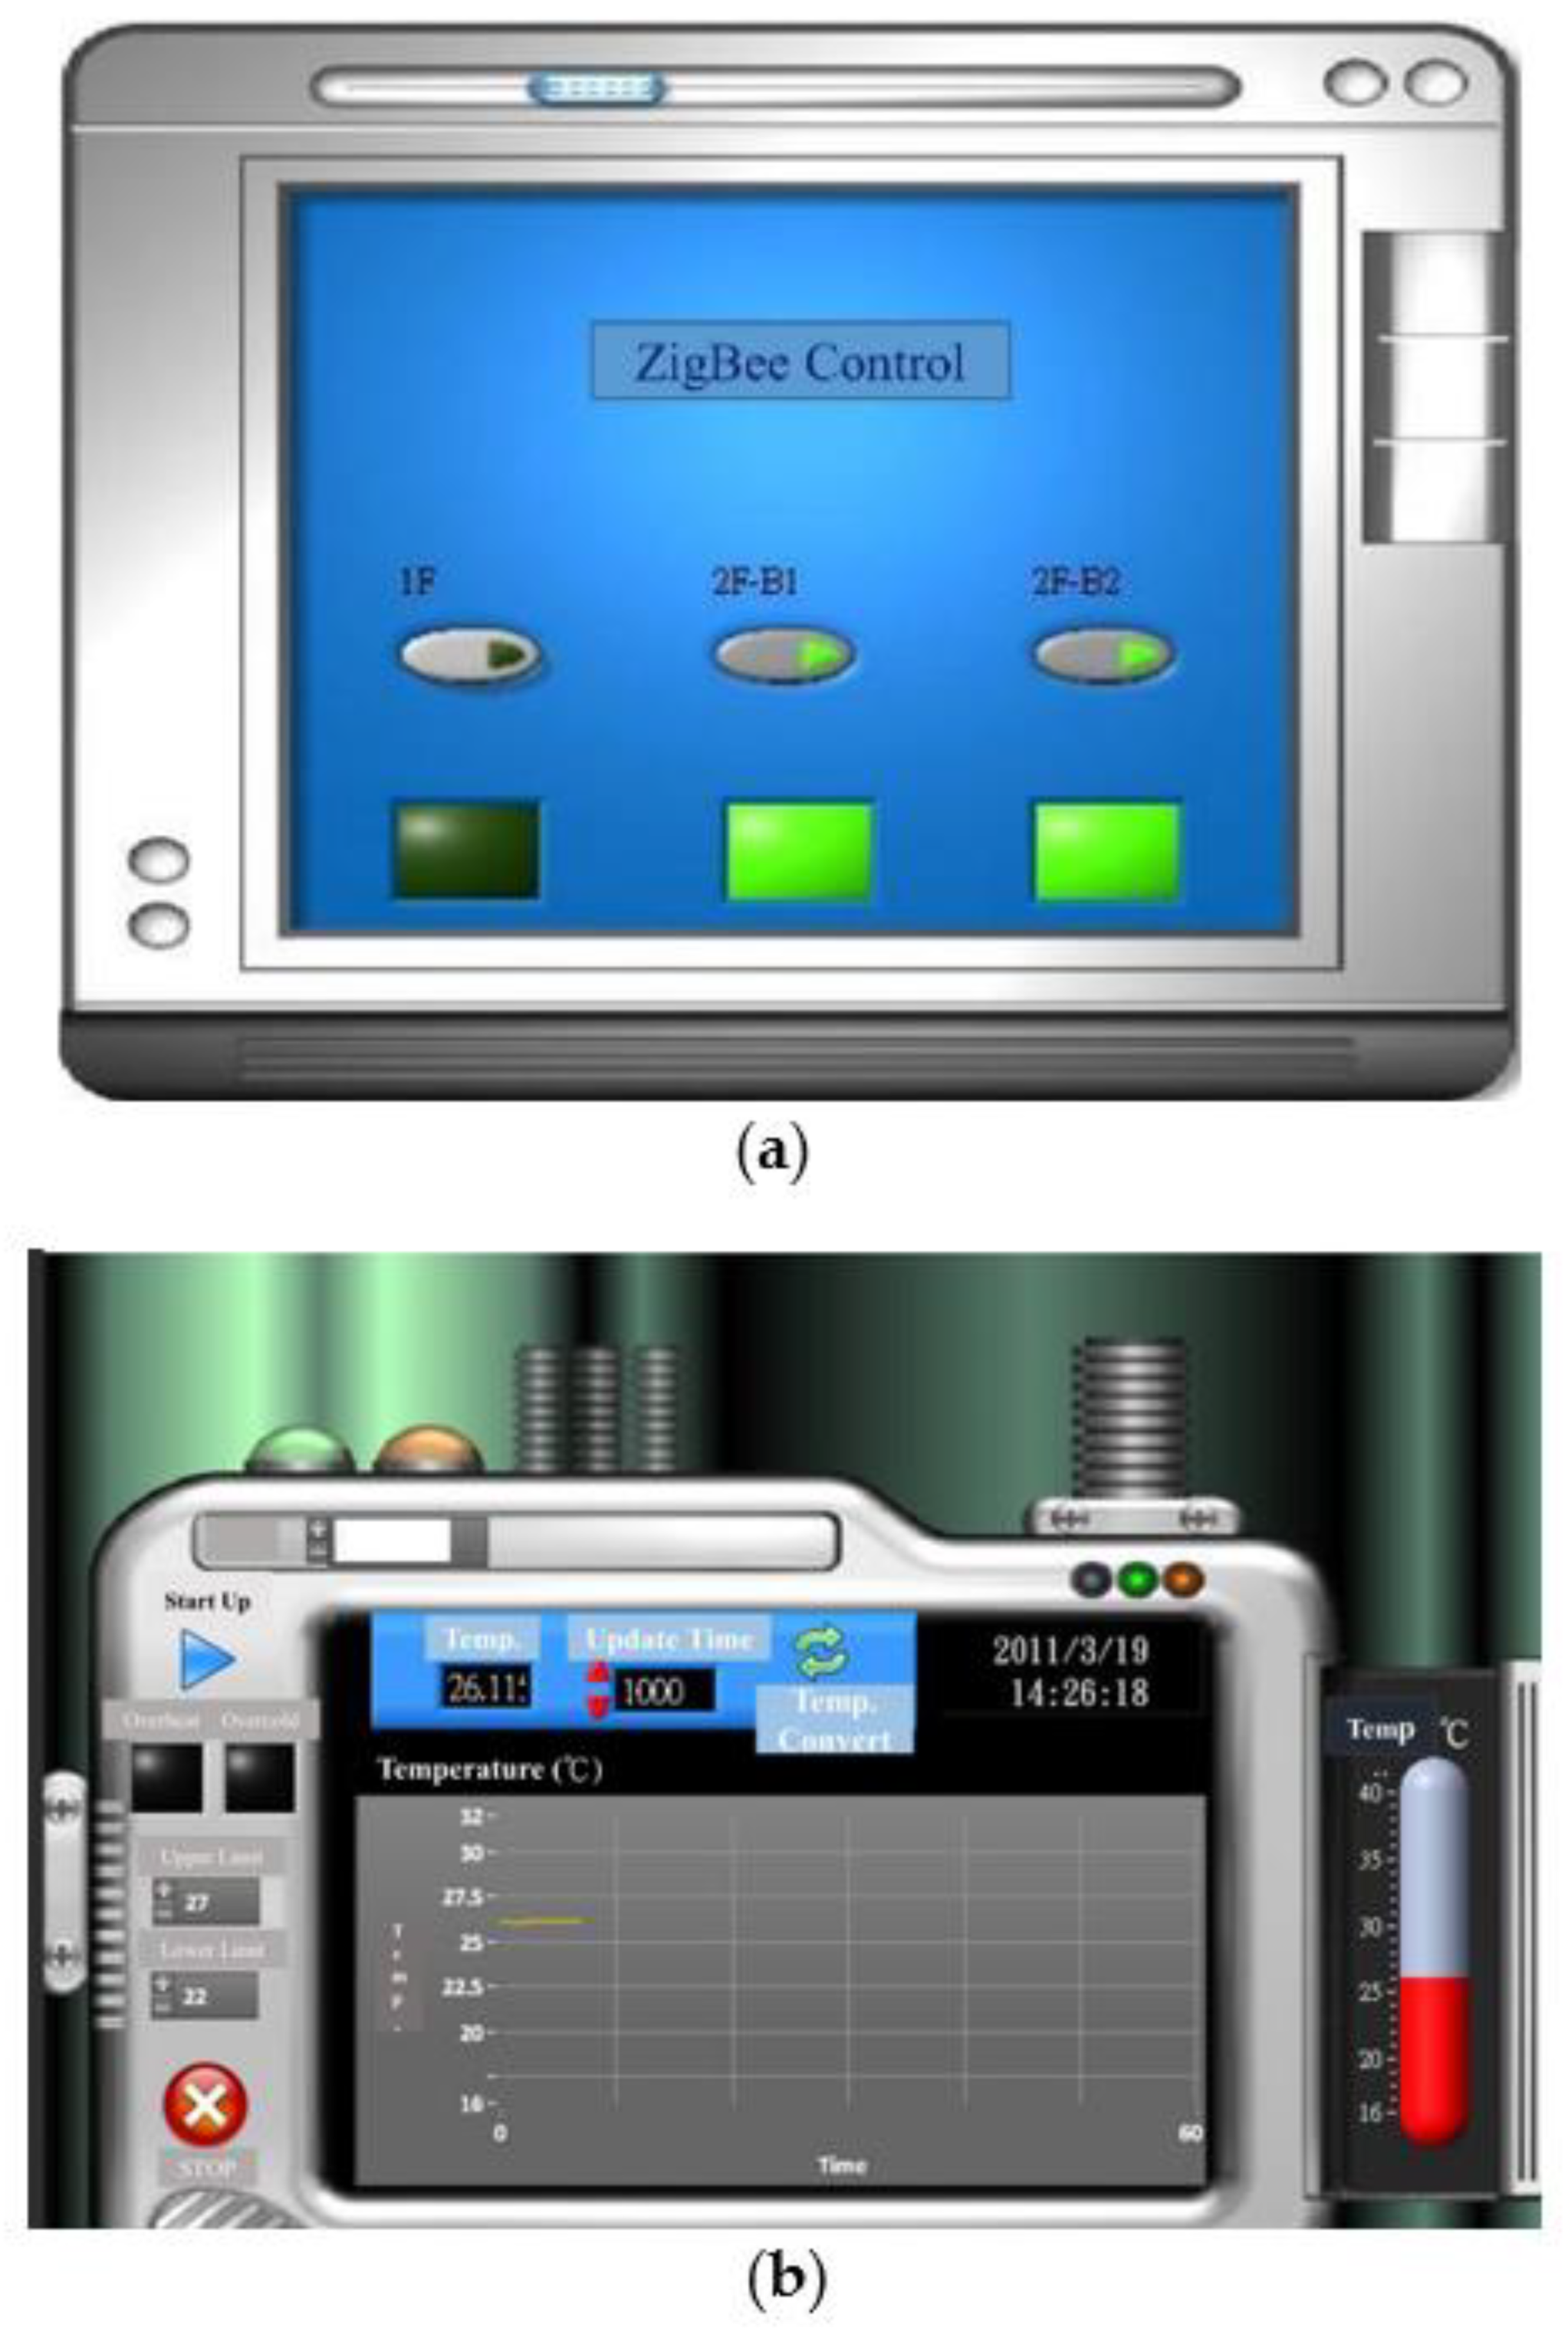
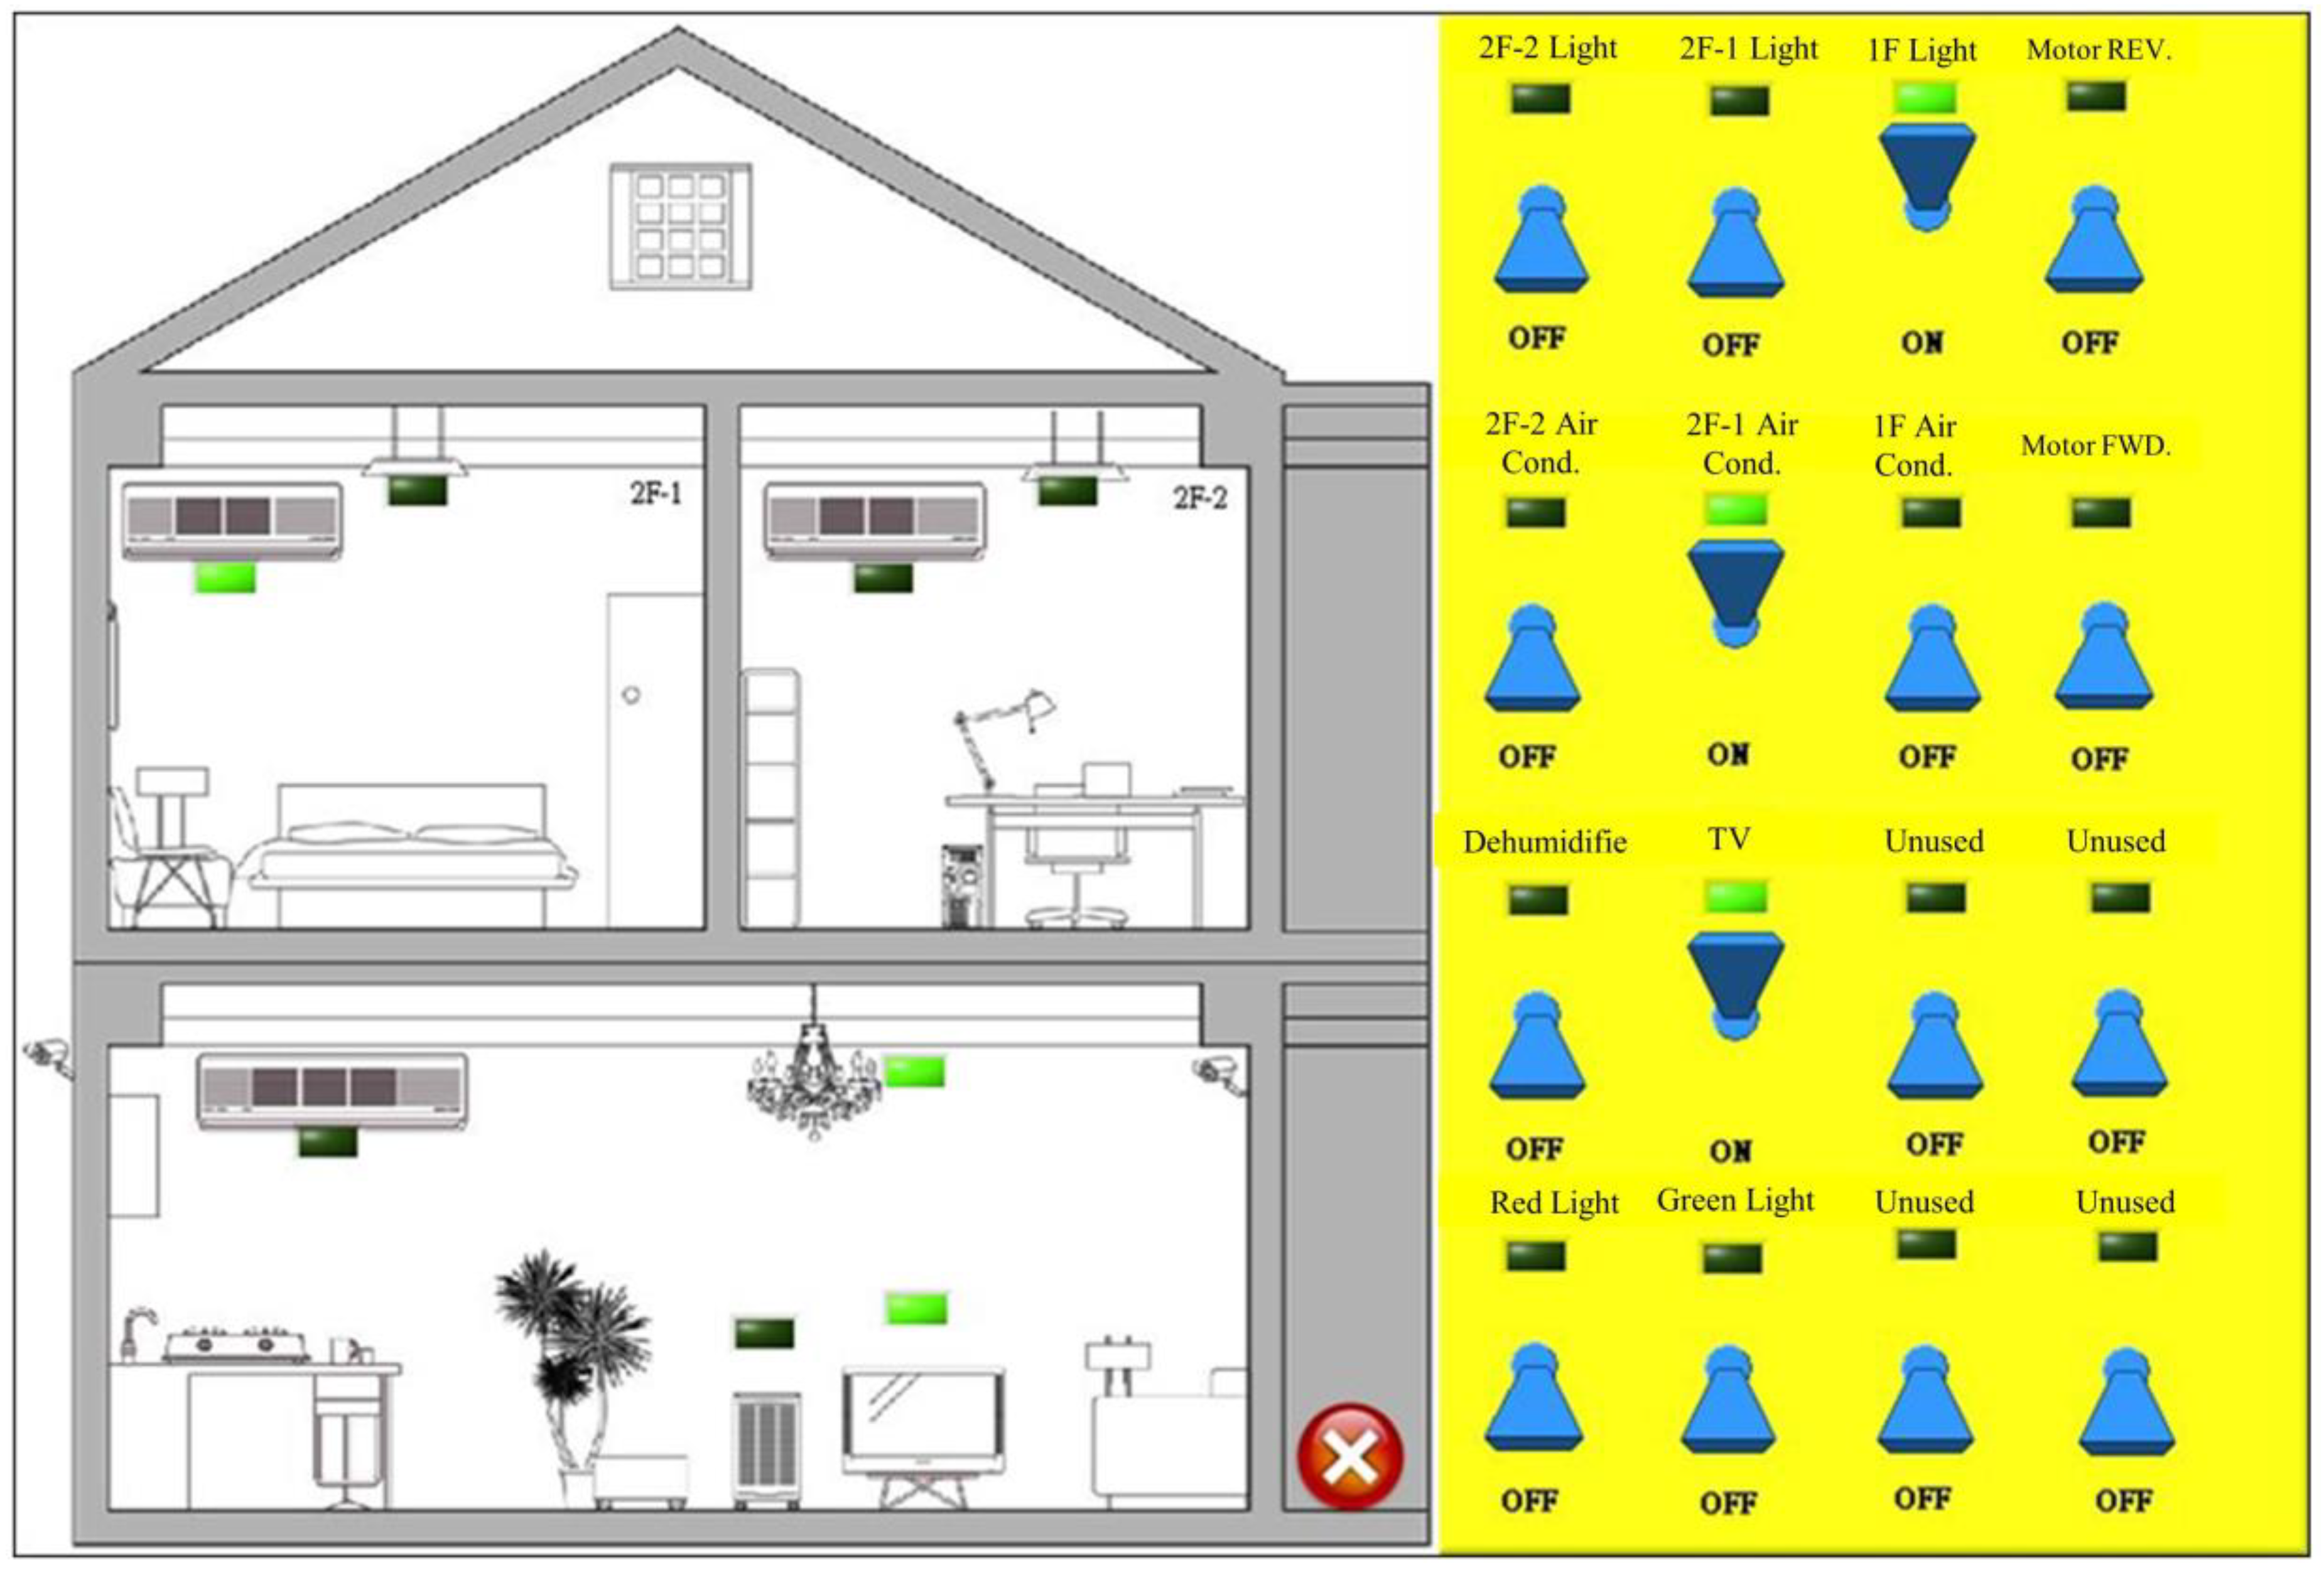
4. System Test Results

4.1. Case Studies

The front views of GUI for the control lighting and air conditioner are shown in Figure 7. Figure 8 shows the Ethernet network control interface. There are 16 sets of outputs, and the signal type is digital. The user can directly use the control switch on the right. When the switch is turned on, the corresponding indicator light on the left will be on; otherwise, it will be off. Figure 9 shows the remote monitoring architecture of the system. The Ethernet network control and ZigBee host entity diagram (from left to right: I-7188EX, I-7045, I-7024, I-7017Z and ZB-2550) are shown in Figure 10. Figure 11 shows the I-7024 and I-7017Z part of the control port connected by RS-485, including two sets of 24V LED, DC motor, temperature sensor and halogen lamp. This system uses the utility power control module as the actual test, and simulates the control of household appliances, such as air conditioners, refrigerators, elevators, etc. The test examples are divided into two types: no fuzzy logic control and fuzzy logic control added, and the results after fuzzy logic control added are compared. The test results can be displayed on the HMI and automatically stored in the computer. The horizontal axis is time, with hours as the unit; the vertical axis is wattage (W). There are 24 LEDs in the 1F room, and the wattage of a single LED is 0 to 10 W. The number of lamps set in the two rooms on 2F is eight, and the wattage of a single lamp is 0 to 10 W. The test uses a halogen lamp (400 W) as the simulated light source and changes according to the normal sunshine time [22,23].
Case 1: Figure 12a shows no fuzzy logic control. After 24 h, the electricity consumption is as follows: 1F is 3360 W, 2F-1 is 1280 W, 2F-2 is 1120 W, and the total is 5760 W.
Figure 12b shows case 1 after fuzzy logic control has been added: 1F electricity consumption is 1963 W, 2F-1 is 784 W, 2F-2 is 540 W, and the total is 3287 W. It can be observed from the data and graphs that after the fuzzy logic control is added, the electricity consumption of each room is significantly reduced, achieving the goal of energy saving.
Case 2: In this case, the user turns the simulated sunlight source on and off, which is different from case 1. Figure 13a shows that there is no fuzzy logic control, and the 1F electricity consumption is 3600 W, 2F-1 is 1200 W, 2F-2 is 1120 W, and the total is 5920 W.
Figure 13b shows case 2 after fuzzy logic control has been added: 1F electricity consumption is 2310 W, 2F-1 is 817 W, 2F-2 is 801 W, and the total is 3929 W. It can be observed from the data and graphs that after the fuzzy logic control is added, the electricity consumption of each room is significantly reduced, achieving the goal of energy saving. In these graphs, the horizontal axis is time (hour) and the vertical axis is wattage (W).
Case 3: In this case, the user turns the simulated sunlight source on and off, which is different from the above case, and it is assumed that the weather is cloudy. Figure 14a shows no fuzzy logic control, and the 1F electricity consumption is 3600 W, 2F-1 is 1440 W, 2F-2 is 1360 W, and the total is 6400 W. Since the simulated situation is cloudy, the electricity consumption is more than the other cases.
Figure 14b shows case 3 after fuzzy logic control has been added: 1F electricity consumption is 2685 W, 2F-1 is 813 W, 2F-2 is 751 W, and the total is 4250 W. Since the simulated situation is cloudy, the electricity consumption is more than the other cases, but the electricity consumption is still less than that without fuzzy logic control.
Case 4: In this case, the user turns the simulated sunlight source on and off, which is different from the above cases, and it is assumed that the weather is cloudy. Figure 15a shows no fuzzy logic control, and the 1F electricity consumption is 3680 W, 2F-1 is 1440 W, 2F-2 is 1040 W, and the total is 6160 W.
Figure 15b shows case 4 after fuzzy logic control has been added: 1F electricity consumption is 2685 W, 2F-1 is 797 W, 2F-2 is 790 W, and the total is 4272 W.
After the above test, in the absence of fuzzy logic control, the light is turned off for part of the time. The electricity consumption can be compared with the state of adding fuzzy logic control and turning on for 24 h. It can be found that even when there is no fuzzy logic control and the light is turned off, there is no electricity consumption. However, it still uses more electricity to turn the light on and off manually than by adding fuzzy logic control and turning it on all day. Even on a simulated cloudy day, the electricity consumption with fuzzy logic control is still less than without fuzzy logic control. Therefore, the use of an energy-saving mode can, indeed, reduce electricity consumption and does not require manual adjustments.

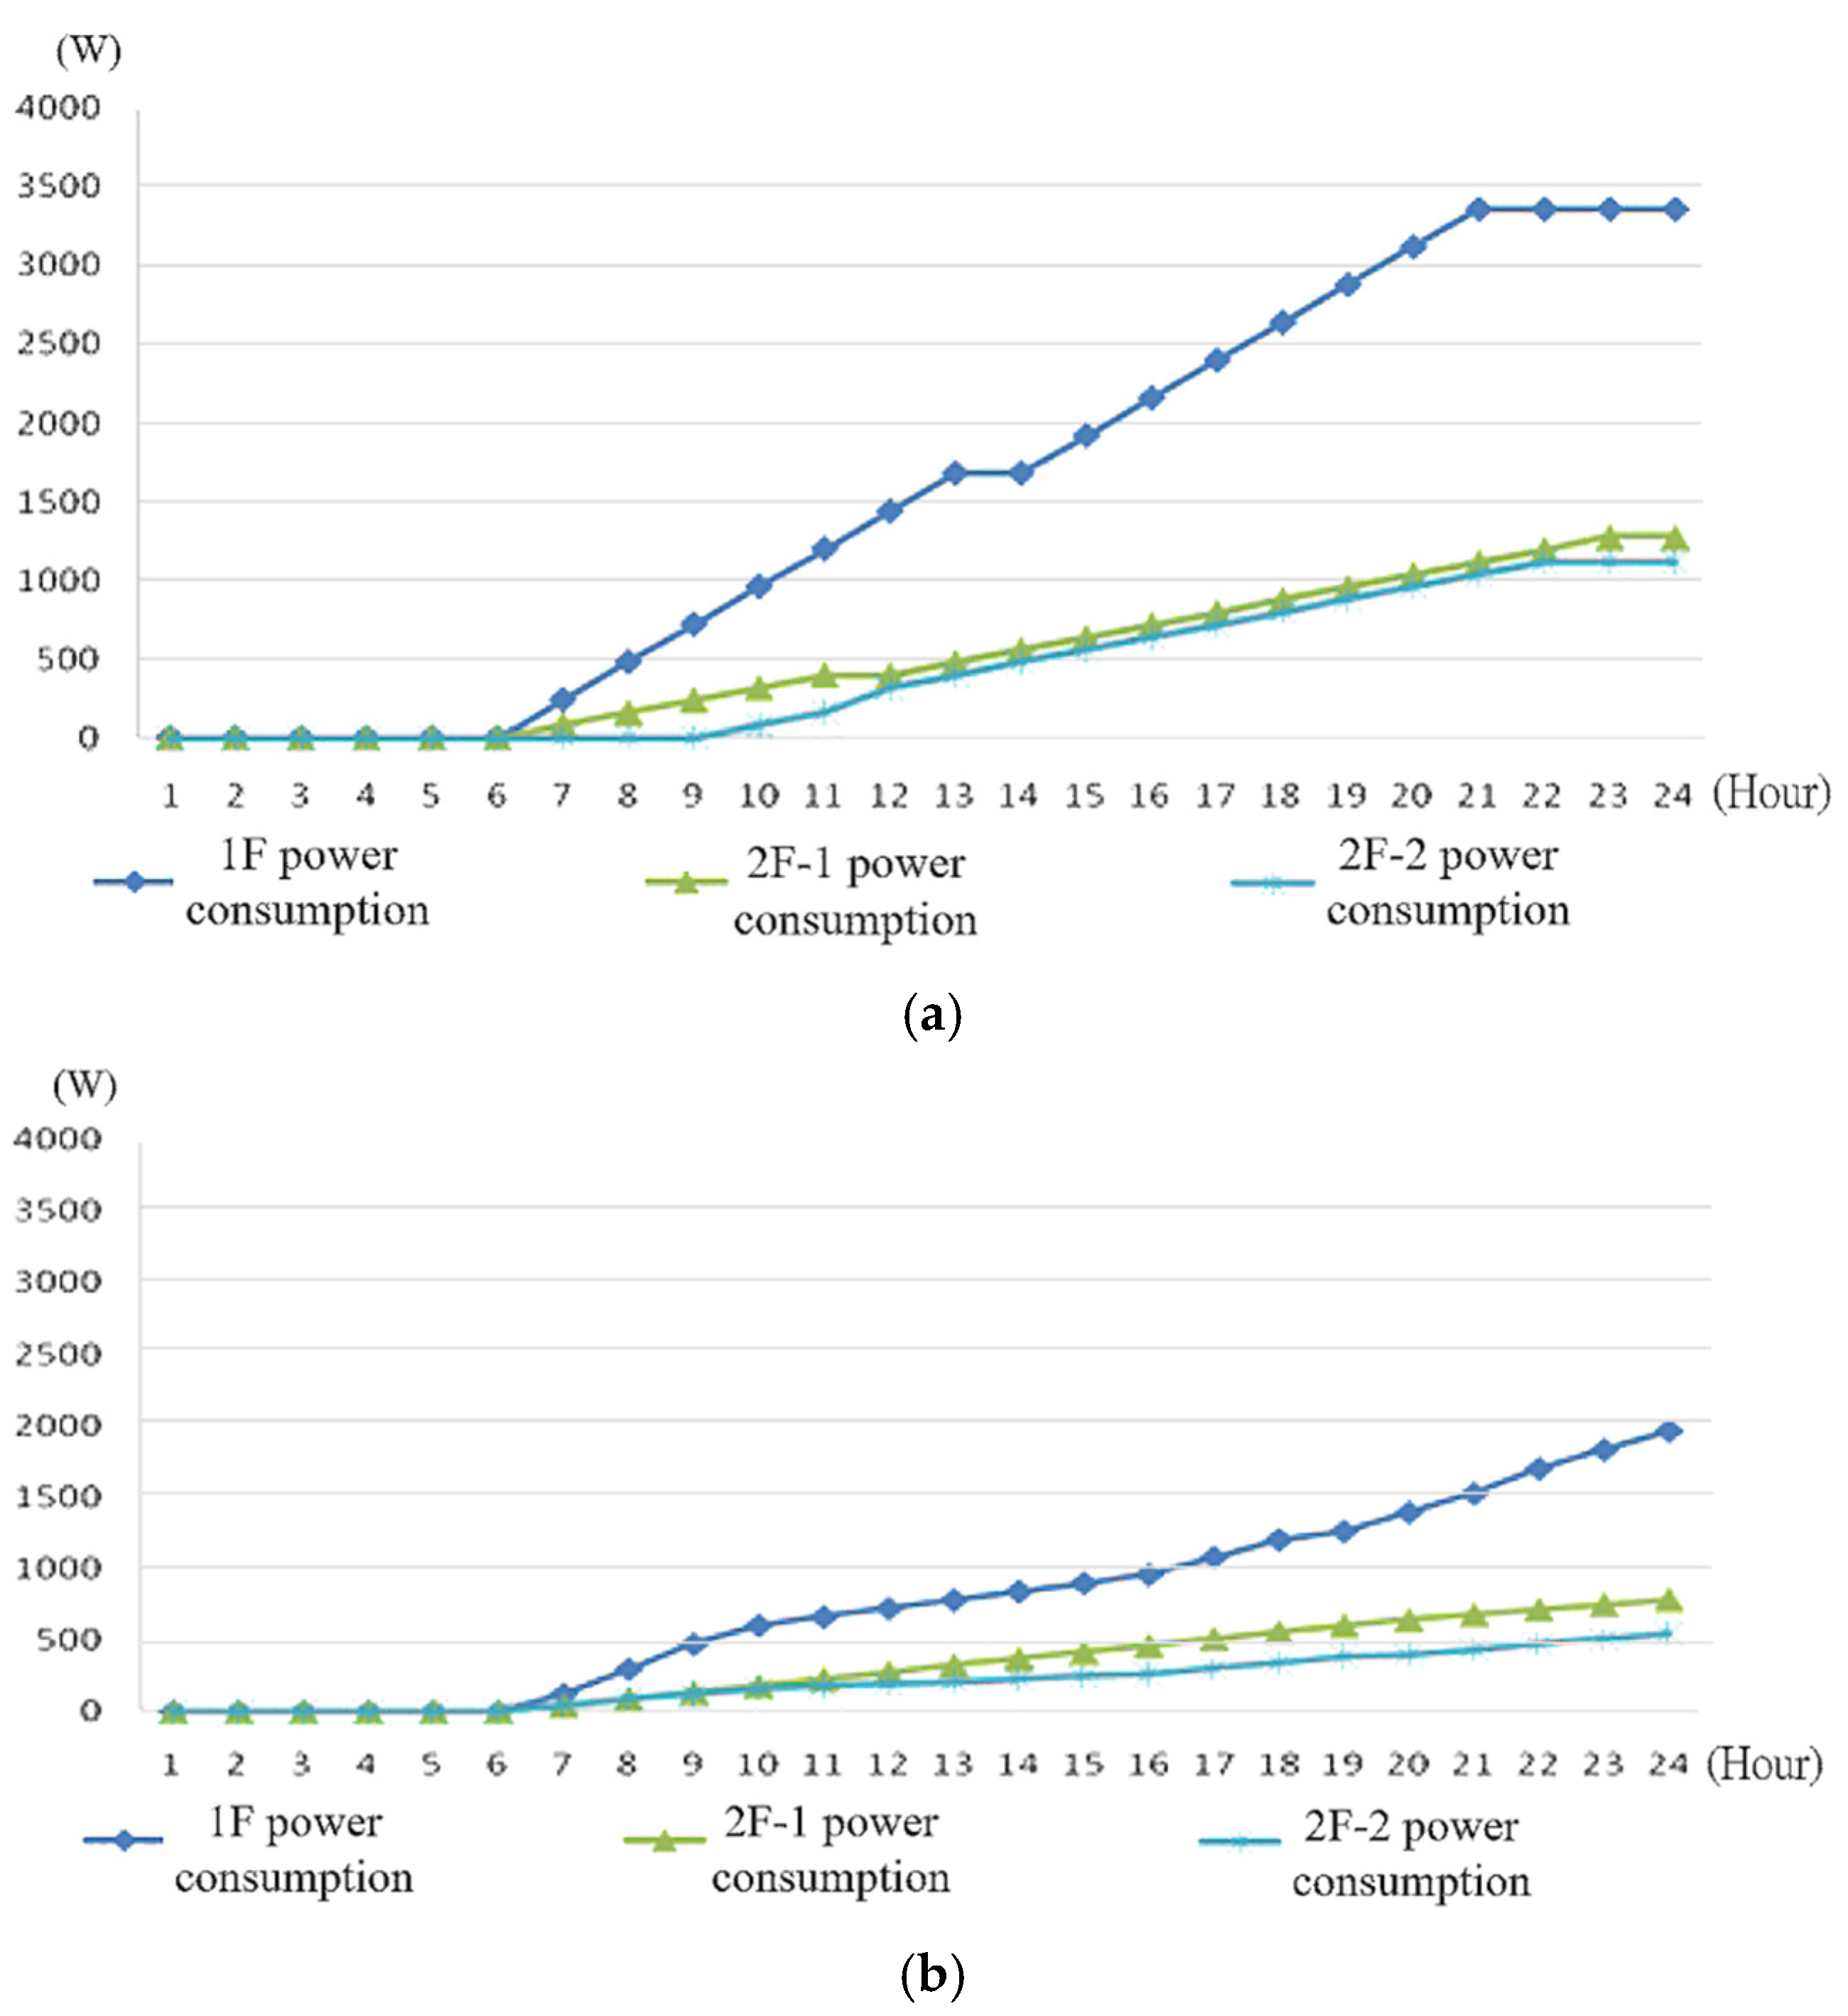
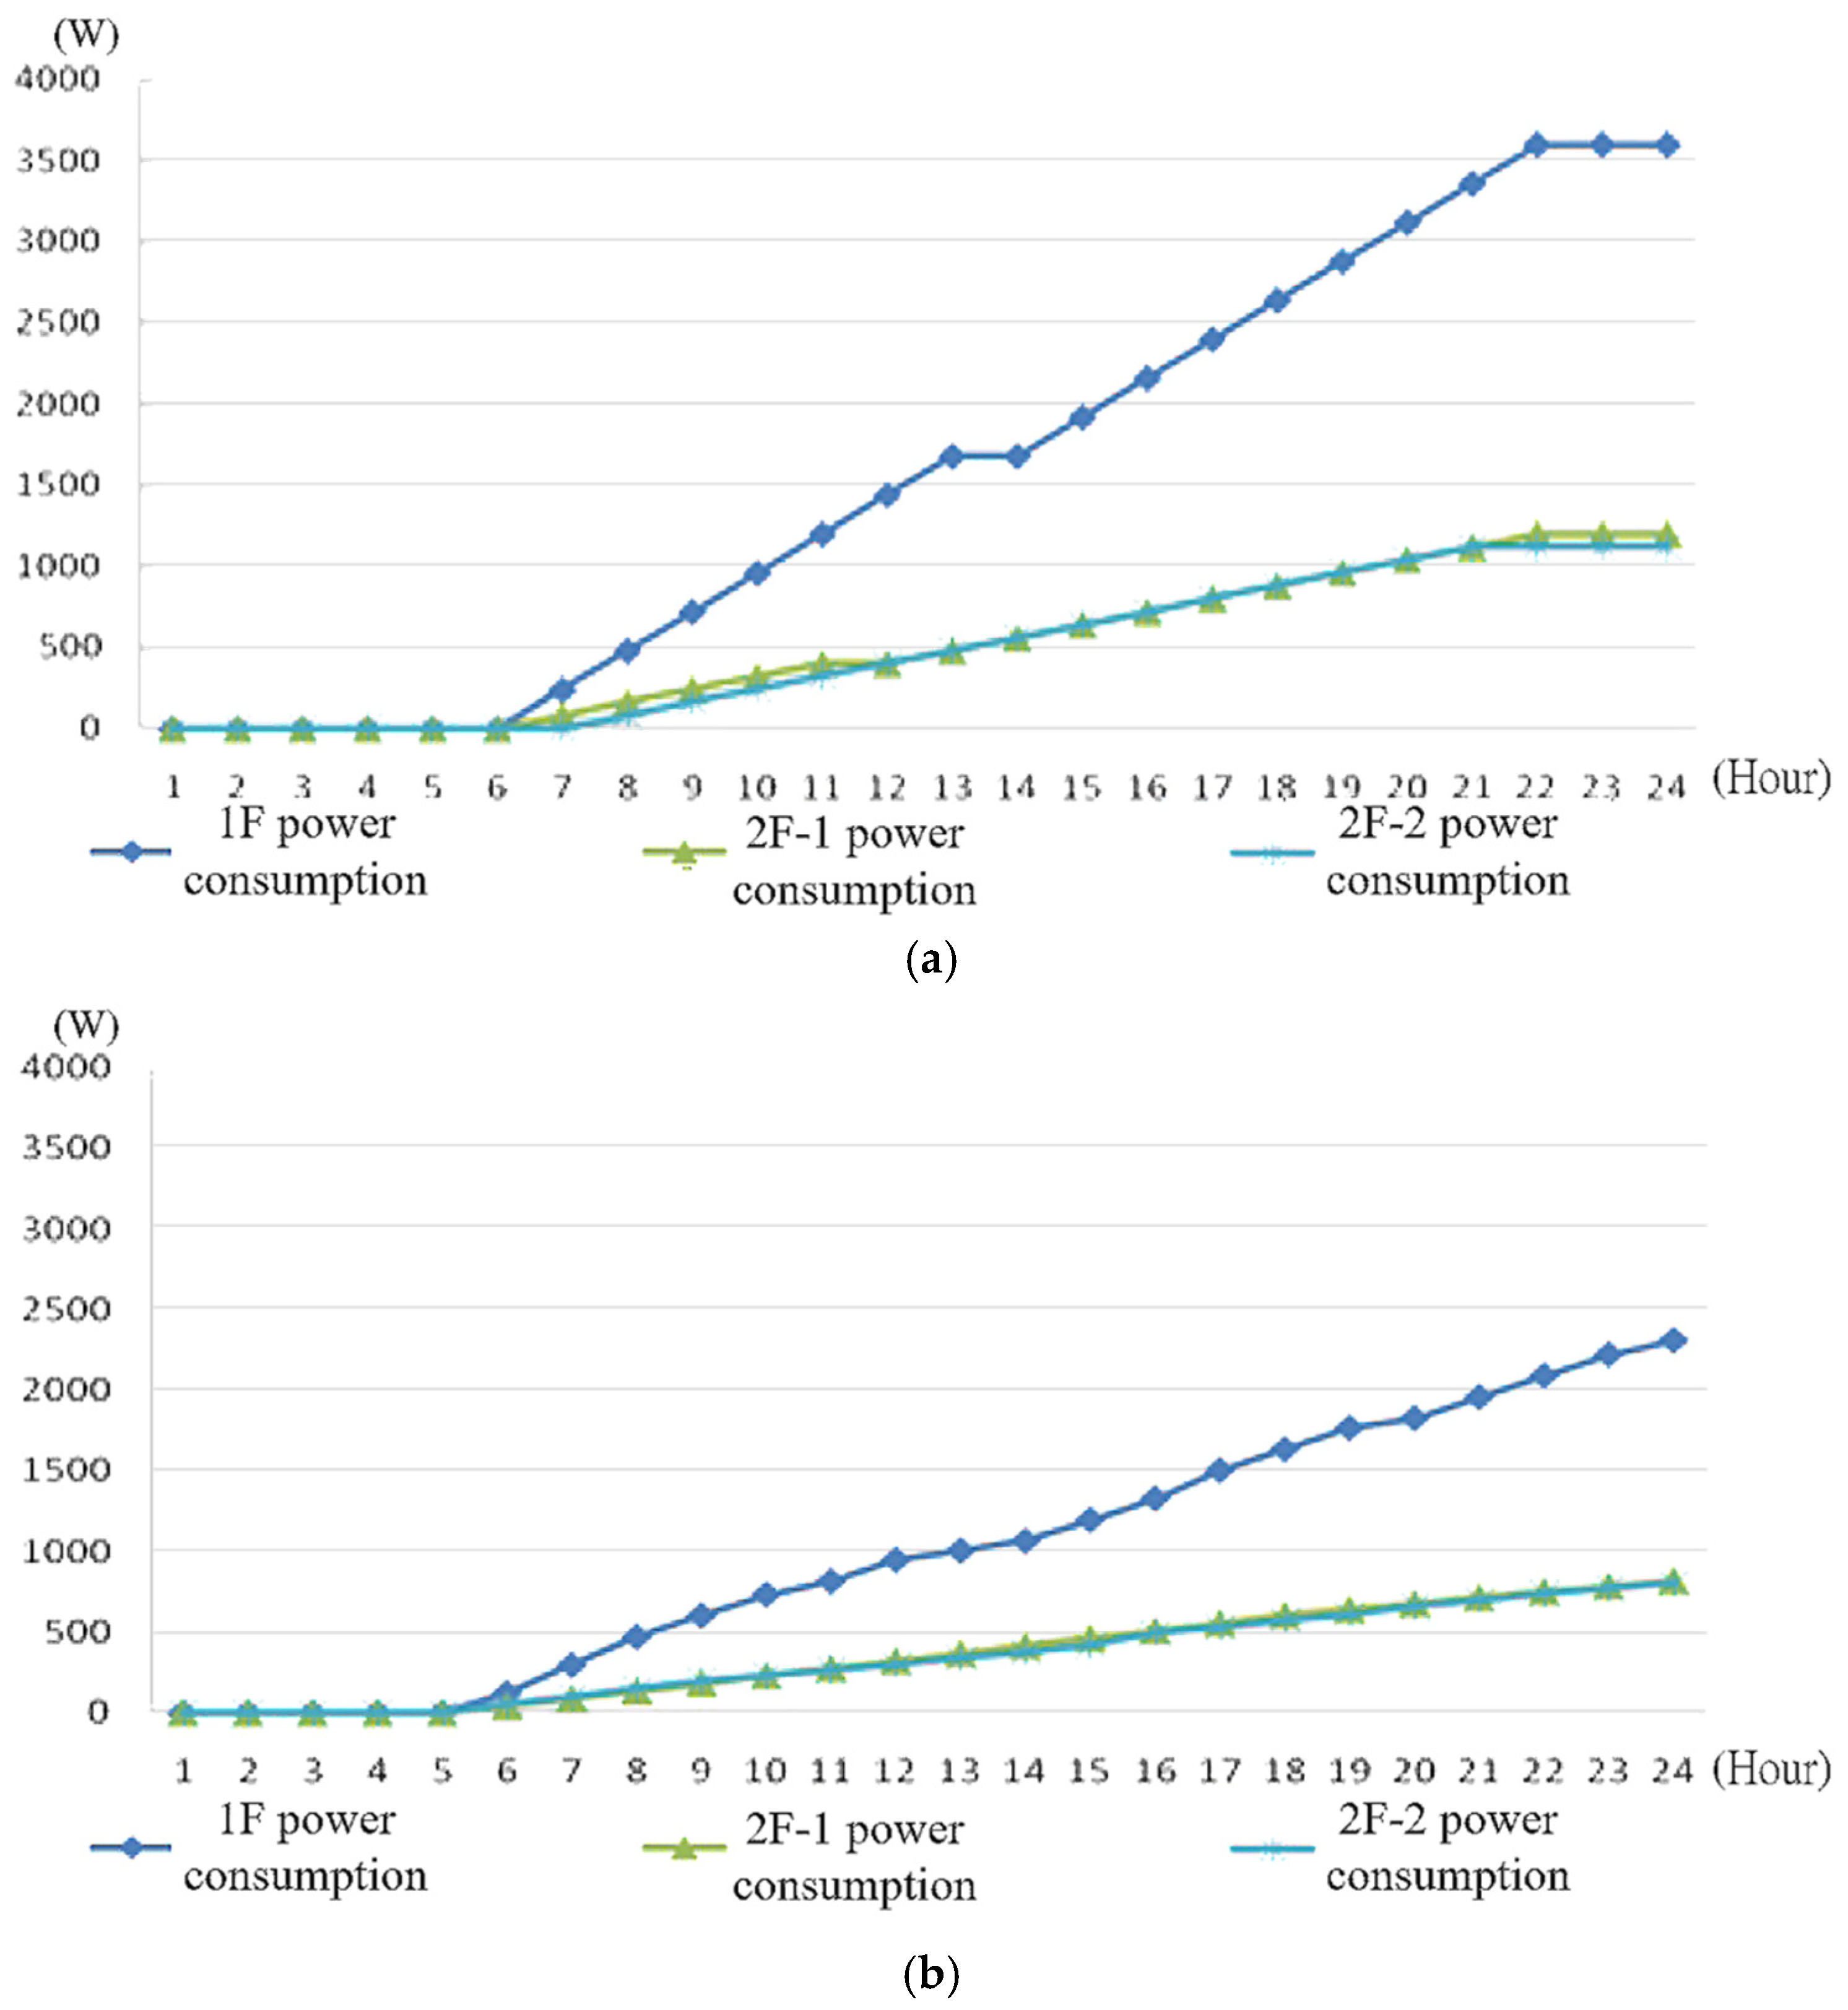
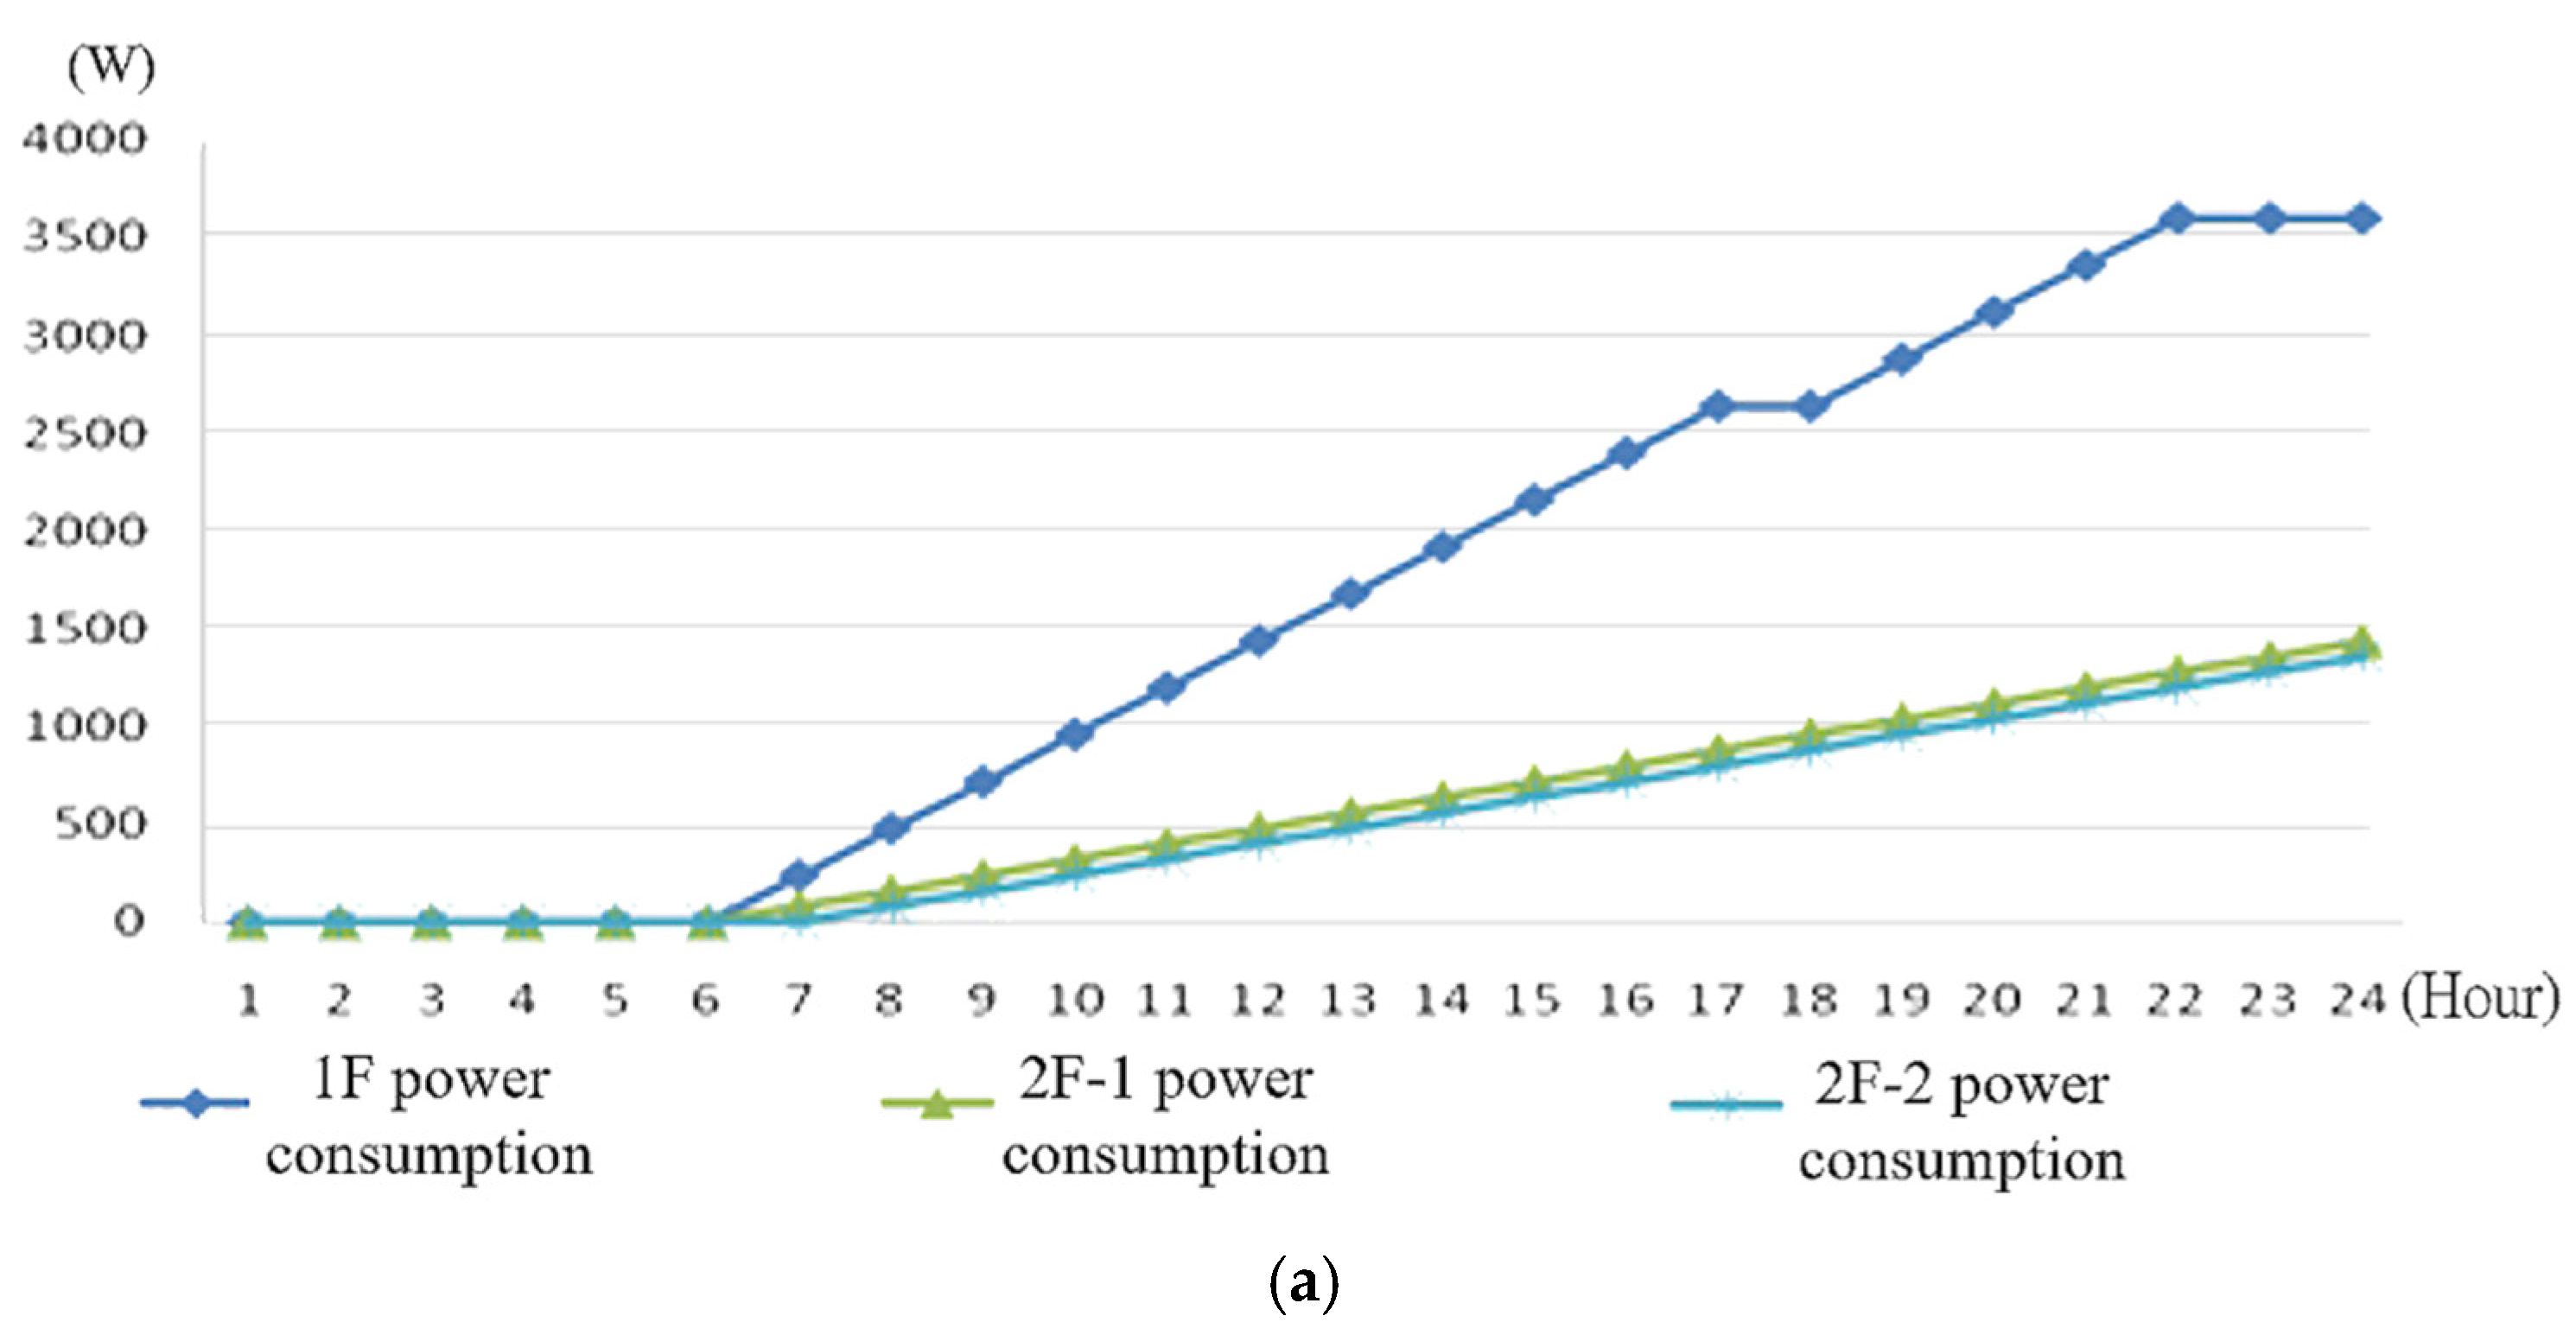
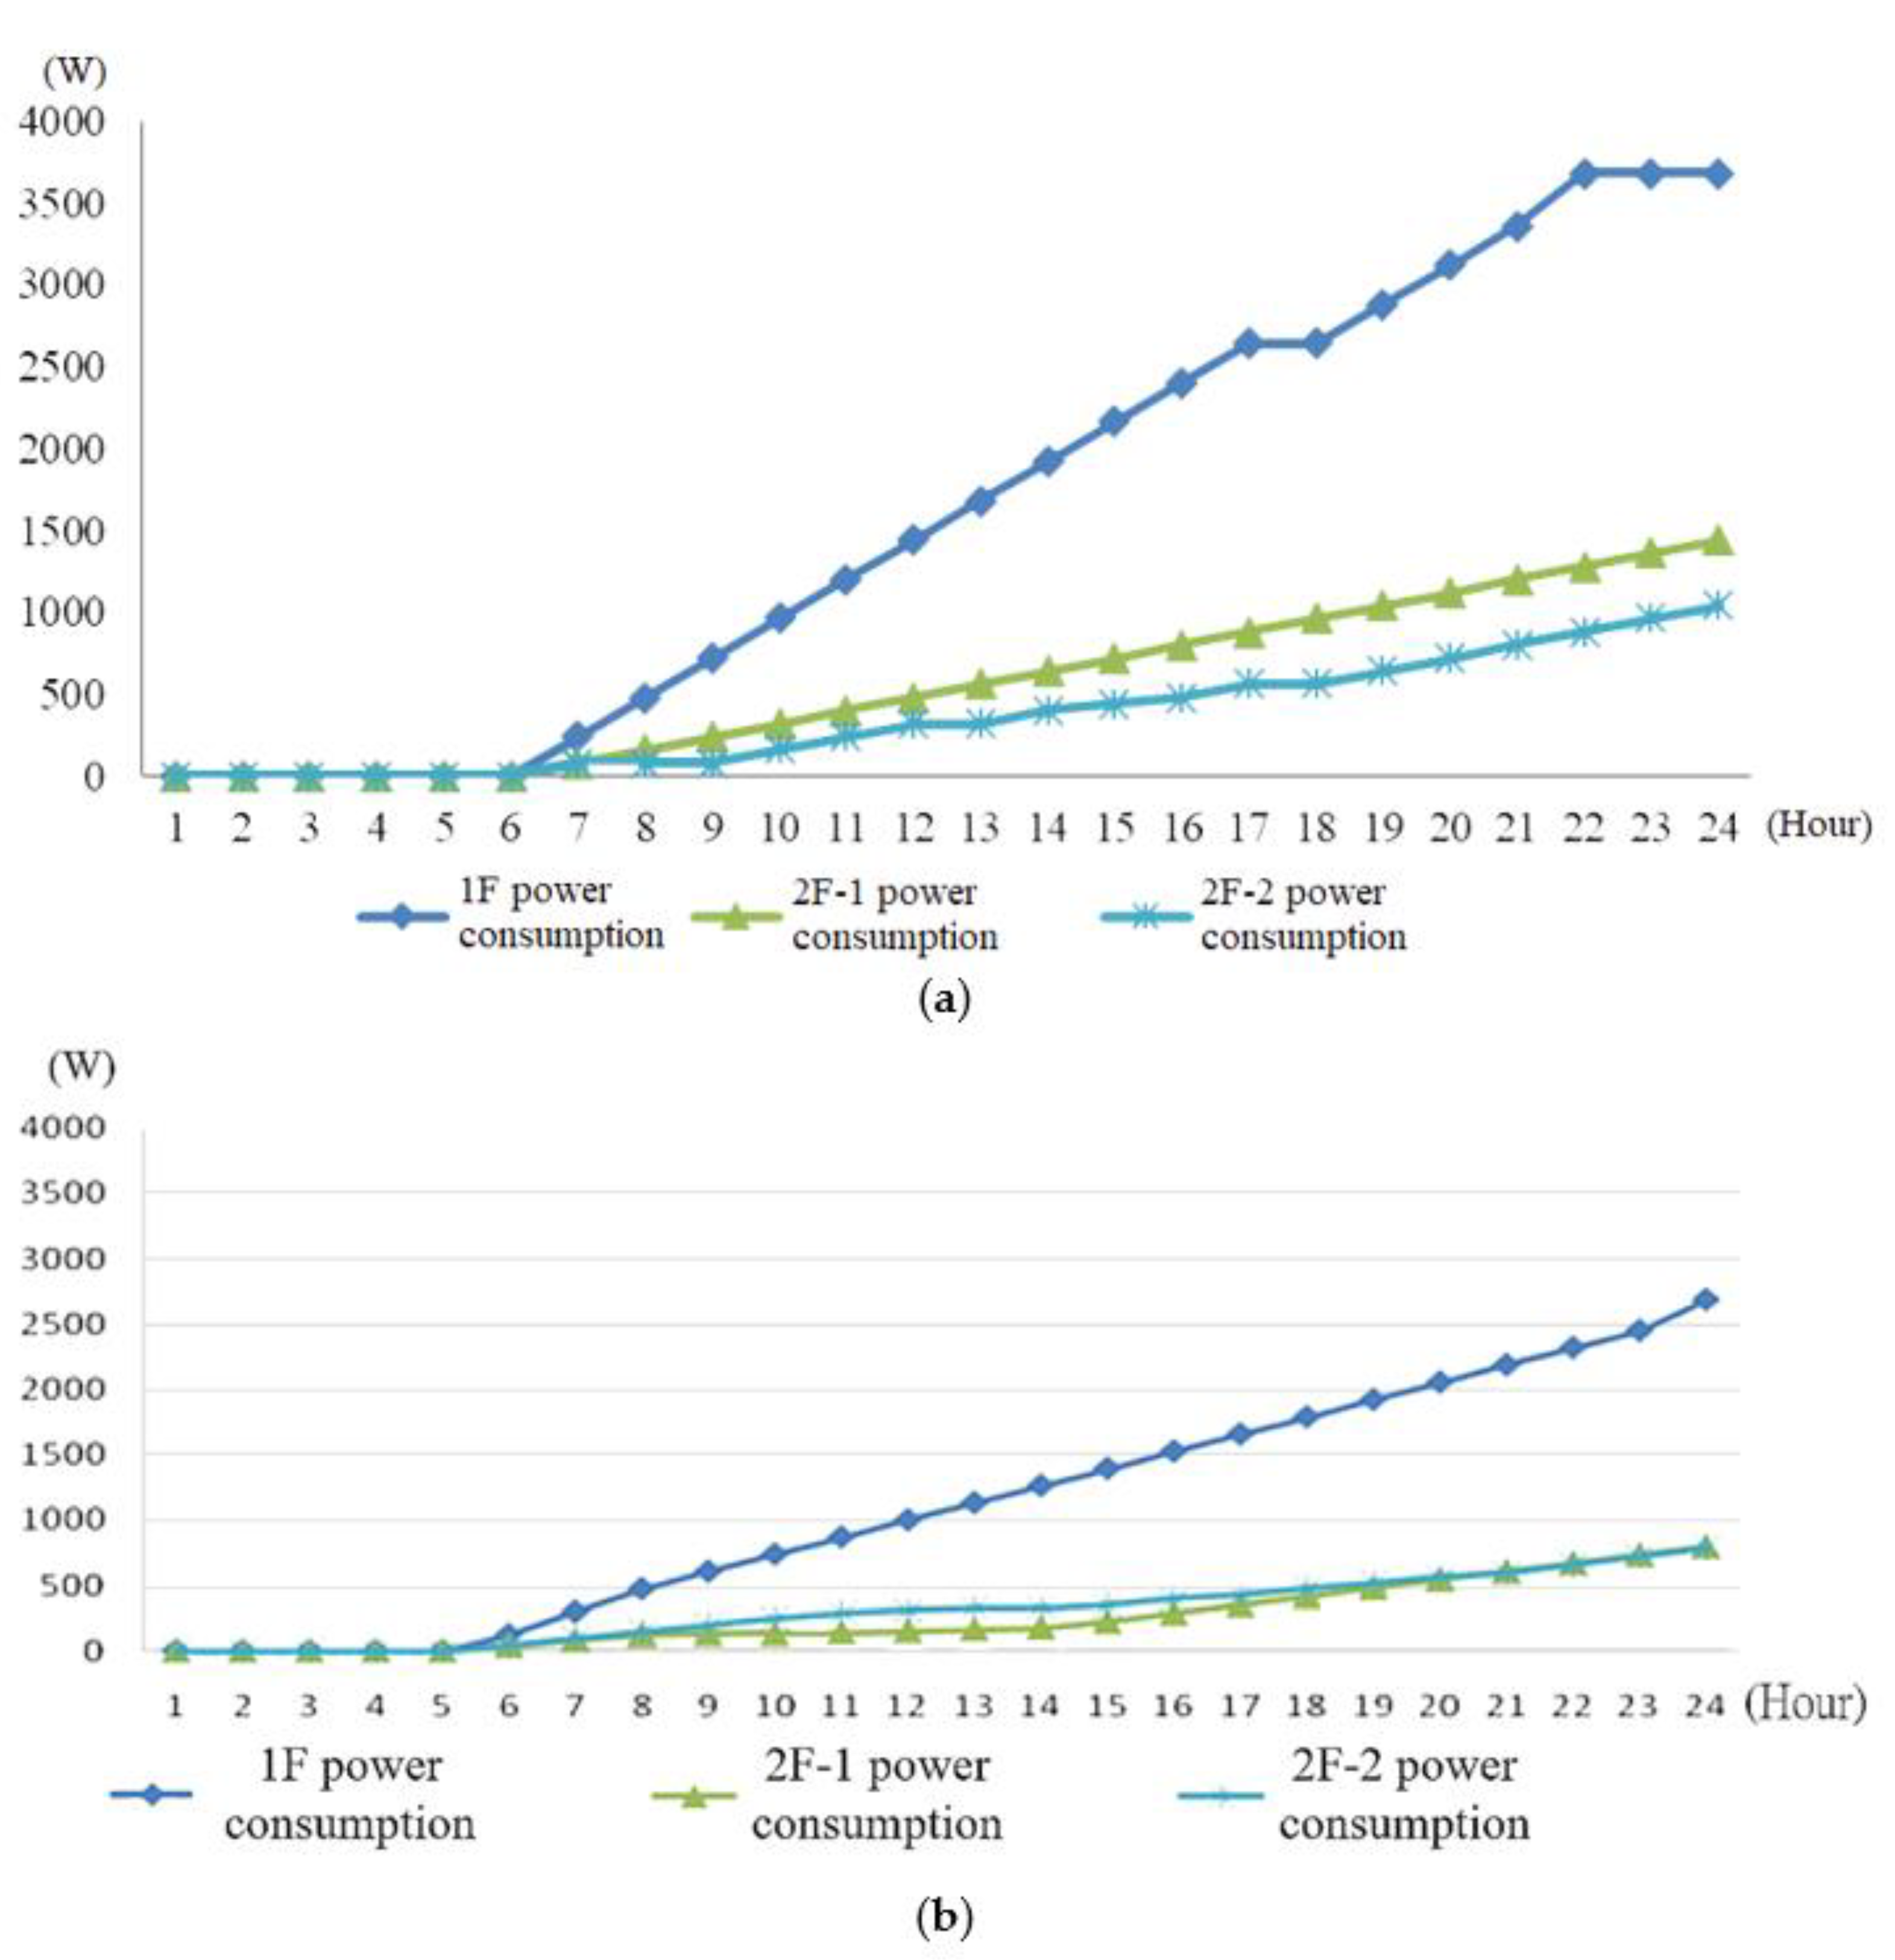
4.2. Air Conditioner Energy-Saving Test

This system uses a simulated inverter air conditioner. It compares the difference between no fuzzy logic control and fuzzy logic control added, and presents the result on the HMI. The horizontal axis is time, with hours as the unit; the vertical axis is wattage (W). The specification of the simulated air conditioner is a 0 to 900 W inverter air conditioner, and the cooling capacity is about 2000 kcal/h, which is suitable for rooms of three to five pings.
Figure 16a shows the average electricity consumption without fuzzy logic control and fuzzy logic control added at different times. The initial temperature is 28 °C, the initial set temperature is 22 °C, and the temperature is randomly set at 22 to 27 °C. It can be observed from Figure 16a that the earlier the fuzzy logic control is added, the less the electricity consumption will be. Therefore, fuzzy logic control can effectively reduce the electricity consumption. Table 3 is the electricity meter. Due to the fuzzy logic control, the temperature change is smaller and more stable than when there is no fuzzy logic control, keeping the temperature within the range of small fluctuations. The temperature change is shown in Figure 16b.

5. Conclusions

This paper uses LabVIEW to compose a graphical HMI, combined with MATLAB’s fuzzy logic control as an energy-saving computing center. All systems are combined with the internet to construct a distributed network monitoring system and apply it to the home to form a smart home monitoring system. In addition to the artificial intelligence of the smart home monitoring system, some systems can also be connected to each other. The sensor and the control terminal are automatically controlled by computer processing, so that the machines can communicate with each other, making the system more intelligent. Wire and wireless communication can be used, which makes the entire system more flexible. This paper has successfully developed a smart home monitoring system with remote functions. In addition to monitoring on the server side, it can also perform monitoring through the internet. Furthermore, all systems and programs are embedded in the web page using standard web page syntax, so that mobile devices, such as mobile phones, PDAs, pads, etc., can be connected to the server through the internet to achieve the function of remote monitoring.
In the future, power line communication (PLC) can be added to improve the control structure of wired communication, which can save the cost and time of wiring, and directly control the existing power line. It can strengthen demand control, and add a digital meter to the system to improve the accuracy of power control. When the upper limit of power consumption is exceeded, it will be automatically unloaded according to the weight of the electrical appliance. Therefore, the system described above can be applied to more areas, and more related sensors can be added to improve the overall security.

Author Contributions

Conceptualization, C.-H.C. and W.-M.L.; methodology, C.-M.H.; software, Y.-C.W.; formal analysis, C.-M.H.; resources, W.-M.L.; writing—original draft preparation, C.-H.C. and C.-M.H.; writing—review and editing, C.-M.H. and Y.-C.W.; visualization, Y.-C.W.; supervision, C.-H.C.; project administration, W.-M.L.; funding acquisition, C.-H.C. and W.-M.L. All authors have read and agreed to the published version of the manuscript.

Funding

This research received no external funding.

Data Availability Statement

Data is contained within the article.

Acknowledgments

The authors would like to acknowledge the financial support from the Ministry of Science and Technology of Taiwan for this study through the grant: MOST 105-2221-E-022-015.

Conflicts of Interest

The authors declare no conflict of interest.

References

  1. Hsiao, S.J. Employing a Wireless Sensing Network for AIoT Based on a 5G Approach. Electronics 2022, 11, 827. [Google Scholar] [CrossRef]
  2. Ullo, S.L.; Sinha, G.R. Advances in Smart Environment Monitoring Systems Using IoT and Sensors. Sensors 2020, 20, 3113. [Google Scholar] [CrossRef] [PubMed]
  3. Papadopoulos, N.; Meliones, A.; Economou, D.; Karras, I.; Liverezas, I. A Connected Home Platform and Development Framework for smart home control applications. In Proceedings of the 2009 7th IEEE International Conference on Industrial Informatics, Cardiff, UK, 23–26 June 2009; pp. 402–409. [Google Scholar]
  4. Jiang, L.; Liu, D.Y.; Yang, B. Smart home research. In Proceedings of the 2004 IEEE International Conference on Machine Learning and Cybernetics, Shanghai, China, 26–29 August 2004; Volume 2, pp. 659–663. [Google Scholar]
  5. Shea, J.J. Internet Applications in LabVIEW. IEEE Electr. Insul. Mag. 2001, 17, 45. [Google Scholar] [CrossRef]
  6. Rana, S.P.; Dey, M.; Ghavami, M.; Dudley, S. Signature Inspired Home Environments Monitoring System Using IR-UWB Technology. Sensors 2019, 19, 385. [Google Scholar] [CrossRef] [PubMed] [Green Version]
  7. Qu, Y.L.; Sun, G.; Zheng, B.; Liu, W. Environment Monitoring System of Dairy Cattle Farming Based on Multi Parameter Fusion. Information 2021, 12, 273. [Google Scholar] [CrossRef]
  8. Hwang, J.H.; Shin, C.S.; Yoe, H. Study on an Agricultural Environment Monitoring Server System using Wireless Sensor Networks. Sensors 2010, 10, 11189–11211. [Google Scholar] [CrossRef] [PubMed]
  9. Masahiro, I.; Toshiyasu, H.; Yoshiaki, I.; Noriyuki, K.; Hitoshi, K. Network Architecture for Home Energy Management System. IEEE Trans. Consum. Electron. 2003, 49, 606–613. [Google Scholar]
  10. Zhang, Z.X. Advanced MATLAB Programming, 2nd ed.; GOTOP Information Inc.: Taipei City, Taiwan, 2013. [Google Scholar]
  11. Sharma, H.S.; Haque, A.; Blaabjerg, F. Machine Learning in Wireless Sensor Networks for Smart Cities: A Survey. Electronics 2021, 10, 1012. [Google Scholar] [CrossRef]
  12. Ding, Q.; Zhu, R.; Liu, H.; Ma, M. An Overview of Machine Learning-Based Energy-Efficient Routing Algorithms in Wireless Sensor Networks. Electronics 2021, 10, 1539. [Google Scholar] [CrossRef]
  13. Han, D.M.; Lim, J.H. Smart home energy management system using IEEE 802.15.4 and ZigBee. IEEE Trans. Consum. Electron. 2010, 56, 1403–1410. [Google Scholar] [CrossRef]
  14. Han, D.M.; Lim, J.H. Design and Implementation of Smart Home Energy Management Systems based on ZigBee. IEEE Trans. Consum. Electron. 2010, 56, 1417–1425. [Google Scholar] [CrossRef]
  15. Xu, Z.F. Light Sensors and How to Use; Chuan Hwa Book Co. Ltd.: New Taipei City, Taiwan, 1993. [Google Scholar]
  16. Timothy, J.R. Fuzzy Logic with Engineering Application; McGraw-Hill: New York, NY, USA, 1997. [Google Scholar]
  17. Lin, C.T.; Lee, G.C.S. Neural Fuzzy Systems; Prentice-Hall, Inc.: Upper Saddle River, NJ, USA, 1996. [Google Scholar]
  18. Luo, Q.H.; Wu, Y.C. Industrial Power Distribution; Chuan Hwa Book Co. Ltd.: New Taipei City, Taiwan, 2004. [Google Scholar]
  19. Li, S.Z. Lighting Design; Chuan Hwa Book Co. Ltd.: New Taipei City, Taiwan, 1993. [Google Scholar]
  20. Tsai, C.F. A Study of Artificial Neural Network on the Optimization of Interior Lighting Design. Master’s Thesis, National Taiwan University of Science and Technology, Taipei City, Taiwan, 2006. [Google Scholar]
  21. Chen, C.H. LabVIEW 8.X and Sensing Circuit Application; TKDBOOKS Co. Ltd.: New Taipei City, Taiwan, 2010. [Google Scholar]
  22. Suhara, Y.; Nakabe, T.; Mine, G.; Nishi, H. Distributed Demand Side Management System for Home Energy Management. In Proceedings of the IEEE Industrial Electronics Society 2010, Glendale, AZ, USA, 7–10 November 2010; pp. 1430–1435. [Google Scholar]
  23. Wei, Z.; Qin, S.; Jia, D.; Yang, Y. Research and design of Cloud architecture for smart home. In Proceedings of the IEEE International Conference on ICSESS 2010, Beijing, China, 16–18 July 2010; pp. 86–89. [Google Scholar]
Figure 1. Common Gateway Interface: (a) basic architecture; (b) login settings.
Electronics 11 01596 g001
Figure 2. Internal settings of link structure.
Electronics 11 01596 g002
Figure 3. Brightness capture system.
Electronics 11 01596 g003
Figure 4. Temperature capture system.
Electronics 11 01596 g004
Figure 5. Characteristic function of fuzzy set.
Electronics 11 01596 g005
Figure 6. The flow chart of fuzzy system.
Electronics 11 01596 g006
Figure 7. The front view of GUI: (a) control lighting; (b) air conditioner.
Electronics 11 01596 g007
Figure 8. Ethernet network control interface.
Electronics 11 01596 g008
Figure 9. Remote monitoring system architecture.
Electronics 11 01596 g009
Figure 10. Entity graph.
Electronics 11 01596 g010
Figure 11. Power control module.
Electronics 11 01596 g011
Figure 12. Case 1. (a) No fuzzy logic control; (b) after adding fuzzy logic control.
Electronics 11 01596 g012
Figure 13. Case 2. (a) No fuzzy logic control; (b) after adding fuzzy logic control.
Electronics 11 01596 g013
Figure 14. Case 3. (a) No fuzzy logic control; (b) after adding fuzzy logic control.
Electronics 11 01596 g014aElectronics 11 01596 g014b
Figure 15. Case 4. (a) No fuzzy logic control; (b) after adding fuzzy logic control.
Electronics 11 01596 g015
Figure 16. (a) No fuzzy logic control and after adding fuzzy logic control; (b) temperature change graph.
Electronics 11 01596 g016
Table 1. Fuzzy associative map table for brightness.
BrightnessDarkMediumBright
Electricity
Consumption
LowHighMediumLow
MediumMediumMediumLow
HighMediumLowClose
Table 2. Fuzzy associative map table for temperature.
TemperatureLowMediumHigh
Electricity
Consumption
LowMediumLowVery low
MediumHighMediumLow
HighHighHighMedium
Table 3. Electricity meter.
ElectricityAverage Electricity
Consumption (W)
Total Electricity
Consumption (W)
Consumption
Add Time
No fuzzy logic control64515,480
Proposed scheme in 18 h60514,520
Proposed scheme in 12 h54512,840
Proposed scheme in 8 h49511,880
Proposed scheme in 6 h45911,016
All day44810,752
Publisher’s Note: MDPI stays neutral with regard to jurisdictional claims in published maps and institutional affiliations.

