
Inter-continental Data Centre Power Load Balancing for Renewable Energy Maximisation


Abstract
1. Introduction
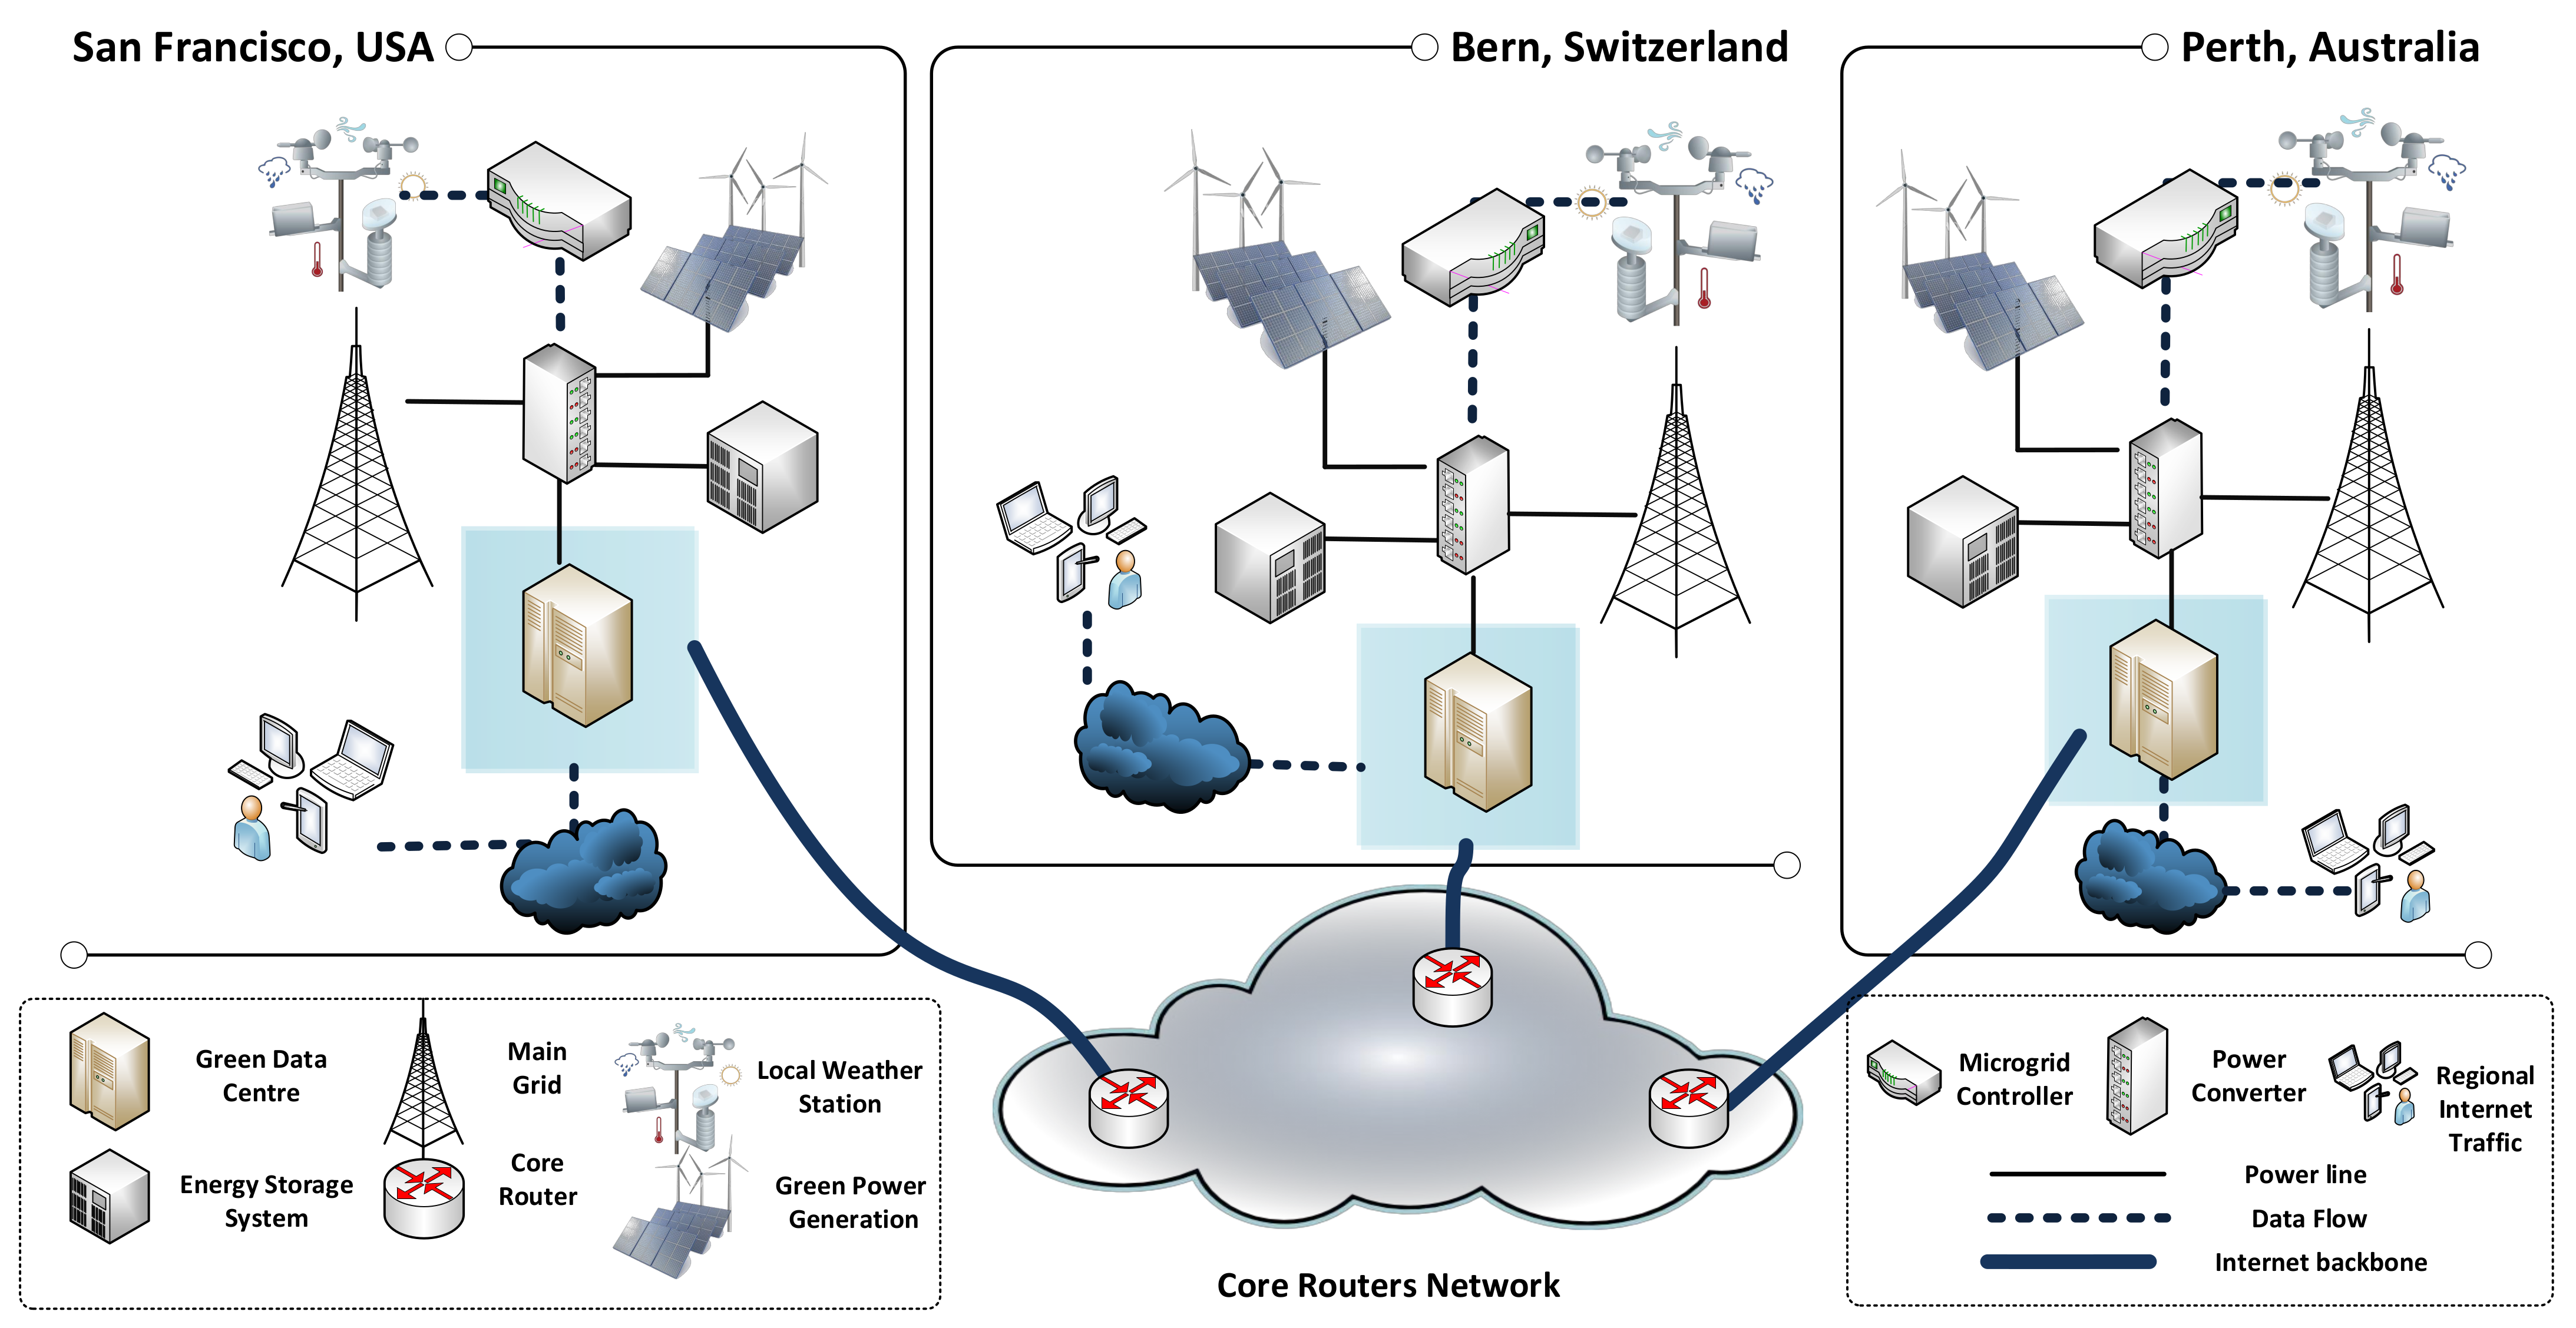
2. System Model
2.1. Data Centre Power Management Model
2.2. Microgrid Power Generation Model
2.3. Data Transfer Model
- Reduction in the power load of sender data centre;
- Increase in the power consumption of the receiver data centre;
- Energy consumed at the core routers for transferring the data as packets.
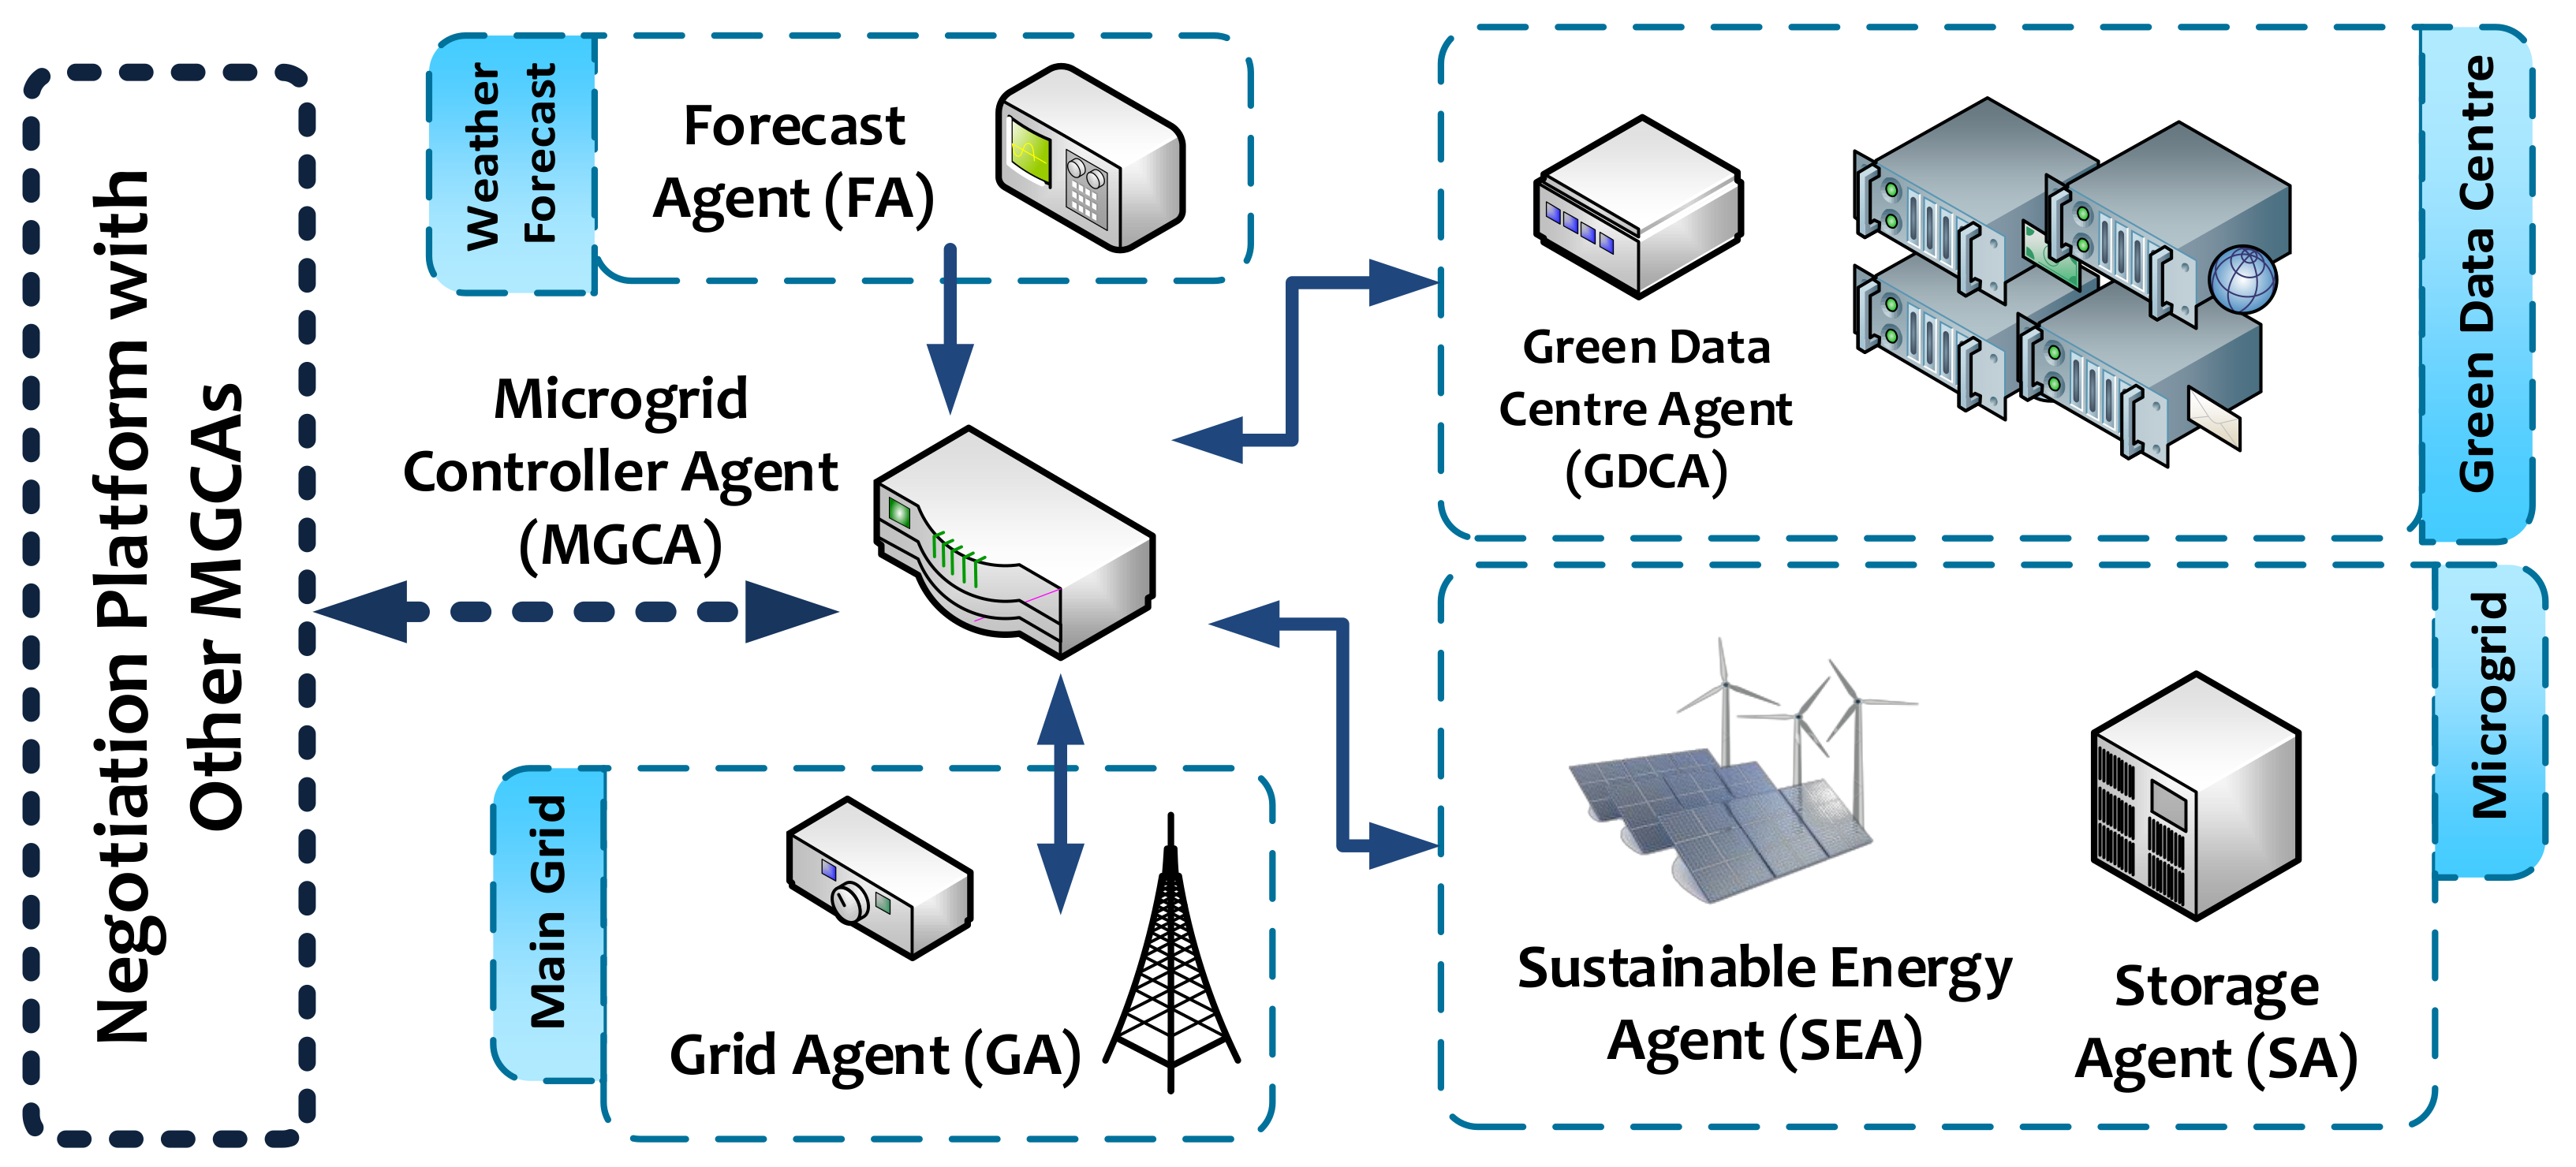
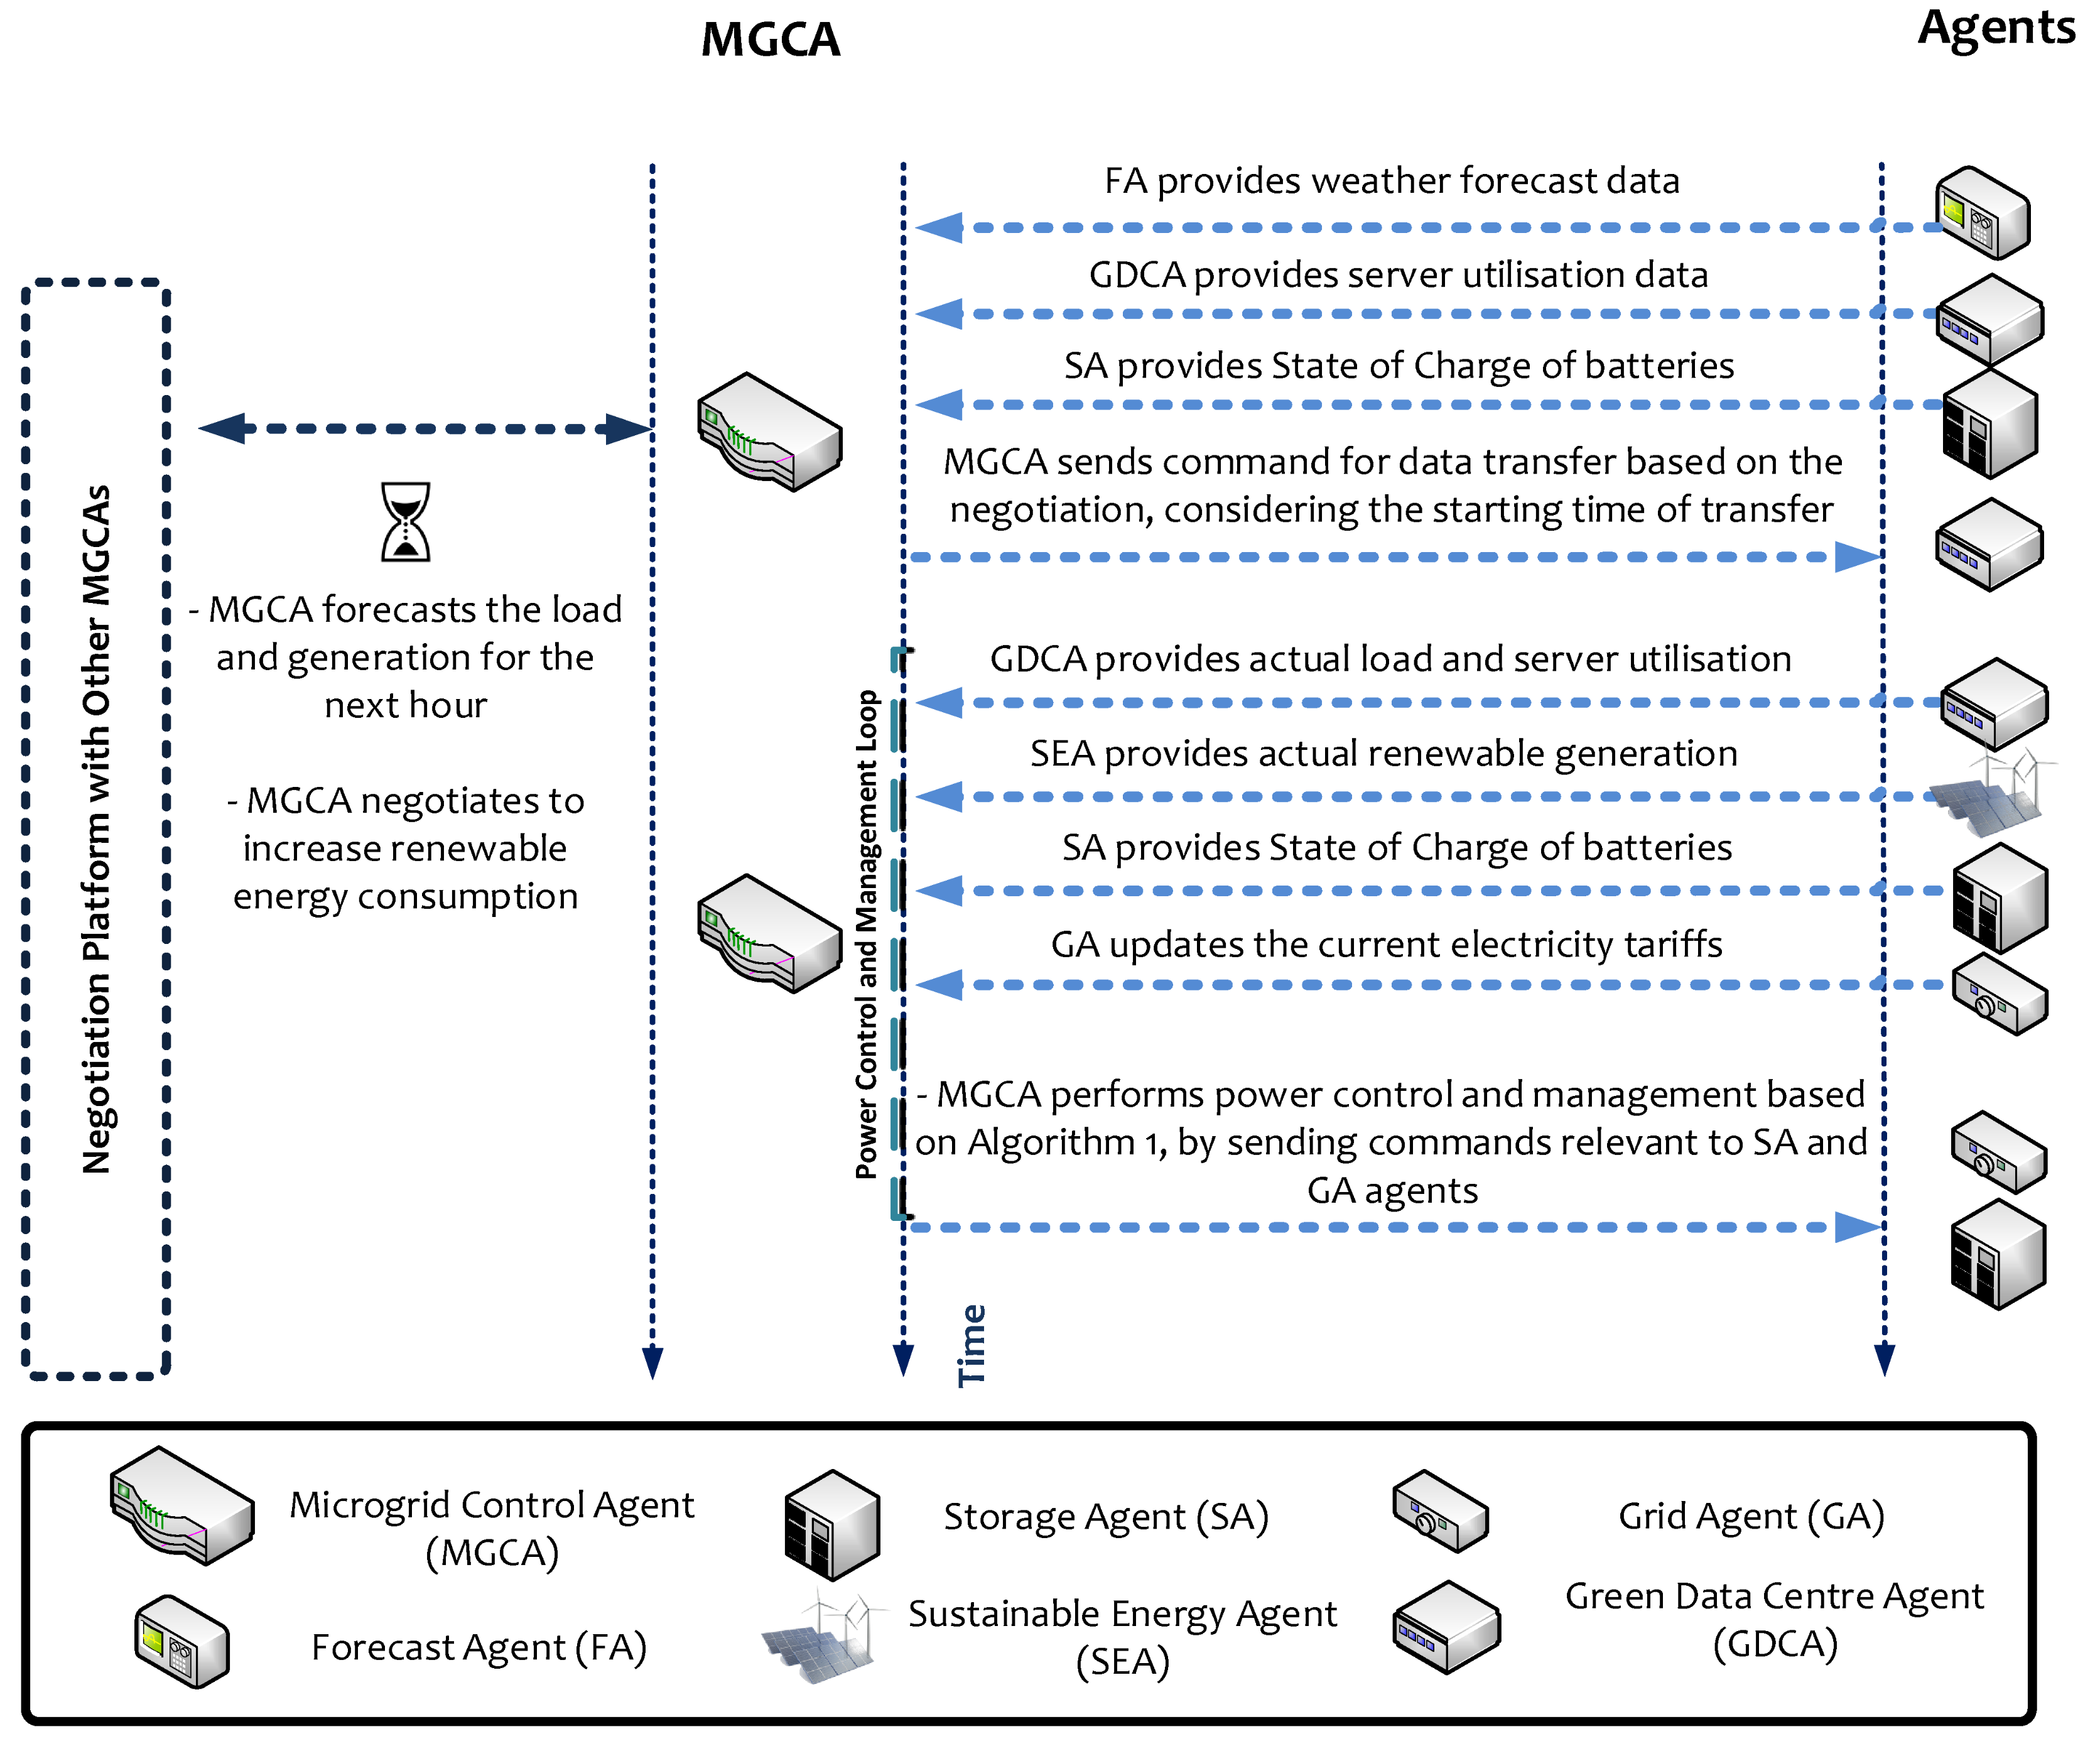
2.4. Agent-Based Management Architecture
- Microgrid Controller Agent (MGCA) is mainly responsible for ensuring the optimal operation of the microgrid to maintain the power balance and other constraints. It has the ability to communicate with all agents dynamically and perform optimisation calculations. It also informs all agents about the optimal operation at the end of negotiations with external microgrid agents.
- Green Data Centre Agent (GDCA) represents the agent which controls and monitors the electrical power and data load balancing within the green data centre by communicating with sub-agents located inside the GDC. It also communicates with the MGCA for sending and receiving control and management information.
- Sustainable Energy Agent (SEA) monitors the generation of sustainable energy (PV and wind) and updates the MGCA with this information at each time step considered. It is physically connected to the generation unit, in order to relay the commands from the MGCA in regards to power management.
- Storage Agent (SA) communicates with the MGCA and is physically connected to the storage units. The SA controls the charging and discharging of the storage electricity on demand. It can keep track of different predefined status values for delivery to the MGCA, if required.
- Grid Agent (GA) switches the connection between the microgrid and the main grid upon request. It receives commands from the MGCA regarding the optimal system operation. It also updates the MGCA with information about the electricity price of the main grid.
- Forecast Agent (FA) is responsible for providing the MGCA with forecast data regarding the generation of sustainable energy. The information provided by the FA is used by the MGCA in the negotiations with other MGCAs in an integrated system.
3. Optimising Sustainability
| Algorithm 1: Management of RE generation excess or shortfall. |
 |
4. Evaluation
4.1. Case Study
4.2. Simulation
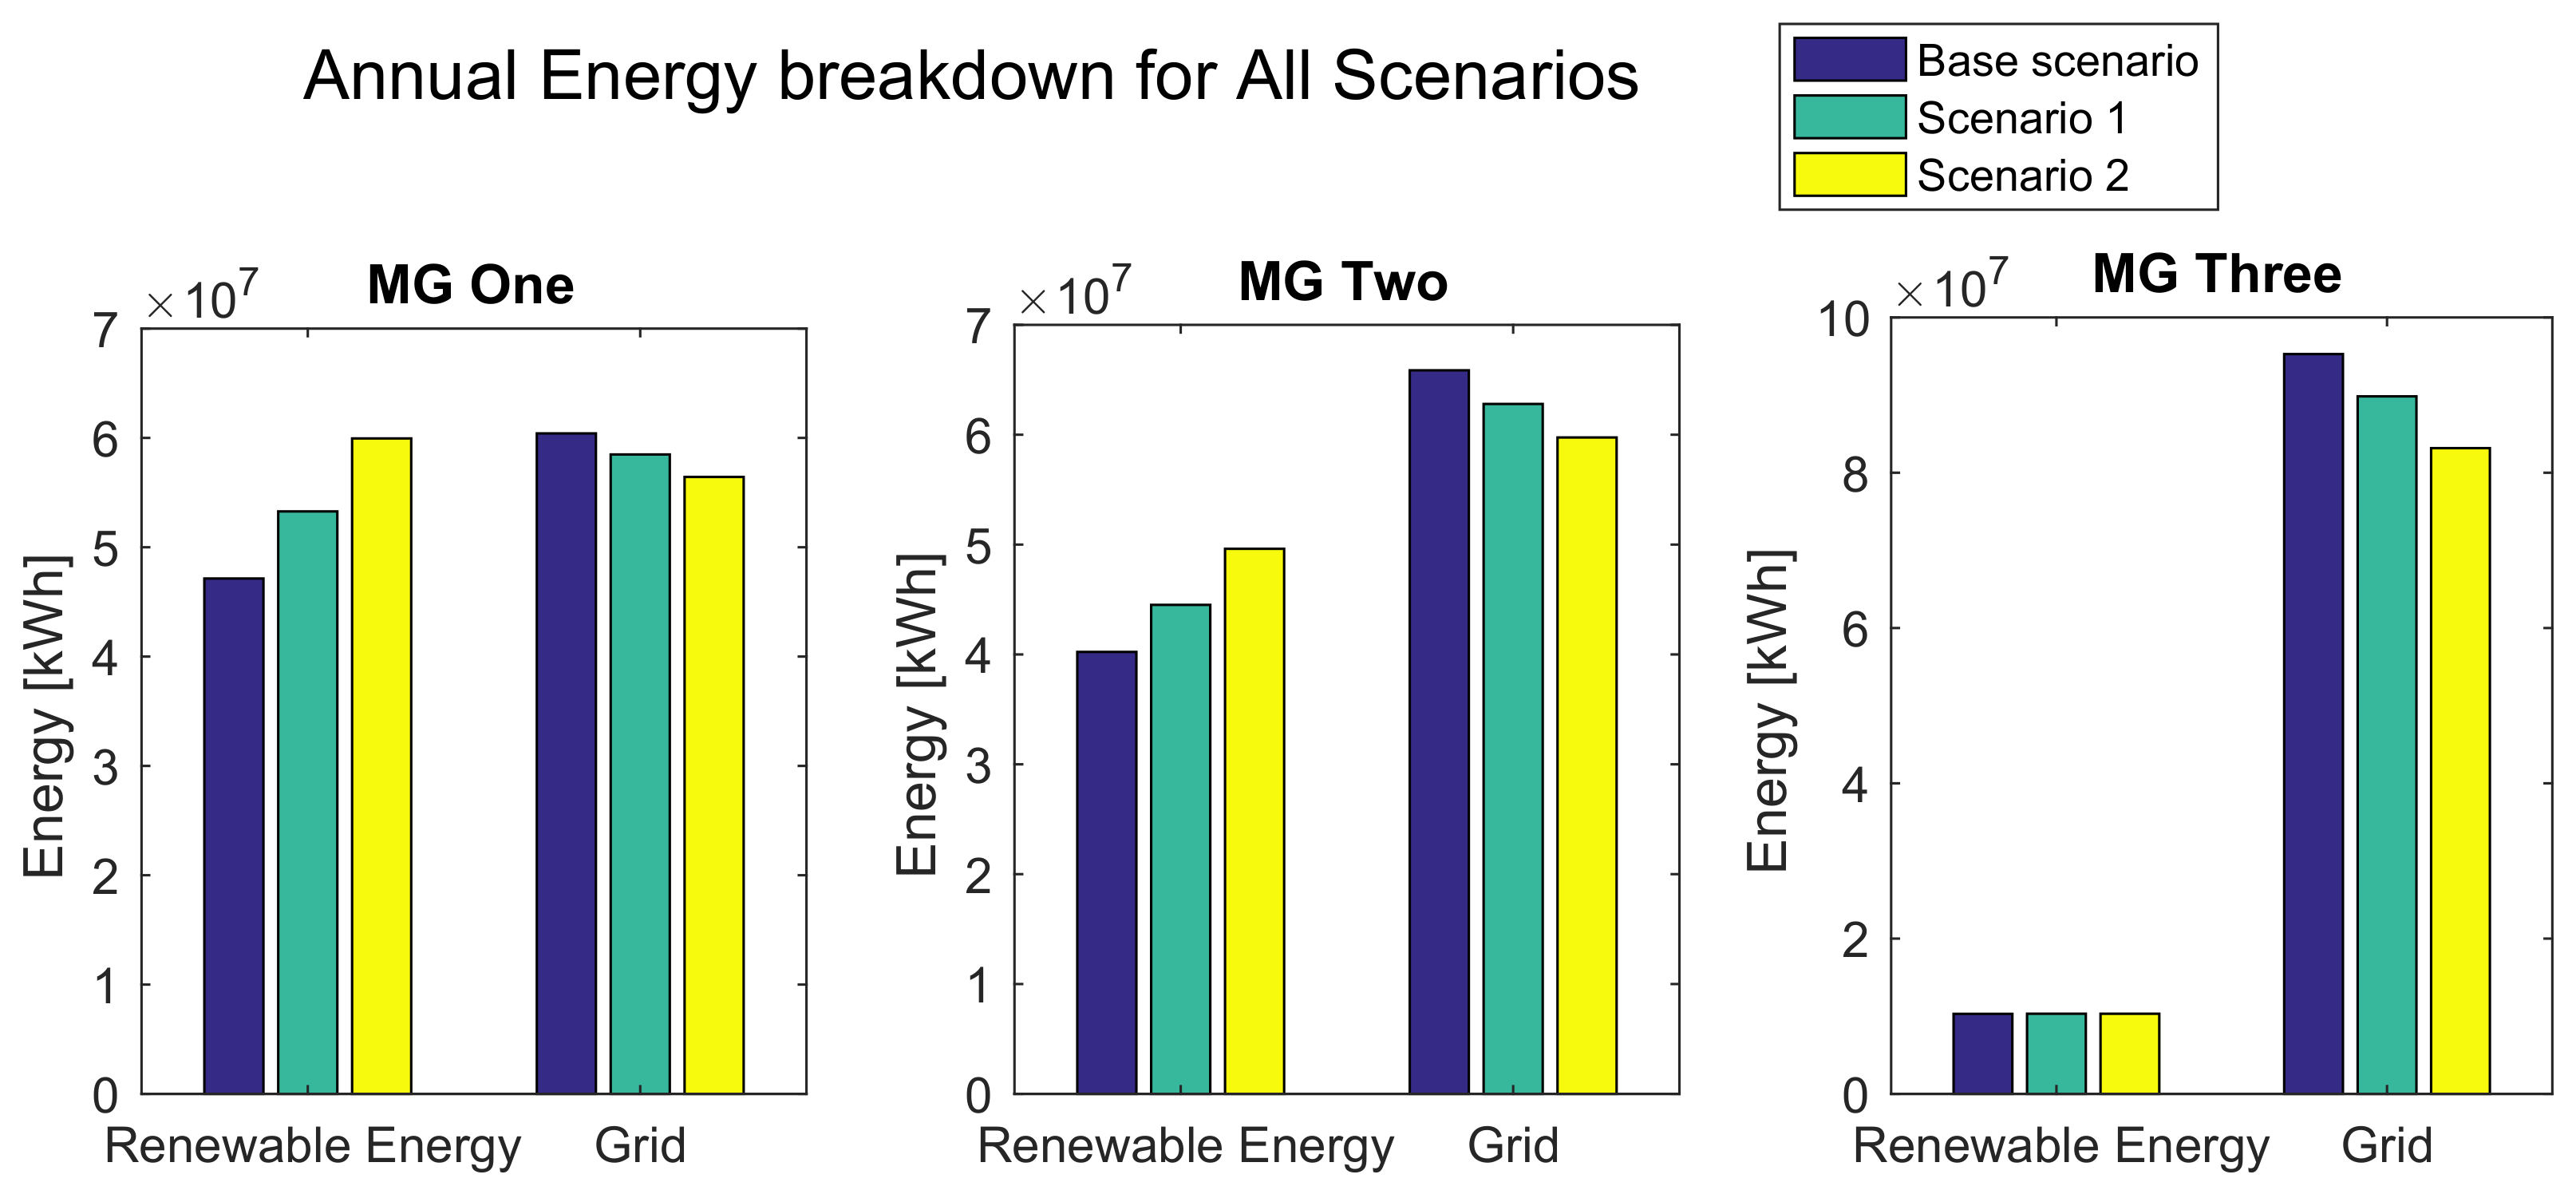
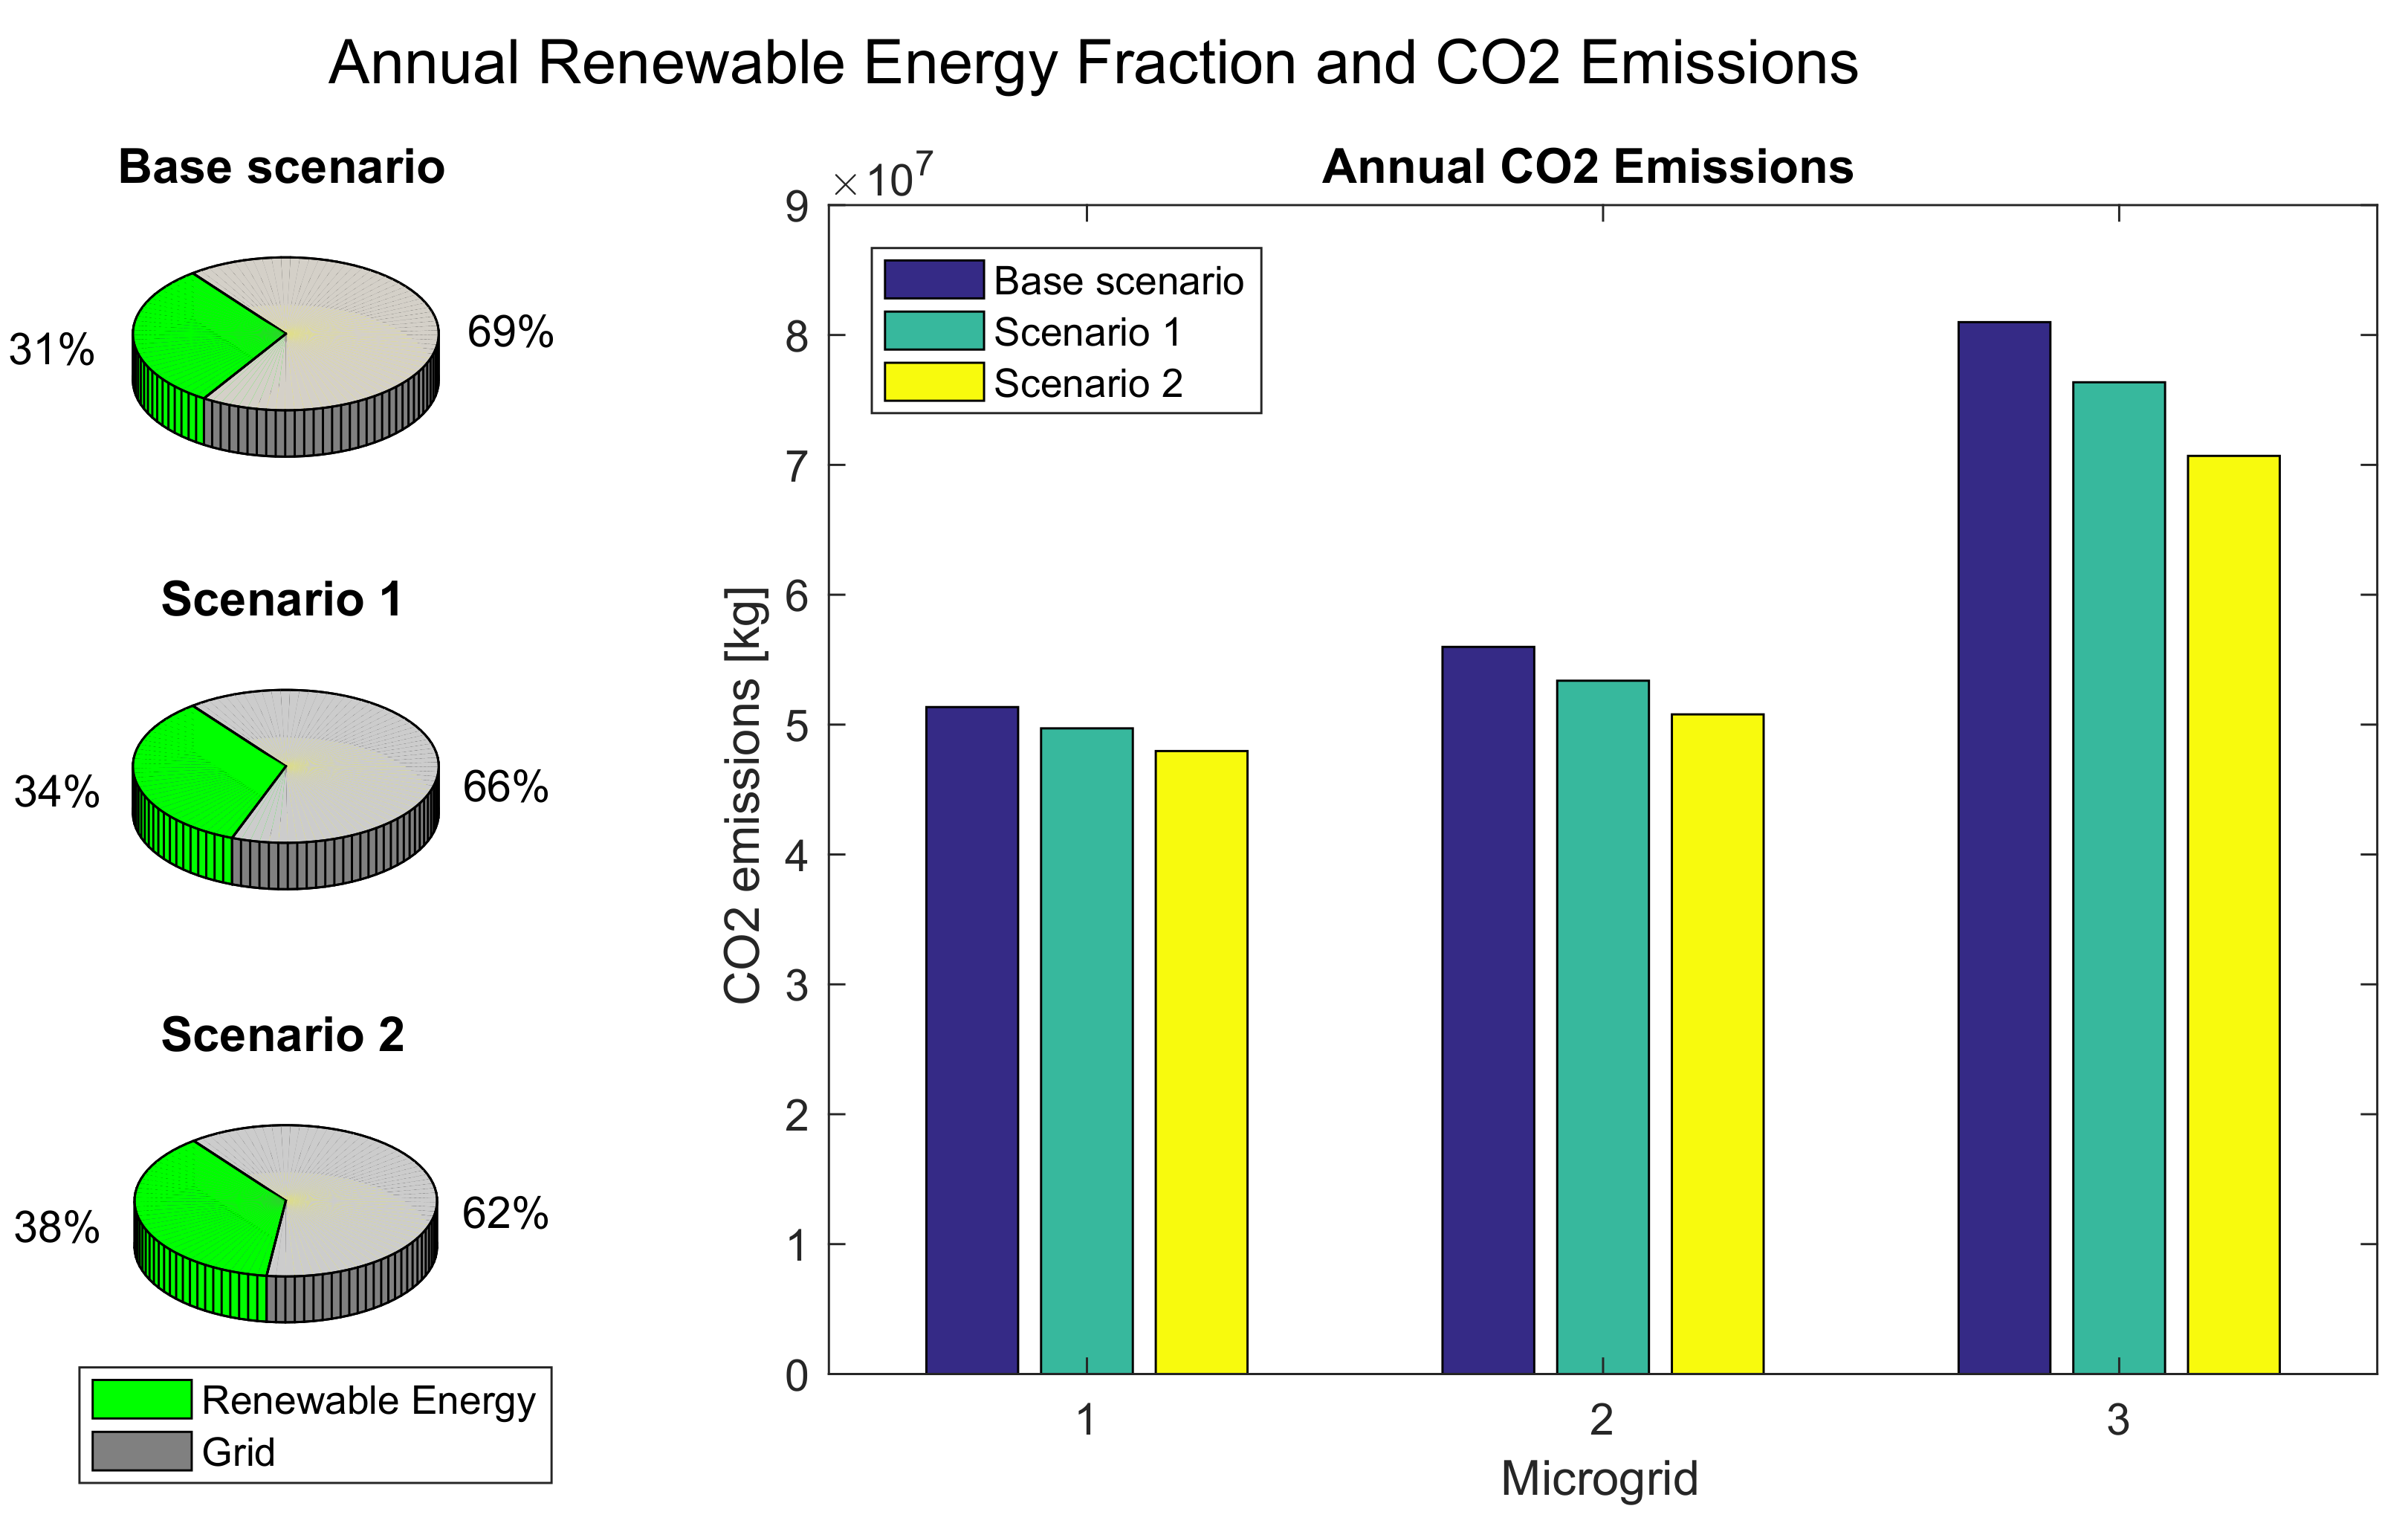
5. Results and Discussion
6. Conclusions
Author Contributions
Funding
Conflicts of Interest
References
- Bilal, K.; Malik, S.U.R.; Khalid, O.; Hameed, A.; Alvarez, E.; Wijaysekara, V.; Irfan, R.; Shrestha, S.; Dwivedy, D.; Ali, M.; et al. A Taxonomy and Survey on Green Data Centre Networks. Future Gener. Comput. Syst. 2014, 36, 189–208. [Google Scholar] [CrossRef]
- Ghamkhari, M.; Mohsenian-Rad, H. Energy and Performance Management of Green Data Centres: A Profit Maximization Approach. IEEE Trans. Smart Grid 2013, 4, 1017–1025. [Google Scholar] [CrossRef]
- Basmadjian, R.; Bouvry, P.; Costa, G.; Gyarmati, L.; Kliazovich, D.; Lafond, S.; Laurent, L.; Meer, H.; Pierson, J.M.; Pries, R.; et al. Green Data Centres. In Large-Scale Distributed Systems and Energy Efficiency: A Holistic View; John Wiley & Sons: Hoboken, NJ, USA, 2015; pp. 159–196. [Google Scholar]
- Baccour, E.; Foufou, S.; Hamila, R.; Tari, Z.; Zomaya, A. PTNet: An Efficient and Green Data Centre Network. J. Parallel Distrib. Comput. 2017, 107, 3–18. [Google Scholar] [CrossRef]
- Liu, Z.; Wierman, A.; Chen, Y.; Razon, B.; Chen, N. Data Centre Demand Response: Avoiding the Coincident Peak via Workload Shifting and Local Generation. Perform. Eval. 2013, 70, 770–791. [Google Scholar] [CrossRef]
- Hatziargyriou, N. Microgrids: Architectures and Control; John Wiley & Sons: Hoboken, NJ, USA, 2014. [Google Scholar]
- Katiraei, F.; Iravani, R.; Hatziargyriou, N.; Dimeas, A. Microgrids Management. IEEE Power Energy Mag. 2008, 6, 54–65. [Google Scholar] [CrossRef]
- Han, H.; Hou, X.; Yang, J.; Wu, J.; Su, M.; Guerrero, J.M. Review of Power Sharing Control Strategies for Islanding Operation of AC Microgrids. IEEE Trans. Smart Grid 2016, 7, 200–215. [Google Scholar] [CrossRef]
- Chaires, J.; Karayaka, H.B.; Yan, Y.; Gardner, P. Solar Farm Hourly Dispatching using Super-capacitor and Battery System. In Proceedings of the Power Systems Conference (PSC), 2016 Clemson University, Clemson, SC, USA, 8–11 March 2016; pp. 1–7. [Google Scholar]
- Yang, Y.; Ye, Q.; Tung, L.J.; Greenleaf, M.; Li, H. Integrated Size and Energy Management Design of Battery Storage to Enhance Grid Integration of Large-Scale PV Power Plants. IEEE Trans. Ind. Electron. 2018, 65, 394–402. [Google Scholar] [CrossRef]
- Zhang, M.; Zhou, D.; Zhou, P. A real option model for renewable energy policy evaluation with application to solar PV power generation in China. Renew. Sustain. Energy Rev. 2014, 40, 944–955. [Google Scholar] [CrossRef]
- Dincer, F. The Analysis on Photovoltaic Electricity Generation Status, Potential and Policies of the Leading Countries in Solar Energy. Renew. Sustain. Energy Rev. 2011, 15, 713–720. [Google Scholar] [CrossRef]
- Olivares, D.E.; Mehrizi-Sani, A.; Etemadi, A.H.; Cañizares, C.A.; Iravani, R.; Kazerani, M.; Hajimiragha, A.H.; Gomis-Bellmunt, O.; Saeedifard, M.; Palma-Behnke, R.; et al. Trends in Microgrid Control. IEEE Trans. Smart Grid 2014, 5, 1905–1919. [Google Scholar] [CrossRef]
- Lin, M.; Liu, Z.; Wierman, A.; Andrew, L.L.H. Online Algorithms for Geographical Load Balancing. In Proceedings of the 2012 International Green Computing Conference (IGCC), San Jose, CA, USA, 4–8 June 2012; pp. 1–10. [Google Scholar] [CrossRef]
- Chen, T.; Marques, A.G.; Giannakis, G.B. DGLB: Distributed Stochastic Geographical Load Balancing over Cloud Networks. IEEE Trans. Parallel Distrib. Syst. 2017, 28, 1866–1880. [Google Scholar] [CrossRef]
- Kiani, A.K.; Ansari, N. On The Fundamental Energy Trade-offs of Geographical Load Balancing. IEEE Commun. Mag. 2017, 55, 170–175. [Google Scholar] [CrossRef][Green Version]
- Xu, Y.; Zhan, Y.; Xu, D. Building Cost-efficient Cloud Data Centres via Geographical Load Balancing. In Proceedings of the IEEE Symposium Computers and Communications (ISCC), Heraklion, Greece, 3–6 July 2017; pp. 826–831. [Google Scholar] [CrossRef]
- Nam, T.M.; Thanh, N.H.; Tuan, D.A. Green data center using centralized power-management of network and servers. In Proceedings of the International Conference on Electronics, Information, and Communication (ICEIC), Danang, Vietnam, 27–30 January 2016; pp. 1–4. [Google Scholar] [CrossRef]
- Tripathi, R.; Vignesh, S.; Tamarapalli, V. Optimizing Green Energy, Cost, and Availability in Distributed Data Centers. IEEE Commun. Lett. 2017, 21, 500–503. [Google Scholar] [CrossRef]
- Kim, K.; Yang, F.; Zavala, V.M.; Chien, A.A. Data Centers as Dispatchable Loads to Harness Stranded Power. IEEE Trans. Sustain. Energy 2017, 8, 208–218. [Google Scholar] [CrossRef]
- Rahmani, R.; Moser, I.; Seyedmahmoudian, M. A Complete Model for Modular Simulation of Data Centre Power Load. arXiv 2018, arXiv:1804.00703. [Google Scholar]
- Macías, M.; Guitart, J. SLA negotiation and enforcement policies for revenue maximization and client classification in cloud providers. Future Gener. Comput. Syst. 2014, 41, 19–31. [Google Scholar] [CrossRef]
- Rahmani, R.; Moser, I.; Seyedmahmoudian, M. Multi-agent based operational cost and inconvenience optimization of PV-based microgrid. Sol. Energy 2017, 150, 177–191. [Google Scholar] [CrossRef]
- Logenthiran, T.; Srinivasan, D.; Khambadkone, A.; Aung, H. Multi-Agent System (MAS) for short-term generation scheduling of a microgrid. In Proceedings of the Sustainable Energy Technologies (ICSET), 2010 IEEE International Conference, Kandy, Sri Lanka, 6–9 December 2010; pp. 1–6. [Google Scholar]
- Vogels, W. Beyond server consolidation. Queue 2008, 6, 20–26. [Google Scholar] [CrossRef]
- Salom, J.; Sisó, L.; Sansigre, M. Cost-Effective Renewable Cooling on Green Data Centres; Technical Report; Citeseer: Princeton, NJ, USA, 2014. [Google Scholar]
- Pelley, S.; Meisner, D.; Wenisch, T.F.; VanGilder, J.W. Understanding and abstracting total data center power. Workshop Energy-Effic. Des. 2009, 11, 1–6. [Google Scholar]
- Logenthiran, T.; Srinivasan, D.; Khambadkone, A.M.; Raj, T.S. Optimal sizing of distributed energy resources for integrated microgrids using evolutionary strategy. In Proceedings of the Evolutionary Computation (CEC), 2012 IEEE Congress, Brisbane, QLD, Australia, 10–15 June 2012; pp. 1–8. [Google Scholar]
- Zou, C.; Kallapur, A.G.; Manzie, C.; Nešić, D. PDE battery model simplification for SOC and SOH estimator design. In Proceedings of the Decision and Control (CDC), 2015 IEEE 54th Annual Conference, Osaka, Japan, 15–18 December 2015; pp. 1328–1333. [Google Scholar]
- Kollimalla, S.K.; Ukil, A.; Gooi, H.; Manandhar, U.; Tummuru, N.R. Optimization of Charge/Discharge Rates of a Battery Using a Two-Stage Rate-Limit Control. IEEE Trans. Sustain. Energy 2017, 8, 516–529. [Google Scholar] [CrossRef]
- Prajapati, V.; Hess, H.; William, E.J.; Gupta, V.; Huff, M.; Manic, M.; Rufus, F.; Thakker, A.; Govar, J. A literature review of state of-charge estimation techniques applicable to lithium poly-carbon monoflouride (LI/CFx) battery. In Proceedings of the Power Electronics (IICPE), 2010 India International Conference on IEEE, New Delhi, India, 28–30 January 2011; pp. 1–8. [Google Scholar]
- Wu, Y.; Zhang, Z.; Wu, C.; Guo, C.; Li, Z.; Lau, F.C.M. Orchestrating Bulk Data Transfers across Geo-Distributed Datacenters. IEEE Trans. Cloud Comput. 2017, 5, 112–125. [Google Scholar] [CrossRef]
- Liu, H.; Lam, C.F.; Johnson, C. Scaling optical interconnects in datacenter networks opportunities and challenges for WDM. In Proceedings of the High Performance Interconnects (HOTI), 2010 IEEE 18th Annual Symposium, Mountain View, CA, USA, 18–20 August 2010; pp. 113–116. [Google Scholar]
- Mahimkar, A.; Chiu, A.; Doverspike, R.; Feuer, M.D.; Magill, P.; Mavrogiorgis, E.; Pastor, J.; Woodward, S.L.; Yates, J. Bandwidth on demand for inter-data center communication. In Proceedings of the 10th ACM Workshop on Hot Topics in Networks ACM, Cambridge, MA, USA, 14–15 November 2011; p. 24. [Google Scholar]
- Van Uden, R.; Correa, R.A.; Lopez, E.A.; Huijskens, F.; Xia, C.; Li, G.; Schülzgen, A.; De Waardt, H.; Koonen, A.; Okonkwo, C. Ultra-high-density spatial division multiplexing with a few-mode multicore fibre. Nat. Photonics 2014, 8, 865. [Google Scholar] [CrossRef]
- Chen, C.; Barrera, D.; Perrig, A. Modeling Data-Plane Power Consumption of Future Internet Architectures. In Proceedings of the Collaboration and Internet Computing (CIC), 2016 IEEE 2nd International Conference, Pittsburgh, PA, USA, 1–3 November 2016; pp. 149–158. [Google Scholar]
- Cisco Router Products, Cisco. Available online: http://www.cisco.com/en/US/products/ (accessed on 28 February 2018).
- Wang, Z.; Chen, B.; Wang, J. Decentralized energy management system for networked microgrids in grid-connected and islanded modes. IEEE Trans. Smart Grid 2016, 7, 1097–1105. [Google Scholar] [CrossRef]
- Zachar, M.; Daoutidis, P. Microgrid/macrogrid energy exchange: A novel market structure and stochastic scheduling. IEEE Trans. Smart Grid 2017, 8, 178–189. [Google Scholar] [CrossRef]
- Rahmani, R.; Yusof, R. A new simple, fast and efficient algorithm for global optimization over continuous search-space problems: Radial Movement Optimization. Appl. Math. Comput. 2014, 248, 287–300. [Google Scholar] [CrossRef]
- Rahmani, R.; Rubiyah, Y.; Ismail, N. A new metaheuristic algorithm for global optimization over continuous search space. ICIC Express Lett 2015, 9, 1335–1340. [Google Scholar]
- Mahrami, M.; Rahmani, R.; Seyedmahmoudian, M.; Mashayekhi, R.; Karimi, H.; Hosseini, E. A hybrid metaheuritic technique developed for hourly load forecasting. Complexity 2016, 21, 521–532. [Google Scholar] [CrossRef]
- Seyedmahmoudian, M.; Horan, B.; Rahmani, R.; Maung Than Oo, A.; Stojcevski, A. Efficient photovoltaic system maximum power point tracking using a new technique. Energies 2016, 9, 147. [Google Scholar] [CrossRef]
- Chang, Y.; Huang, R.; Ries, R.J.; Masanet, E. Life-Cycle comparison of greenhouse gas emissions and water consumption for coal and shale gas fired power generation in China. Energy 2015, 86, 335–343. [Google Scholar] [CrossRef]


Publisher’s Note: MDPI stays neutral with regard to jurisdictional claims in published maps and institutional affiliations. |
© 2022 by the authors. Licensee MDPI, Basel, Switzerland. This article is an open access article distributed under the terms and conditions of the Creative Commons Attribution (CC BY) license (https://creativecommons.org/licenses/by/4.0/).
Share and Cite
Rahmani, R.; Moser, I.; Cricenti, A.L. Inter-continental Data Centre Power Load Balancing for Renewable Energy Maximisation. Electronics 2022, 11, 1564. https://doi.org/10.3390/electronics11101564
Rahmani R, Moser I, Cricenti AL. Inter-continental Data Centre Power Load Balancing for Renewable Energy Maximisation. Electronics. 2022; 11(10):1564. https://doi.org/10.3390/electronics11101564
Chicago/Turabian StyleRahmani, Rasoul, Irene Moser, and Antonio L. Cricenti. 2022. "Inter-continental Data Centre Power Load Balancing for Renewable Energy Maximisation" Electronics 11, no. 10: 1564. https://doi.org/10.3390/electronics11101564
APA StyleRahmani, R., Moser, I., & Cricenti, A. L. (2022). Inter-continental Data Centre Power Load Balancing for Renewable Energy Maximisation. Electronics, 11(10), 1564. https://doi.org/10.3390/electronics11101564