Article

Financial Data Anomaly Discovery Using Behavioral Change Indicators

1
Centre of Information Systems Design Technologies, Kaunas University of Technology, Studentų g. 50, LT-51368 Kaunas, Lithuania
2
Intellerts, UAB, Studentų g. 3A-9, LT-50232 Kaunas, Lithuania
3
Intellerts B.V., Europalaan 400-7, 3526 KS Utrecht, The Netherlands
*
Authors to whom correspondence should be addressed.
Electronics 2022, 11(10), 1598; https://doi.org/10.3390/electronics11101598
Submission received: 11 April 2022 / Revised: 11 May 2022 / Accepted: 12 May 2022 / Published: 17 May 2022
(This article belongs to the Special Issue Feature Papers in Computer Science & Engineering)

Abstract

:
In this article we present an approach to financial data analysis and anomaly discovery. In our view, the assessment of performance management requires the monitoring of financial performance indicators (KPIs) and the characteristics of changes in KPIs over time. Based on this assumption, behavioral change indicators (BCIs) are introduced to detect and evaluate the changes in traditional KPIs in time series. Three types of BCIs are defined: absolute change indicators (BCI-A), relative change indicators (ratio indicators BCI-RE), and delta change indicators (D-BCI). The technique and advantages of using BCIs to identify unexpected deviations and assess the nature of KPI value changes in time series are discussed and illustrated in case studies. The architecture of the financial data analysis system for financial data anomaly detection is presented. The system prototype uses the Camunda business rules engine to specify KPIs and BCI thresholds. The prototype was successfully put into practice for an analysis of actual financial records (historical data).

1. Introduction

Business enterprise data, covering various perspectives (business process efficiency, financial management, human resource management, etc.), are stored in organizations’ databases. Enterprise activity data can be analyzed to monitor whether the process parameters meet the normative values (or meet the limitations of the thresholds) to analyze the trends of processes and their properties. Enterprise data can be analyzed from different perspectives to discover specific data change patterns, to detect anomalies, and to identify fraud.
Organizations use hundreds of different business metrics, also called KPIs (key performance indicators), to ensure that business processes (the work, sales, and financial results) achieve the desired ends. Depending on their business goals, managers should track business metrics that indicate how the business is performing from a definite analysis perspective.
It is necessary to track standard business metrics and select ones that meet specific performance and data analysis goals. Calculating and monitoring the wrong KPIs is a waste of time, and it means that managers will not notice (or detect) essential factors.
This article is dedicated to solving current financial management problems related to finding anomalies in financial data and identifying possible fraud in financial transactions.
The finance management perspective includes a few types of indicators, namely, profit measures, profitability ratios, capital market ratios, solvency ratios, liquidity ratios, and cash flow measures.
These KPIs describe a company’s business processes and are calculated based on financial data records stored in databases. A key performance indicator (KPI) is a quantifiable measure of performance for a specific target or objective over time. KPIs provide targets for teams and insights that help people across the organization make better decisions. From finance and human resources to marketing and sales, key performance indicators help every business area move forward at the strategic level [1]. KPIs are an important way to ensure that teams or working groups support the organization’s overall goals. Companies need key performance indicators to keep teams aligned, to provide a “health” check for the company, to make adjustments, and to hold teams accountable [2].
In practice, monitoring a company’s financial data is performed using normative limits of KPIs values, called thresholds. The threshold for a specific KPI expresses the allowable limits or ranges of indicator values that assess the compliance of the activity being performed with the normative (safe and unsafe) state.
Thus, financial KPIs describe business processes and allow the status of business processes to be assessed if a specific KPI threshold is known from experience. From our point of view, the analysis of the change in the KPI on the time axis is a relevant and novel approach in determining the nature of the evolution of the KPI, allowing the visualization of this information for financial management experts.
The article is focused on issues related to financial data anomaly discovery. From our point of view, it is essential to analyze the KPIs themselves and their time series (KPI records in the database, changes in KPI values on the time axis), thus identifying trends in KPIs. This can help to analyze the business’s financial condition and predict changes in financial indicators in order to detect possible anomalies in financial data.
Such an analysis of KPI behavior would allow us to determine the trends of KPI changes and deviations from the desired level (the normative or desirable size of KPI changes), as well as to calculate KPI change (speed) parameters, which we call behavioral change indicators (BCIs).
Thus, from a data science perspective, managing the fiscal positions of firms requires knowledge not only of the financial KPIs but also of the changes in the KPIs over time and the characteristics of these changes as expressed by the BCI indicators [1].
In this article, we present a financial KPI analysis using behavioral change indicators (BCIs). The BCI calculation and visualization example provided helps to define the advantages of BCI usage in financial data analysis.
The structure of this paper is as follows. In the second section we analyze related work that examines the use of KPIs and BCIs. In the third section we defines behavioral change indicators aimed at financial data (KPIs) analysis and anomaly detection. We provide are examples of BCI calculation and visualization processes. In the fourth section we describe the problems related to setting KPI and BCI thresholds. The fifth section presents the anomaly detection steps for financial data sets and provides the sub-system architecture for anomaly detection. The sixth section and conclusions summarize the benefits of using BCIs for financial KPI analysis.

2. Related Work

To obtain confirmation regarding the fulfillment of their objectives and goals, organizations have to keep a check on their performance [3]. To achieve these purposes, organizations have to use performance management systems. Simple performance management is performed by organizations to confirm whether they are moving in the right direction. To measure, manage, and compare performance, organizations use performance indicators.
Performance indicators can be defined as the physical values used to measure, compare, and manage the overall organizational performance [4]. Key performance indicators may include customer satisfaction [5,6,7], quality [4,6,8,9,10], flexibility [8,11], delivery reliability [9,11], cost [6,8,11], financial indicators [7,11], employees’ satisfaction [7,12,13], environment/community factors [6,7,11], safety [7,14,15], and learning and growth [7,16,17]. These are the performance indicators described in the literature, and most organizations use these KPIs to measure and manage their performance. The measures are the factors that are used to determine the organization’s performance in terms of performance indicators [4,9,18].
As part of predicting the financial health of customers, quantitative as well as qualitative indicators are used. Quantitative indicators are focused mainly on profit margins, the overall indebtedness of assets, the current ratio, and the average maturity of liabilities. Qualitative indicators focus primarily on previous experience with customers, the risk index of the country which the business subject comes from, the timeframe of the undertaking, the fulfillment of obligations to the state and financial institutions, and information about ongoing litigation [19,20].
Behavioral change indicators play an essential role in this study. Behavioral change indicators are used to monitor or evaluate behavioral changes or actions exhibited by an individual, group, organization, or system before, during, and after an intervention [21]. They are used to study the changes identified in the KPIs. These identifiers play a significant role in investigating financial anomalies using the method proposed by the authors of this study. Behavioral change is challenging to measure since behavior and behavioral shifts are often not logical or linear but instead dynamic, changing, regressing, and progressing. Changes in behavior also can be subtle and difficult to observe or verify. Moreover, indicators can only provide so many clues [22,23]. Practitioners must consider many dimensions in their evaluations, including monitoring behavior over the longer term (perhaps well after an intervention has been completed) and defining casual links. Because of these complexities, behavioral change interventions usually seek to contribute to the desired outcome rather than leading to direct attribution [2]. Behavioral change indicators play an essential role in the detection of financial anomalies.
Anomaly detection is carried out to identify outliers in a data set that is primarily composed of ‘normal’ data points. The idea is to find entries generated by a different process than most of the data. In many cases, this corresponds to finding data created erroneously or by fraudulent activity. Financial transactions are considered exceptionally high-interest data types, where anomalies are regarded with a high level of interest [24,25,26,27,28]. Transaction records capture the flow of assets between parties, which follow specific patterns if observed over long periods. Fraudulent activity often deviates from these patterns, providing an entry point for data-driven fraud detection methods [24,29,30,31].

3. Financial Data Analysis Using Behavioral Change Indicators

Key performance indicators (KPIs) are commonly used for business enterprise performance analysis. Financial key performance indicators measure a company’s performance—a real-world process. Financial KPIs have been divided into seven categories of indicators: profit measures, cash flow measures, profitability ratios, liquidity ratios, solvency ratios, efficiency ratios, and capital market ratios [1,2,7].
We suggest analyzing the company’s financial data, especially changes in financial KPIs over time, using another type of indicator. We recommend using behavioral change indicators (BCIs) to analyze and evaluate the behavior of financial KPIs.
It is known that behavioral change indicators have already been applied in other areas of activity and science, as described below.
The qualitative differences between key performance indicators (KPIs and behavioral change indicators (BCI) can be explained in brief as follows.
  • Financial key performance indicators (KPIs) analyze the enterprise’s performance (business process) using raw financial accounting data.
  • Behavioral change indicators (BCIs) are useful for analyzing financial accounting indicators, evaluating financial KPIs’ time series characteristics, and conducting research with the aim of anomaly detection.
We suggest using the capabilities of BCIs to analyze changes in KPIs over time, providing new opportunities to look for abnormal behavior in economic data and especially to examine suspicious KPI changes

3.1. Financial Data Behavioral Change Indicators (BCI)

Another group of indicators that are used in addition to KPIs as a basis for process analysis (behavior analysis) in various areas of reality (domains) is called behavioral change indicators (BCI).
Behavioral change indicators (BCI) are used for process research in various areas: economics (behavioral economics); psychology and sociology (in the understanding of human behavior) [25]; environmental sciences [26]; climate change monitoring, evaluation, and adaptation [27]; public policy analysis; and other fields of study.
The difference between a KPI and a BCI can be explained as follows: KPIs are used to measure and evaluate outcomes of business processes, and BCIs are used to detect changes in the KPI values over time, assess changes, and achieve a desired target (normative) behavior. BCIs can be used in various activities and disciplines in addition to KPIs.
We implemented a few types of BCIs in the enterprise finance management domain to analyze and evaluate changes in the financial indicators of enterprises over time (Table 1).
Some BCIs not included in Table 1 are also used in practice:
  • BCI-R (t, t*)—the change in the KPI rating in financial period t compared to the same KPI rating in financial period t*;
  • BCI-AR—the occurrence of an unusual or rare KPI value (global anomaly) in some period (t, t*);
  • BCI-ARC—the unusual or rare co-occurrence of two KPI values (local anomaly) in some period (t, t*).
In financial accounting, the accounting period is determined by management regulations and is usually 12 months. Monthly accounting periods are standard in management accounting. There are more than 12 accounting periods in a financial year in ERP tools. Thus, the accounting period is determined by management and varies widely. The financial accounting period t is an attribute (timestamp) in the database of the ERP tool and is interpreted as a time point.
In short, the financial accounting period t will hereafter be referred to as the “financial period t”, indicating a time point on the time axis T (Figure 1), where X(t) is a value of KPI.
We define three types of indicators of changes in the behavior of financial data (BCI):
  • Absolute change indicators (BCI-A);
  • Relative change indicators (ratio indicators BCI-RE); and
  • Delta change indicators (D-BCI).
Definitions of the financial data behavioral change indicators are given below.
The absolute behavioral change indicator (BCI-A) shows the difference in KPI values over given financial accounting periods, i.e., a set of financial years, months, etc. We define three cases of BCA-A calculation:
  • BCI-A1: the absolute change ∆X(t, t′) in KPI in the financial period t compared to the change in the previous period t′:
    ∆X(t, t′) = X(t) − X(t′)
  • BCI-A2: the absolute change ∆XA(t, (t′, t″)) in KPI in the financial period t compared to the moving average of the KPI over the periods (t′, t″):
    ∆XA(t, (t′, t″)) = X(t) − average(X(t′, t″))
  • BCI-RO: the robustness coefficient ∆XRO (t, XN) is the difference between the KPI value in period t and the normative (reference) value XN.
    ∆XRO (t, XN) = X(t) − XN
The relative behavioral change indicator (BCI-RE) is the ratio of the change in the KPI to the previous period’s KPI value (in percentage terms). We define two cases of BCA-RE calculation:
  • BCI-RE1: the relative change ∆XRE (t, t′) KPI is the ratio of the difference in the KPI of the financial period t to the value of the KPI of the previous period t′ (as a percentage):
    ∆XRE(t, t′) = 100 × (X(t) − X(t′))/X(t′)
  • BCI-RE2: the relative change ∆XREA(t, av(t′, t″)) in KPI in the financial period t is the ratio of the change in the KPI to the KPI’s average value over given periods (t′, t″) (in percentage terms):
    ∆XREA(t, (t′, t″)) = 100 × (X(t) − X(t′))/average(X(t′, t″))
The delta behavioral change indicator (D-BCI) shows the change in absolute BCI-A or relative BCI-RE value in financial period t compared to a specific defined period t′ (see Figure 2).
  • Delta change D(∆XA(t, t′)) expresses a difference in BCI-A1 value ∆XA(t, t′) in financial period t compared to the BCI-A1 value ∆XA(t′, t″) in the previous period t′:
    D(∆XA(t, t′)) = ∆XA(t, t′) − ∆XA(t′, t″)
  • Delta change D(∆XRE(t, t′)) expresses a difference in BCI-RE value (∆XRE(t, t′) in financial period t compared to the BCI-RE value (∆XRE(t′, t″) in the previous period t′:
    D(∆XRE(t, t′)) = ∆XRE(t, t′) − ∆XRE(t′, t″)
Other possible types of D-BCI can be calculated similarly, for example, for relative change ∆XREA(t, av(t′, t″)) or the robustness coefficient ∆XRO(t, XN), etc.
  • D-BCI-RO: delta change D(∆XRO(t, XN)) expresses a difference in the robustness coefficient ∆XRO(t, XN) in period t compared to the robustness coefficient ∆XRO(t′, XN) in period t′:
    D(∆XREA(t, t′)) = ∆XRO(t, XN) − ∆XRO(t′, XN)
  • D-BCI-RE: delta of relative change D(∆XREA(t, t′)) expresses the ratio of the change ∆XRE(t, t′) in BCI-RE during period t compared to the change ∆XRE(t′, t″) in BCI-RE during the previous period t′:
    D(∆XREA(t, t′)) = ∆XA(t, t′) − ∆XA(t′, t″)
The delta behavioral change indicator (D-BCI)
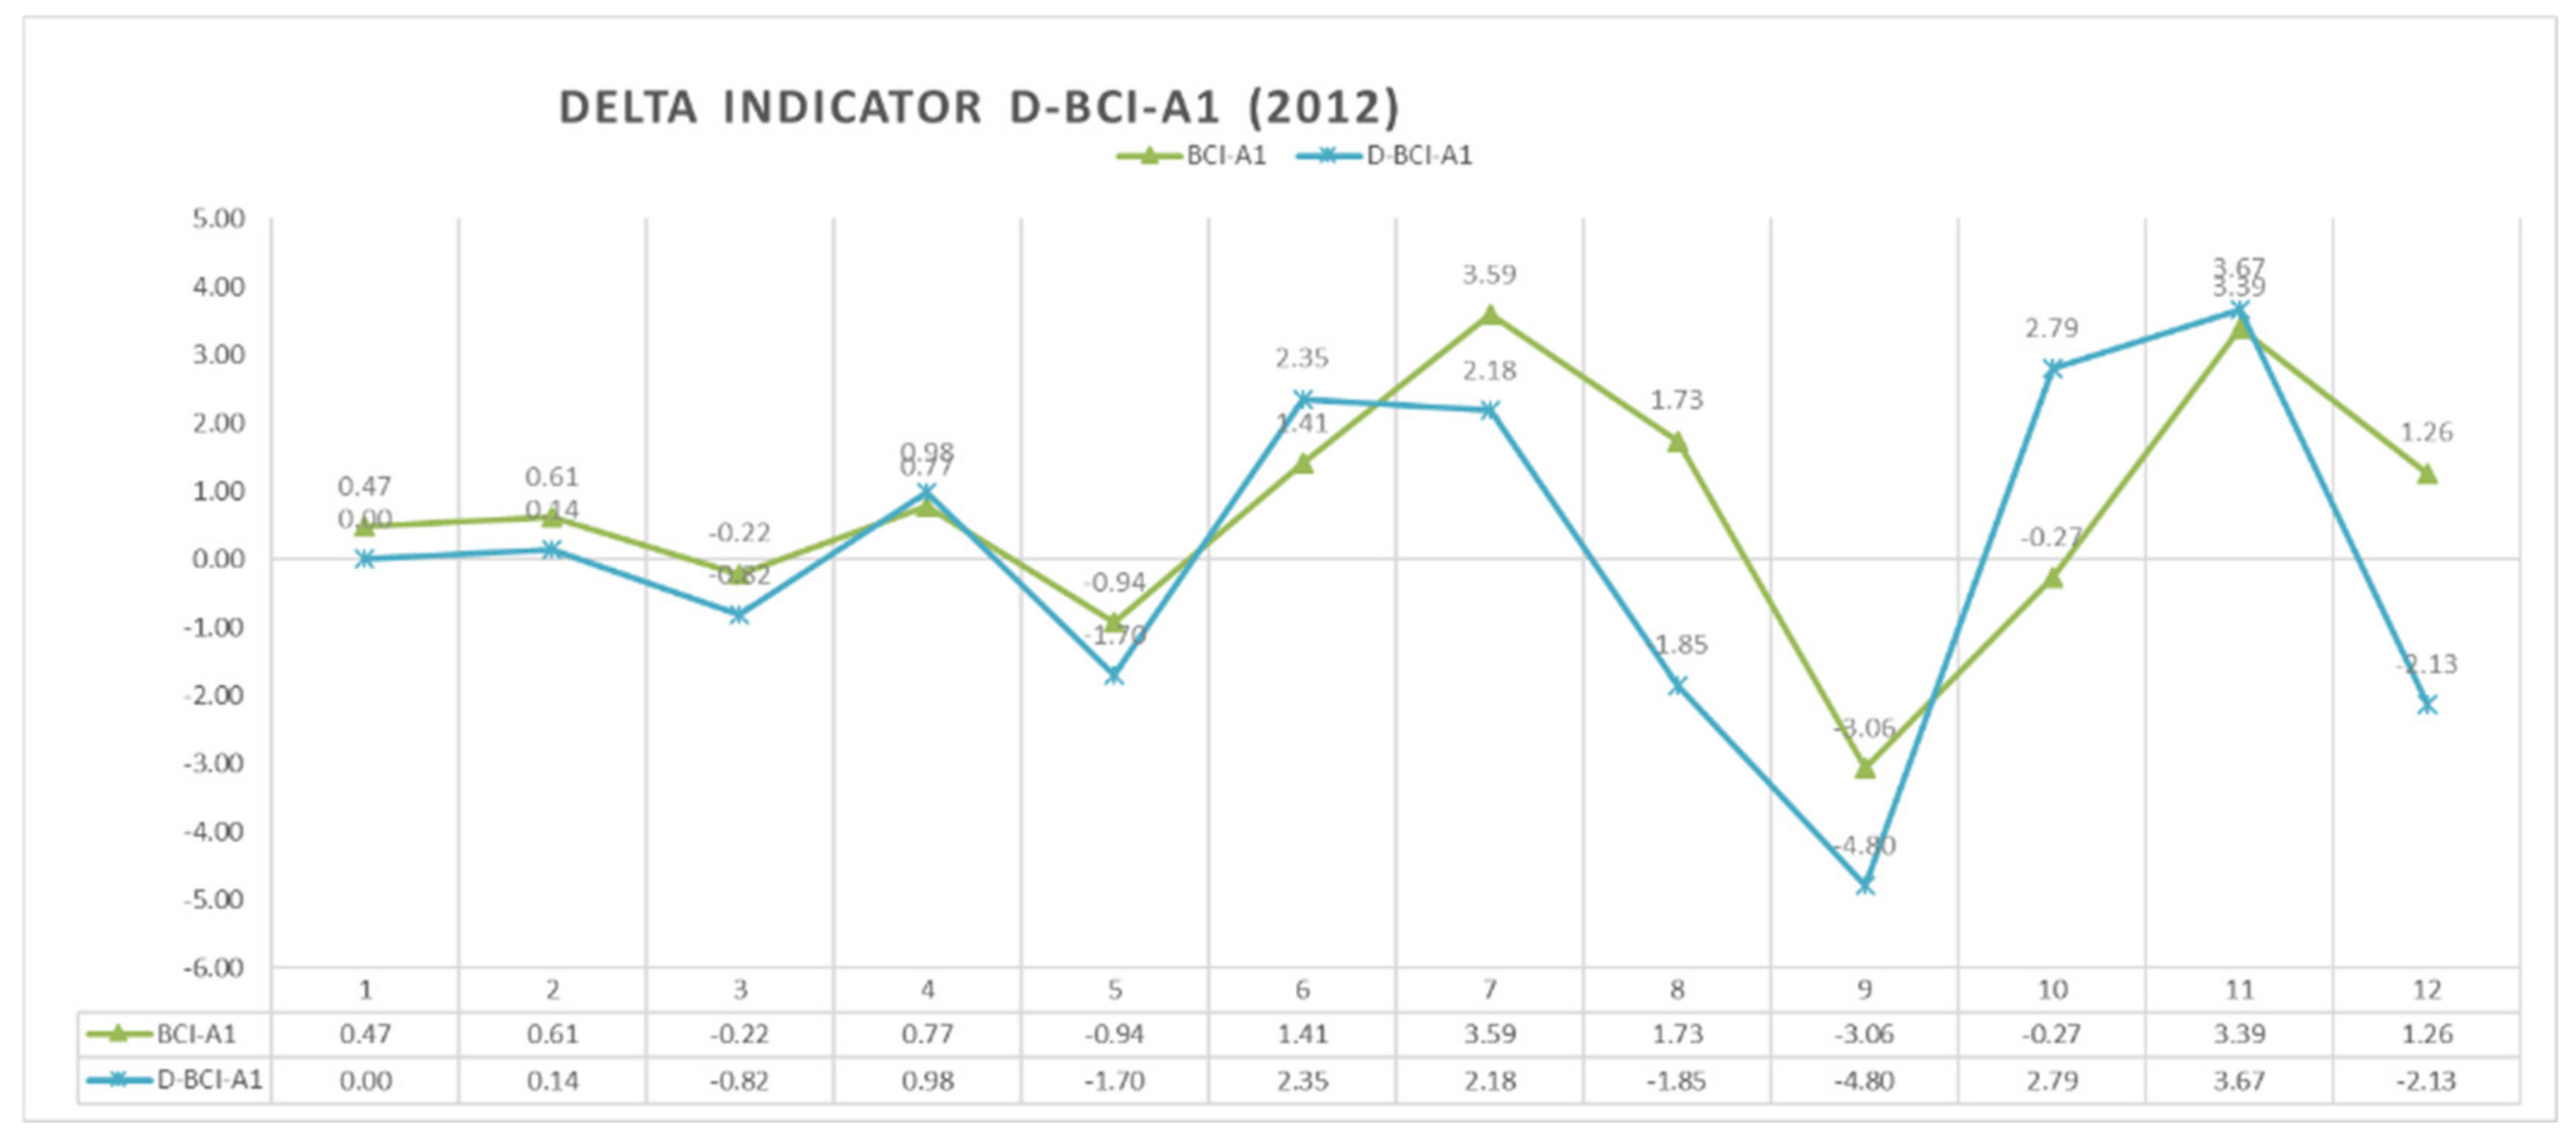
  • D-BCI-A1: the delta change D(∆XA(t, t′)) expresses a difference in the absolute change ∆XA(t, t′) in BCI-A1 during financial period t compared to the change ∆XA(t′, t″) in BCI-A1 during the previous period t′:
    D(∆XA(t, t′)) = ∆XA(t, t′) − ∆XA(t′, t″)
  • D-BCI-A2: delta change D(∆XA(t, (t′, t″))) expresses a difference in the absolute change ∆XA(t, (t′, t″)) in BCI-A2 during financial period t compared to the change ∆XA(t, (t′, t″)) in BCI-A2 (moving average) during the previous period t′:
    D(∆XA(t, (t′, t″))) = ∆XA(t, (t′, t″)) − ∆XA(t′, (t″, t*))
    where:
    ∆XA(t, (t′, t″)) = X(t) − average(X(t′, t″))
    ∆XA(t′, (t″, t*)) = X(t′) − average(X(t″, t*))

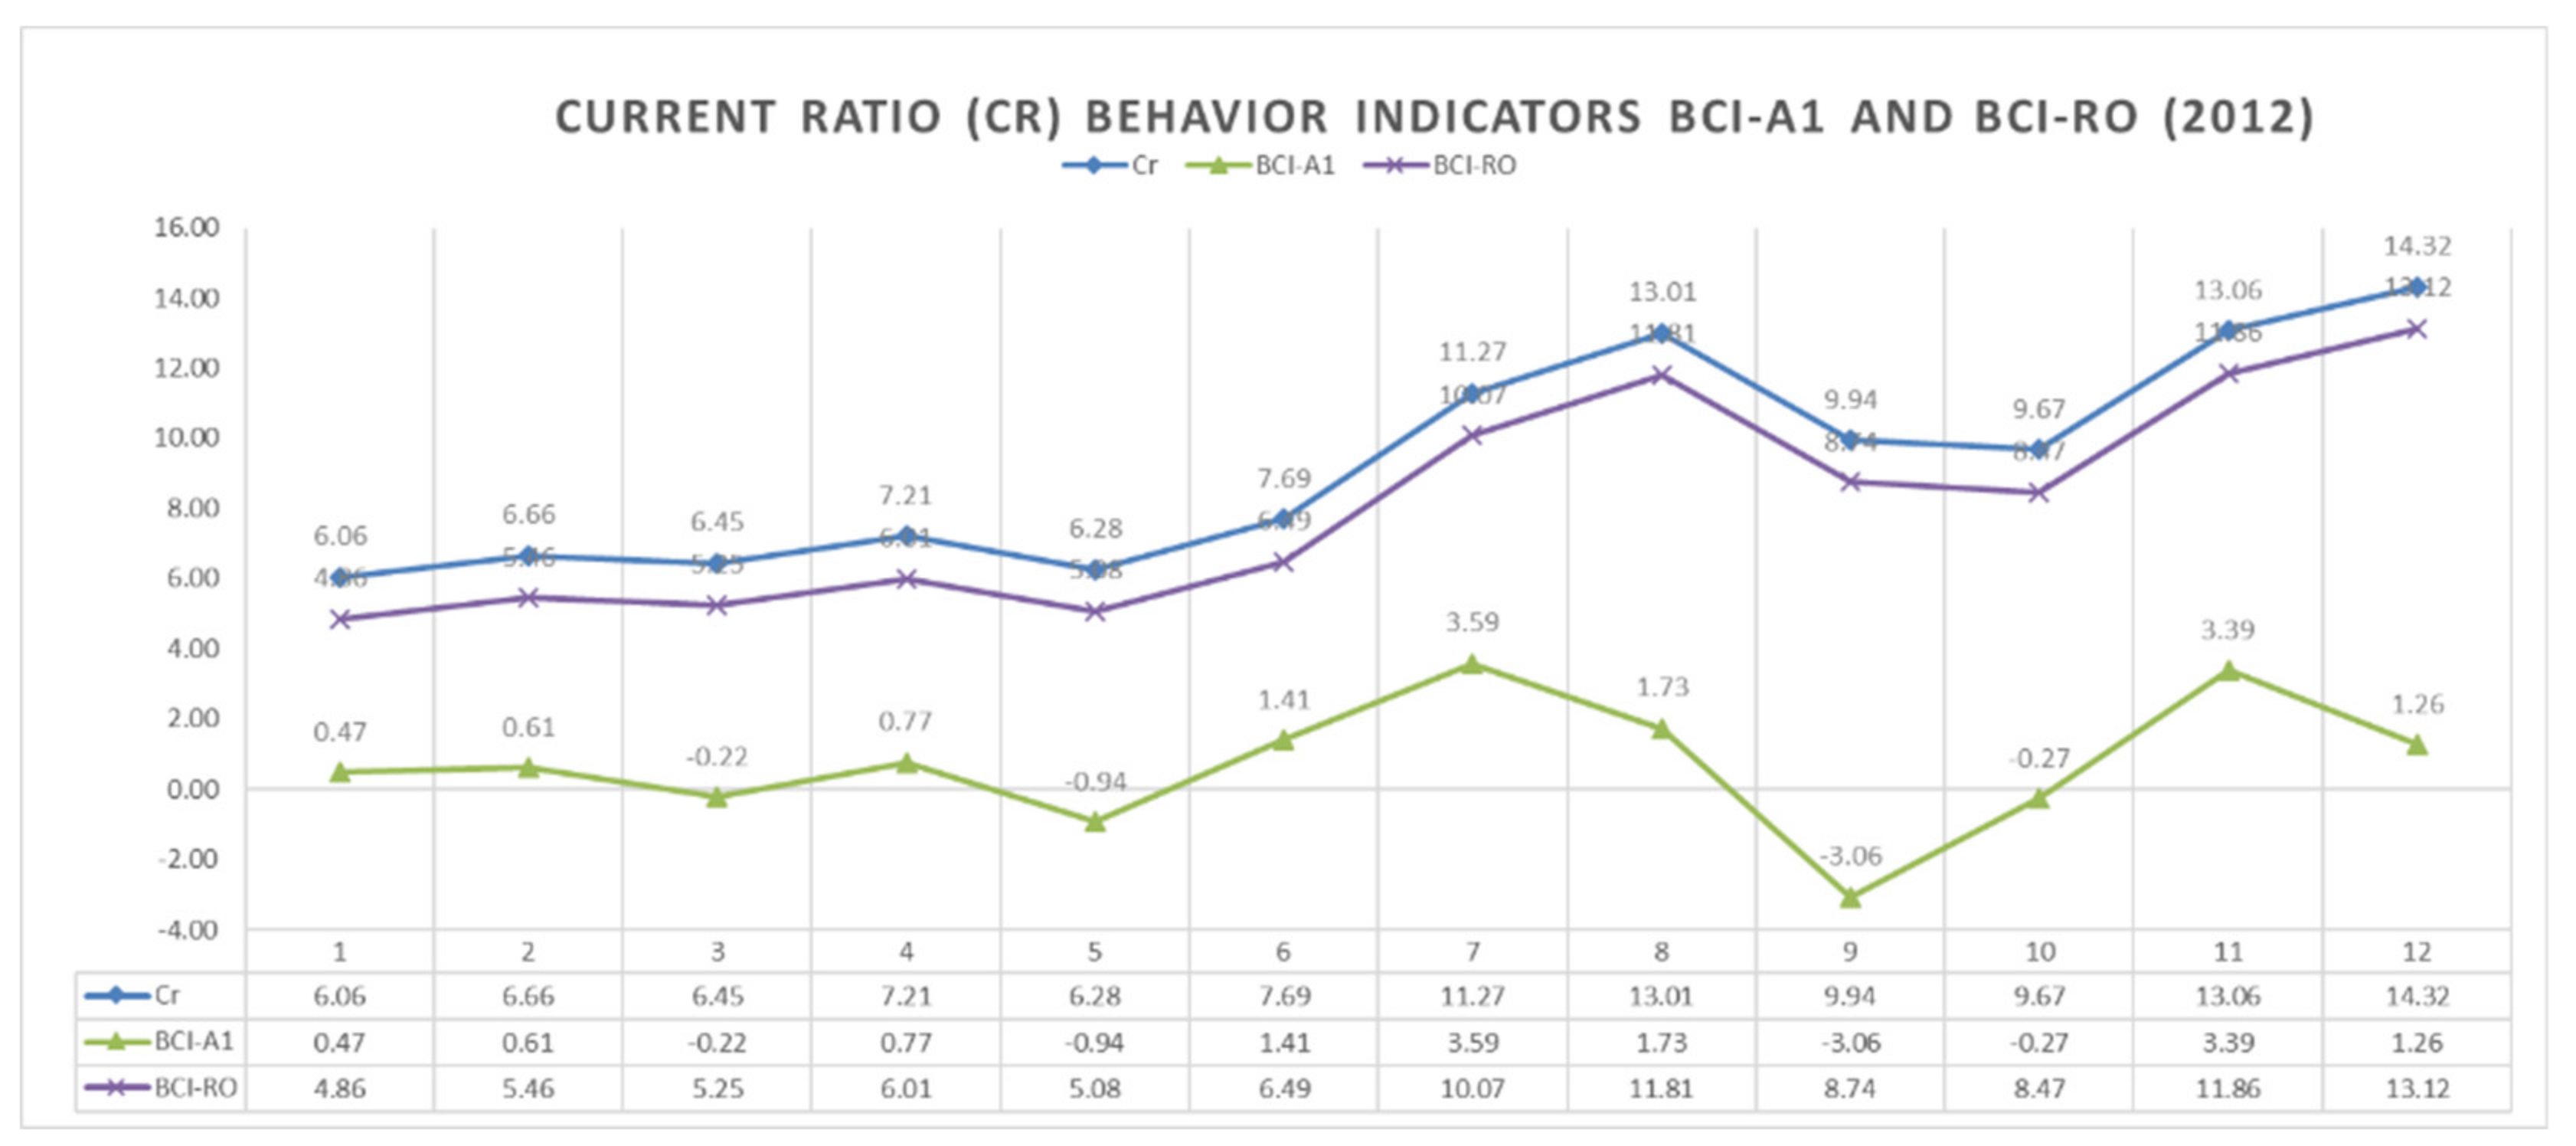
3.2. Example of BCI Calculation and Visualization

Definitions of KPIs and BCIs:
  • Financial KPI type: liquidity ratios
  • KPI = current ratio (Cr)
  • Cr = current assets (CA)/current liabilities (CL)
  • Current ratio safe zone threshold Cr > 1.2
  • Absolute change BCI-A1 shows an absolute KPI change over a certain financial period
  • Absolute change ∆X(t, t*) in KPI = Cr in the financial period t compared to the value in the previous period t*:
    ∆X(t, t*) = X(t) − X(t*)
  • Robustness coefficient (BCI-RO)
  • BCI-RO measures the distance of the KPI = Cr from the reference value (Cr-norm = 1.2)
  • BCI-RO = Cr/Cr-norm, where Cr-norm = 1.2
  • Relative behavioral change indicator (BCI-RE1)
  • BCI-RE1 is the ratio of the change in the KPI = Cr in the financial period t compared to the previous period’s t* value (in percentage terms):
    ∆XRE (t, t*) = 100 × (X(t) − X(t*))/X(t*)
BCI calculations for the financial KPI current ratios (Cr) were performed based on the accurate data set shown in Table 2.
Figure 3 depicts the time series of the Cr values and Cr change indicators BCI-A1 and BCI-RO throughout 2012. However, the intensity of change and abruptness (speed) remains unclear.
The calculation of relative change indicators (BCI-RE) reveals the ratio of CR BCI-A changes in adjacent periods, i.e., the “rate” (intensity) of transformation. The example presented in Figure 4 shows that BCI-RE1 acts as a magnifying glass, revealing sudden current ratio changes: BCI-A1 increased from 1.41 in the 6th period to 3.59 in the 7th period (BCI-RE1 = 46.67%), in addition to an increase from −0.27 in the 10th period to 3.39 in the 11th period (BCI-RE1 = 35.09%) and a decrease from 1.73 in the 8th period to −3.06 in the 9th period.
The delta behavioral change indicator (D-BCI) shows the change in the absolute or relative BCI value in financial period t compared to specifically defined period t‘. An example of the D-BCI-A1 calculation is presented below.
The D-BCI-A1 value D(∆XA(t, t′)) is the difference in the BCI-A1 value ∆XA(t, t′) in financial period t compared to the BCI-A1 value ∆XA(t′, t″) in the previous period t′:
D(∆XA(t, t′)) = ∆XA(t, t′) − ∆XA(t′, t″)
The visualization of delta indicator D-BCI-A1 in Figure 5 shows a trend of BCI-A1 changes in 2012 by months: (0.00, 0.14, −0.82, 0.98, −1.70, 2.35, 2.18, −1.85, −4.80, 2.79, 3.67, −2.13).

4. Thresholds of KPIs and BCIs

A change in the value of a KPI, if it exceeds a certain threshold (considered sudden, unusual, anomalous, or suspicious), is one of the most important signs of a change in a company’s decisions or business processes, human resources, or accounting policies.
Therefore, the behavioral change indicators (BCIs) presented in Table 3 are useful for detecting financial KPI anomalies over different periods.
Financial KPI thresholds (normative values) help to assess the state of a company’s operations during the financial period, allowing the creation of templates (patterns) that the software system uses to perform such an assessment (e.g., safe zone, risk zone, disaster zone) automatically.
Another issue is the financial limits (normative values, thresholds) of the BCIs, which should be set separately for each KPI. By setting BCI thresholds, templates are able to be created. The software system would automatically assess the BCI values and the risks of changes in the KPI time series and detect KPI changes indicating anomalies in financial data.
Determining acceptable limits (normative values, thresholds) for financial BCIs (for specific KPIs) is a complex issue, requiring expert knowledge-based research. The method proposed in our project is to allow the expert to select acceptable BCI thresholds experimentally using the dashboard.
Decision tables implemented in the Camunda Modeler environment can be used to create and edit BCI threshold specifications.
Experimental studies show that such technology is suitable for analyzing small KPI data sets.

5. Financial Data Set Anomaly Detection

The main financial anomaly detection steps are listed below:
  • Discovery of a normalized model (company-specific)
    To detect anomalous journal entries, we first must define “normality” in relation to accounting attribute types and indicator types.
  • Identification of deviations of attribute values
    Anomalies exhibit unusual or rare individual attribute values. Such anomalies usually relate to skewed attributes, e.g., rarely used ledgers, journals, or unique posting times. Traditionally, “red-flag” tests performed by auditors during an annual audit are designed to capture this type of anomaly.
  • Unusual or rare combinations of attribute values:
    Journal entries that exhibit an unusual or rare combination of attribute values while their attribute values occur fairly frequently: e.g., unique accounting records.
    Irregular combinations of general ledger accounts, and
    user accounts used by several accounting departments.
  • List of actual periods.
Note: Some steps are related to detecting anomalies in large-scale accounting data in [20]. According to the authors of that paper, “Our score accounts for both observed characteristics, namely: (1) any “unusual” attribute value occurrence (global anomaly) and (2) any “unusual” attribute value co-occurrence (local anomaly): [an unusual or rare combination of attribute values]”.
Figure 6 shows the financial data anomaly detection sub-system. The financial knowledge base includes elements of expert knowledge (business rules); these are KPI and BCI models with a range of normative values (thresholds). Figure 7 presents an example of a business rule specification for financial data analysis as a decision table (in DMN notation) using the Camunda user interface of the modeling tool.
The main stages of the anomaly detection process are as follows:
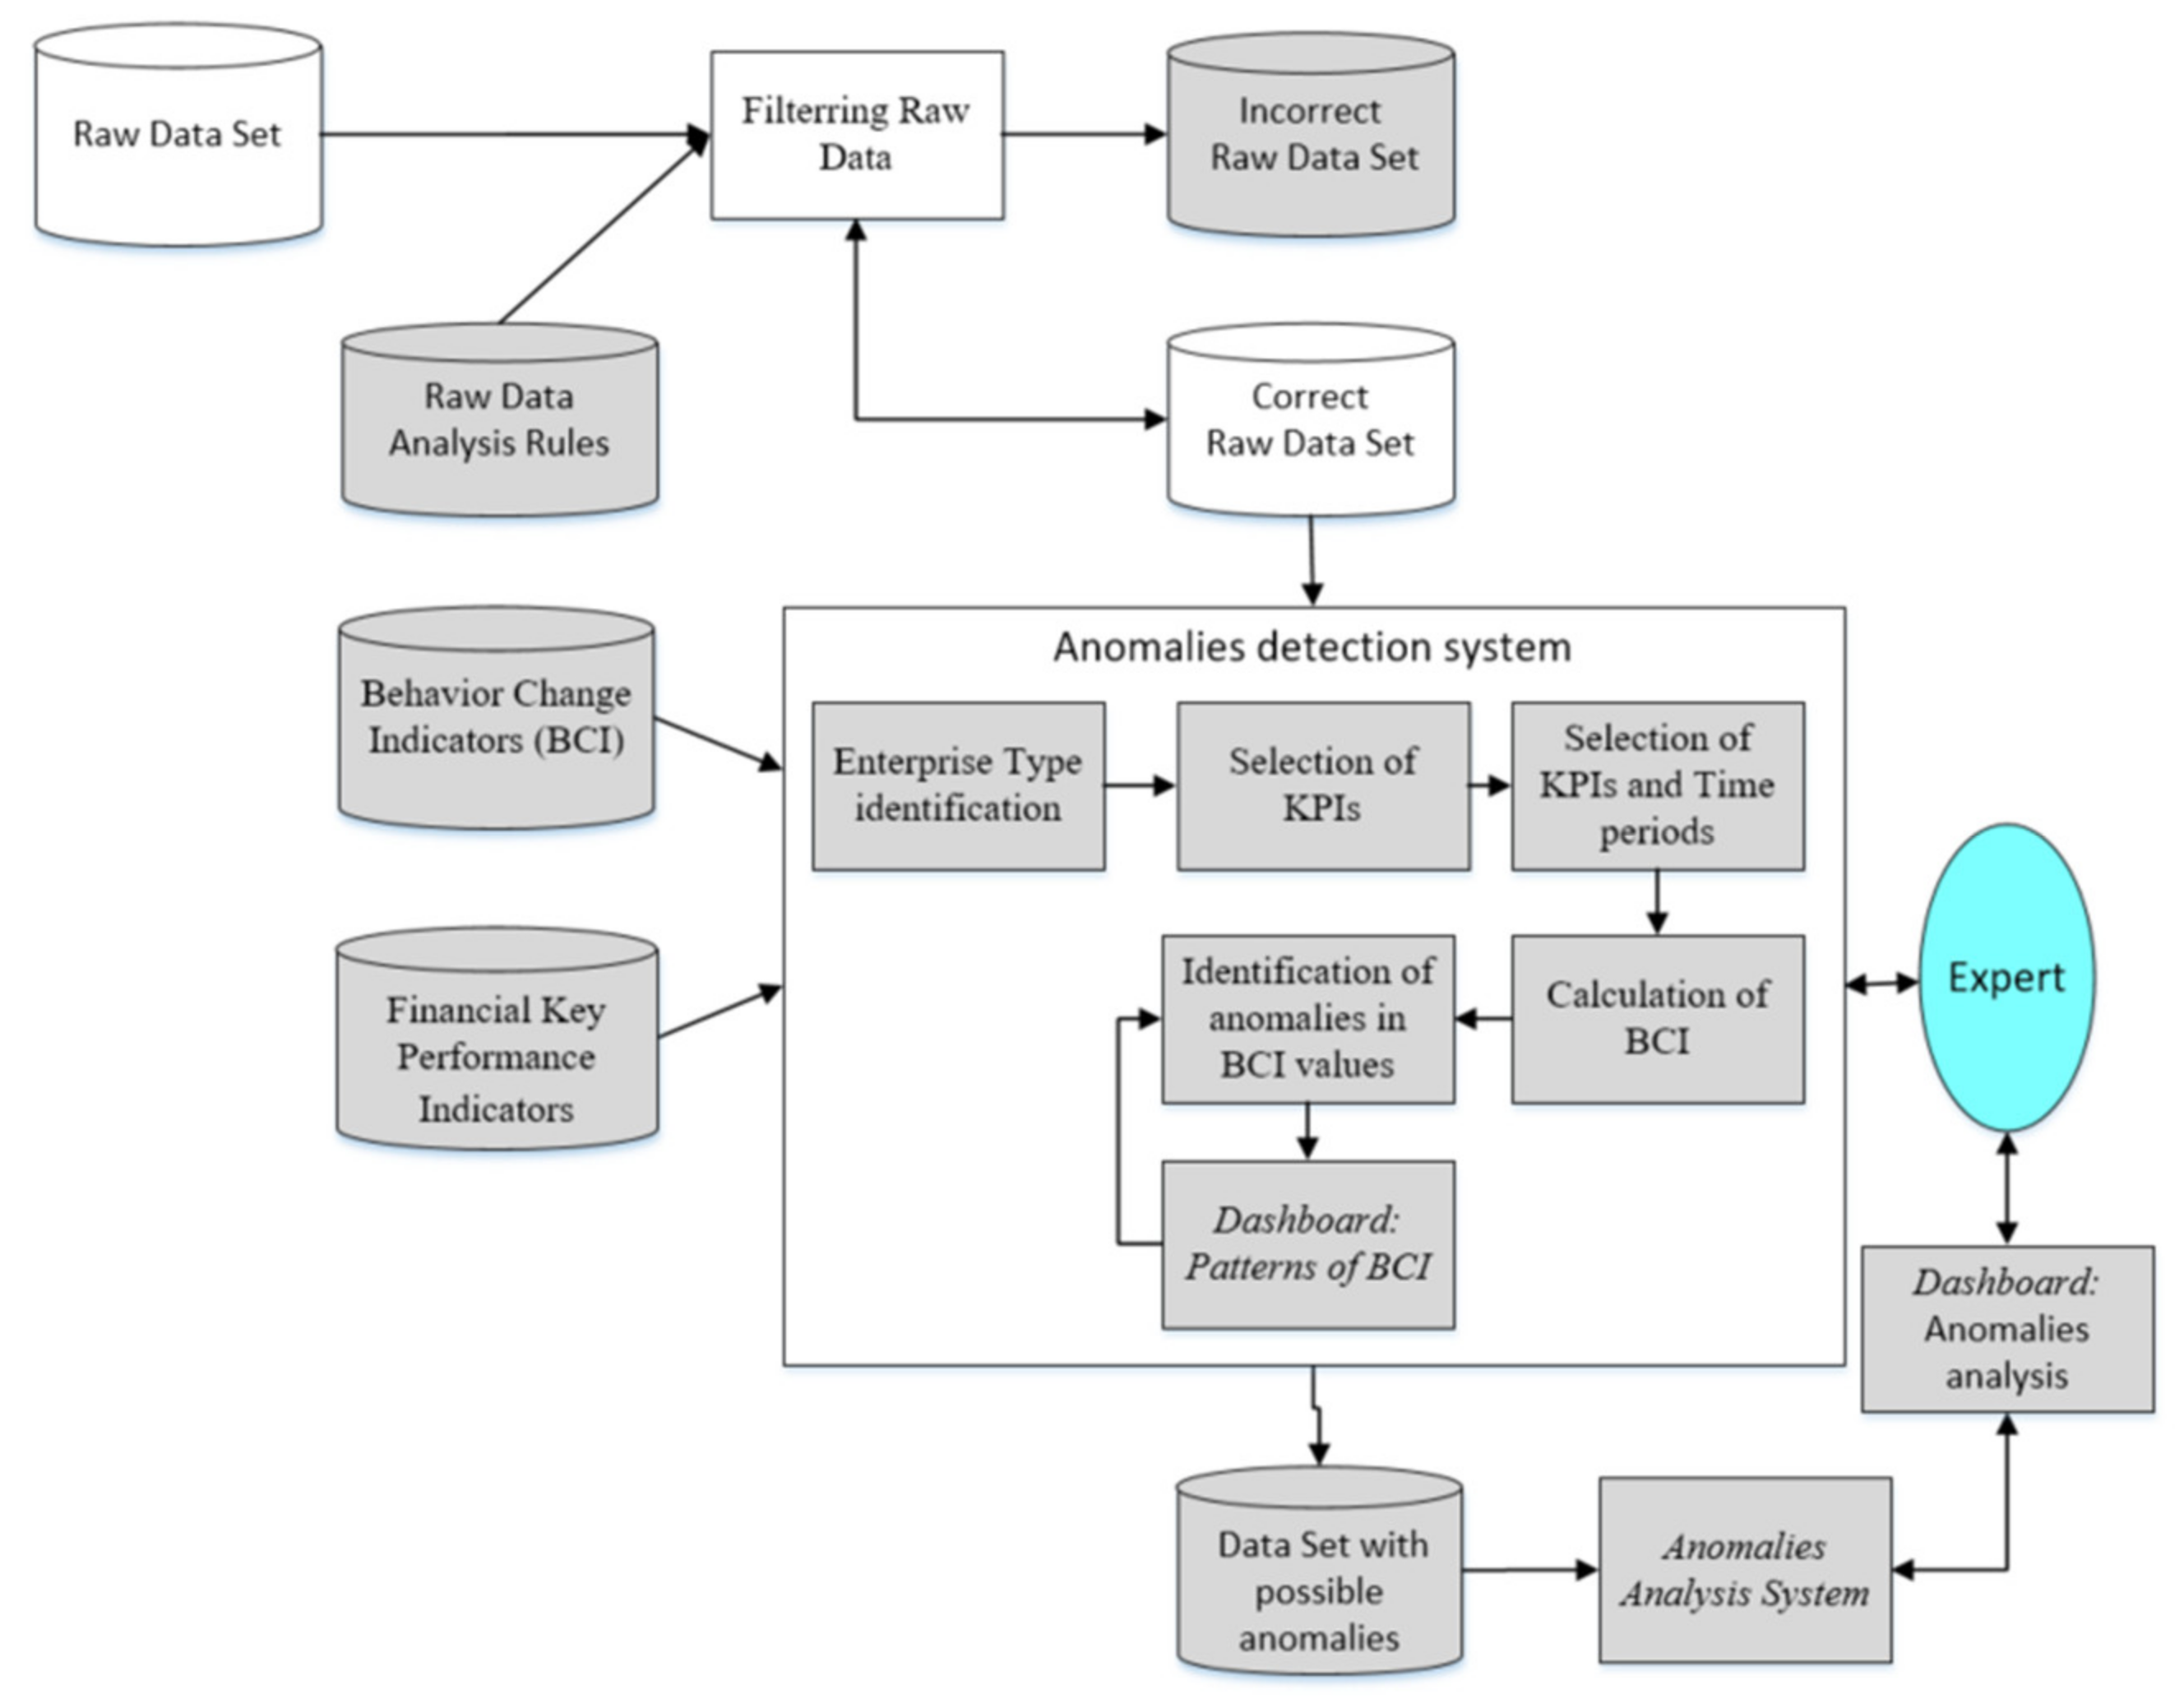
  • Financial data preprocessing is performed using the Camunda Modeler: filtering out the incorrect raw data set using predefined rules. At this stage, a subject-specific raw data analysis is performed in order to identify the correct data set (incorrect datasets are stored separately).
  • The basic steps involved in detecting data with possible anomalies are as follows:
    • The user interface allows the auditor to select KPIs and BCIs according to their needs and specific subjects to obtain results as expected and to specify the most important KPIs (there will be about 40 of them).
    • The expert chooses the type of company from the list and links it to the specific KPIs. KPI models (coefficients and thresholds) can be modified as needed.
    • The expert selects the company (e.g., ID-xxx), the required data set (e.g., DB_9999-99), and the required periods from the list. The system calculates the values of the selected KPIs and the relevant BCIs.
    • The Camunda Business Rules engine evaluates the BCI values according to the specified thresholds, compiles the estimates (e.g., green, yellow, red), and provides the results to the storage “data set with possible anomalies”.
    • BCI thresholds can be determined and adjusted according to the needs of the analyst using the Camunda Modeler interactive user interface.
  • The analyst performs an analysis of the data for possible anomalies through an interactive user interface (a Tableau dashboard).
Figure 7 shows an example of a decision table from the Camunda Modeler business rules repository interface that an internal auditor can create to specify KPIs and BCIs thresholds.
Examples of raw accounting data (attributes) used in the experiment include DBID, FinancialYear, FinancialPeriod, FinancialDate, Total_Equity, Total_Liabilities, Total_Assets, Fixed Assets, Current Assets, Non-current liabilities, Current liabilities, Revenue, Revenue_YTD, COGS, COGS_YTD, OPEX, OtherIncome, OtherIn-come_YTD, D&A, D&A_YTD, FinancialIncome, FinancialIncome_YTD, Taxes, Taxes_YTD, GrossProfit, GrossProfit_YTD, OperatingProfit, OperatingProfit_YTD, EBITDA, EBIT%, EBITDA_YTD, EBIT, EBIT_YTD, EBT, EBT_YTD, NetProfit, NetProfit_YTD, Gross Margin%, Gross Margin%_YTD, EBITDA%, EBITDA%_YTD, EBIT%_YTD, NetMargin%, NetMargin%_YTD, ROA_YTD, ROE_YTD, Cash_Position, Cash_Ratio, Working_Capital, Current_Ratio, Acid_Test, Debt/Equity Ratio, Debt/Assets Ratio, OPEX%, Intangi-ble_Fixed_Asset_Ratio, AR, AP, and Inventory.
Figure 8 presents the main steps in financial data analysis, the output of which is a data set with possible anomalies.
Now, using the anomaly analysis tool, the expert has an opportunity to use the dashboard with specific graphics and search for the final solution in real time.

6. Advantages of Using BCIs in Financial Data Analysis

The advantages of using BCI in analyzing financial data can be summarized as follows. BCIs enable the quantitative assessment of changes in KPI over time. Unexpected changes in the behavior of some KPIs are among the most critical factors that reveal changes in a company’s decisions or business processes associated with changes in management methods, human resources, or accounting policies.
The main unique benefits of using indicators of behavioral change are:
  • BCI-A shows the change in the value of a particular KPI over some time (t) compared to the value of that KPI in another period, such as the previous period (t − 1) or the average or normative value of a KPI.
  • BCI-RE shows a relative change in KPI in the financial period t—the ratio to the previous period t* or the average value over previous periods (t′, t″).
  • Delta BCI (D-BCI) shows the absolute or relative BCI change compared to a certain defined period.
Thus, BCI calculations highlight properties of KPI changes that are almost impossible for a person to see and understand by analyzing KPI values or their change alone. Visualized results of BCI calculations (charts), aligned with KPI values, were used to highlight some trends, allowing us to discover causal dependencies and to try to predict the values of KPIs.

7. Conclusions

In this article we have presented an approach to detecting anomalies in financial data, using indicators of behavioral change (BCIs) in addition to traditional KPIs.
From the point of view of data science, monitoring financial KPIs is essential for activity management and changes in KPIs over time. In our opinion, the assessment of performance management requires an understanding of the characteristics of changes in KPIs over time. Based on this assumption, three types of BCIs have been defined to detect and evaluate the changes in traditional KPIs in time series:—absolute change indicators (BCI-A), relative change indicators (ratio indicators BCI-RE), and delta change indicators (D-BCI).
The advantages of using BCIs in financial data analysis can be summarized as follows: BCIs provide a quantitative estimate of KPI changes in a definite period. BCIs highlight KPI changes that are almost impossible for a person to see and understand by analyzing KPI values or their change alone. If BCI exceeds a certain threshold, such a change in the value of a KPI is one of the most important signs of a change in a company’s decisions or business processes or human error.
It is almost impossible for an individual expert to detect and understand anomalies simply by analyzing the abundant financial KPI data. Using BCIs to track changes in KPIs helps users to see suspicious trends in some KPI changes (indicating potentially suspicious data) and reduces the amount of data that need to be analyzed.
Methods of detecting anomalies in time series solve a similar problem, and they can be used in addition to BCIs. The application of the BCIs proposed in this study can be described as an analysis of KPI time series. The advantage of using BCIs in financial data analysis is a user-friendly visualization of the KPI changes in a definite period, as the results of the analysis are presented (in the dashboard) to the financial expert in understandable terms.
A separate topic is the setting of financial BCI thresholds (normative values); this complex issue requires expert knowledge and experimental research. The proposed system prototype allows the expert to define the appropriate BCI limits using the dashboard experimentally. The system architecture of the financial data anomaly detection subsystem has been presented here. The expert knowledge (business rules), KPI, and BCI models with a range of normative values (thresholds) provide the content of the financial knowledge base. Business rules are implemented in the Camunda Modeler platform using decision tables. The system automatically assesses BCI values, indicating the changes in KPI time series, identifying questionable trends in KPI changes, and displaying this information on the dashboard.
By setting BCI thresholds in a system prototype environment, templates can be created to detect financial data anomalies, automatically forming sub-sets of suspicious data. The visualized results of BCI calculations (charts), aligned with KPI values, provided in this study highlighted some trends, and allowed us to discover causal dependencies and prediction KPI values.

Author Contributions

Conceptualization, A.L., R.B., V.R. and S.G.; methodology, A.L., S.G., D.D. and V.R.; software, L.Ž., I.V. and E.G.; validation, E.G., M.Z. and D.D.; formal analysis, S.G.; investigation, A.L., S.G. and V.R.; resources, R.B. and D.D.; data curation, E.G. and L.Ž.; writing—original draft preparation, S.G., A.L. and V.R.; writing—review and editing, I.V.; visualization, L.Ž. and I.V.; supervision, A.L. and S.G.; project administration, A.L. and R.B.; funding acquisition, R.B. All authors have read and agreed to the published version of the manuscript.

Funding

This paper presents the preliminary results of the research project “Enterprise Financial Performance Data Analysis Tools Platform (AIFA)”. European Regional Development Fund funds the research project according to the 2014–2020 Operational Programme for the European Union Funds’ Investments under measure No. 01.2.1-LVPA-T-848 “Smart FDI”. Project no.: 01.2.1-LVPA-T-848-02-0004; period of project implementation: 2020-06-01–2022-05-31.

Informed Consent Statement

Informed consent was obtained from all subjects involved in the study.

Conflicts of Interest

The authors declare no conflict of interest.

References

  1. Bhatti, M.I.; Awan, H.M.; Razaq, Z. The key performance indicators (KPIs) and their impact on overall organizational performance. Qual. Quant. 2013, 48, 3127–3143. [Google Scholar] [CrossRef]
  2. What Is a Key Performance Indicator (KPI)? Guide & Examples. Available online: https://www.qlik.com/us/kpi (accessed on 15 October 2021).
  3. Bititci, U.S.; Turner, U.; Begemann, C. Dynamics of performance measurement systems. Int. J. Oper. Prod. Manag. 2000, 20, 692–704. [Google Scholar] [CrossRef]
  4. Gosselin, M. An empirical study of performance measurement in manufacturing firms. Int. J. Prod. Perform. Manag. 2005, 54, 419–437. [Google Scholar] [CrossRef]
  5. Durrah, O.; Rahman, A.A.A.; Jamil, S.A.; Ghafeer, N.A. Exploring the relationship between liquidity ratios and indicators of financial performance: An analytical study on industrial food companies listed in Amman Bursa. Int. J. Econ. Financ. Issues 2016, 6, 435–441. [Google Scholar]
  6. Neely, A.; Gregory, M.; Platts, K. Performance measurement system design: A literature review and research agenda. Int. J. Oper. Prod. Manag. 2005, 25, 1228–1263. [Google Scholar] [CrossRef]
  7. Parmenter, D. Key Performance Indicators: Developing, Implementing, and Using Winning KPIs; Wiley: Hoboken, NJ, USA, 2009; Available online: https://onlinelibrary.wiley.com/doi/pdf/10.1002/9781119019855.fmatter (accessed on 14 September 2021).
  8. Striteska, M.; Marketa, S. Review and comparison of performance measurement systems. J. Organ. Manag. Stud. 2012, 2012, 1. [Google Scholar] [CrossRef] [Green Version]
  9. Heckl, D.; Moormann, J. Process Performance Management. In Handbook on Business Process Management; Springer: Berlin/Heidelberg, Germany, 2010; Volume 2, pp. 115–135. [Google Scholar] [CrossRef]
  10. Badri, M.A.; Davis, D.; Davis, D. A study of measuring the critical factors of quality management. Int. J. Qual. Reliab. Manag. 1994, 12, 36–53. Available online: https://www.researchgate.net/publication/238495215_A_study_of_measuring_the_critical_factors_of_quality_management (accessed on 12 August 2021). [CrossRef]
  11. Tangen, S. An overview of frequently used performance measures. Work Study 2003, 52, 347–354. [Google Scholar] [CrossRef] [Green Version]
  12. Leong, G.K.; Snyder, D.L.; Ward, P.T. Research in the process and content of manufacturing strategy. Omega 1990, 18, 109–122. [Google Scholar] [CrossRef]
  13. Qamar, A.; Hall, M.A.; Chicksand, D.; Collinson, S. Quality and flexibility performance trade-offs between lean and agile manufacturing firms in the automotive industry. Prod. Plan. Control 2020, 31, 723–738. [Google Scholar] [CrossRef]
  14. Flin, R.; Mearns, K.; Oconnor, P.; Bryden, R. Measuring safety climate: Identifying the common features. Saf. Sci. 2000, 34, 177–192. [Google Scholar] [CrossRef]
  15. Mearns, K.; Whitaker, S.M.; Flin, R. Safety climate, safety management practice and safety performance in offshore environments. Saf. Sci. 2003, 41, 641–680. [Google Scholar] [CrossRef]
  16. Sadler-Smith, E.; Spicer, D.P.; Chaston, I. Learning orientations and growth in smaller organizations. Long Range Plan. 2001, 34, 139–158. [Google Scholar] [CrossRef]
  17. Kihn, L.-A.; Comparing, P.M. Approaches in Accounting Research. Finn. J. Bus. Econ. 2005, 2, 143–184. [Google Scholar]
  18. Cai, J.; Liu, X.; Xiao, Z.; Liu, J. Improving supply chain performance management: A systematic approach to analyzing iterative KPI accomplishment. Decis. Support Syst. 2009, 46, 512–521. [Google Scholar] [CrossRef]
  19. Tomas, K.; Anna, S.; Maria, M. Financial Health Prediction of Company’s Business Partners Based on Selected Quantitative and Qualitative Indicators. J. Econ. Bus. Manag. 2017, 5, 3. [Google Scholar] [CrossRef]
  20. Schreyer, M.; Timur, S.; Damian, B.; Andreas, R. Dengel and Bernd Reimer. Detection of Anomalies in Large Scale Accounting Data using Deep Autoencoder Networks. arXiv 2017, arXiv:abs/1709.05254. [Google Scholar]
  21. Punjanit, L.; Dennis, B.; Colleen, M. Good Practice Study on Principles for Indicator Development, Selection, and Use in Climate Change Adaptation Monitoring and Evaluation. June 2015. Available online: https://www.researchgate.net/publication/297234569_Good_Practice_Study_on_Principles_for_Indicator_Development_Selection_and_Use_in_Climate_Change_Adaptation_Monitoring_and_Evaluation (accessed on 25 September 2021).
  22. McKee, N.; Manoncourt, E.; Yoon, C.S.; Carnegie, R. Behaviour and Beyond: An Evaluation Perspective. In Approaches to Development Communication; Servaes, J., Ed.; UNESCO: Paris, Frence, 2002. [Google Scholar]
  23. Mulholland, B. Ratio Analysis of Financial KPI in the Higher Education Sector: A Case Study; Paperback: 14 pages; Independently Published: Traverse City, MI, USA, 2021; ISBN 9798774872572. (In English) [Google Scholar]
  24. Villanueva, P.S. Learning to ADAPT: Monitoring and Evaluation Approaches in Climate Change Adaptation and Disaster Risk Reduction—Challenges, Gaps and Ways Forward; SCR Discussion Paper 9; Institute of Development Studies: Brighton, UK, 2011. [Google Scholar]
  25. World Bank, Operation Policy Department. Performance Monitoring Indicators: A Handbook for Task Managers. Available online: https://www.measureevaluation.org/resources/training/capacity-building-resources/basic-me-concepts-portuguese/indicators.pdf (accessed on 16 May 2020).
  26. Francesco, L.A. Guide to Building a Financial Transaction Anomaly Detector. 9 July 2021. Available online: https://unit8.com/resources/a-guide-to-building-a-financial-transaction-anomaly-detector/ (accessed on 25 September 2021).
  27. Monroe, M.C.; Agrawal, S.; Jakes, P.J.; Kruger, L.E.; Nelson, K.C.; Sturtevant, V. Identifying Indicators of Behavior Change: Insights from Wildfire Education Programs. J. Environ. Educ. 2013, 44, 180–194. [Google Scholar] [CrossRef]
  28. Ann Elizabeth Flanagan and Jeffery Clark Tanner A Framework for Evaluating Behavior Change in International Development Operations IEG Working Paper 2016/No. 2. Available online: https://ieg.worldbankgroup.org/sites/default/files/Data/reports/behavior-change-wp.pdf (accessed on 12 November 2021).
  29. Climate Change Indicators Dashboard. IMF Climate Change Dashboard. Financial and Risk Indicators. Available online: https://climatedata.imf.org/pages/fi-indicators (accessed on 12 December 2021).
  30. Lopata, A.; Butleris, R.; Gudas, S.; Rudžionis, V.; Rudžionienė, K.; Žioba, L.; Veitaitė, I.; Dilijonas, D.; Grišius, E.; Zwitserloot, M. Financial Data Preprocessing Issues. In Proceedings of the 27th International Conference, Information and Software Technologies ICIST 2021, Kaunas, Lithuania, 14–16 October 2021; pp. 60–71. Available online: https://link.springer.com/chapter/10.1007/978-3-030-88304-1_5 (accessed on 21 September 2021).
  31. Auffarth, B. Machine Learning for Time-Series with Python: Forecast, Predict, and Detect Anomalies with State-of-the-Art Machine Learning Methods; Paperback: 370 pages; Packt Publishing: Birmingham, UK, 2021; ISBN 9781801819626. (In English) [Google Scholar]
Figure 1. Abstract KPI time series.
Electronics 11 01598 g001
Figure 2. Abstract D-BCI time series.
Electronics 11 01598 g002
Figure 3. The time series of Cr values and Cr changes BCI−A1 and BCI−RO.
Electronics 11 01598 g003
Figure 4. Time series of the relative change (BCI−RE1) of the indicator BCI−A1.
Electronics 11 01598 g004
Figure 5. Delta indicator D−BCI−A1 time series 2012.
Electronics 11 01598 g005
Figure 6. The architecture of the sub-system used for anomaly detection.
Electronics 11 01598 g006
Figure 7. An example of a business rule for financial data analysis using the graphical user interface of Camunda Modeler.
Electronics 11 01598 g007
Figure 8. The main steps in the financial data analysis process.
Electronics 11 01598 g008
Table 1. Financial data behavioral change indicators (BCI).
Behavioral Change Indicators (BCI)NotationDescription
1. BCI-A: Absolute change in KPI over a given financial period BCI-A is the difference in KPI value over some financial accounting period, i.e., financial year, month, etc.
1.1 BCI-A1: Absolute change in KPI in the financial period t∆X (t, t′)BCI-A1 is the difference between the value of KPI in period t and given previous period t′.
1.2. BCI-A2: Absolute change in KPI in the financial period t compared to the moving average of the KPIs over the financial periods (t′, t″) ∆XA (t, (t′, t″))BCI-A2 is the difference between the KPI value in period t and the moving average of the KPI over the periods (t′, t″)
2. BCI-RO: Robustness coefficient, an indicator of stability∆XRO (t, XN)BCI-RO is the difference between the KPI value in period t and the normative (reference) value XN.
3. Relative behavioral change indicator BCI-RE
3.1. BCI-RE1: Relative change in KPI in the financial period t (the ratio to the previous period t*)∆XRE (t, t*)BCI-RE1 is the ratio of the change in the KPI to the previous period’s KPI value (in percentage terms)
3.2. BCI-RE2: Relative change in KPI in financial period t (the ratio to the average value over previous periods (t′, t″)∆XREA (t, (t′, t″))BCI-RE2 is the ratio of the change in the KPI to the previous periods (t′, t″) KPIs average value (in percentage terms)
4. Delta BCI (D-BCI) shows the absolute or relative BCI change over a defined period. Definition: Delta BCI means the change in BCI compared to a certain defined period.
4.1. D-BCI-A shows an absolute change in BCI XA (t, t*) in financial period t compared to the change in BCI-A in the previous period t*D(∆XA (t, t*))A set of D-BCI-A shows a trend of change in BCI-A over some time (over a set of periods)
4.2. D-BCI-RE is the ratio of the change in BCI-RE in period t compared to the change in BCI-RE in previous period t* A set of D-BCI-RE shows a trend of change in BCI-RE over a given period (in percentage terms)
4.3. D-BCI-RO shows the change in the robustness coefficient BCI-RO in some periods (t, t*) (trend of BCI-RO change) A set of D-BCI-RO shows a trend of change in BCI-RO over some time (over a set of periods)
Table 2. Data set.
Table 2. Data set.
Financial YearFinancial PeriodCrBCI-RE1BCI-A1BCI-ROD-BCI-A1
201216.060.000.474.860.00
201226.6610.020.615.460.14
201236.45−3.23−0.225.25−0.82
201247.2111.870.776.010.98
201256.28−12.98−0.945.08−1.70
201267.6922.481.416.492.35
2012711.2746.673.5910.072.18
2012813.0115.381.7311.81−1.85
201299.94−23.55−3.068.74−4.80
2012109.67−2.76−0.278.472.79
20121113.0635.093.3911.863.67
20121214.329.641.2613.12−2.13
Table 3. Financial KPIs thresholds.
Financial KPIFormulaNormative Threshold
Current ratio (Cr)Cr = current assets/current liabilitiesCr > 1.0 (1.2)
Acid test (Quick) ratio (Ar)Ar = current assets (inventory)/current liabilitiesAr > 1.0
(Cash ratio) (CA)CA = cash/current liabilities0.1 < CA < 0.2
Working capital to total assets (NWC)NWC= working capital/total assets1.5 < NWC < 2
Debt ratio (Dr)Dr = debt/total assets0.5 < Dr < 0.7
Debt to equity ratio (De)De = debt/equityDe < 2.0
Bankruptcy indicator Altman Z SCORE (Z) Z = 0.717(X1) + 0.847(X2) + 3.107(X3) + 0.420(X4) + 0.998(X5) (1) where
X1 = working capital/total assets,
X2 = retained earnings/total assets,
X3 = earnings before interest and taxes/total assets,
X4 = book value of equity/book value of total liabilities,
X5 = net sales/total assets
Z:
(0–1.8)—distress zone;
(1.8–3.0)—gray zone;
(3.0–4.0)—safe zone.
Publisher’s Note: MDPI stays neutral with regard to jurisdictional claims in published maps and institutional affiliations.

