Abstract
Due to refraction, absorption, and scattering of light by suspended particles in water, underwater images are characterized by low contrast, blurred details, and color distortion. In this paper, a fusion algorithm to restore and enhance underwater images is proposed. It consists of a color restoration module, an end-to-end defogging module and a brightness equalization module. In the color restoration module, a color balance algorithm based on CIE Lab color model is proposed to alleviate the effect of color deviation in underwater images. In the end-to-end defogging module, one end is the input image and the other end is the output image. A CNN network is proposed to connect these two ends and to improve the contrast of the underwater images. In the CNN network, a sub-network is used to reduce the depth of the network that needs to be designed to obtain the same features. Several depth separable convolutions are used to reduce the amount of calculation parameters required during network training. The basic attention module is introduced to highlight some important areas in the image. In order to improve the defogging network’s ability to extract overall information, a cross-layer connection and pooling pyramid module are added. In the brightness equalization module, a contrast limited adaptive histogram equalization method is used to coordinate the overall brightness. The proposed fusion algorithm for underwater image restoration and enhancement is verified by experiments and comparison with previous deep learning models and traditional methods. Comparison results show that the color correction and detail enhancement by the proposed method are superior.
1. Introduction
The ocean contains various abundant resources. However, it has not been effectively explored and exploited by humans, especially for the underwater world. Underwater image processing plays an indispensable role in the underwater operations by human or underwater robots, e.g., underwater archeology, environment monitoring, device maintenance, object recognition, and search and salvage. Affected by the suspending particles and the attenuation of light in water, the underwater optical images are of low quality, with flaws such as color distortion, low contrast, and even blurred details. Therefore, the degraded underwater images require enhancement and restoration to obtain more underwater information. In enhancing underwater images, classic techniques include histogram equalization, wavelet transform and Retinex algorithm [1,2,3,4]. However, there are some shortcomings for each of these algorithms. For example, loss of details of image and excessive enhancement might happen to histogram equalization. The effectiveness of wavelet transform is limited in processing the images obtained in shallow waters. For Retinex algorithm, the halo effect needs to be solved in the case of large brightness difference. To avoid those shortcomings, two or three out of these enhancement techniques are combined for examples in [5,6,7]. Results show that a fusion algorithm can provide a more comprehensive image enhancement effect.
To restore underwater images, an imaging model is required. A representative model is proposed by Chiang and Chen [8]. The key to using this model is to estimate the transmission map and the global ambient light. In past years, many researchers have engaged in the research on the estimation of these parameters. Generally, the studies can be viewed as two types: priori driven methods and data driven methods.
Prior driven approaches extract the transmission map and the atmospheric light environment through various priors or assumptions, so as to achieve image restoration. A typical method is the Dark Channel Prior (DCP) method [9]. However, the rules of DCP tends to be violated since the red light is absorbed extremely quickly in underwater environment, resulting an imbalance between the three channels. To modify the DCP method, Drews et al. [10] proposed an Underwater Dark Channel Prior (UDCP), which only uses the blue and green channels to calculate the dark channel. Galdran et al. [11] came up with the Red Channel Prior (RCP), which obtains a reliable transmission diagram based on the relationship between the attenuation of the red channel and the DCP. However, due to the decrease of reliability, such modifications only achieve minor improvement in the accuracy of the estimation of transmission map. Based on the fact that the red channel attenuates much faster than green and blue channels, Carlevaris-Bianco et al. [12] proposed a new prior which estimates the depth of the scene with the aid of attenuation difference. Wang et al. [13] developed a new method, called maximum attenuation identification (MAI), to derive the depth map from degraded underwater images. Li et al. [14] estimated the medium transmission by reducing the information loss in a local block for red channel. However, the reliance on color information in these priors results in the underestimation of the transmission of objects with green or blue color. Berman et al. [15] suggested estimating transmission based on the haze line assumption and estimating attenuation coefficient ratios based on the gray-world assumption. However, this method may fail when the ambient light is significantly brighter than the scene because most pixels will point at the same direction, and it is difficult to detect the haze lines.
Theoretically, when the depth of the scene increases, the transmission will decrease, and the ambient light will have a greater impact on the image quality. Thus, the estimation of ambient light often selects the pixel area with the largest depth in the image as the reference pixels. Usually, the method based on color information and the method based on edge information are used to select these reference pixels more accurately. Chiang et al. [8] inferred the ambient light from the pixel with the highest brightness value in an image. Selecting pixels in the red channel as a reference is an alternative method because the intensity in the red channel is much lower than the intensities of blue and green [11]. However, since the reference pixels are selected based on color information, objects with the same color may interfere with the selection. Berman et al. [15] proposed an estimation of ambient light according to the edge map associated with smooth non-texture areas. However, this method is not suitable if the image contains a large object with smooth surface. Moreover, sometimes there is no ideal reference pixel in an image. For example, an image photographed from a downward angle may not contain pixels with deep depth. Overall, the prior-based methods tend to make large estimation errors when the adopted priors are not valid. Lack of reliable priors for generic underwater images has become a major hurdle that impedes the prior-based approaches to achieve further progress.
In recent years, a data driven method, deep learning, has become more and more popular in image processing. Deep learning-based methods rely on learning the relationship between images, which makes it possible to avoid estimation errors due to invalid priors in the method. In deep learning methods, Convolutional Neural Network (CNN) is a representative approach and has been widely applied to the underwater image processing. Initial applications are mainly focused on the estimation of the transmission in images, for example in [16,17,18,19]. These CNN based models are trained with synthetic data set to regress transmission and obtain more refined restored images than conventional methods. Further applications concern both the transmission and the ambient light, for example in [20,21,22]. However, due to the assumption that three channels have the same transmission, these methods only partly solve the effect of scattering. Although the image contrast is improved, color deviation cannot be well corrected. Wang et al. [23] firstly used T-network and A-network to estimate the blue channel, and then estimated the red and green channels through the relationship between the channels to restore underwater images. In order to learn the differences between different channels of underwater images, Li et al. [24], Sun et al. [25], and Uplavikar et al. [26] directly use a data-driven end-to-end network to learn the mapping relationship between underwater degraded images and clear images. It is known that the performance of data driven based methods largely depends on the quality of training data. The underwater images used for training are usually obtained by synthesis without color deviation (e.g., [16,17,18]) or with color deviation (e.g., [20]). However, due to the complex underwater environment, the color deviation of underwater images only contains various tones of blue or green. To improve the quality of the synthetic data set, Li et al. [27] used Generative Adversarial Networks (GAN) to produce underwater degraded images. However, the restored underwater images are still not realistic enough compared with real underwater images.
As discussed above, each enhancement or restoration method has inherent disadvantage in processing underwater images. One way to gain a high-quality underwater image is a fusion algorithm in which each module can perform well while its disadvantage can be compensated by other module. In this paper, a fusion algorithm is proposed. It includes a color balance algorithm based on the CIE Lab color model, an end-to-end CNN defogging algorithm based on foggy training set and a brightness equalization module. In this way, the mapping relationship between the underwater blurred image and the clear image can be obtained without synthesizing the data set of the underwater image. The inaccurate mapping due to the insufficient reality of the synthesized images can be also avoided. The color balance algorithm uses the channel value redistribution in the color channel to achieve color balance. The defogging algorithm uses deep separable convolution instead of standard convolution to reduce the amount of parameters in the calculation process. Moreover, sub-network is incorporated into the defogging module to reduce the depth of the main network. In the CNN structure, the Basic Attention module is used, which mainly includes Channel Attention block (CA) and Pixel Attention block (PA). CA is used to trace the difference in the distribution of fog between channels while PA is used to record the difference in haze weight between pixels. By aggregating different contextual information of images, a pooling pyramid module is added to improve the capability of the network model that contains global information. Moreover, cross-layer connections are used to preserve edge information. The brightness equalization module uses the Contrast Limited Adaptive Histogram Equalization method in the L channel (Luminance channel in CIE Lab color model) to coordinate the overall brightness.
The main contributions of the study include the construction of CNN to defog the underwater images, and the combination of three techniques to achieve more comprehensive quality of underwater images as well. To verify the fusion algorithm proposed, some degraded underwater images are processed and the results are compared between the proposed method and other algorithms including classic and advanced ones such as CNN-based algorithm. The underwater images used in CNN are derived from UIEB Dataset [28].
The rest of the paper is organized as: Section 2 gives the description of underwater imaging model and the color model used in the study; Section 3 illustrates the methods employed in the proposed fusion algorithm and the training dataset; Section 4 presents the image processing results and corresponding explanation; and the conclusion is given in the final section.
2. Models in Underwater Imaging Process
2.1. Underwater Optical Imaging Model
Figure 1 shows an underwater imaging model. In an underwater environment, the light captured by the camera is mainly composed of scene radiation and ambient light reflection. This model can be expressed as:
where x represents a pixel in the original underwater image and c represents three color channels; is the image captured by the camera; represents a clear image or the so-called restoration image; represents the global ambient light and represents the transmission map.
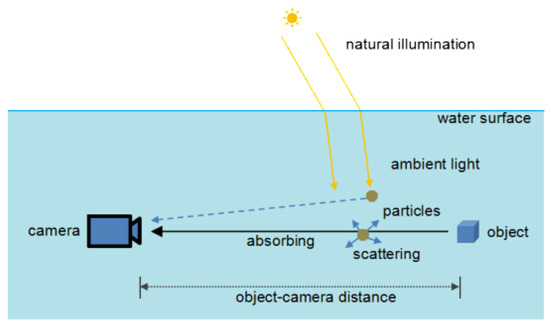
Figure 1.
Underwater imaging model.
According to (1), the restoration image can be expressed as:
It can be seen from the underwater imaging model that the key to restoring an underwater image is to estimate the transmittance of the image map and the corresponding ambient light value. To apply NN to the estimation of transmittance and ambient light, Li et al. [29] introduced a variable by deforming the atmospheric scattering model. This method can also be applied to underwater imaging models. Model (2) can be modified as:
where
and b is the constant deviation value (usually set to 1).
As can be seen from definition of Kc(x), the transmittance and ambient light value are jointly estimated, which can avoid the cumulative error caused by the training for transmittance and the training for ambient light.
2.2. CIE Lab Color Model
The CIE Lab color model is a device-independent color system [30]. It uses a digital method to describe human visual perception and makes up for the deficiencies of the RGB and CMYK color modes. The Lab color model is composed of three elements: L, a and b. L is the luminance channel, with a range of [0, 100], which means a variation from pure black to pure white. The a channel covers colors from dark green to gray, to bright pink, with the value range of [−128, 127]. The b channel includes colors from bright blue to gray, to yellow, with the value range of [−128, 127].
3. Underwater Image Enhancement Methods
Based on the models in Section 2, in this section some measures to enhance the underwater images are proposed. In order to improve the quality of underwater images, a fusion algorithm is constructed which involves a color balance algorithm, a CNN-based defogging algorithm and contrast limited adaptive histogram equalization (CLAHE). The color balance algorithm is used to eliminate the color deviation caused by the attenuation of light in the water while the CNN defogging algorithm and CLAHE are used to improve the contrast of the image. The process of the fusion algorithm is shown as Figure 2.

Figure 2.
The process of the fusion algorithm.
3.1. Color Balance Algorithm
As can be recognized from the proposed scheme in Figure 2, the first step is to achieve the color balance. It is known that in underwater environments, the light attenuation varies with its wavelength. As the depth increases, an underwater image changes from greenish to bluish. Figure 3 presents four underwater images and their gray histograms in the CIE Lab color model. It can be seen from the second and third images that when the image is greenish, a large number of values in the a channel are on the left side of the histogram. The fourth image shows that when the image is bluish, a large number of values in the b channel are on the left side of the histogram. As can be recognized from the first image that when image color shift is weak, the channel values of the a and b channels are concentrated in the middle of the histogram.
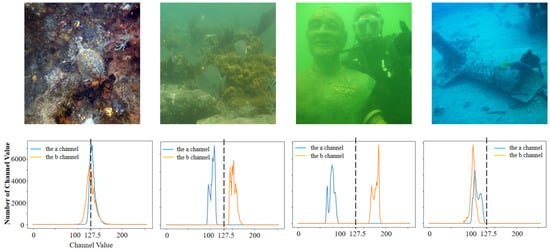
Figure 3.
Underwater images and their gray histograms of color channels. The blue polyline represents the a channel, and the orange polyline represents the b channel.
In order to reduce the influence of color shift, a color balance method based on CIE Lab color model is proposed. By moving the channel value to the middle position of the channel histogram, color balance is achieved. At the first step, the RGB image is converted into the Lab image. The second step is to obtain the channel values Ma and Mb of the median of channels a and b, respectively. Then, one can obtain the correction value offset1 of the a channel and the correction value offset2 of the b channel by Equations (5) and (6), respectively. At the third step, the a channel and the b channel are updated by adding their respective correction values. For more intuitive results, the range of channel values is converted from [−128, 127] to [0, 255] by satisfying the boundary conditions that if the calculated new channel value is greater than 255, it is set to 255; if it is less than 0, let it be 0. Finally, by converting the processed Lab image to an RGB image, a color-balanced image is obtained.
To verify the effectiveness of the proposed color balance algorithm, it is compared with three conventional color balance algorithms including gray world [31], color shift check correction [32], and automatic white balance [33]. Figure 4 presents the visual comparison of the color balance results of six underwater images. It can be seen that in the case of weak color degradation (images No.1, No.2 and No.3), all methods have good processed results. In the case of serious color degradation (images No.4, No.5 and No.6), the proposed method gains a better color balance effect than the other three methods. For the sixth bluish image, even over-exposure happens to the other three methods.
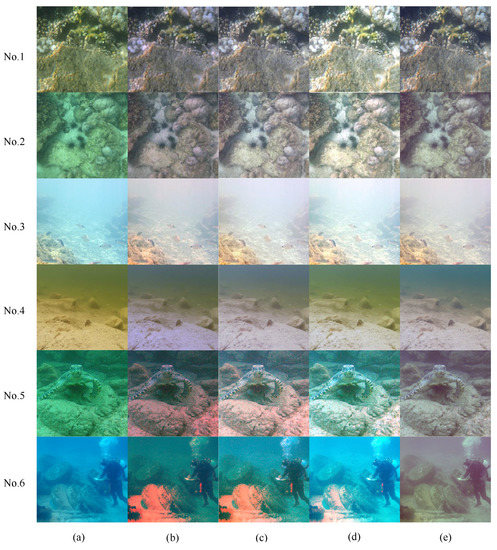
Figure 4.
Visual comparison of color balance results of underwater images. (a) Real underwater images; (b) processed by gray world algorithm [31]; (c) processed by color shift check correction [32]; (d) processed by automatic white balance [33]; and (e) processed by proposed method.
3.2. CNN based Defogging Algorithm
It can be seen from Figure 4 that although the color deviation is alleviated by the proposed color balance method, it seems that the processed image is covered with a thick layer of fog. In order to improve the contrast of the image, an end-to-end neural network defogging algorithm based on the underwater optical imaging model is proposed, shown as the second step in Figure 2.
3.2.1. Network Architecture
In the study, a modified underwater imaging model as (3) is employed to restore underwater images. In this model, a comprehensive index K(x) is introduced. The motivation is that calculating the ambient light and the transmission map separately will result in the accumulated errors derived from each individual estimation step. Instead, direct estimation of K(x) will reduce such errors. For this purpose, an end-to-end CNN based defogging network is established, as shown in Figure 5. The index K(x) is estimated by a UD-net. Afterwards, the restoration image can be obtained by using (3). To increase the speed of the network, depthwise separable convolution is employed instead of standard convolution. Depthwise separable convolution is a form of decomposed convolution [34]. It separates standard convolution integrals into depthwise convolution and pointwise convolution. In this way, the calculation burden and model size can be significantly reduced. Moreover, it can be seen that in the network construction for estimation of K(x), a sub-network is formed to shorten the depth of the main network [17]. As can be recognized from Figure 4, in the process of sub-network, three different depthwise separable convolutions (11*11, 9*9, 7*7) combined with BMU module are firstly designed to obtain a larger receptive field and learn better global information. Then, the sub-network performs 3*3 depthwise separable convolution and uses a sigmoid activation function to linearize the upsampling result. Finally, a 3-channel feature map will be obtained and output to the main network.
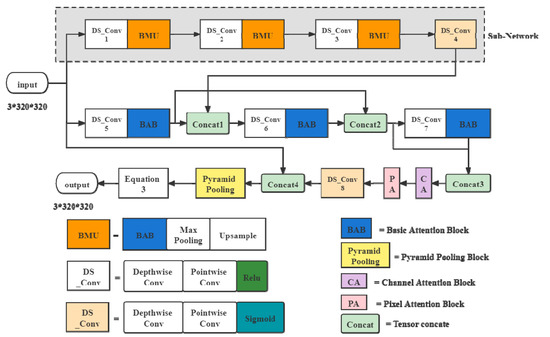
Figure 5.
The end-to-end defogging network structure.
As can be seen from the construction of the sub-network, it involves five operations: depthwise separable convolution, basic attention module, max-pooling, upsampling and linear combination. It is noted that most conventional image defogging networks such as multi-scale CNN (MSCNN) [17] and all-in-one network [29] equally treat the distribution of fog on different channels and pixels. As a result, the fog density cannot be well estimated especially in complex scenes. In the study, a feature attention block [35] is introduced to solve such a problem. As shown in Figure 6, the feature attention (FA) block consists of Channel Attention (CA) and Pixel Attention (PA), which can provide additional flexibility in dealing with different types of information. In the CA part, firstly the channel-wise global spatial information is transformed into a channel descriptor by using global average pooling. The shape of the feature map changes from C*H*W to C*1*1. Then, to get the weights of different channels, features pass through two convolution layers with ReLu and sigmoid activation functions. Finally, to obtain the output, element-wise product is performed by using the input and the obtained weights of the channel. In the PA part, it directly feeds the input (i.e., the output of the CA part) into two convolution layers with ReLu and sigmoid activation functions. The shape of the feature map changes from C*H*W to 1*H*W. Finally, element-wise multiplication is performed by using the input and the weights of the pixel. It is noted that besides feature attention module, a basic attention block (BAB) structure adopts the way of local residual learning. Local residual learning allows the less important information such as thin haze or low-frequency region to be bypassed through multiple local residual connection so that the main network can focus on effective information. Different from the Convolutional Block Attention Module (CBAM) proposed in [36], the BAB module in the study uses only average pooling instead of the combination of average pooling and max pooling in CBAM, in the meanwhile residual learning is added to the BAB module.
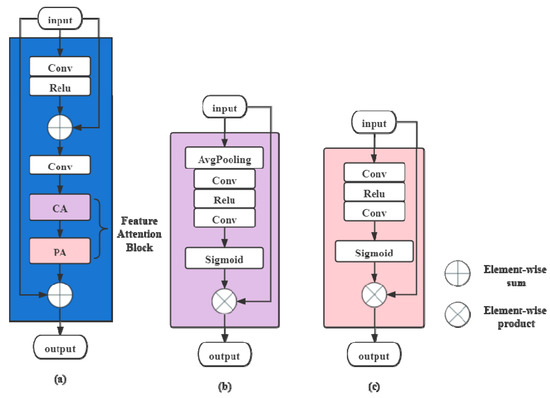
Figure 6.
(a) Basic Attention Block (BAB); (b) Channel Attention (CA); and (c) Pixel Attention (PA).
One of the shortcomings of conventional underwater image enhancement methods is the loss of details, for example the classic histogram equalization. In order to make the processed results contain more details, a pyramid pooling block is incorporated into defogging network shown as Figure 5. The pyramid pooling block that locates before the last convolution layer is an enhancing module (EM) to expand the representational ability of network [37]. The use of pyramid pooling can learn more context information based on different receptive fields. As a result, the image processing results can be refined. Figure 7 presents the structure of pyramid pooling block. It is designed to integrate the details of features from multi-scale layers and to obtain global context information by learning on different receptive field. As can be seen, a four-scale pyramid is built by downsampling the outputs of the conventional layers with factors 4*, 8*, 16*, and 32*. Each scale layer contains a 1*1 convolution. After upsampling, feature maps before and after the pyramid pooling are concatenated. Subsequently, a 3*3 convolution is added to align feature maps.
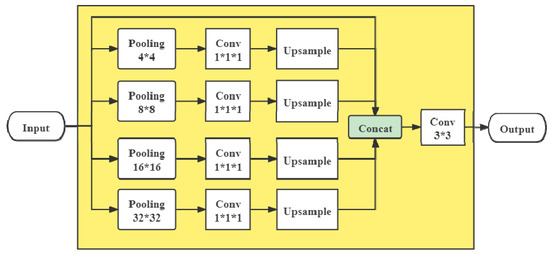
Figure 7.
Pyramid pooling block.
3.2.2. Implementation Details
In this section, we specify the implementation details of our proposed UD-Net. UD-Net framework is employed in the study. The training environment of the UD-Net is: Windows10; NVIDIA GeForce RTX 3080; Inter® Core™ i5-8500.
The dataset used is the fogging dataset synthesized by Li et al. [38], which is based on the Outdoor Training Set (OTS) depth database by setting different atmospheric light intensity Ac and transmittance tc(x). In total, 32,760 images out of the dataset are taken as the training set, while 3640 images are taken as the validation set. The dimension of images from used dataset is 320*320. In the training process, Gaussian random variables are used to initialize the network weights. The activation function ReLU is used to add non-linearity to the network after each convolution. The loss function is mean squared error (MSE). Learning the mapping relationship between hazy images and corresponding clean images is achieved by minimizing the loss between the training result and the corresponding ground truth image. The optimizer is the Adaptive Moment Estimation (Adam). Detailed parametric setting is as follows. The learning rate of the network is set to 0.0001; the number of batch samples (batch_size) is set to 8; the epoch is set to 10; the decay parameter of weight is set to 0.001. Detailed parameter settings of our proposed UD-Net (as shown in Figure 5) are summarized in Table 1.

Table 1.
The parameter settings of the UD-Net model.
3.3. Contrast Limited Adaptive Histogram Equalization (CLAHE)
As aforementioned, a restoration model as (3) applies to processing hazy images in the air and underwater images as well. However, in most cases, the underwater background is darker than the air background. It implies that a further treatment is required for underwater images. In the study, Contrast Limited Adaptive Histogram Equalization (CLAHE) is used to process the Luminance channel (L channel in CIE Lab color space) of underwater images after defogging. In this way, the processed images can have better brightness and contrast. Figure 8 shows the result after CLAHE processing. The parameter setting is that the contrast limit is 1.1 in the area of 3*3. As can be seen, after defogging and subsequent CLAHE process, the quality of the underwater images is significantly improved.
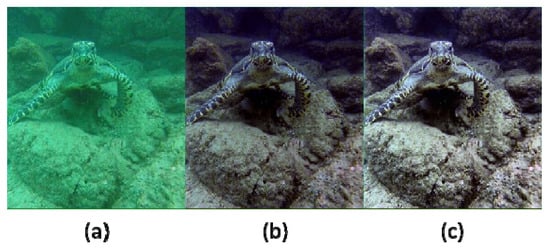
Figure 8.
CLAHE algorithm. (a) Original underwater image; (b) after defogging, and (c) after CLAHE.
4. Validation
To validate the proposed method, underwater images are processed and evaluated from both subjective and objective aspects by comparing with several classic and advanced methods used in underwater image processing, including RCP [11], integrated color model (ICM) [39], relative global histogram stretching (RGHS) [40], multi-scale Retinex with color restoration (MSRCR) [41], FUnIE-GAN [42], and UIE-CNN [43]. The images are taken from the UIEB Dataset [28], in which different degradation conditions are considered.
4.1. Subjective Visual Evaluation
The subjective visual evaluation consists of three parts, i.e., the comparison with other algorithms, ablation experiment and edge information detection.
4.1.1. Comparison with Other Algorithms
Figure 9 presents the results of twelve underwater images processed by six methods mentioned and the proposed method in the paper. It can be seen from the comparison that the proposed method generally outperforms the other algorithms, in terms of color balance, image details and contrast. For ICM and RCP, although they can improve the contrast of images, the color deviation cannot be eliminated well. For RGHS, it only shows good results in processing bluish images. Moreover, the robustness of RGHS is poor. For the MSRCR algorithm, it can effectively alleviate the color distortion. However, the processed image is too bright and the overall contrast is low. FUnIE-GAN has demonstrated the ability to restore underwater images to a certain extent, but the effect is mediocre. UIE-CNN performs well in general, but it does not work well when faced with more severely distorted scenes, as can be recognized from the results w.r.t. the images No.1 and No.12.
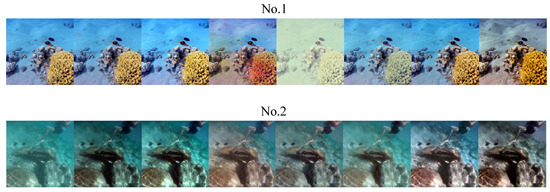
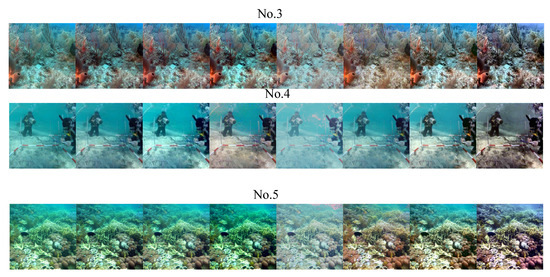
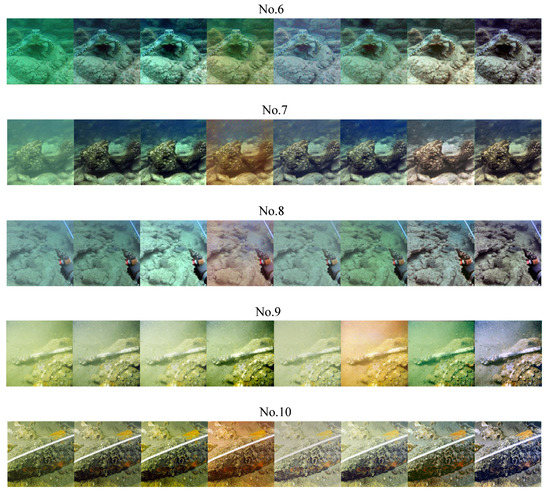
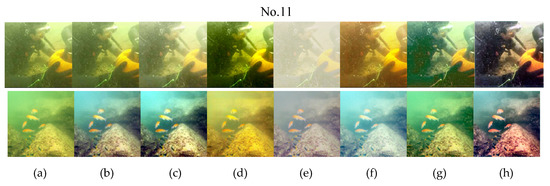
Figure 9.
Processed results of images from UIEB dataset. (a) Underwater images from UIEB dataset; (b) processed by ICM [39]; (c) processed by RCP [11]; (d) processed by RGHS [40]; (e) processed by MSRCR [41]; (f) processed by FUnIE-GAN [42]; (g) processed by UIE-CNN [43]; and (h) processed by the proposed method.
4.1.2. Ablation Experiment
In order to verify the effectiveness of sub-modules in the proposed fusion algorithm in this paper, six sets of images were subjected to ablation experiments in which each module is gradually removed in the combined algorithm. The results are shown in Figure 10. It can be seen from the ablation experiment that each algorithm module has achieved the corresponding processing effect, which helps to enhance the quality of the final output image.
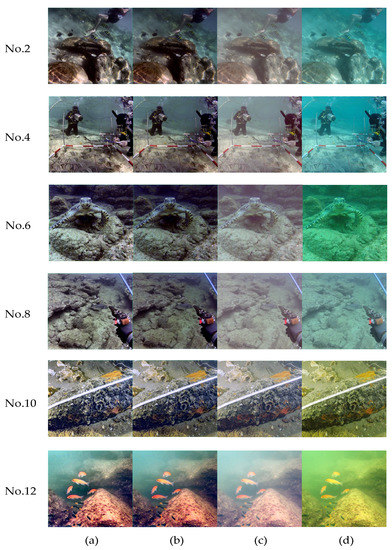
Figure 10.
Results of ablation experiments, (a) is the result of the fusion algorithm proposed in this paper; (b) is the result of removing the CLAHE method and only retaining the dehazing algorithm and the color balance algorithm; (c) is the result after only the color balance processing; and (d) is the original input image.
In order to further verify the dehazing module, it is used to process some fogging images. The proposed method is compared with the several widely used defogging methods including DCP [9], AOD [29], DehazeNet [16], and MSCNN [17]. From the synthetic objective testing set (SOTS) [38], images of different haze concentrations are selected. The qualitative comparison of the visual effect is presented in Figure 11, in which eight images are investigated. As can be recognized, color distortion happens to DCP method (severe in No.6) due to the underlying prior assumptions. In this case, the depth details in image might be lost. For AOD method, it cannot remove the haze well when the fog density is large. DehazeNet method tends to output low-brightness images. MSCNN recovers images with excessive brightness. By contrast, the proposed defogging network produces better images when dealing with hazy images. This can be further confirmed by using two typical objective evaluation metrics including PSNR (Peak Signal to Noise Ratio) and SSIM (Structural SIMilarity) [44]. The quantitative evaluation results and comparison are listed in Table 2 and Table 3. The PSNR and SSIM values of the proposed method are greater than those of others in almost all cases, which indicates that the proposed CNN based defogging network has better applicability and robustness. It is noted that all the best performance indices are emphasized by bold font.
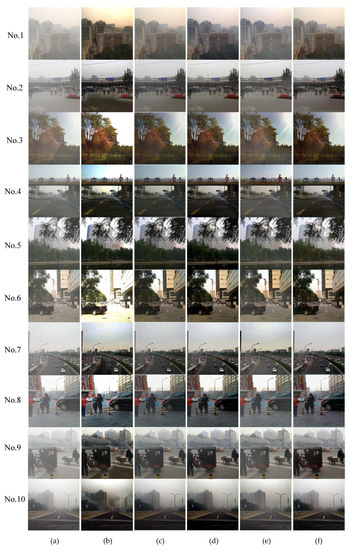
Figure 11.
Visual comparison on fogging dataset. (a) Hazy images sample; (b) processed by DCP [9]; (c) processed by AOD [29]; (d) processed by DehazeNet [16]; (e) processed by MSCNN [17]; and (f) processed by the proposed method.

Table 2.
Evaluation of processed images by metric PSNR.

Table 3.
Evaluation of processed images by SSIM.
4.1.3. Edge Information Detection
In the field of image classification, target detection and feature recognition, the acquisition and application of image edge information play an important role. The higher the quality of the image is, the more obvious the edge information is. On the contrary, the low-quality images have less obvious edge information. To further demonstrate the practicability of proposed method, three representative images, No.2, No.8 and No.12, are selected to study the performance of edge detection. These three images are obtained from different environments and different backgrounds. Canny edge detection is performed. Figure 12 shows the results of edge detection by different methods. It can be seen that the edge information obtained by the proposed method is more abundant than the other methods.
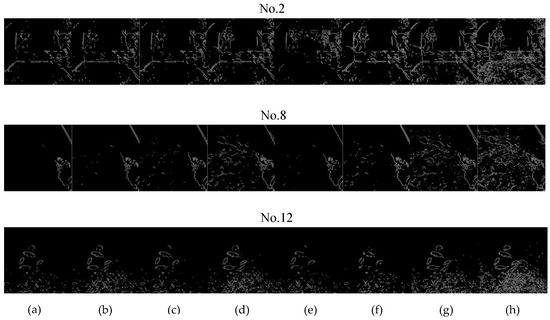
Figure 12.
Edge detection results. (a) Underwater images from UIEB dataset; (b) processed by ICM; (c) processed by RCP; (d) processed by RGHS; (e) processed by MSRCR; (f) processed by FUnIE-GAN; (g) processed by UIE-CNN; and (h) processed by the proposed method.
4.2. Objective Quality Evaluation
Subjective visual evaluation is easily affected by human feelings. Different observers may draw different conclusions on the same group of pictures. Therefore, in the study, an objective quality evaluation of the underwater image processing results is also carried out. The intrinsic characteristic indices of the image are expressed in digital forms to objectively measure the image quality. In this paper, average gradient, RMS (Root Mean Square) contrast, UCIQE (underwater color image quality evaluation) and information entropy are employed to objectively evaluate the quality of the enhanced underwater images.
The average gradient metric is related to the texture transformation of the image and the difference in image details. To a certain extent, this metric can well reflect the contrast and sharpness of the image. In general, the larger the value of the average gradient is, the higher the clarity of an image is. The average gradient is defined as:
where M and N are the width and height of an image; represents the gray value at the image point (x, y); represents the horizontal gradient; represents the vertical gradient.
The value of image contrast indicates the degree of grayscale difference. Generally, the higher the contrast of the image is, the higher the quality of image is. RMS contrast [45], Weber contrast [46], and Michelson contrast [47] are commonly used indices. In this paper, the RMS contrast is taken, which can be expressed as:
where I(x, y) represents the pixel gray value of a certain point (x, y) in an image. Obviously, is the average pixel value of the image.
Compared with the conventional metrics such as average gradient and RMS, UCIQE provides a comprehensive evaluation way. Chroma, saturation, and luminance contrast of an image can be evaluated by this metric [48]. In general, the higher UCIQE value is, the better quality an image has. UCIQE metric is defined as:
where is the standard deviation of chromatically, is the contrast value of brightness, is the mean value of saturation; and stands for the weight coefficient. In the paper, = 0.4680, = 0.2745, and = 0.2576 are chosen by reference to [49].
Besides UCIQE, another comprehensive metric, information entropy, is selected to evaluate the proposed image enhancement method. Information entropy refers to the average amount of information contained in an image [49]. In general, the larger the value of entropy information is, the more information the image includes. Information entropy can be described as:
where n is the maximum gray level of an image; i is the gray level of the pixel point; p(i) represents the probability when the pixel value of the image is equal to i.
For the twelve underwater images that have been evaluated from subjective visual aspect, the results of the above four objective evaluation metrics by seven different image processing methods are listed in Table 4, Table 5, Table 6 and Table 7. In detail, Table 4 gives the results evaluated by the metric average gradient; Table 5 is with the RMS metric; Table 6 is with the UCIQE; Table 7 is with the entropy information.

Table 4.
Evaluation of processed images by the metric of average gradient.

Table 5.
Evaluation of processed images by the metric RMS contrast.

Table 6.
Evaluation of processed images by UCIQE.

Table 7.
Evaluation of processed images by information entropy.
It can be clearly seen from Table 4 and Table 5 that the proposed method is significantly better than other methods in terms of average gradient and contrast. In terms of the comprehensive metrics including UCIQE and entropy information shown in Table 6 and Table 7, the performance of the proposed outperforms the other methods in almost all cases. Two exceptions for UCIQE metric include the results obtained by UIE-CNN for image No.1 and by RGHS for image No.4. Nevertheless, it is noted that in these two cases the results obtained by the proposed method gains the second best evaluation. For the metric entropy information, only one exception happens to the image No.6. In this case, the result obtained by RGHS is the best while the proposed method gains the third best evaluation.
In general, it can be summarized that the proposed underwater image enhancement strategy is better than other methods, in terms of contrast, color coordination, edge information and information. It performs well in dealing with the problems of color degradation, image blur and low contrast of underwater images.
4.3. Complexity
Table 8 shows the comparison of the time spent in processing 100 underwater images by the proposed algorithm and other algorithms including ICM, RCP, RGHS, MSRCR, Funie-Gan and UIE-CNN. It can be seen that the most of the time spent in the proposed algorithm is with a color restoration module that is based on a traditional method.

Table 8.
The time it takes for the algorithm to process underwater images.
5. Conclusions
A hybrid underwater image enhancement and restoration algorithm is proposed that is composed of a color balance algorithm, an end-to-end defogging network algorithm, and a CLAHE algorithm. By studying the color imaging characteristics of underwater images and the histogram distribution characteristics of the image in the CIE Lab color space, a color balance algorithm is proposed to eliminate the color deviation of underwater images. Then, according to the similarity of underwater image imaging characteristics and foggy imaging characteristics, a CNN-based dehazing network is proposed to remove the blur of underwater images and to improve the contrast. Due to the difference between the foggy air environment and the underwater environment, a CLAHE algorithm is used to process the luminance channel in the CIE Lab color space to improve contrast and brightness of underwater images.
The proposed underwater image processing strategy is verified by using foggy air images and validated by using representative underwater images. Processed results show that the proposed method can effectively eliminate the color deviation and ambiguity in underwater images and meanwhile improve the image contrast. Comparison is conducted between the proposed method and other classic and advanced methods. In addition to the visual effect evaluation, four commonly used image quality evaluation metrics (average gradient, RMS contrast, UCIQE, and information entropy) are used to evaluate the effectiveness and advantages of the proposed algorithm. The comparison results indicate that the proposed algorithm is superior to other algorithms in terms of performance and robustness.
Notably, Table 8 shows that the proposed algorithm spends more time in processing images than other algorithms, which affects its real-time performance especially when a large number of images are to be processed. How to improve the real-time performance of the fusion algorithm will be studied in future work.
Author Contributions
Conceptualization, M.Z. and W.L.; methodology, M.Z.; software, M.Z.; validation, W.L.; formal analysis, M.Z.; investigation, M.Z.; resources, W.L.; data curation, M.Z.; writing—original draft preparation, M.Z.; writing—review and editing, W.L.; visualization, M.Z.; supervision, W.L.; project administration, W.L.; funding acquisition, W.L. All authors have read and agreed to the published version of the manuscript.
Funding
This research was funded by Fuzhou Institute of Oceanography, Grant 2021F11.
Acknowledgments
The authors would like to thank the anonymous reviewers for their constructive suggestions which comprehensively improve the quality of the paper.
Conflicts of Interest
The author declares no conflict of interest.
References
- Bindhu, A.; Uma, M.O. Color corrected single scale Retinex based haze removal and color correction for underwater images. Color Res. Appl. 2020, 45, 1084–1903. [Google Scholar]
- Henke, B.; Vahl, M.; Zhou, Z. Removing color cast of underwater images through non-constant color constancy hypothesis. In Proceedings of the 8th International Symposium on Image and Signal Processing and Analysis (ISPA), Trieste, Italy, 4–6 September 2013; pp. 20–24. [Google Scholar]
- Hegde, D.; Desai, C.; Tabib, R.; Patil, U.B.; Mudenagudi, U.; Bora, P.K. Adaptive Cubic Spline Interpolation in CIELAB Color Space for Underwater Image Enhancement. Procedia Comput. Sci. 2020, 171, 52–61. [Google Scholar] [CrossRef]
- Nidhyanandhan, S.S.; Sindhuja, R.; Kumari, R. Double Stage Gaussian Filter for Better Underwater Image Enhancement. Wirel. Pers. Commun. 2020, 114, 2909–2921. [Google Scholar] [CrossRef]
- Ghani, A.S.A. Image contrast enhancement using an integration of recursive-overlapped contrast limited adaptive histogram specification and dual-image wavelet fusion for the high visibility of deep underwater image. Ocean Eng. 2018, 162, 224–238. [Google Scholar] [CrossRef]
- Qiao, X.; Bao, J.; Zhang, H.; Zeng, L.; Li, D. Underwater image quality enhancement of sea cucumbers based on improved histogram equalization and wavelet transform. Inf. Process. Agric. 2017, 4, 206–213. [Google Scholar] [CrossRef]
- Lin, S.; Chi, K.-C.; Li, W.-T.; Tang, Y.-D. Underwater Optical Image Enhancement Based on Dominant Feature Image Fusion. Acta Photonica Sin. 2020, 49, 209–221. [Google Scholar]
- Chiang, J.-Y.; Chen, Y.-C. Underwater Image Enhancement by Wavelength Compensation and Dehazing. IEEE Trans. Image Process. 2012, 21, 1756–1769. [Google Scholar] [CrossRef]
- He, K.; Sun, J.; Tang, X. Single image haze removal using dark channel prior. IEEE Trans. Pattern Anal. Mach. Intell. 2011, 33, 2341–2353. [Google Scholar] [PubMed]
- Drews, P., Jr.; Nascimento, E.R.; Botelho, S.S.C.; Campos, M.F.M. Underwater Depth Estimation and Image Restoration Based on Single Images. IEEE Comput. Graph. Appl. 2016, 36, 24–35. [Google Scholar] [CrossRef]
- Galdran, A.; Pardo, D.; Picón, A.; Gila, A. Automatic Red-Channel underwater image restoration. J. Vis. Commun. Image Represent. 2015, 26, 132–145. [Google Scholar] [CrossRef] [Green Version]
- Carlevaris-Bianco, N.; Mohan, A.; Eustice, R.M. Initial results in underwater single image dehazing. In Proceedings of the IEEE Conference on OCEANS, Seattle, WA, USA, 20–23 September 2010; Volume 27, pp. 1–8. [Google Scholar]
- Wang, N.; Zheng, H.; Zheng, B. Underwater Image Restoration via Maximum Attenuation Identification. IEEE Access 2017, 5, 18941–18952. [Google Scholar] [CrossRef]
- Li, C.; Guo, J.; Cong, R.; Pang, Y.; Wang, B. Underwater Image Enhancement by Dehazing with Minimum Information Loss and Histogram Distribution Prior. IEEE Trans. Image Process. 2016, 25, 5664–5677. [Google Scholar] [CrossRef] [PubMed]
- Berman, D.; Levy, D.; Avidan, S.; Treibitz, T. Underwater Single Image Color Restoration Using Haze-Lines and a New Quantitative Dataset. IEEE Trans. Pattern Anal. Mach. Intell. 2021, 43, 2822–2837. [Google Scholar] [CrossRef] [PubMed] [Green Version]
- Cai, B.-L.; Xu, X.-M.; Jia, K.; Qing, C.; Tao, D. DehazeNet: An End-to-End System for Single Image Haze Removal. IEEE Trans. Image Process. 2016, 25, 5187–5198. [Google Scholar] [CrossRef] [Green Version]
- Ren, W.-Q.; Liu, S.; Zhang, H.; Pan, J.; Cao, X.; Yang, M.-H. Single Image Dehazing via Multiscale Convolutional Neural Networks. In Computer Vision—ECCV 2016, Proceedings of the 14th European Conference on Computer Vision, Amsterdam, The Netherlands, 11–14 October 2016; Leibe, B., Matas, J., Sebe, N., Welling, M., Eds.; Springer: Cham, Switzerland, 2016; pp. 154–169. [Google Scholar]
- Zhao, X.; Wang, K.-Y.; Li, Y.-S.; Li, J.-J. Deep Fully Convolutional Regression Networks for Single Image Haze Removal. In Proceedings of the 2017 IEEE International Conference on Visual Communications and Image Processing, Saint Petersburg, FL, USA, 10–13 December 2017; pp. 1–4. [Google Scholar]
- Hou, M.; Liu, R.; Fan, X.; Luo, Z. Joint Residual Learning for Underwater Image Enhancement. In Proceedings of the 2018 IEEE International Conference on Image Processing (ICIP), Athens, Greece, 7–10 October 2018; pp. 4043–4047. [Google Scholar] [CrossRef]
- Shin, Y.-S.; Cho, Y.-G.; Pandey, G.; Kim, A. Estimation of ambient light and transmission map with common convolutional architecture. In Proceedings of the 2016 IEEE Conference on OCEANS, Monterey, CA, USA, 19–23 September 2016; pp. 1–7. [Google Scholar]
- Hu, Y.; Wang, K.-Y.; Zhao, X.; Wang, H.; Li, Y.-S. Underwater Image Restoration Based on Convolutional Neural Network. In Proceedings of the 10th Asian Conference on Machine Learning, PMLR 95, Beijing, China, 14–16 November 2018; pp. 296–311. [Google Scholar]
- Cao, K.; Peng, Y.; Cosman, P.C. Underwater Image Restoration using Deep Networks to Estimate Background Light and Scene Depth. In Proceedings of the 2018 IEEE Southwest Symposium on Image Analysis and Interpretation (SSIAI), Las Vegas, NV, USA, 8–10 April 2018; pp. 1–4. [Google Scholar] [CrossRef]
- Wang, K.; Hu, Y.; Chen, J.; Wu, X.; Zhao, X.; Li, Y. Underwater Image Restoration Based on a Parallel Convolutional Neural Network. Remote. Sens. 2019, 11, 1591. [Google Scholar] [CrossRef] [Green Version]
- Li, H.-Y.; Li, J.-J.; Wang, W. A Fusion Adversarial Underwater Image Enhancement Network with a Public Test Dataset. Electr. Eng. Syst. Sci. 2019, 1–8. Available online: https://arxiv.org/pdf/1906.06819.pdf (accessed on 30 October 2021).
- Sun, X.; Liu, L.; Li, Q.; Dong, J.; Lima, E.; Yin, R. Deep pixel-to-pixel network for underwater image enhancement and restoration. IET Image Process. 2019, 13, 469–474. [Google Scholar] [CrossRef]
- Uplavikar, P.M.; Wu, Z.; Wang, Z. All-in-One Underwater Image Enhancement Using Domain-Adversarial Learning. In Proceedings of the CVPR Workshops, Long Beach, CA, USA, 16–20 June 2019; pp. 1–8. [Google Scholar]
- Li, J.; Skinner, K.A.; Eustice, R.M.; Johnson-Roberson, M. WaterGAN: Unsupervised Generative Network to Enable Real-Time Color Correction of Monocular Underwater Images. IEEE Robot. Autom. Lett. 2018, 3, 387–394. [Google Scholar] [CrossRef] [Green Version]
- Li, C.; Guo, C.; Ren, W.; Cong, R.; Hou, J.; Kwong, S.; Tao, D. An Underwater Image Enhancement Benchmark Dataset and Beyond. IEEE Tran. Image Process. 2020, 29, 4376–4389. [Google Scholar] [CrossRef] [Green Version]
- Li, B.; Peng, X.; Wang, Z.; Xu, J.; Feng, D. AOD-net: All-in-one dehazing network. In Proceedings of the 2017 IEEE International Conference on Computer Vision (ICCV), Venice, Italy, 22–29 October 2017; pp. 4770–4778. [Google Scholar]
- Foster, D.H. Color constancy. Vis. Res. 2011, 51, 674–700. [Google Scholar] [CrossRef]
- Buchsbaum, G. A spatial processor model for object colour perception. J. Frankl. Inst. 1980, 310, 1–26. [Google Scholar] [CrossRef]
- Xu, X.Z.; Cai, Y.; Liu, C.; Jia, K.; Shen, L. Color Cast Detection and Color Correction Methods Based on Image Analysis. Meas. Control. Technol. 2008, 5, 10–12. [Google Scholar]
- Weng, C.-C.; Chen, H.; Fuh, C.-S. A novel automatic white balance method for digital still cameras. In Proceedings of the 2005 IEEE International Symposium on Circuits and Systems (ISCAS), Kobe, Japan, 23–26 May 2005; pp. 3801–3804. [Google Scholar]
- Howard, A.G.; Zhu, M.; Chen, B.; Kalenichenko, D.; Wang, W.; Weyand, T.; Andreetto, M.; Adam, H. Mobilenets: Efficient convolutional neural networks formobile vision applications. arXiv 2017, arXiv:1704.04861. Available online: https://arxiv.org/abs/1704.04861 (accessed on 15 August 2021).
- Qin, X.; Wang, Z.-L.; Bai, Y.-C.; Xie, X.-D.; Jia, H.-Z. FFA-Net: Feature Fusion Attention Network for Single Image Dehazing. Assoc. Adv. Artif. Intell. 2020, 34, 11908–11915. [Google Scholar] [CrossRef]
- Woo, S.; Park, J.; Lee, J.-Y.; Kweon, I.S. CBAM: Convolutional Block Attention Module. arXiv 2018, arXiv:1807.06521. Available online: https://arxiv.org/abs/1807.06521 (accessed on 15 August 2021).
- Zhao, H.-S.; Shi, J.-P.; Qi, X.-J.; Wang, X.-G.; Jia, J.-Y. Pyramid scene parsing network. In Proceedings of the 2017 IEEE Conference on Computer Vision and Pattern Recognition, Honolulu, HI, USA, 21–26 July 2017; pp. 2881–2890. [Google Scholar]
- Li, B.-Y.; Ren, W.; Fu, D.; Tao, D.; Feng, D.; Zeng, W.; Wang, Z. Benchmarking Single Image Dehazing and Beyond. IEEE Trans. Image Process. 2019, 28, 492–505. [Google Scholar] [CrossRef] [PubMed] [Green Version]
- Kashif, I.; Salam, R.A.; Azam, O.; Talib, A.Z. Underwater Image Enhancement Using an Integrated Colour Model. IAENG Int. J. Comput. Sci. 2007, 34, 239–244. [Google Scholar]
- Huang, D.; Yan, W.; Wei, S.; Sequeira, J.; Mavromatis, S. Shallow-water Image Enhancement Using Relative Global Histogram Stretching Based on Adaptive Parameter Acquisition. In Proceedings of the International Conference on Multimedia Modeling, Bangkok, Thailand, 5–7 February 2018; pp. 453–465. [Google Scholar]
- Rahman, Z.U.; Jobson, D.J.; Woodell, G.A. Retinex Processing for Automatic Image Enhancement. J. Electron. Imaging 2004, 13, 100–110. [Google Scholar]
- Islam, M.J.; Xia, Y.; Sattar, J. Fast Underwater Image Enhancement for Improved Visual Perception. IEEE Robot. Autom. Lett. 2020, 5, 3227–3234. [Google Scholar] [CrossRef] [Green Version]
- Chen, X.-L.; Zhang, P.; Quan, L.-W.; Yi, C.; Lu, C.-Y. Underwater Image Enhancement based on Deep Learning and Image Formation Model. Electr. Eng. Syst. Sci. 2021, 1–7. Available online: https://arxiv.org/abs/2101.00991 (accessed on 30 October 2021).
- Qu, Y.; Chen, Y.; Huang, J.; Xie, Y. Enhanced pix2pix dehazing network. In Proceedings of the 2019 IEEE Conference on Computer Vision and Pattern Recognition, Long Beach, CA, USA, 16–20 June 2019; pp. 8160–8168. [Google Scholar]
- Peli, E. Contrast in complex images. J. Opt. Soc. Am. A 1990, 7, 2032–2040. [Google Scholar] [CrossRef] [PubMed]
- Schreiber, W.F. Fundamentals of Electronic Imaging Systems: Some Aspects of Image Processing; Springer: New York, NY, USA, 1993; pp. 60–70. [Google Scholar]
- Michelson, A.A. Studies in Optics. Dover: New York, NY, USA, 1995. [Google Scholar]
- Yang, M.; Sowmya, A. An underwater color image quality evaluation metric. IEEE Trans. Image Process. 2015, 24, 6062–6071. [Google Scholar] [CrossRef] [PubMed]
- Tsai, D.-Y.; Lee, Y.; Matsuyama, E. Information Entropy Measure for Evaluation of Image Quality. J. Digit. Imaging 2008, 21, 338–347. [Google Scholar] [CrossRef] [PubMed] [Green Version]
Publisher’s Note: MDPI stays neutral with regard to jurisdictional claims in published maps and institutional affiliations. |
© 2022 by the authors. Licensee MDPI, Basel, Switzerland. This article is an open access article distributed under the terms and conditions of the Creative Commons Attribution (CC BY) license (https://creativecommons.org/licenses/by/4.0/).