1. Introduction
Diagnostics and medical therapy should consider as much information as possible about the patient, contributing to its effectiveness. As not all information about the patient is directly available, computer systems in medicine support the processes of extracting, processing, storing and sharing information about the patient. Due to the fact that the main perceptual channel of humans is the vision system, in medicine, we mainly use image data. Therefore, we encounter a number of vision systems that are used in medicine: systems using medical image contrast enhancement [
1], image processing systems of various modalities supporting the therapy of various diseases [
2] or systems supporting the early detection of diseases using categorization algorithms as screening methods [
3]. In medicine, we also independently deal with phenomena modeling systems using computer methods [
4]. Due to limited resources, it allows for prioritizing patients in terms of the priority of providing help [
5]. The proposed work belongs to the class of screening and auxiliary methods of computer-aided therapeutic diagnosis of anorexia, whereby it uses a different type-text data.
Eating disorders have become more and more common in Polish society and worldwide. In the presented work, we focus on Polish society. Eating disorders are psychopathological behaviors that threaten human health and even life. The nature of this disease reveals abnormal and destructive eating attitudes and usually obsessive behaviors related to weight control [
6,
7]. Based on demographics, white girls and women are more affected by the disease. Research shows that the highest incidence refers to the middle and upper classes. The occurrence of anorexia nervosa in adolescence is estimated at 0.5–1% of all the teenager population. The highest morbidity is among girls (incidence in boys is assessed at 5–10% of total incidence). The peak incidence occurs at 15–19 years of age [
8], as this period carries considerable changes in the following areas: biological, social and psychological. Anorexia nervosa is considered a biopsychosocial disorder. Both biological, emotional and socio-cultural factors are essential in its etiology [
9]. Hence, the period of adolescence is considered to be particularly sensitive for the development of anorexia nervosa [
10]. The morbidity for anorexia nervosa among adults is estimated at 0.2–0.8%. Multiple aspects can influence the outcome of eating disorders, such as individual features, life events, family situation (functioning style, family conflicts, low cohesion of family, over-controlling), school and career prosperity (a career related to maintaining a slim figure, a strong need for gaining achievements), social expectations and social-culture factors (current canon of beauty) [
8,
11].
2. Review of the Literature
Inspiring research in people suffering from an eating disorder involves speech analysis. The authors focused on linguistic differences in Italian patients with eating disorders. They assumed that some common characteristics could be linguistic patterns. Research proved statistically significant differences between a group suffering from anorexia nervosa and normal-weighted peers. Anorexics used a lower number of words per sentence than healthy people, but simultaneously they used more frequently long words (more than six letters). They were less likely to refer to terms pointing to senses (e.g., “see”, “feel”) and rarely constructed sentences in the present tense [
12]. The authors in the second article explored the linguistic markers of differences in Internet self-presentation of self-identified pro-anorexics who defend anorexia as a lifestyle and self-identified anorexics in recovery. Research showed more positive emotions and less anxiety in the anorexic group. This group is characterized by a lower degree of cognitive reflection and lower levels of self-directed attention. Unlike the previously described article, the researcher noticed that anorexics were more focused on the present tense. The last observation concerned the subject of speech—they were talking more about food and eating issues but less about school-related topics and death [
13]. Subsequent authors aimed to explore how patients with anorexia nervosa manage the aversive emotions of sadness, anger, anxiety and disgust, and how they link these experiences to their eating disorder behaviors. Patients tended not to express sadness and anger in interpersonal situations but noticed the high level of self-disgust and self-anger connected with their bodies. Research confirmed in another study that a central emotion in their life is self-disgust, and this could be used to suppress another tough emotion, e.g., sadness, anger, anxiety [
14]. In this study, patients described sadness as overwhelming and closely related to depression. This is linked to body dissatisfaction. Patients struggled to control or inhibit anger in interpersonal situations, but uncontrolled anger appeared toward themselves. Anxiety also accompanies illness, in particular, the apparent anxiety of fatness [
15]. The authors of the article discussed the topic of clinical linguistics. Clinical linguistics refers to creating patterns of communication disability concerning a specified illness. Research showed that people suffering from anorexia nervosa compared to healthy people revealed such speech features as concretized emotions (without irony and metaphor), usage of positive words and lower usage of words connected with anxiety, lower level of self-directed attention, little use of first-person singular sentences, putting sentences mainly in the present tense, narrow range of expression related to the cognitive mechanism, food-related topics were more frequent and few statements were related to the outside world and relations [
12].
In the literature review, we can distinguish two computer methods used to assess sentiment and emotions expressed by people who suffer from eating disorders. The first group refers to computer recognition of emotions based on face mimic analysis [
16,
17,
18]. The authors of these methods indicate that people with anorexia nervosa find obstacles in the social domain, which may contribute to the inability to recognize emotions in people’s faces.
The authors of the paper [
16] investigated facial emotion expression in eating disorders, using the computer method for image analysis and Noldus FaceReader software [
19]. This software allowed the authors to detect six basic emotions: happiness, sadness, anger, fear, surprise and disgust, as well as neutral states. The paper aimed at detecting emotions (happiness and sadness) in the faces of anorexia patients while watching short video clips. According to the results, the healthy control patients showed significantly more positive emotions during positive clips compared to the anorexia group. On the other hand, the emotional expression during the sad film clip was the same in both groups. Similar conclusions were made by the authors of the studies [
17,
18], where the focus was to establish recognition thresholds defining how much information is needed to recognize a facial emotion expression and to identify deficits in anorexia patients compared to controls. Results indicated that participants with anorexia were less accurate than the healthy group in recognizing expressions of disgust when shown less ambiguously.
The second group stands for methods based on computer analysis of written or spoken language. Voice, besides face mimic, is an important modality for emotional expression. Speech, in general, is the principal communication channel that contains not only words uttered by a person but also the emotional state of each individual [
20].
The authors of papers [
21,
22,
23,
24] used systems in their research based on various classifiers and methods for feature extraction. The recurrent neural network (RNN) classifier is often used to classify basic emotions. Next, they were compared to multivariate linear regression (MLR), and support vector machine (SVM) techniques, which are widely used in the field of emotion recognition for spoken audio signals [
22]. The results obtained in different data sets indicate that these methods are 80% effective.
The text analysis for detecting specific emotions is more complex than sentiment analysis [
25,
26,
27]. However, it offers more benefits, as it more precisely depicts the author’s attitude included in a note. The computer algorithm for emotion detection mostly uses a categorical model of emotions and focuses on classifying a text to a particular emotional category. The researchers most frequently apply methods of machine learning, especially various classifiers. The authors of [
25,
26] used Bayes naive classifier and SVM (support vector machines) for classifying the text to one of the six emotions (according to Ekman model [
20]). The research was conducted on the collection of internet blogs. As attributes for classifier, the authors used terms that belong to relevant classes containing emotional terms in the lexical database of WordNetAffect and General Inquirer.
A comprehensive comparison of the effectiveness of various classifiers (Bayes, kNN, decision trees) in emotion detection is presented in papers [
28,
29]. The other attitude also applies various rule-based approaches [
29], where each word has a particular emotion and its intensity. The extension of the rule-based system is an attitude, where the authors made emotion categorization through analysis of latent semantic groups—the participants performed similar schemas of utterance [
30]. According to the authors of these papers, NLP methods used to analyze emotions based on machine learning give better results than those using only dictionary methods.
All methods compared above have some pros and cons. Nevertheless, emotion recognition based on the face image and spoken language is at some point invasive. As therapists and psychologists say, patients suffering from eating disorders have problems in expressing their own emotions. They usually find it tough to name them and feel ashamed about them. Such patients frequently refuse to take part in an experiment where they are recorded. Therefore, in our research, we decided on the least invasive method. Our analysis of emotion explores written notes prepared by patients. The vital phase of the research is that the note can be written by a patient at home or in other places with the most safety and comfort to a patient.
The method proposed in the paper for determining the intensity of five emotions (happiness, sadness, anxiety, anger and disgust) in medical notes focuses on the extended Nencki Affective Word List (NAWL) dictionary, in the space of property vectors with the selection of parameter values [
31]. There are many methods for detecting emotions, but they require a large corpus of data. The current database was collected for 3 years. Because of the patient’s psychical resistance, obtaining a more considerable corpus of notes is an objectively difficult task, which could help apply methods based on deep learning, so the decision was made to extend the NAWL dictionary (which does not require a large corpus of data). Next, we analyzed the feelings of people suffering from anorexia nervosa concerning a control group of healthy people. The goal was to find emotional patterns that distinguish sick people from healthy people.
3. Materials and Methods
Identifying the accompanying emotions of a person suffering from an eating disorder is vital for treatment. Clinical research shows that accompanying emotions of anger and anxiety cause a reluctance to eat, while feeling depressed and disappointed leads to excessive food consumption. For people suffering from eating disorders, the problem of emotional state is more complex—patients diagnosed with such a diagnosis may feel the emotions more strongly [
32].
By developing a method to automatically indicate the intensity of emotions in notes, we intend to find a solution to the problem.
We asked the patients to write free notes about their bodies. We also did not suggest the length of the notes. It depended on the patients’ will, in order to not make the patient reluctant by the issue of body image. This was due to the fact that people with eating disorders do not eagerly speak about their bodies. Moreover, we did not suggest any topics or issues, as we wanted to avoid the effect of projection in the statement towards a specific direction. Participants in the research group were people with confirmed anorexia and were still under clinical care. We researched 96 notes (46 from people suffering from anorexia and 52 from healthy people).
In order to include a patient with a disorder for the study, the following criteria had to be met:
Clinically diagnosed anorexia,
The age of the patients was adolescence (12–18 years),
No comorbid mental illnesses,
The disease lasted no more than 3 years.
The control group consisted of people meeting the following assumptions:
The work used NAWL [
33]. The original dictionary, the base for the NAWL dictionary, is called The Berlin Affective Word List Reloaded (BAWL-R) and is in German [
34]. NAWL dictionary consists of 2902 Polish words (nouns, verbs, adjectives) with assessed emotion intensity rating. The emotions covered in this dictionary are happiness, sadness, disgust, anger and anxiety. Vocabulary in the Polish language is extensive, so the mentioned dictionary is quite limited. The motivation was to carry out the dictionary expansion, i.e., determining the emotional intensity of the words not included in the dictionary (indefinite words). Using only the original dictionary was not effective, as only a few words in text notes were found. In most cases, text notes had the highest intensity of happiness because in the basic dictionary, half of the terms have that emotion as the dominant emotion (emotion with the highest intensity) [
33].
4. Dictionary Expanding with New Words from Medical Notes
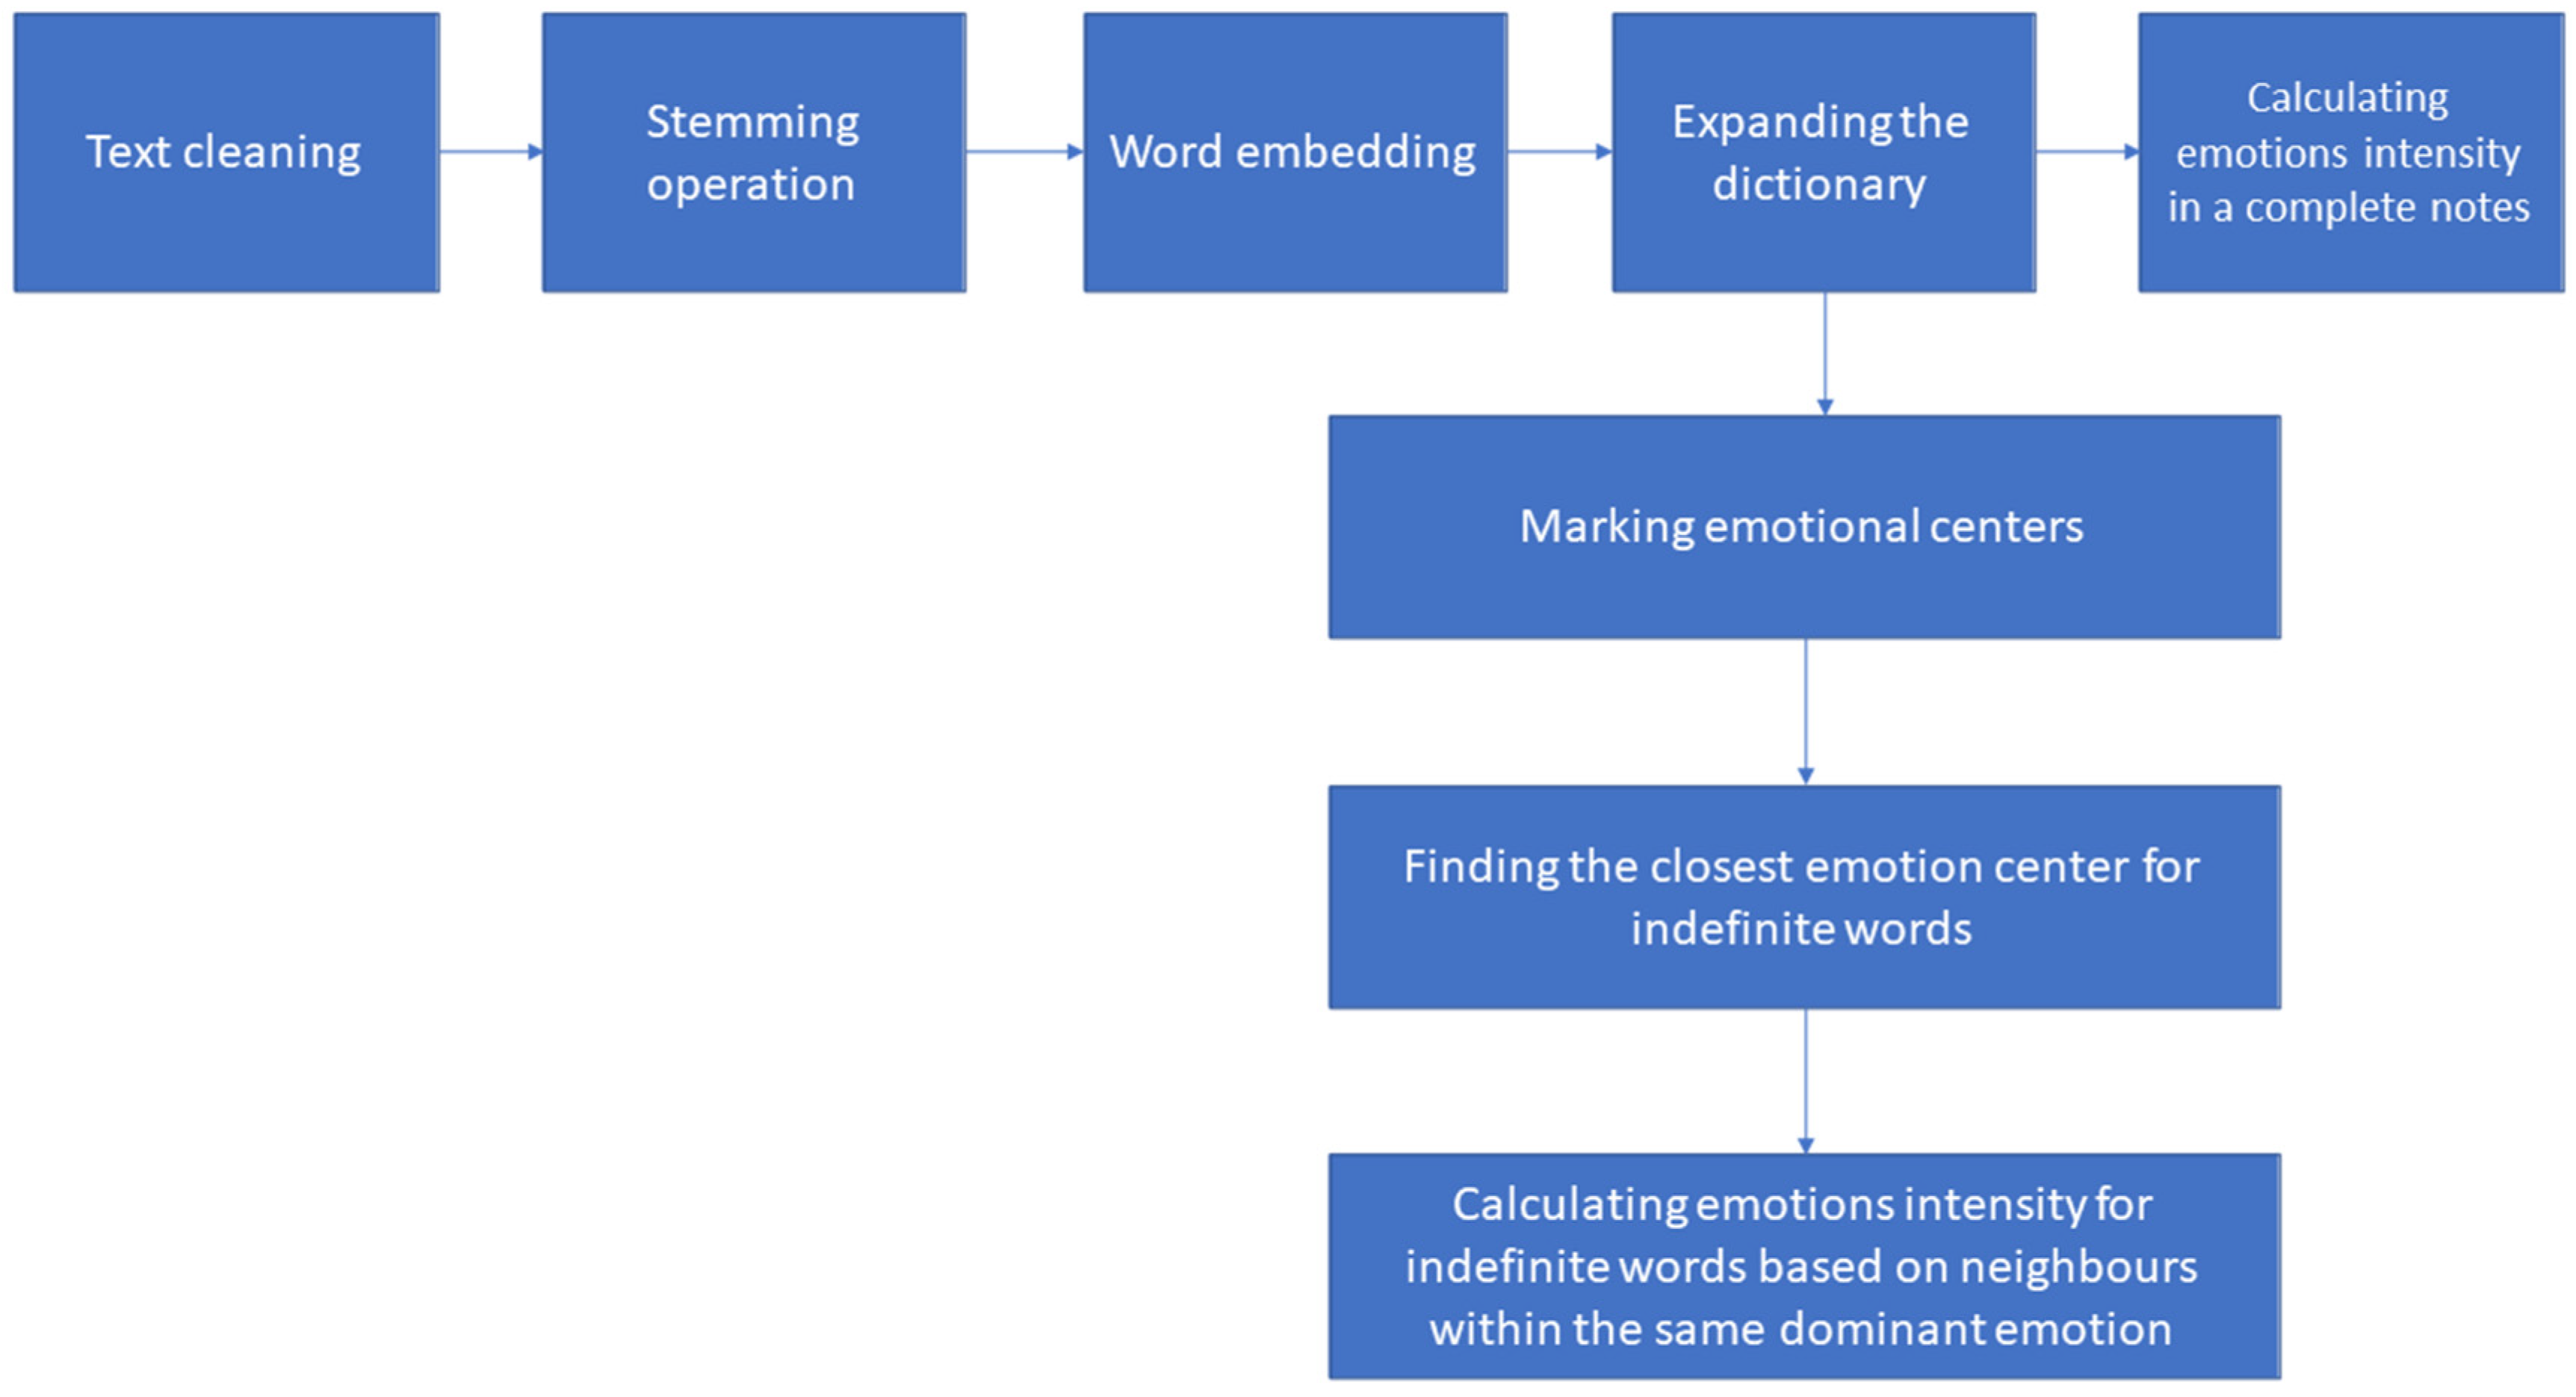
Figure 1 shows stages of the extending algorithm. The first stage was stemming, i.e., reducing words to their stem. The stem is not always an existing word, but derivative words related to each other were mapped to the same stem [
35]. Words in the original dictionary have forms of morphological roots, so this operation was used to standardize.
The first stage was note cleaning. This operation consisted of converting letters to lowercase, removing words with numbers inside, removing numbers and removing words from the stop list (a list containing words, which could disturb analysis). Then stemming dictionaries were generated in SAS Institute Software SAS
® Text Miner 14.1 [
36]. The third stage referred to word transformation into numerical vectors—the word embedding operation was performed, resulting in low-dimensional vectors being generated [
37]. The multidimensional space in which these vectors are presented makes it possible to capture the relationship between words, e.g., what words appear in the context of another word. A simple neural network was used to generate word embedding. This network consisted of three layers: input and two dense outputs with linear activation function, and dense with softmax activation function. Categorical cross-entropy was chosen as loss function and Adam optimizer for model compilation. The batch size during network training was 256, and the training was set for 1000 epochs. The input data were coded by one-hot encoding. The fourth stage was to determine the emotional intensity of words from text notes, which were not included in the original dictionary. The first step within this stage was marking the locations of the emotional center—this was carried out based on coexisting words in written notes and NAWL dictionary with specific values of emotions intensity. The emotional center is the average of each dimension from numerical vectors (word embed) among labeled words with a particular dominant emotion. Then, the most similar emotional center was selected based on the cosine similarity for each indefinite word [
38]. Cosine similarity is a measure of the similarity of two vectors. Every indefinite word was labeled as the center to which it is most similar. The formula below gives cosine similarity:
Based on the smallest Euclidean distance, a few words with the determined emotion intensity adjacent to the indefinite word is picked [
39]. Three main operations contribute to defining the intensity of emotions. The first is determined by the Formula (2). This formula is the sum of the distance of the analyzed word from its closest neighbors.
zk—the distance of the adjacent word from the analyzed word.
Next, the operation described by Formula (3) takes place. Furthermore, the fraction of the given distance is calculated from all the summed-up distances for each of the neighbors
The last operation is presented by the Formula (4). The final value of the intensity of a given emotion is calculated based on this operation—it is the sum of the products of fractions of the distance calculated previously with the corresponding values of the intensity of emotions.
Sk—the intensity of a certain emotion of k-word.
According to the formula above (
emointensity), the operation is repeated for each emotion separately—the value of
Sk is changed. After expanding the dictionary, the method introduces the following measures to determine the emotions in the note: the sum of the intensity of individual emotions, the number of words in the note for each emotion (words with specific dominant emotion), the percentage distribution of words from a given emotion and a measure of the intensity of the emotion based on the formula:
The values of the intensity of emotions range from 0 to 1, where 0 means that there is no emotion in the note, and 1 is the maximum value of emotion in the note.
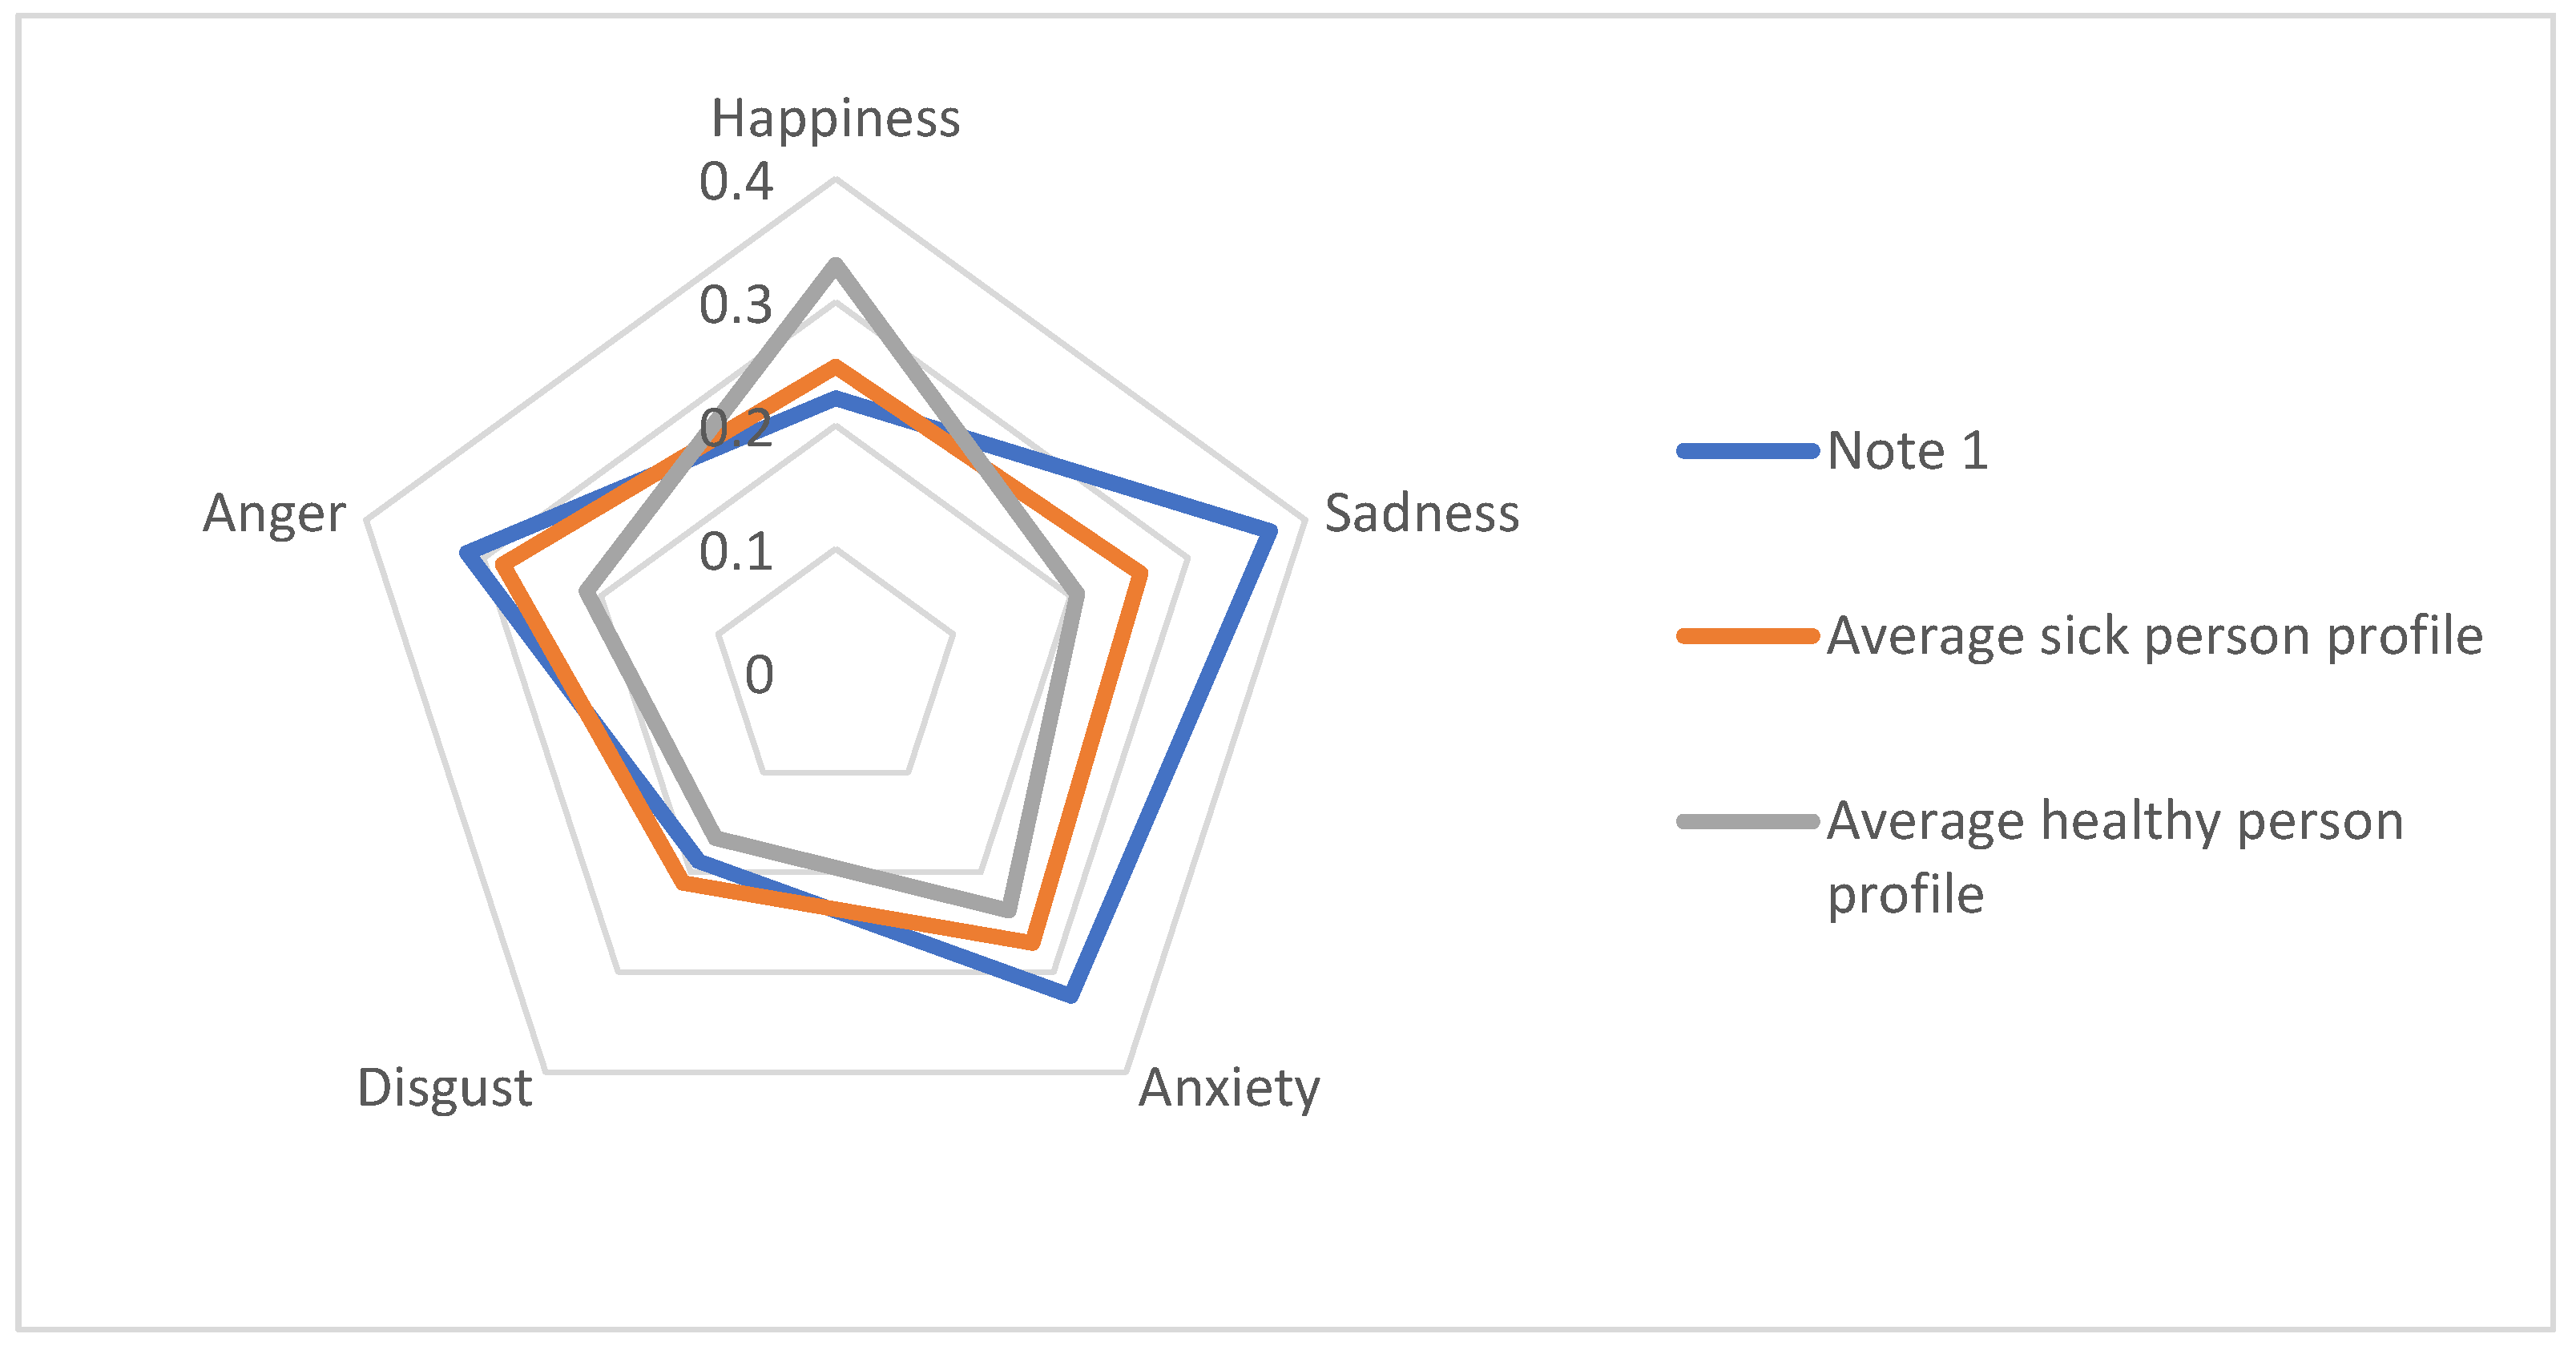
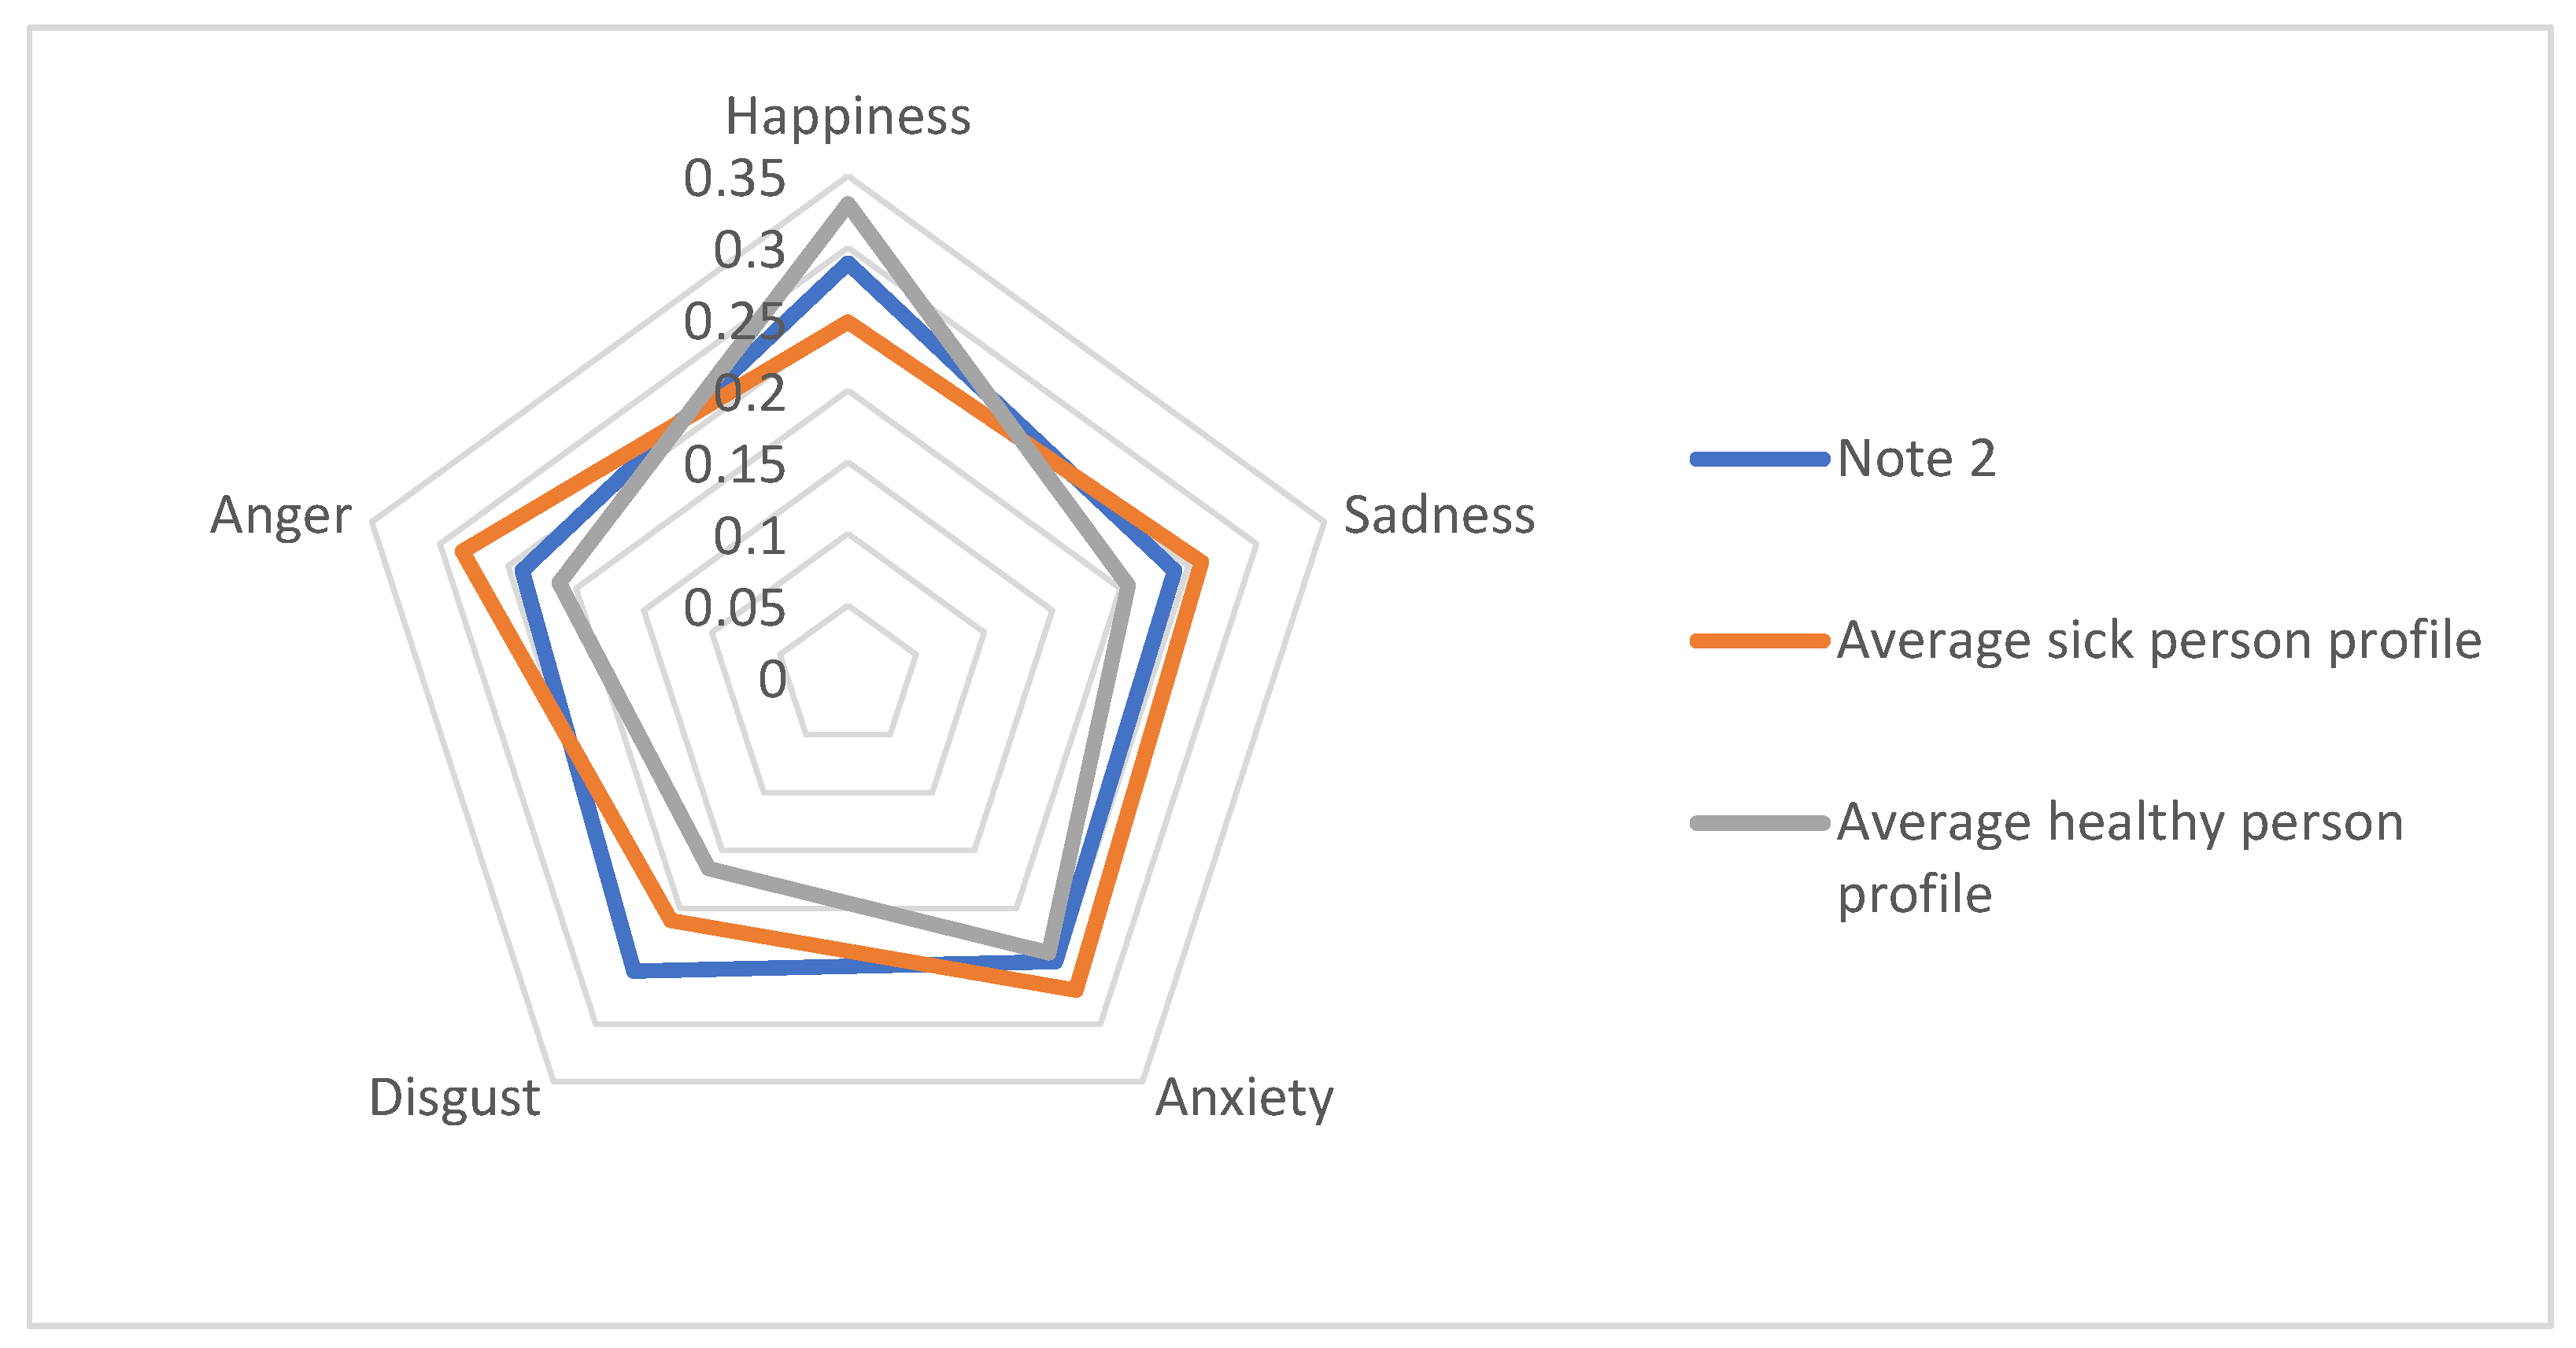
Based on the analysis of 96 notes using the presented method, emotional profiles of a sick and healthy person were built with different variants of parameters. Each note was analyzed in terms of emotions. Then the average values of each emotion were calculated for the group of healthy and sick people.
4.1. Expert Consultations
The collected text notes from patients were tagged with the accompanying illness (anorexia nervosa) by a psychology expert. According to the expert consultation, people suffering from anorexia nervosa should experience the highest intensity of the emotions of anxiety.
4.2. Material Used in the Research
The authors of the notes were focused on the subject of perception of their bodies. After we had established appropriate study inclusion criteria, the data collection was performed. It included only girls in both groups. The current collection of medical notes in which the following studies were carried out was 96 records in Polish. The database consisted of 44 text notes from girls suffering from anorexia and 52 from healthy ones. The BMI of patients ranged from 11.1 kg/m
2 to 20.6 kg/m
2, and average 15.6 ± 2.4 kg/m
2. The BMI of patients in the healthy group ranged from 16.1 kg/m
2 to 24.8 kg/m
2 and average 20.1 ± 2.1 kg/m
2. According to the International Statistical Classification of Diseases and Related Health Problems (ICD-10) (Diagnostic Criteria for Research), an adult BMI value of less than 17.5 kg/m
2 indicates anorexia [
40]. Based on BMI values, it is obvious that the patients were significantly underweight, while healthy people had an average body weight.
4.3. Conducted Experiments
During the research, two experiments occurred to test the proposed method. Over the first experiment, we checked whether the window width (the number of context words in a written note) significantly influences the valency of indefinite words while expanding the dictionary. In the second experiment, the same issue was examined, but the neighborhood during approximation was changed. Details of the experiment are provided below:
- →
Experiment I—five groups with different lengths of word embedding vector (3, 10, 20, 50 and 100) with 4-neighborhood during approximation were tested, the parameter of window width was changed within {2,3,5}.
- →
Experiment II—five groups with different lengths of word embedding vector (3, 10, 20, 50, and 100) with 5-neighborhood during approximation were tested, the parameter of window width was changed within {2,3,5}.
6. Discussion
When considering the best solution, we can conclude that in the case of medical notes that we had at our disposal, a property vector of length 10 is sufficient. The vocabulary was too varied to see visible differences with a three-dimensional property vector, while longer vectors did not capture the relationships well between the words. The notes were relatively short, which was the reason why, with the width of the (contextual words) window, five often reached extreme words and included them in the context. With a window width of two, the contextual words were too close together. The best chosen window width was three. In the second experiment, the results came out very close to the results from experiment 1. Neighborhood five did not deteriorate or improve the results.
When comparing the average intensity of emotions in the profiles of a healthy person and a sick person, a higher value of the intensity of happiness is noticeable in the profile of a healthy person than in the profile of a sick person. The opposite occurs with other emotions—they reach higher values in the case of a person suffering from anorexia nervosa. The authors of the article drew attention to the dominant negative words among people suffering from eating disorders [
41].
Disgust and happiness had the strongest negative correlation in both cases (the anorexia nervosa and the healthy groups). There were two more pairs in healthy people with a strong negative correlation: happiness-anxiety, happiness-sadness. The strongest correlations among sick people and healthy people were sadness-anxiety, sadness-anger and anger-anxiety.
The possibility of non-invasive detection of dominant emotions is an important indicator that helps determine the patient’s current condition in the context of the intensity of psychopathological symptoms, evaluation of the therapeutic interactions applied and areas for therapeutic interactions [
42]. The ability to determine the ratio of the intensity of individual feelings is crucial because it determines both the patient’s well-being and his psychopathological context. It can be used to assess emotional resources and constitute a prognostic factor for the undertaken therapeutic interactions. Sadness and anxiety are a correlation favoring the patient’s depression, and, at the same time, a greater risk factor for the patient’s active participation in the treatment process. Anger is a more energetic emotion that stimulates action. However, the correlation between anger and sadness carries the risk of self-harm, i.e., transferring the feeling of anger onto oneself in a sad situation, which favors the feeling of helplessness and guilt.
We can apply the method for the quantitative assessment of the therapist’s knowledge. Moreover, its use can also be found in screening tests to identify people who are potentially at risk of an eating disorder based on their emotional state. The proposed solution may also indicate whether the therapy helps the patient, and his emotional profile is similar to a healthy person.
The proposed method will also be tested for other known eating disorders. A further direction of the study could also be to investigate other psychological disorders with a biopsychosocial, psychosomatic or chronic disease, e.g., oncological disease.
7. Conclusions
The study used the extension to the NAWL dictionary for better determining the five basic emotions: happiness, sadness, anger, anxiety and disgust in texts. The research group consisted of healthy girls and anorexia patients. We managed to show the possibilities of emotional profile differentiation among both healthy and sick people. So far, the obtained results are promising.
The authors were aware that extracting emotions from the text is more complicated and burdened with greater challenges than extracting emotions from multimodal data, due to the lack of non-verbal clues about the emotions accompanying the statements. There is also a need to take into account the cultural context. However, considering the context of the proposed application, the selected approach due to the patient’s resistance and the lack of available thematic text corpora seemed justified. After considering the typical challenges of extracting emotions from texts, such as sarcasm or contextual information, we decided to use a method based on basic word form, which reduces the importance of the above-mentioned challenges. The cultural context was also essential, so we limited the research group and controls to native speakers of the Polish language. The proposed approach focused on a discrete model of emotions and detecting keywords that convey emotions. The main weakness of this class of methods is the limited vocabulary of emotional carriers. The proposed approach overcomes this disadvantage by extending the vocabulary of emotion carriers with the use of property vectors. The construction of property vectors also takes into account contextual information because this model is created based on the matrix of word occurrences. The proposed application as a computer-aided therapeutic diagnosis of anorexia nervosa has potential application as a guide for a psychologist who determines the diagnosis and treatment stages autonomously under medical and ethical standards.
In the future, the method should be tested on a more extensive database. The developed solution can also be applied in other mental disease diagnostics. The method can be used for quantitative assessment, supporting the therapist’s knowledge. Its use can also be found in screening tests to identify people who are potentially at risk of an eating disorder, based on their emotional state. The proposed solution may also indicate whether the therapy helps the patient, and if his emotional profile is similar to a healthy person.


 ,
, 


