Article

Concatenation of Pre-Trained Convolutional Neural Networks for Enhanced COVID-19 Screening Using Transfer Learning Technique

1
Electrical Engineering and Intelligent Systems (EEIS) Laboratory, ENSET of Mohammedia, Hassan II University of Casablanca, B.P. 159, Mohammedia 28820, Morocco
2
STIE Team, CRMEF Casablanca-Settat, Provincial Section of El Jadida, El Jadida 24000, Morocco
3
College of Computer Science and Engineering, Taibah University, Medina 42353, Saudi Arabia
4
Department of Computer Science, Saba’a Region University, Marib 0000, Yemen
5
School of Computing and Digital Technology, Birmingham City University, Birmingham B4 7XG, UK
6
Department of Information Technology, College of Computer, Qassim University, Buraydah 51452, Saudi Arabia
7
Department of Computer Science, College of Applied Sciences, Taiz University, Taiz 6803, Yemen
*
Authors to whom correspondence should be addressed.
Electronics 2022, 11(1), 103; https://doi.org/10.3390/electronics11010103
Submission received: 23 November 2021 / Revised: 19 December 2021 / Accepted: 27 December 2021 / Published: 29 December 2021

Abstract

:
Coronavirus (COVID-19) is the most prevalent coronavirus infection with respiratory symptoms such as fever, cough, dyspnea, pneumonia, and weariness being typical in the early stages. On the other hand, COVID-19 has a direct impact on the circulatory and respiratory systems as it causes a failure to some human organs or severe respiratory distress in extreme circumstances. Early diagnosis of COVID-19 is extremely important for the medical community to limit its spread. For a large number of suspected cases, manual diagnostic methods based on the analysis of chest images are insufficient. Faced with this situation, artificial intelligence (AI) techniques have shown great potential in automatic diagnostic tasks. This paper aims at proposing a fast and precise medical diagnosis support system (MDSS) that can distinguish COVID-19 precisely in chest-X-ray images. This MDSS uses a concatenation technique that aims to combine pre-trained convolutional neural networks (CNN) depend on the transfer learning (TL) technique to build a highly accurate model. The models enable storage and application of knowledge learned from a pre-trained CNN to a new task, viz., COVID-19 case detection. For this purpose, we employed the concatenation method to aggregate the performances of numerous pre-trained models to confirm the reliability of the proposed method for identifying the patients with COVID-19 disease from X-ray images. The proposed system was trialed on a dataset that included four classes: normal, viral-pneumonia, tuberculosis, and COVID-19 cases. Various general evaluation methods were used to evaluate the effectiveness of the proposed model. The first proposed model achieved an accuracy rate of 99.80% while the second model reached an accuracy of 99.71%.

1. Introduction

Coronaviruses, such as the SARS coronavirus (SARS-CoV-2), MERS coronavirus (MERS-CoV), and SARS-CoV-2, are viruses that frequently cause mild to severe respiratory infections [1]. The severe acute respiratory syndrome coronavirus 2 (SARS-CoV-2) in particular has caused the COVID-19 pandemic, which began in Wuhan, China, before spreading to all countries and territories worldwide, as stated by the World Health Organization (WHO) in 2020 [2]. For the following sections in this paper, coronavirus and COVID-19 refer to the same thing. Furthermore, COVID-19 is the most pervasive coronavirus infection, according to outbreaks of other coronavirus diseases. The early stages of coronavirus are considered by many respiratory symptoms such as fever, cough, dyspnea, pneumonia, and tiredness [3]. Coronavirus affects the circulatory and pulmonary systems, and in severe cases it can result in multiple organ failure or acute respiratory distress [4]. It’s also extremely contagious, and as a result, it has infected a large number of individuals, putting pressure on the hospital system. Coronavirus infections are a critical healthcare concern that has become a global threat.
To confront this pandemic, many laboratories around the world have developed a set of vaccines and drugs such as Pfizer-BioNTech, Moderna, and Johnson & Johnson Coronavirus Vaccine [5,6]. Coronavirus early detection is essential to offer required medical assistance and to limit the spread of this virus. In addition to the PCR—a coronavirus test—it is critical to develop alternate ways for performing a rapid and efficient test for Coronavirus [7]. This encourages us to investigate and propose an intelligent MDSS-based AI tools.
Nowadays, AI approaches are widely utilized in the medical field aiming to assist doctors in the decision-making process [8,9,10,11,12,13,14,15]. Several other areas have also benefited from advances in AI [16,17,18,19]. Machine Learning (ML) and Deep Learning (DL) methods have been applied to medical data, such as X-ray images or CT scans, confirming their effectiveness in terms of diseases identification and monitoring [20]. These techniques demand computational time and require an accelerating process [21,22,23], but it is an acceptable trade-off for obtaining precision. In the context of coronavirus screening, these techniques have proven to be extremely useful in predicting confirmed cases of a variety of diseases. [24,25,26,27]. As a branch of AI, DL techniques are being employed to get better results than traditional ML approaches [28,29]. Particularly, CNNs are among the most widely utilized methods in medical image analysis and classification [30,31,32,33,34]. This type of approach has attracted the attention of several coronavirus detection researchers in medical imaging [35,36,37,38].
This research aims to introduce a novel and accurate MDSS that can detect coronavirus in chest X-ray images from other viral and pneumonia diseases. The novelty proposed is the usage of the concatenation technique aiming to combine pre-trained CNN based on TL technique to build a highly accurate model compared to the available methods in the literature.
To train and validate our proposed models, we merged six independent X-ray databases to create a new consistent dataset with 4 classes: Normal, Coronavirus, Tuberculosis, and finally Pneumonia. Based on the default two input family shapes of the selected pre-trained models (299 × 299 and 224 × 224), the concatenation technique allows us to combine the performance of these models to improve the prediction accuracy concerning of the individual models. The two models resulting from the concatenated model achieve the best accuracy compared to many related works. The main contributions of this research can be summarized as follows:
  • The development and implementation of an accurate medical diagnosis support system for detecting coronavirus disease in chest X-ray images using a concatenation technique and TL-based models;
  • The collection of a balanced medical X-ray image dataset includes four main classes (normal, viral pneumonia, tuberculosis, and coronavirus cases) for the training and testing the proposed system;
  • The application of a parallel deep feature extraction approach based on TL models in the feature extraction phase of our concatenation-based models;
  • The relative high accuracy of the proposed concatenation-based models performance.
This research is organized as follows: Section 2 provides a discussion of related work available in the literature. In Section 3, an explanation of the materials and methods, as well as the dataset, TL algorithms, and methodology employed is presented. Section 4 presents the experimental results and discussion. Finally, Section 5 lists the conclusions and future research directions.

2. Related Works

Many researchers world-wide have produced and published numerous studies in the previous two years to help contain the spread of the SARS-CoV-2 virus. Many of these studies have employed different AI approaches to process and diagnose the X-ray images to identify different diseases. DL methods are the most popular method utilized for classifying images due to its ability to produce better results compared to typical ML approaches. In this section, we focus on the studies that use the new techniques to diagnose coronavirus based on DL approaches.
In [39], the bag-of-features (BoF) model is shown to have the potential for categorizing normal and coronavirus cases based on an open dataset of chest X-ray images. Using K = 200, the proposed system achieved the best results, with an accuracy of 98.6%, a sensitivity of 99.4%, and a precision of 97.7%.
Another study proposes a novel hybrid classifier, using Gauss-map-based chaotic particle swarm optimization Neural network [40], which was designed to classify coronavirus, normal, and bacterial pneumonia X-ray images. The results showed 99.25% accuracy and 99.53% AUC metrics.
In [41], the authors present another model based on the fusion of a CNN, a support vector machine (SVM) and a Sobel filter. This model was built using X-ray images from six different available datasets. The accuracy of this classification model was 99.61%.
The authors in [42], suggest a model for categorizing X-ray images based on a novel multi-kernel-size spatial-channel attention model. With a binary-class database (coronavirus and normal), the proposed model accomplishes an accuracy of 98.2%.
Another study in [43], offers a bi-level prediction model based on pre-trained model VGG-19 and XGBoost classifier. This model is depending on a dataset of X-ray images with 3 classes of coronavirus, normal, and pneumonia. According to the reported results, the best accuracy achieved using the proposed model in this research is 99.26%.
Other research presented in [44], proposes a DL model based on CNN to identify the Coronavirus disease. The study reports a classification accuracy of 99.64% and 98.28% for binary and multiclass classification, respectively.
A comparison study based on TL models is published by the authors in [45]. A single layer-based (SLB) and feature fusion-based (FBB) is used. SLB1, SLB2, SLB3, SLB4, FFB1, FFB2, FFB3, FFB4, FFB5, and FFB6 are the models used in this research. For training purposes, models proposed in this research used a database containing three classes of coronavirus, normal, and pneumonia. With an accuracy of 87.64%, the authors have found that FFB3 is the best model for reliably detecting coronavirus.
As another effort, the study in [46], has introduced three pre-trained models to build a diagnostic system such as ResNet50 V2, VGG16, and finally InceptoinV3. The dataset used in this study includes coronavirus, normal, and pneumonia chest X-ray images from two public data sources. 95.49% is the best accuracy reported by the proposed model in this study.
In [47], The VGG16-Network, which depends on the authors’ TL model, has attained 91.69% for a multi-classification of cases infected by (i) coronavirus, (ii) normal, and (iii) pneumonia. The model suggested in this paper makes use of X-ray images from an open-source dataset.
In [48], the authors present a CNN-RNN mixed design. To diagnose coronavirus from chest X-rays, this proposed model uses CNN and recurrent neural network (RNN). VGG19-RNN is the best trained model in this research; it is based on a dataset of X-ray images with three classes: (i) coronavirus, (ii) normal, and (iii) pneumonia. This model’s categorization accuracy is 99.85%.
The research in [49] proposes 3 pre-trained models of TL: VGG16, Inception V3, and finally EfficientNetB0. The tested dataset in this research has been collected from various public-sources and contained 3 different classes: coronavirus, normal, and viral pneumonia X-ray images. The reported accuracy is 87.84%, 91.32%, and 92.93% for VGG16, Inception V3, and EfficientNetB0, respectively.
Another research offers a new model for the Coronavirus Screening based on a Residual-Shuffle Network with Spatial Pyramid Pooling [50]. With a multi-class dataset (Coronavirus, Normal, and pneumonia), the classification accuracy of 97.39% has been reached.
A more recent study in [51] presents a novel approach for Coronavirus diagnosis based on an exemplar and hybrid fused deep feature. In the feature extraction step, three pre-trained convolutional neural networks (CNNs) are used: AlexNet, VGG16, and VGG19. Control, Bacterial Pneumonia, Viral Pneumonia, and Coronavirus are the four classes in the dataset used in this study. The accuracy for two, three, and four classes is 99.64%, 98.84%, and 97.60%, respectively.
In Table 1, we summarize these studies by listing the number of classes, the utilized models, and best-achieved results based on the used evaluation metrics.
Comparing these proposed studies in the related works section reveals that the majority of these proposed models have issues with feature extraction. As a result, the results of these studies were influenced by this phase. To address this issue, we adopted a parallel deep feature extraction strategy based on TL models during the feature extraction phase to improve the accuracy of our suggested concatenation models.

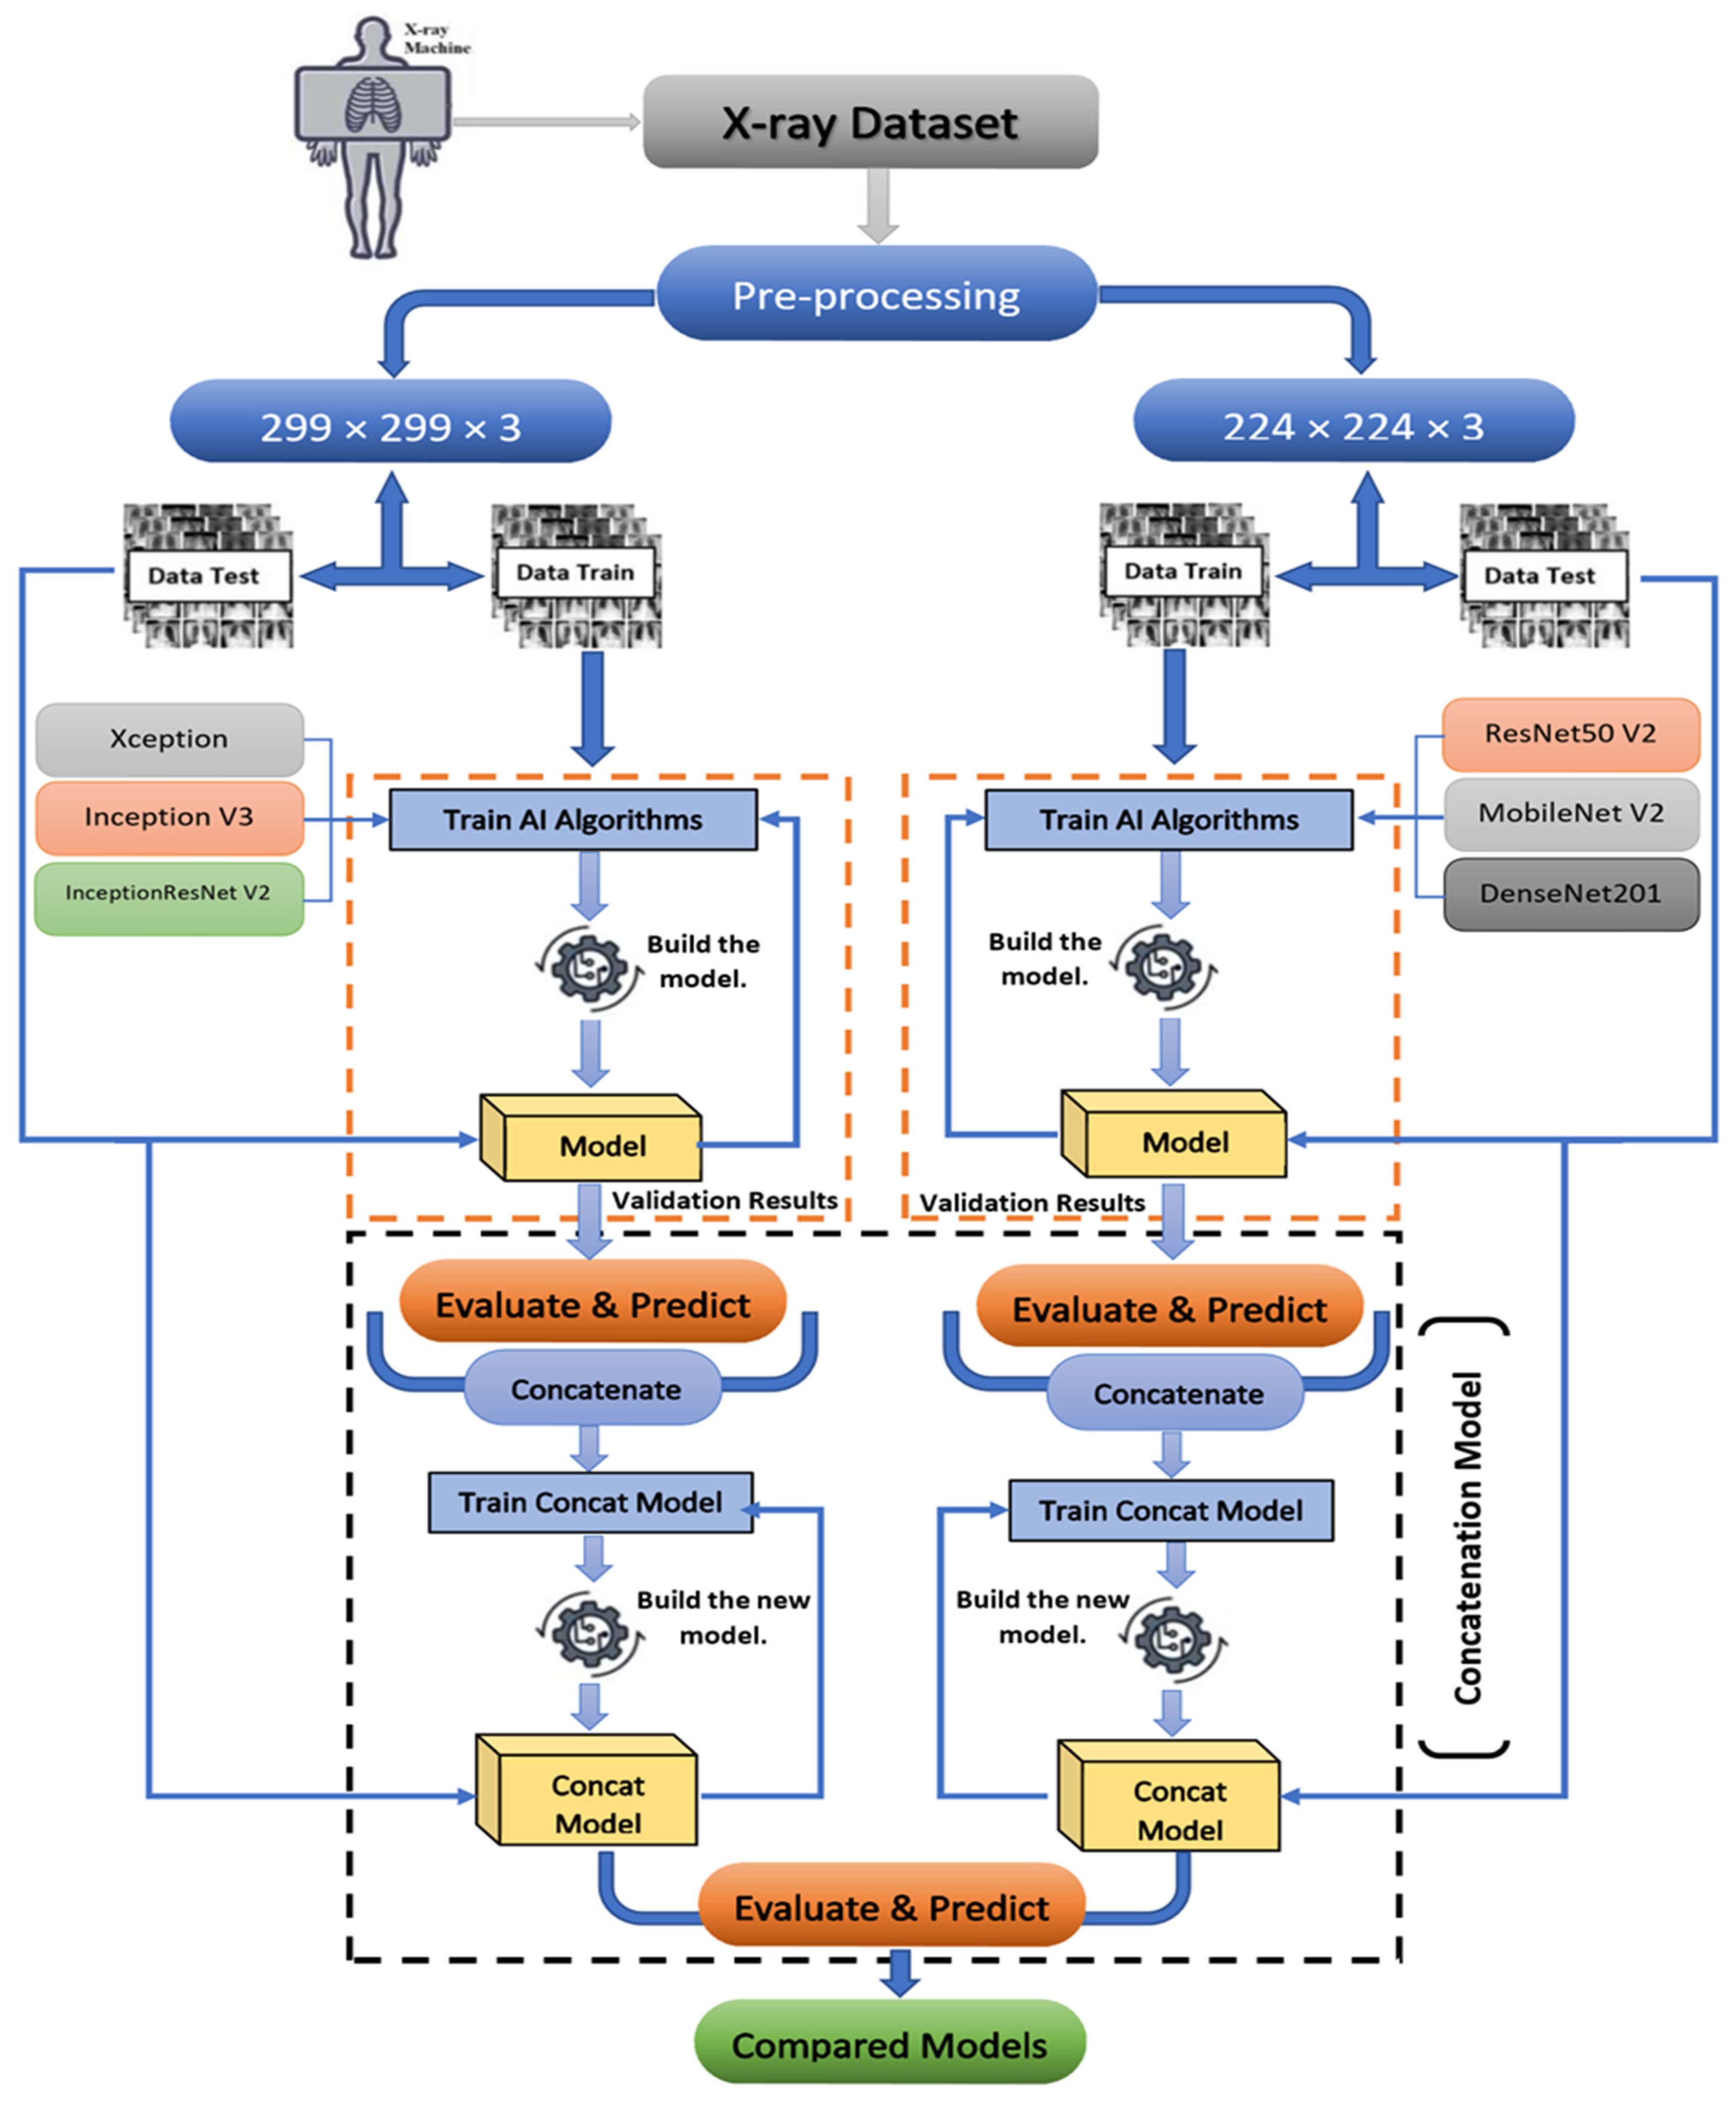
3. Resources and Procedures

3.1. Proposed Method Background

We propose an automated diagnosis system for detecting Coronavirus infected patients based on several TL models (refer to Figure 1). First, we choose six powerful pre-trained models accessible through the Keras library. The training and testing datasets were established using images from chest X-ray from six different databases. The advantage of this dataset is that it allows experimenting the classification with multiple classes. In fact, this dataset contains 4 classes: Normal cases, coronavirus cases, pneumonia cases, and tuberculosis cases. Moreover, the dataset is divided into three sets: a training set, a validation set, and a testing set. The images in the dataset are subjected to several pre-processing procedures. According to the input structure of the network employed, normalization applied to every chest X-ray images to have the same dimension/size. As a result, we acquired two input shapes for building the models, the first of which is 299-by-299 and the second of which is 224-by-224. The final model is generated after two stages of training. The Base Models, which include the well-known models in TL such as Xception, Inception V3, InceptionResNet V2, ResNet50 V2, MobileNet V2, and DenseNet201, are the first training level. These models use the training set as input, along with a default dimension according to each model. Furthermore, we define the parameters of each based TL network (sub-section B). We used a validation set after generating the models to escape over-fitting and under-fitting concerns. The testing set was then utilized to predict different classes.
The prediction-output of initial training level will be used to select the two best models for each category of the input shape. In the second level, the concatenation technique combines the best of these models to improve the performances. Indeed, this technique makes the last prediction via supporting the Base Models’ performance by incorporating features extracted from both models. At the end, the constructed models are saved and the performance of the proposed concatenation models based on the TL technique is assessed. The main phases of building the architecture of coronavirus diagnosis system are depicted in Figure 1. In the next sub-sections, we present the main stages in detail of our proposed diagnosis support system. We start by describing the dataset used for building and testing the CNN models.

3.2. Dataset Description

As previously stated, this research was based on the collection and the examination of six independent datasets of chest X-ray images. We were able to enhance the size of the dataset used in this study by using a variety of datasets. In principle, the prediction performance will be improved because of this. Table 2 lists the datasets that were examined to produce a final-dataset with four categories: Coronavirus, Normal, Viral-Pneumonia, and Tuberculosis.
Following the preparation of our dataset, we divided as follows: 80% for training, 20% for validation, and testing evenly. The images used were of different sizes because they were obtained from a variety of sources. To accomplish this, we scale and normalize all X-ray images to a resolution of 1024 × 1024. The distributions of the dataset photos by classes are shown in Table 3.
In Figure 2, we provide some representative examples of the 4 classes.

3.3. Modified Pre-Trained Models Based on TL Technique

The TL technique [52] is a prominent ML and DL strategy. This strategy allows storing and utilizing the knowledge gained from the solution of one assignment task while working on another and then applying that knowledge to a different challenge. Typically, when utilizing TL, we exploit pre-trained models in another specific context. However, training these models on a huge database takes a long time. This concern can be solved utilizing parameter-based TL approaches that use the weights of a pre-trained network and fine-tune them for a new domain. In this work before the design of the two concatenation-based models, we modified first the original pre-trained models by adding some additional layers. Unfortunately, because the pre-trained CNN models were built on natural images, the global resulting trainable parameters and execution time were increased. But this is the cost to pay to reach the enhanced prediction accuracy.

3.3.1. Modified Xception Based Model

The Xception [53] is a CNN Model developed in 2017. It was trained on the ImageNet Dataset with 71 layers. This model uses 299-by-299 size of image input. Table 4 presents the architecture features of the proposed modified Xception model based on TL.
This architecture contains a total of 49,832,236 parameters, 49,777,708 of which are trainable and 54,528 are non-trainable.

3.3.2. Modified Inception V3 Based Model

The Inception network [54] is a CNN model that contains three versions in Keras library, Inception V1, Inception V2, and Inception V3. In this work, we will use the Inception V3 Model created developed in 2016. This model uses Inception V2 architecture as a base model. It was also trained based on ImageNet with a depth of 159. The image input size used in the Inception V3 model is 299-by-299. The detailed architecture of the modified model based on Inception V3 is shown in Table 5.
The resulting architecture contains 41,336,356 as total parameters, with 4,130,924 trainable and 34,432 non-trainable parameters.

3.3.3. Modified InceptionResNet V2 Based Model

InceptionResNet V2 [55] is a pre-trained CNN model developed in 2017. This model is also trained on the ImageNet database. As a result, the InceptionResNet V2 model achieved an accuracy of 95.3%. Table 6 displays the architecture features of the suggested modified model based on InceptionResNet V2 by adding some layers at the output of the original model.
For this modified model, the total parameters are 73,346,020, of which 73,285,476 are trainable and 60,544 are non-trainable.

3.3.4. Modified ResNet50 V2 Based Model

The ResNet V2 [56] is a CNN architecture that includes three models, which are ResNet152 V2, ResNet101 V2, and ResNet50 V2. These models are based on the ResNet V1 model developed by Microsoft Research Asia in 2016, which uses diverse optimizers for every layer to enhance the accuracy. In this research, the ResNet50 V2 was utilized and achieved 93% accuracy based on the dataset of ImageNet. The details of the modified version depending on ResNet50 V2 are shown in Table 7.
The total parameters of this resulting model are 35,758,340, of which 35,712,900 them trainable and 45,440 are non-trainable.

3.3.5. Modified MobileNet V2 Model

The MobileNet V2 model [57] is a CNN network including 53 layers and 88 depths. A million images from the ImageNet-database were used for training in 2018. This model achieved a 90.1% accuracy for this dataset. Table 8 shows the complexity of our proposed modified architecture model.
The modified MobileNet V2 architecture contains 13,930,680 total parameters, of which 13,896,568 are trainable and 34,112 are non-trainable parameters.

3.3.6. Modified DenseNet201 Based Model

The DenseNet is a DL model used in the classification of images. In this paper, we will use the new version for this model named DenseNet201 [58]. The architecture of this version contains 201 layers as indicated by the name. Furthermore, the accuracy of this model is 93.6% for the images in ImageNet Database. The architecture details of the proposed modified model based on DenseNet201 are presented in Table 9.
The last modified pre-trained model consists of 30,384,452 total parameters. In this architecture, 30,155,396 parameters are trainable and 229,052 are non-trainable.

3.3.7. Summary of the Modified Pre-Trained Models

Table 10 shows the summarized parameters of all modified CNN-based models.

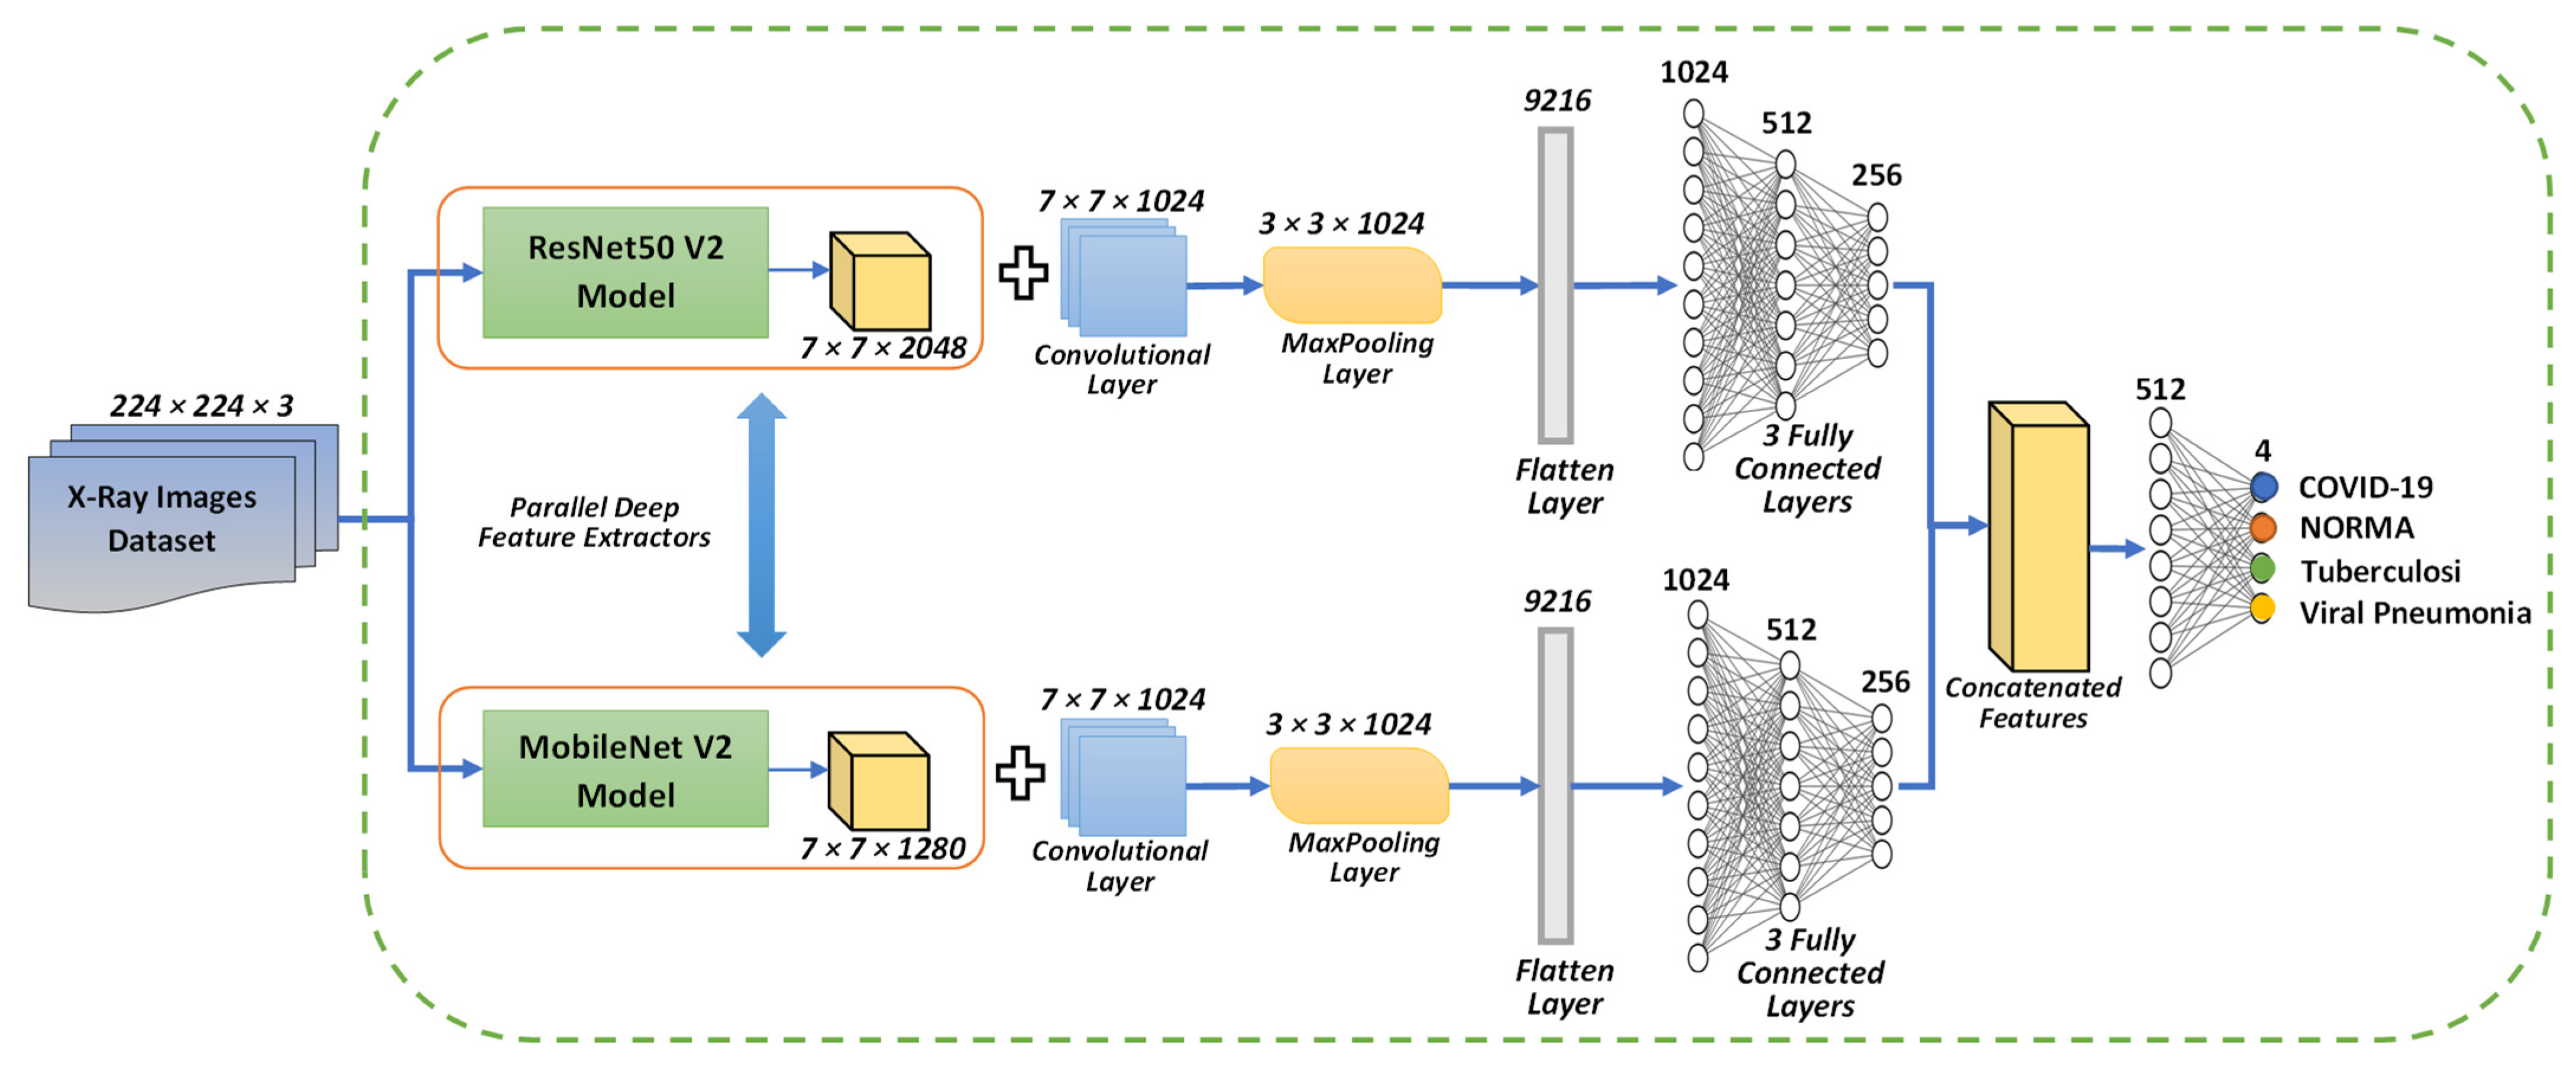
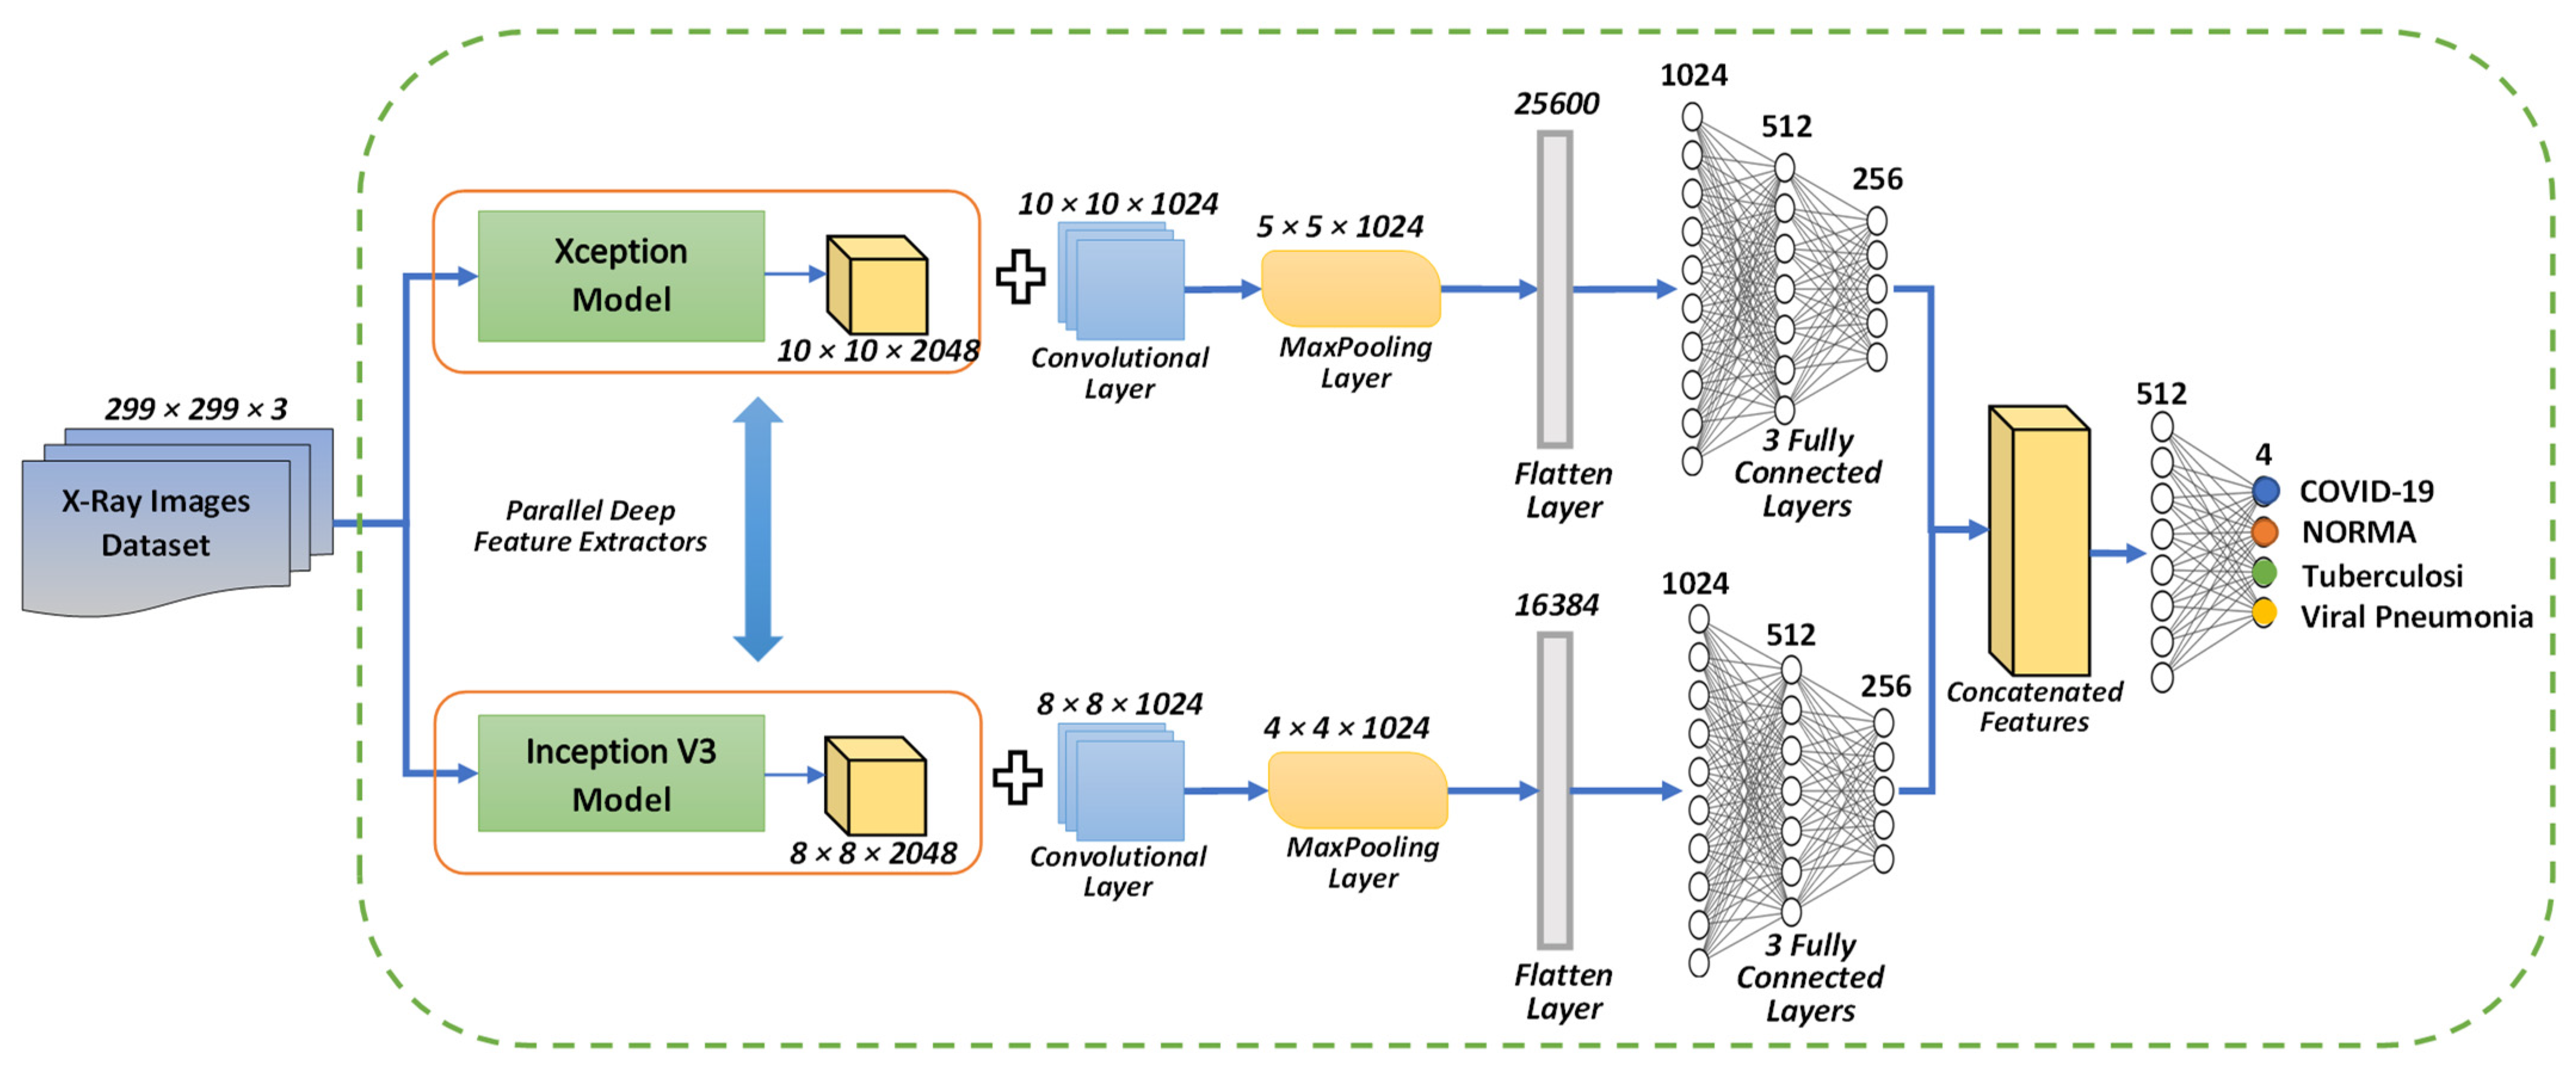
3.4. Proposed Concatenation Model Based on TL Technique

The first phase of any developed model involves of features extraction from the input-data. An efficient feature extraction approach will improve the accuracy of learned models. By reducing unnecessary data, this interesting phase of the general framework development decreases the dimensionality of data. In this study, we apply a parallel deep feature extraction [59] approach based on TL models in the feature extraction phase of our concatenation-based models.

3.4.1. Concatenation Model Based on the Modified Resnet50 V2 and MobileNet V2 Models

We developed our proposed concatenation model with the default input shape of 224-by-224 using two modified pre-trained TL models, ResNet50 V2 and MobileNet V2, with the same default input shape. This model architecture is shown Figure 3. On the other hand, Table 11 describes the parameters for each layer in this architecture, to clarify our proposed model.
The architecture of the first proposed Concatenation model based on the modified ResNet50 V2 and MobileNet V2 models contains 49,423,428 as total parameters 49,343,876 of which are trainable and 79,552 are non-trainable.

3.4.2. Concatenation Model Based on the Modified Xception and Inception V3 Models

Two modified pre-trained TL based models were used; these models are Xception and Inception V3, with the same default input shape to develop our proposed concatenation model with the default input shape of 299-by-299. The model architecture is depicted in Figure 4. Table 12, on the other hand, details the parameters for each layer in this architecture to better understand and interpret our suggested model.
The second proposed concatenation model based on the modified Xception and Inception V3 models contains 91,168,588 total parameters, 91,079,628 of which are trainable parameters and 88,962 are non-trainable parameters.

4. Results and Discussion

Before we discuss the obtained results, we first go through some basic performance evaluation methodologies commonly utilized to assess the models of ML during the stages of training and testing. We begin by calculating some evaluation metrics and drawing the confusion matrix to assess the classification that has been obtained by the models. The metrics and experimental findings acquired by the examined models are presented in this section.

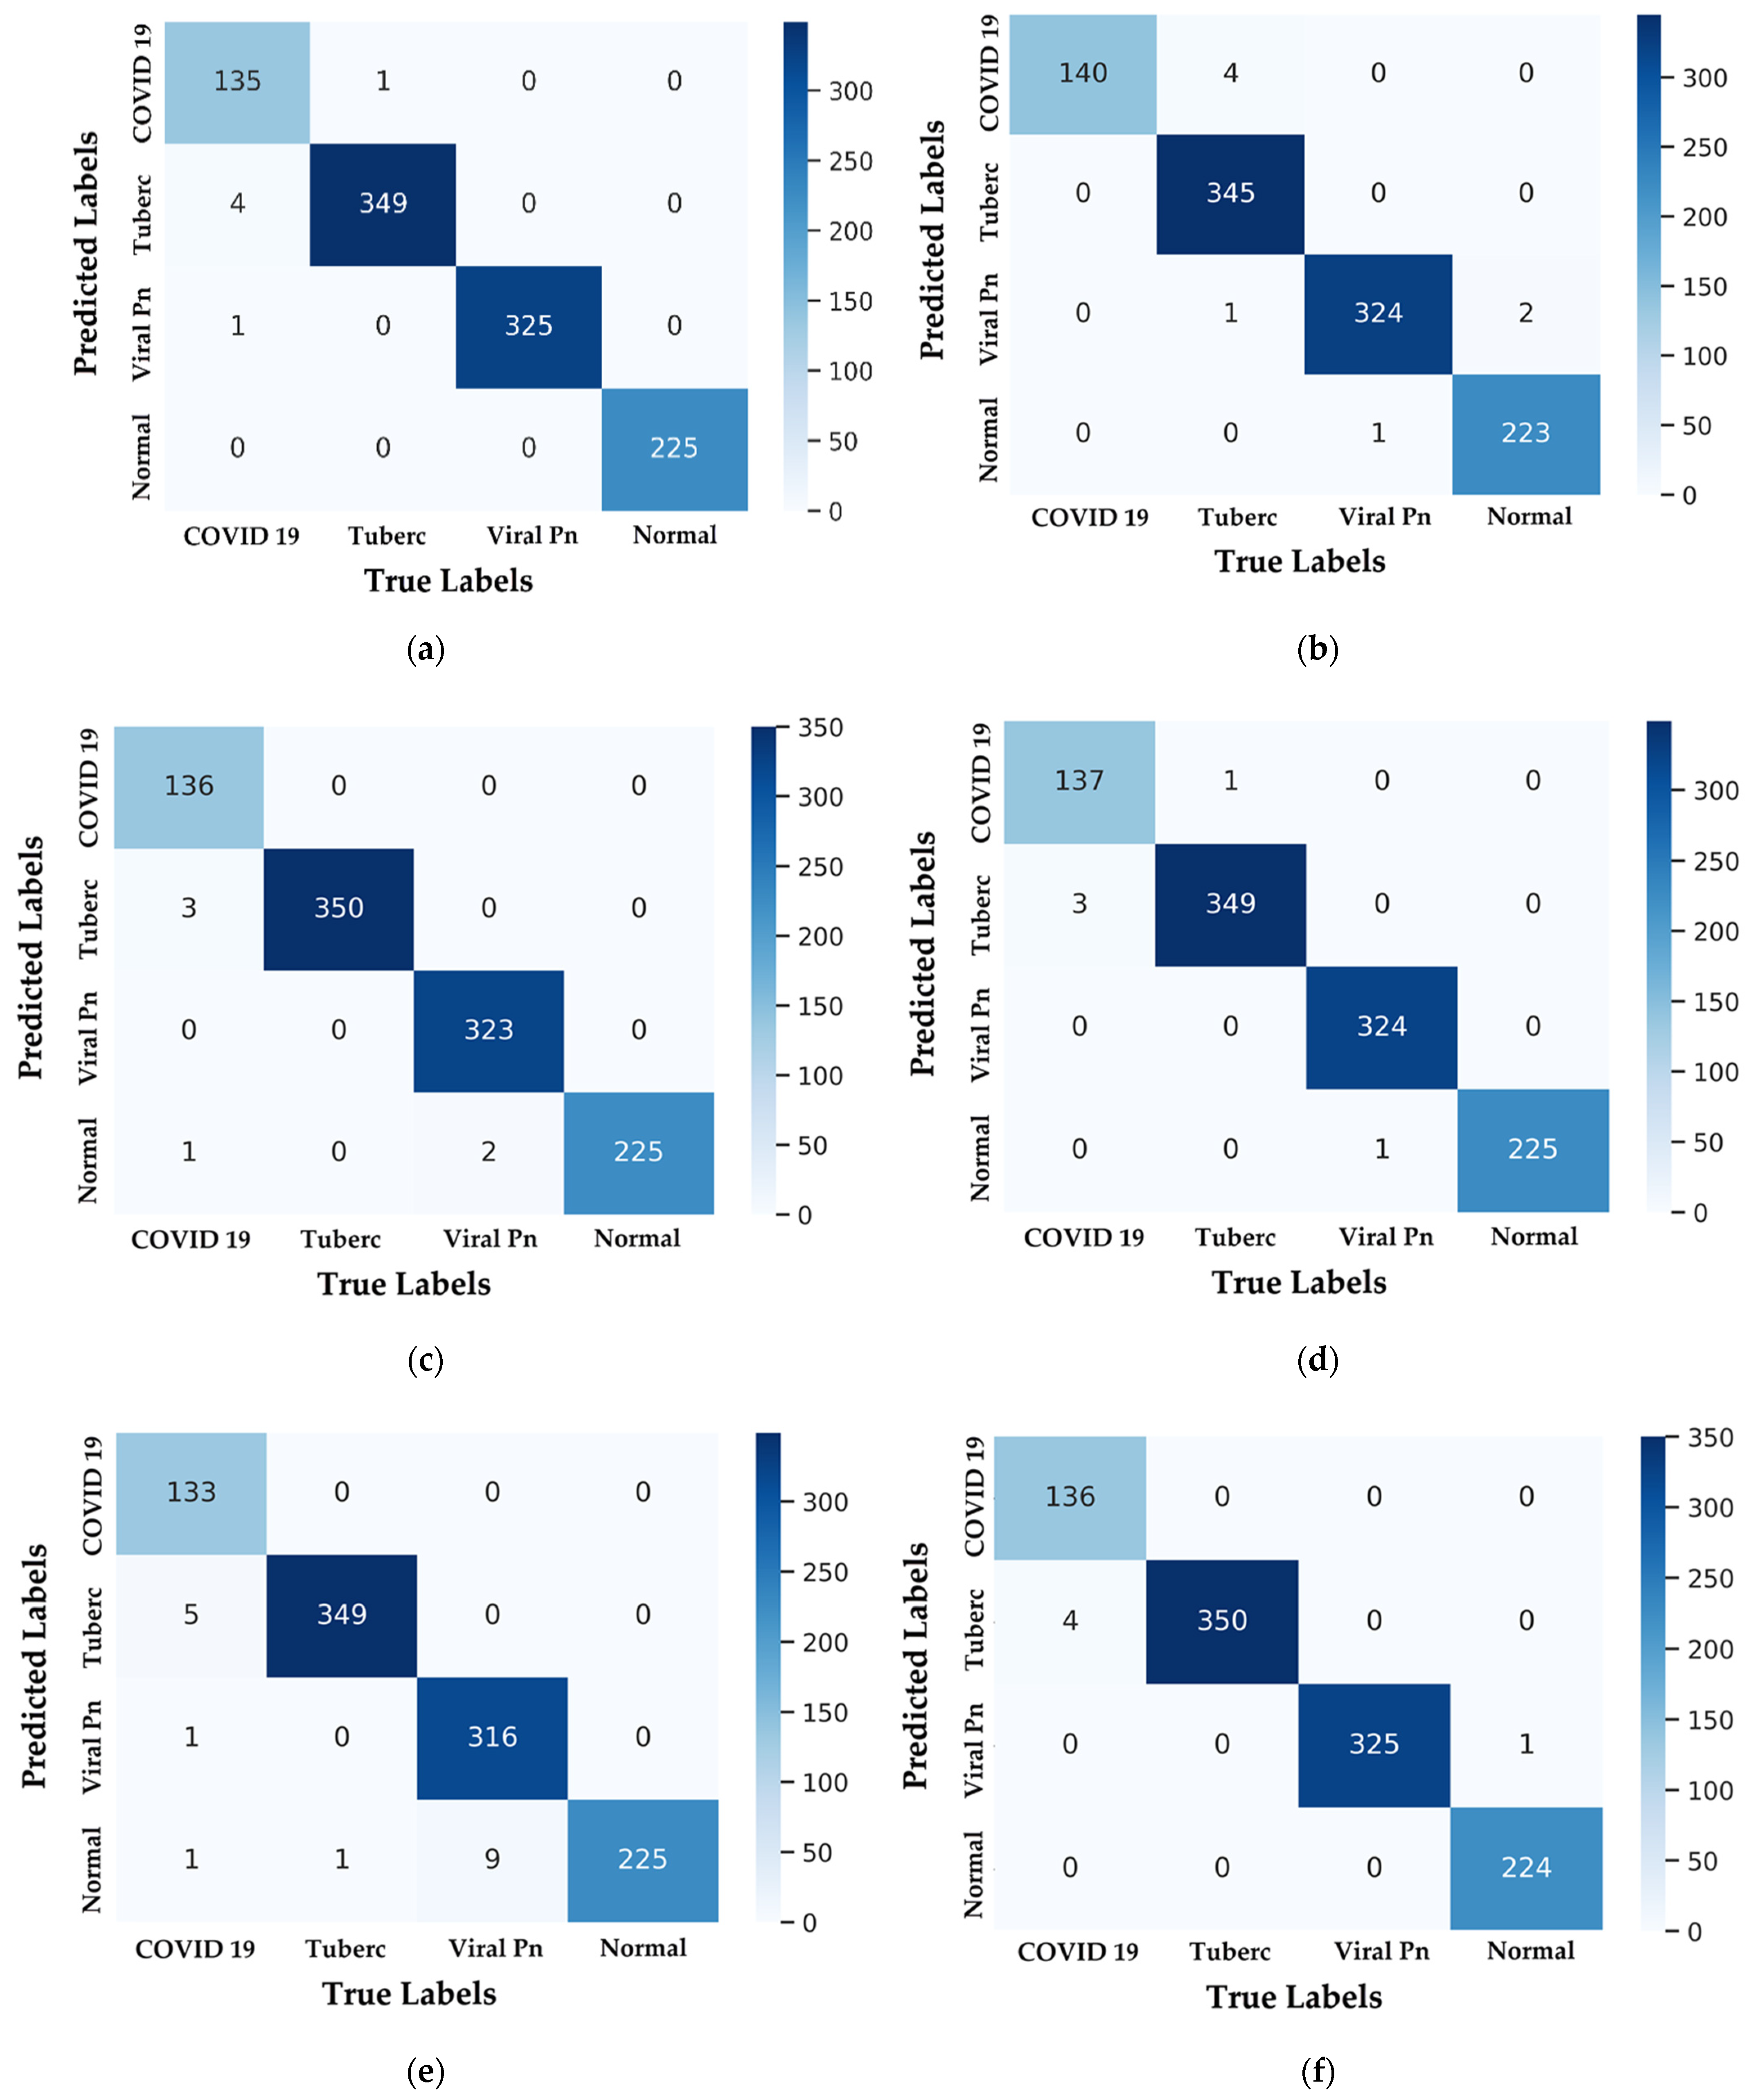
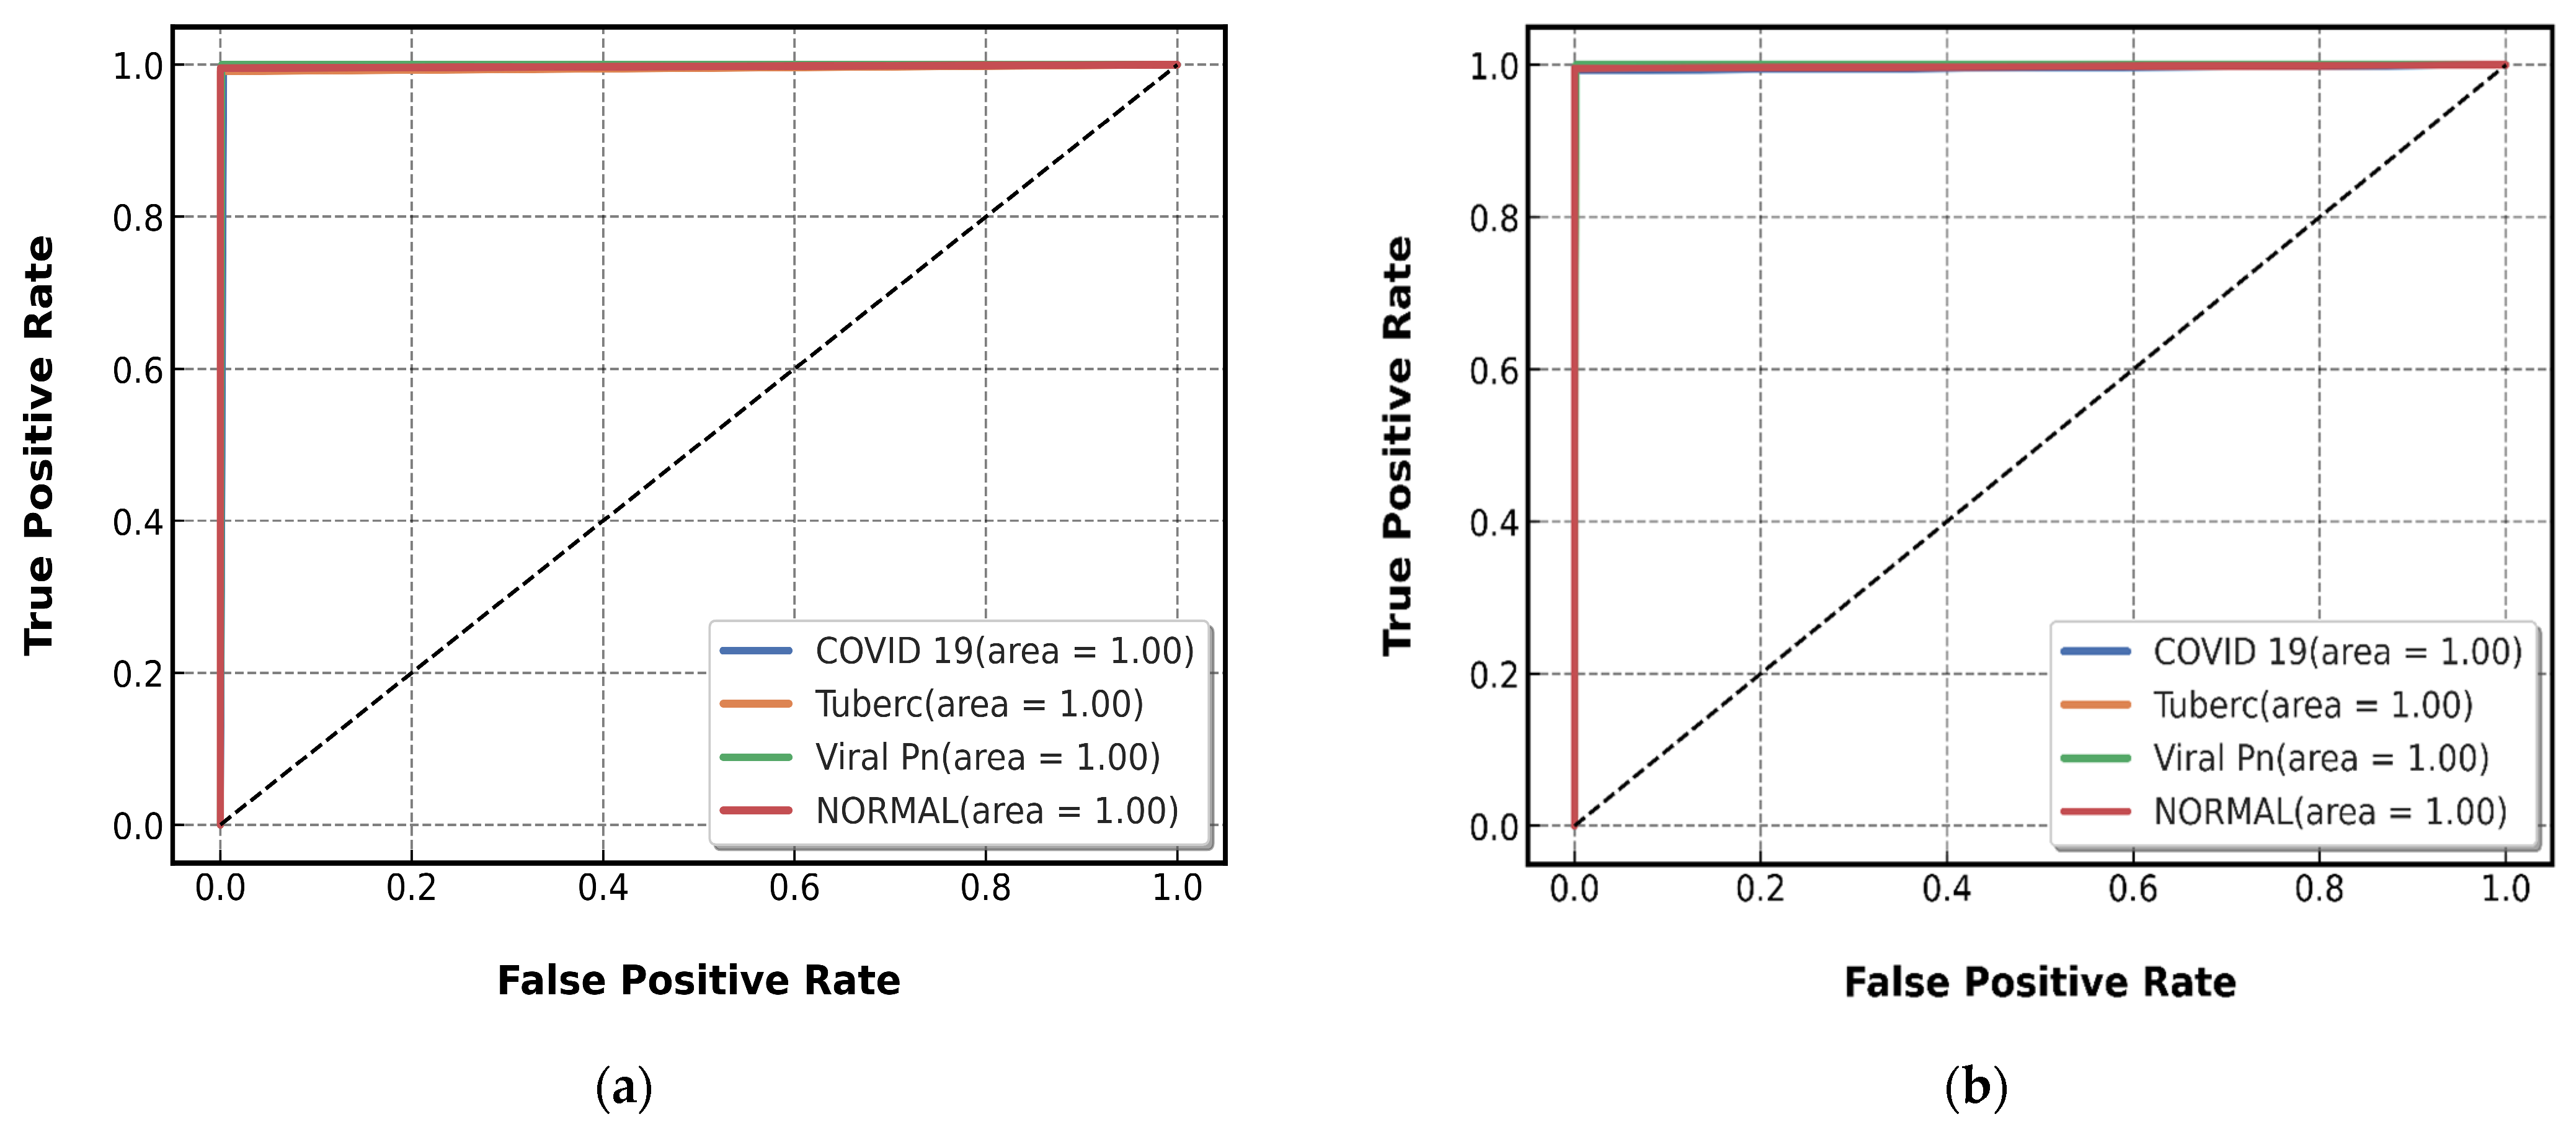
4.1. Confusion-Matrix and Metrics for Performance Evaluation

A confusion matrix presents the actual and predicted values. This table is utilized to categorize the predictions achieved by the classifiers. Each row of the confusion matrix’s dimension contains the same set of classes. By calculating four elements, it is possible to check the confusion between the various classes. These elements are True-Positive (TP), False-Positive (FP), True-Negative (TN), and False-Negative (FN). The following equations give the confusion elements for each class ClassX:
T P ClassX = C i , i
F N ClassX = l = 1 4 C i , l T P ClassX
F P ClassX = l = 1 4 C l , i T P ClassX
T N ClassX = l = 1 4 k = 1 4 C l , k ( F P ClassX + F N ClassX + T P ClassX )
where:
  • The sample number successfully classified for a given class is denoted by the letter C i , i .
  • The samples number of negatives that are mistakenly classified for another class is given by C i , l .
  • The samples number of positives that are mistakenly classified for another class is denoted by the letter C l ,   i .
  • The total of all samples is C l , k .
The following are the five scoring metrics employed in this study. These metrics are denoted by Equations (5)–(9) as follows:
A c c u r a c y = T P + T N T P + T N + F P + F N
P r e c i s i o n = T P T P + F P
S e n s i v i t y = T P T P + F N
S p e c i f i c i t y = T N T N + F P
N P V = T N T N + F N

4.2. Experimental Results

The core experimental data from this research are presented in this subsection. First, we plot the accuracy and loss curves for all the models employed to display the training results. The confusion matrix is then drawn for each model.

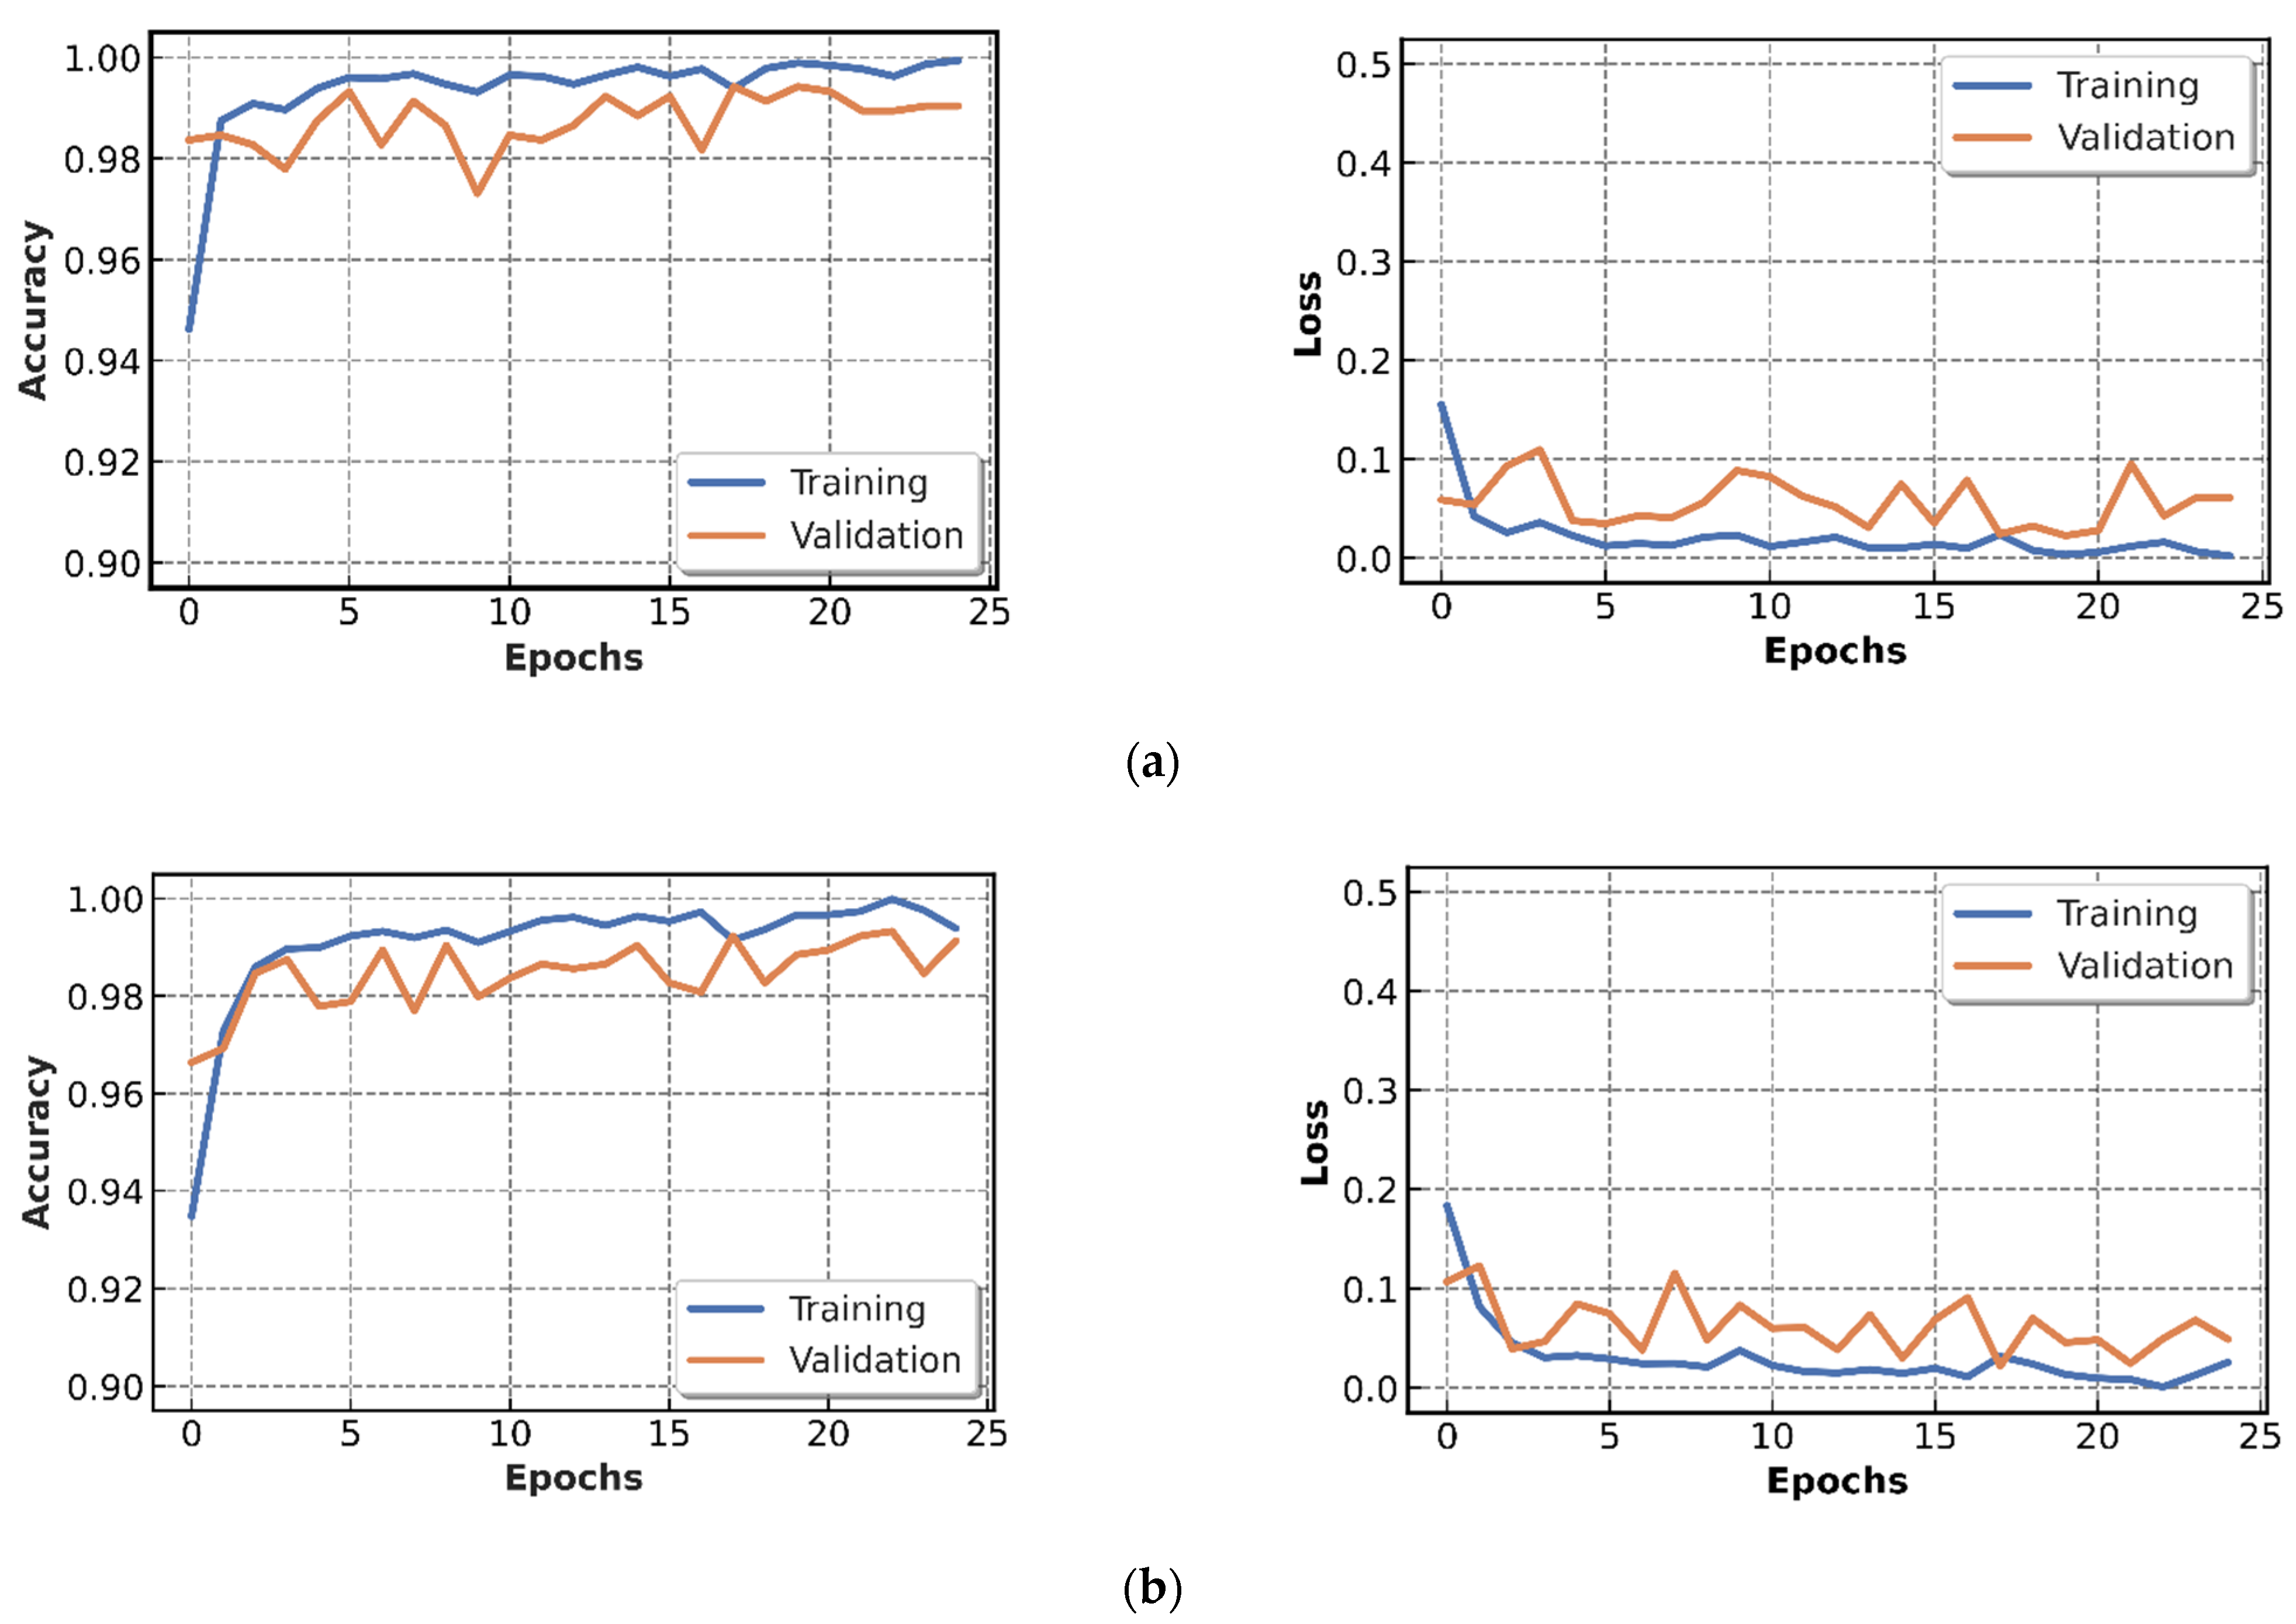
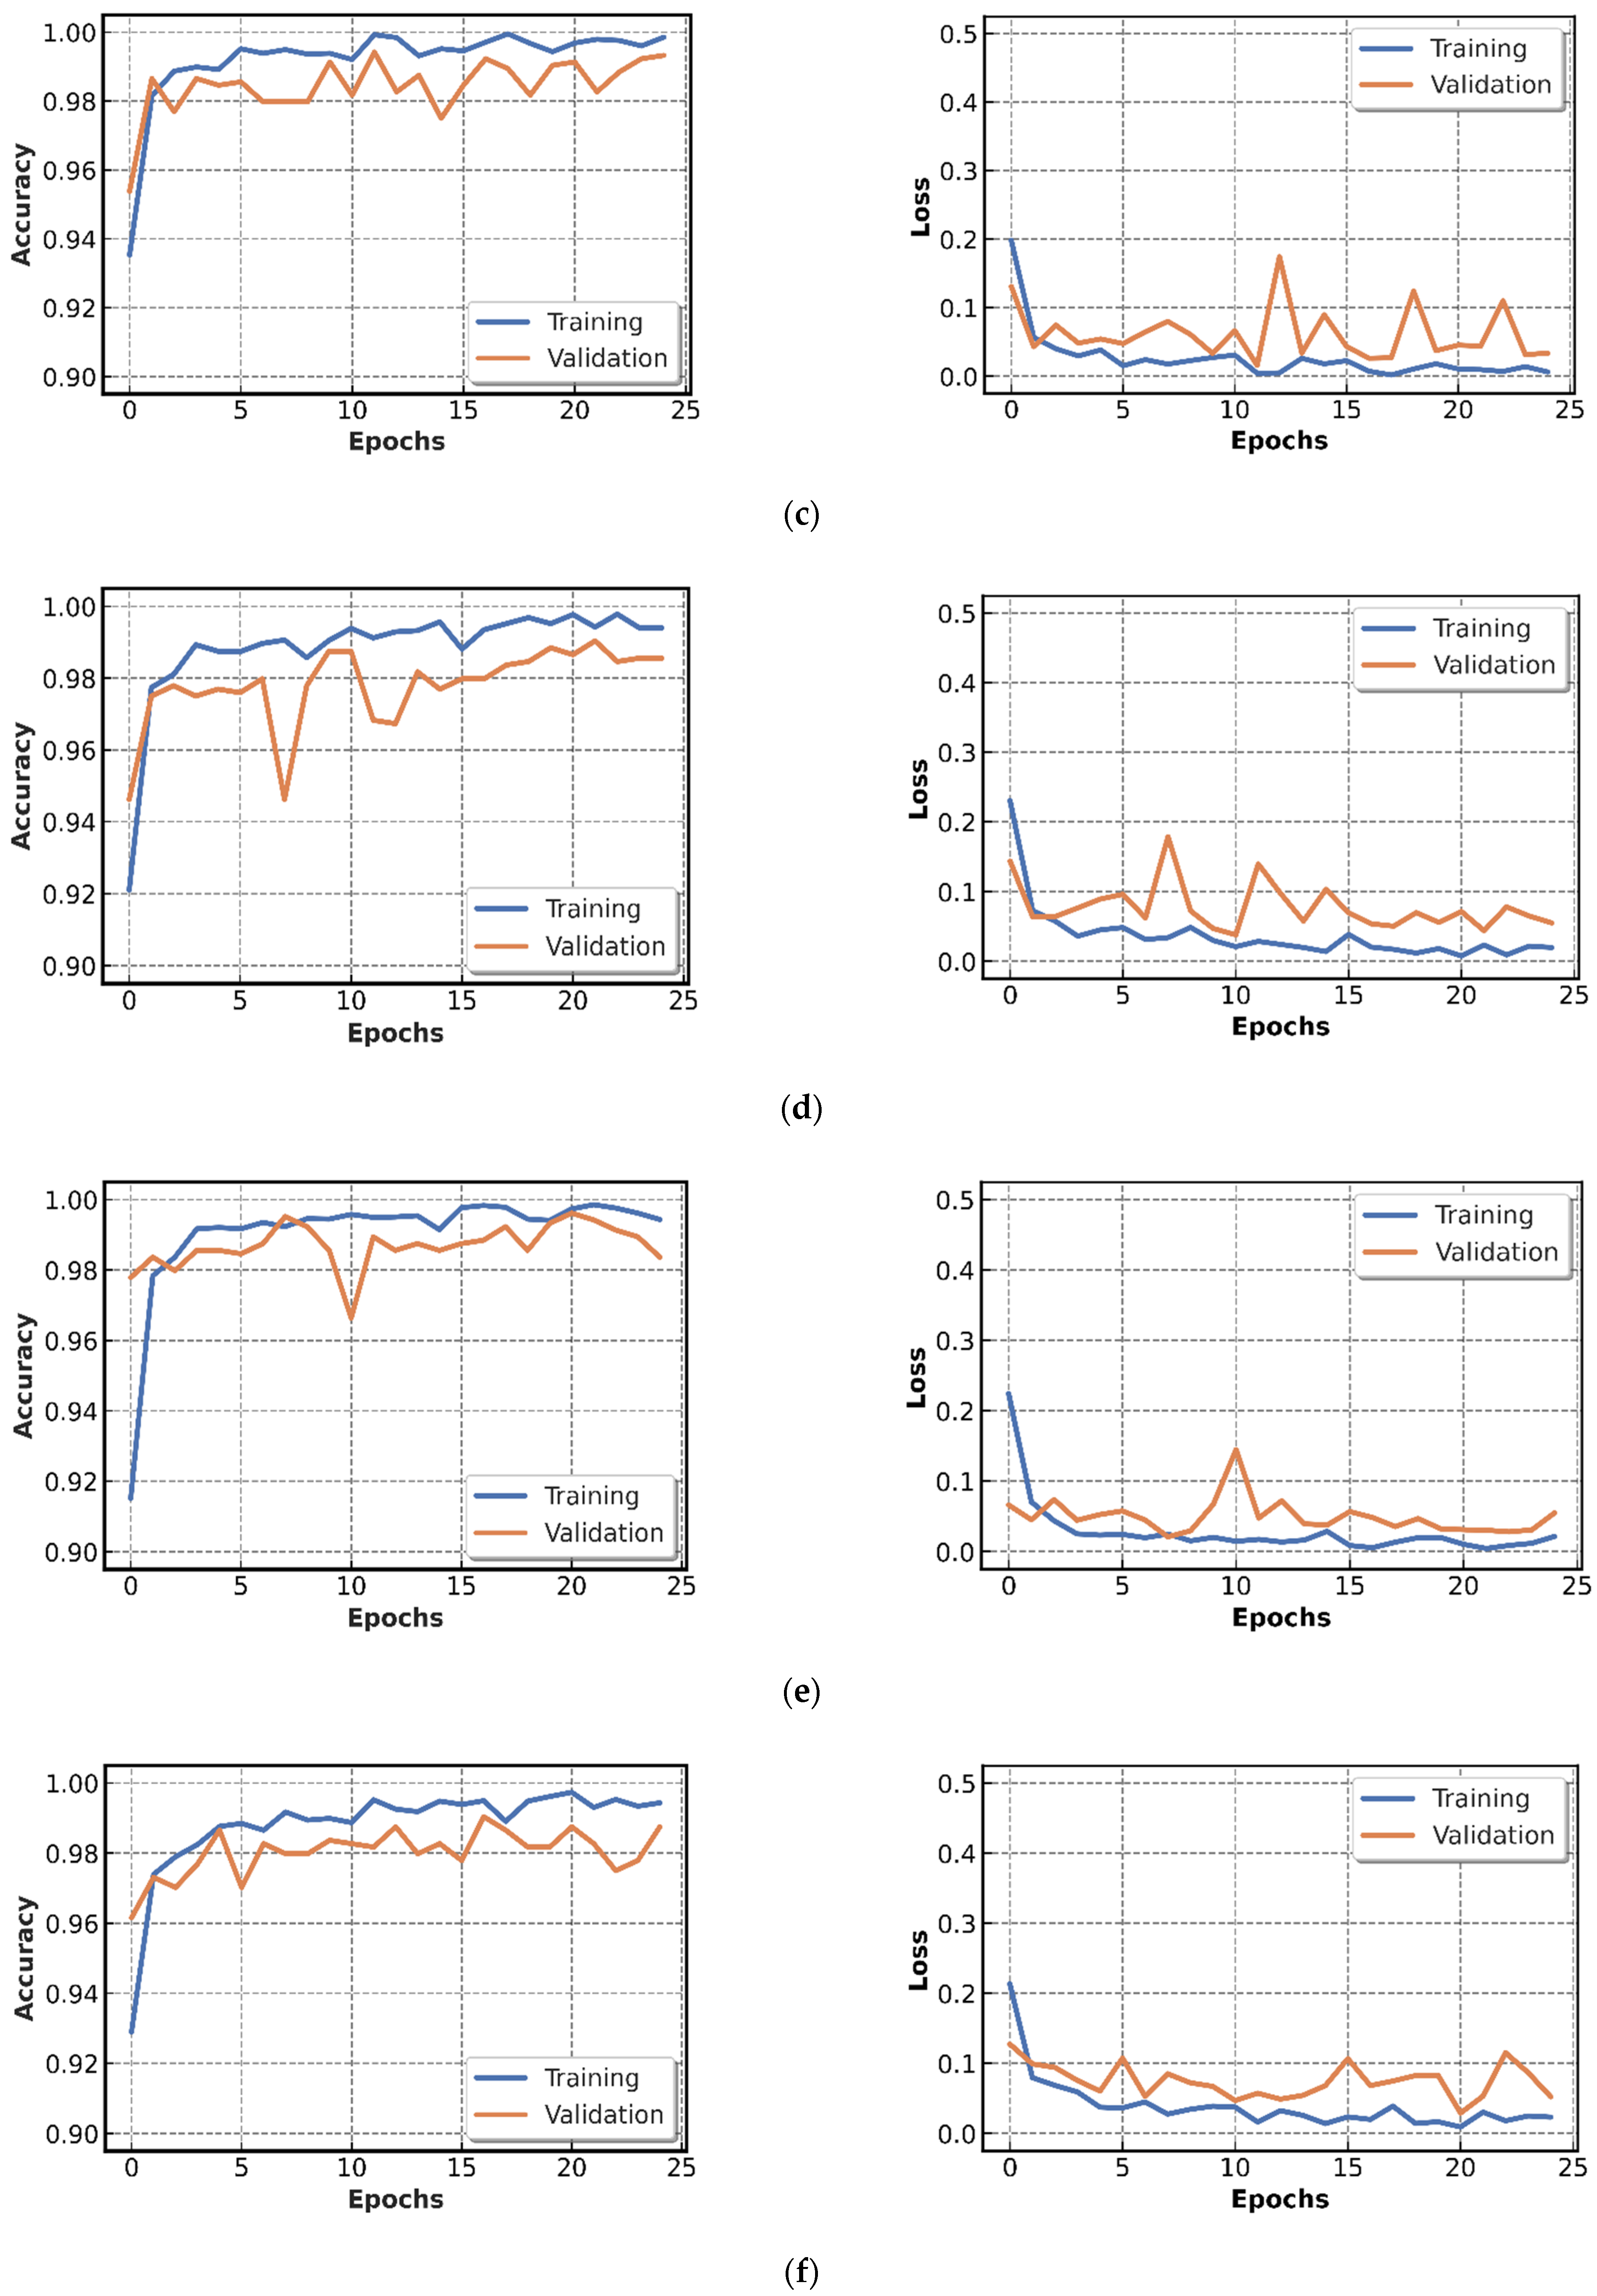
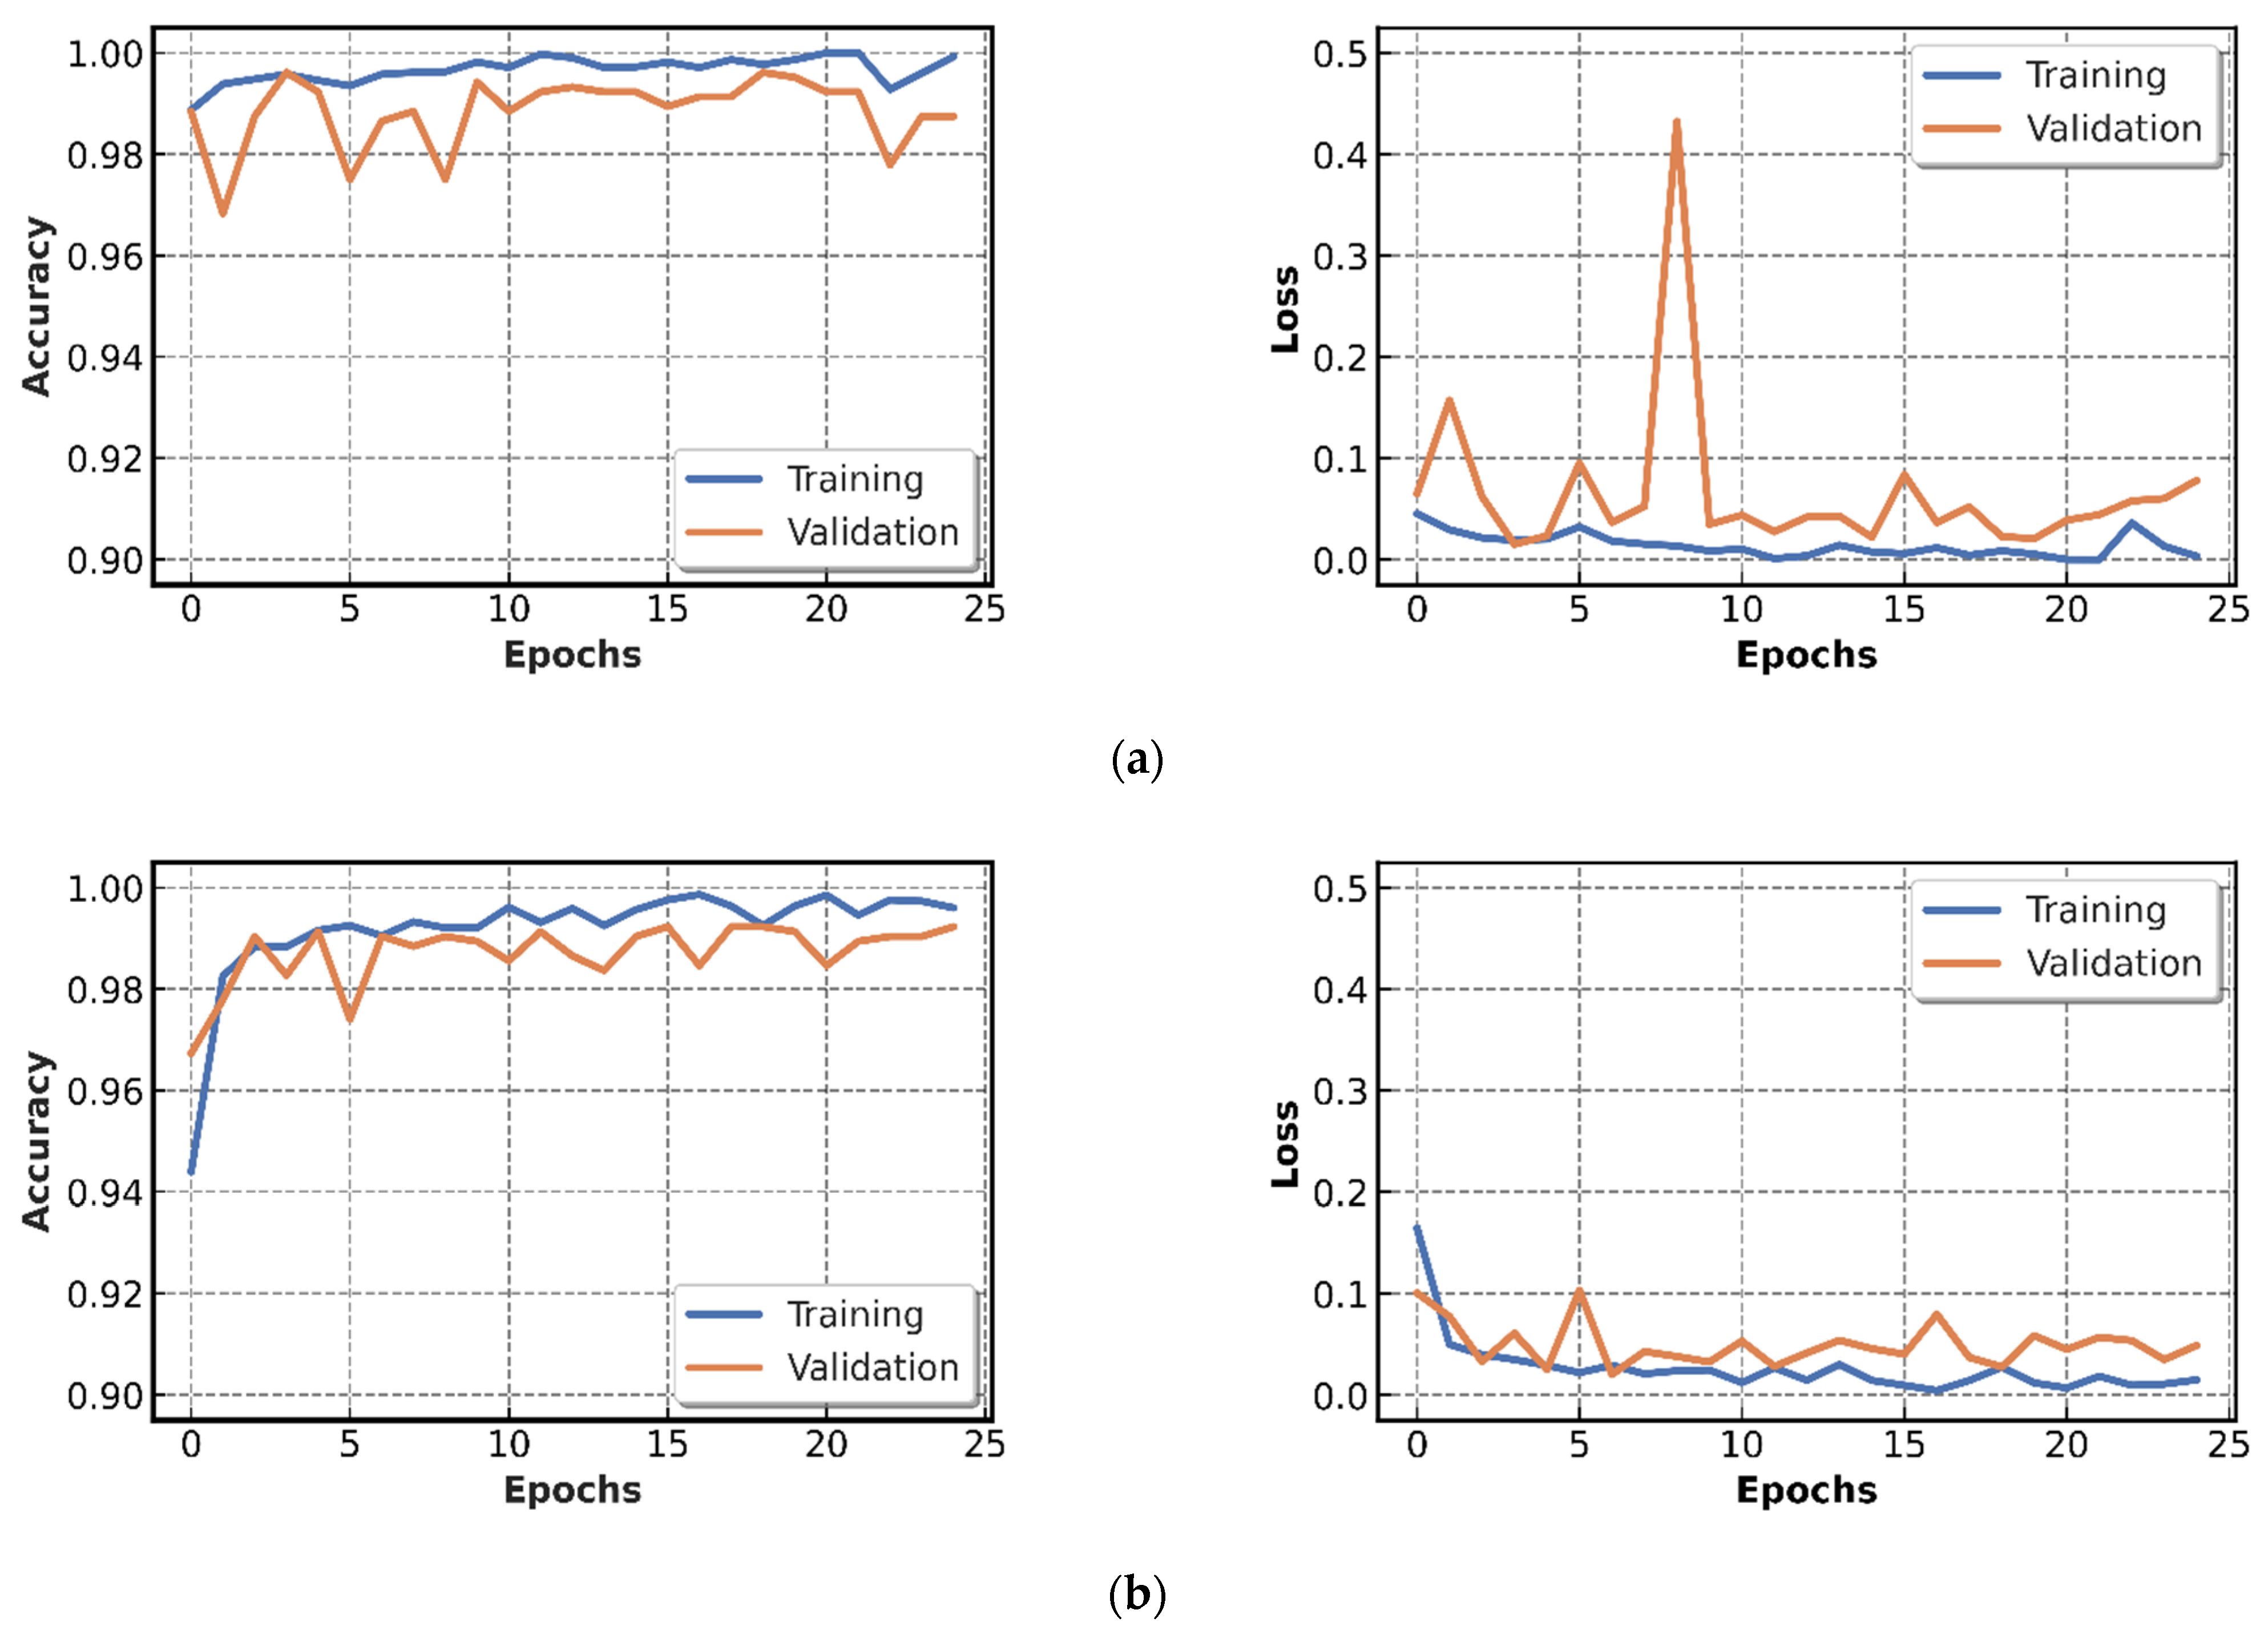
4.2.1. Results of CNN Models Training

Tensorflow 2.1 library was used to get the original pertained models and apply the proposed modified-based models depending on the TL technique. Python standard package of API was utilized. The default Keras implementation is used to create models. To combine the model’s performances, we built the concatenation method in Python and utilized the Jupyter Library to evaluate the results quickly. Furthermore, we trained the modified TL models and our suggested concatenation models based on the TL approach using the open Google Colab platform—a cloud service provided by Google called Colab that uses Jupyter Notebook to train and research ML and DL algorithms. This platform had a Tesla K80 GPU with 12 GB of GDDR5 VRAM, an Intel Xeon Processor with two cores running at 2.20 GHz, and 13 GB of RAM. We utilized the Adam optimizer and the cross-entropy loss function to train all the algorithms we used. The input images sizes for all arrays are determined by the network’s input structure. Table 13 illustrates the hyper-parameters utilized to tweak the modified models and our proposed concatenation models employed in this article.
To ensure similar findings, we trained all modified pre-trained models: Xception, Inception V3, InceptionResNet V2, ResNet50 V2, MobileNet V2, and DenseNet201 across 25 epochs with the same configuration. The plots for our chest X-ray datasets training and validation sets are shown. To achieve this, the accuracy and loss functions of the six classifiers tested are plotted in Figure 5.
The x-axis epochs denote curves, while the y-axis reflects improvement. The training curve illustrates how well a model is trained. It is calculated using the training data. In fact, all the models were sufficient to converge only in 25 epochs. For a given range of hyper-parameter values, the validation curve indicated whether the model was under-fitting, overfitting, or just right. Furthermore, all the models had a low degree of overfitting. Consequently, the accuracy convergence on the training-set is quite near to the accuracy convergence on the validation set. We deduced from these curves that throughout the validation phase, all the models achieved a 99% accuracy. However, for the second category of the input form 224-by-224, the ResNet50 V2 and DenseNet201 models attained a high accuracy rating of 99.51%. In addition, the first category, 299-by-299, has a high accuracy value of 99.42% for the Xception, as well as InceptionResNet V2 models. Moreover, 0.02% is the average loss value for the loss curves for all these models.
To understand the concatenation models we have proposed in this study, the accuracy and loss functions for these models will be plotted, as shown in Figure 6.
The first system, which was based on the concatenation of two modified pre-trained models: ResNet50 V2 and MobileNet V2, was particularly accurate, with 99.71% accuracy. The second system, which is based on the concatenation of two modified pre-trained models: Xception and Inception V3, attained a 99.80% accuracy rate.

4.2.2. Testing of CNN Models Results

The performance of the investigated models is tested and evaluated using a previously produced entirely independent data subset. We begin by creating a confusion matrix. Figure 7 depicts the confusion matrix of the six modified pre-trained models.
According to these tables, it can be seen that many models provide good classifications. Some models, on the other hand, are causing certain confusion about the coronavirus class and tuberculosis. Nevertheless, most models perform perfectly in all four classes. Besides, we move to the 2nd training level by integrating the model’s classification based on these results. The confusion matrix of the created model’s categorization utilizing the concatenation technique based on the modified pre-trained models is shown in Figure 8. This matrix visualizes the performance of generated models. Based on the results, it is obvious that the True Positive is higher than the False Positive and False Negative in all classes based on this classification. Furthermore, as compared to the Coronavirus Class, the FP and FN of 3 classes Normal, Viral Pneumonia and Tuberculosis, are bigger. Moreover, the concatenation Model Based on two Modified Model ResNet50 V2 and MobileNet V2, as well as the concatenation Model Based on two modified models Xception and Inception V3, has successfully classified all cases for the four classes, with only 4 and 2 cases classified as an error class, respectively. We used the confusion matrices data to create the evaluation metrics for each model to explain these experimental outcomes.
To study these findings, an ROC curve illustrating the sensitivity vs. specificity of a diagnostic test might be employed. In general, this type of curve helps in evaluating multiple models based on the AUC variable value. This value represents the whole area under the ROC curve between two dimensions. This article depicts that, for each modeal, ROC curve was used in this investigation. Figure 9 depicts the False Positive Rate (TPR) vs. True Positive Rate (TNR) in the adjusted pre-trained models for the various classes. Figure 10 depicts a plot of TPR vs. TNR for the various classes in our suggested concatenation models.
Based on ROC curves, it can be seen that all the models tested had an AUC of 0.99. It is obvious that our proposed models, which are based on concatenation, are the best models for classifying the X-ray image classes employed in this research. Furthermore, we discovered that all the classes have an area rate of 0.99–1. As a result, our proposed generated models based on the concatenation technique outperform the other models. In fact, for the Coronavirus class, the proposed concatenation models achieved an AUC value of 1.00, which is a significant clinical benefit.
This means that Coronavirus instances are nearly never labeled to other classes, lowering the likelihood of COVID cases being missed on chest X-rays. Table 14 presents the performance evaluation indicators of the modified pre-trained models and our proposed concatenation models to help elucidate these findings.
We can see from this table that most models have a loss in the range of 0.02–0.03, except for the modified pre-trained MobileNet V2 model, which has a loss of 0.05. Our proposed concatenation models, on the other hand, have a loss of 0.015–0.005 respectively, for the two proposed models based on ResNet50 V2, MobileNet V2, as well as Xception and Inception V3. Furthermore, our proposed concatenation models achieve the largest value for all computed performance metrics. However, for the accuracy metric, all the models have a 99% accuracy rate, except for the MobileNet V2 model (98.36%). The ResNet50 V2 and DenseNet201 models, on the other hand, achieve a high accuracy rating of 99.51% for the second category of the input form 224-by-224. Furthermore, for the Xception and InceptionResNet V2 models, the first category, 299-by-299, has a high accuracy rating of 99.42%. However, the generated models: the concatenation model based on ResNet50 V2, MobileNet V2, and the model based on Xception, Inception V3, reach an accuracy of 99.13% and 99.23%, respectively.

4.2.3. The Execution Time Results

Execution time is a significant parameter for proficiency and dependability of system improvement. The approximate training phase change time from one model to the next is shown in Table 15. This because of the enormous number of parameters in every model. Furthermore, when the parameters number increase for the model, the required time increased needed for training. It does not matter if it’s for runtime or the amount of time needed for every epoch.

4.3. Discussion

A novel coronavirus diagnosis system based on concatenation approach TL models, and modified pre-trained TL models is suggested in this research. The goal is to develop the optimal diagnostic algorithm for coronavirus infected patients. Furthermore, the model was created using the following six TL networks: Xception, Inception V3, InceptionResNet V2, ResNet50 V2, MobileNet V2, and DenseNet201 These algorithms were trained and validated using a collection of X-ray pictures generated by six separate databases. This dataset has four classes: (i) normal, (ii) tuberculosis, (iii) pneumonia, and (iv) Coronavirus. In reality, we discovered in the experimental findings section that, all of the analyzed models achieve a 99% of accuracy which is very high. Besides, the majority of models have a loss value of less than 2%. Figure 11 shows a graphic that summarizes all of the experimental findings presented in this research.
Figure 11 depicts the relationship between, one hand a loss and on the other hand 3 scoring metrics which are (i) accuracy, (ii) precision, and (iii) sensitivity. The value of the 3 measures reduces as the loss value increases. All the models utilized in this study, including the created proposed models, had good specificity and NPV values. In general, the proposed diagnostic systems outperformed earlier research, especially the first system, which was based on the concatenation of two modified pre-trained models: ResNet50 V2 and MobileNet V2, achieved a 99.71% accuracy. The second system, was based on concatenation between two modified pre-trained models: Xception and Inception V3 achieved a value of accuracy of 99.80%. Table 16 shows a comparison of our proposed system with the other efforts discussed in the literature.
Although the results obtained in this research are satisfactory, we encountered many technical limitations:
  • Due to the lack of coronavirus images in comparison to the other diseases, six publicly available datasets were considered to construct a relatively equilibrated dataset. The enrichment of our COVID-19 images cases would ameliorate the proposed system accuracy.
  • Despite the concatenation of pre-trained models contributing to the enhancement of the prediction accuracy, the computational complexity in terms of execution time increased considerably. This is an expected trade-off for enhanced accuracy, but the usage of parameter optimization in future work will ameliorate our results not only in terms of accuracy but also in terms of execution time.

5. Conclusions and Perspectives

The coronavirus pandemic outbreak affects the healthcare facilities and makes it difficult to provide effective care without the risk of infections. The core contribution of this research is a proposal of a Coronavirus diagnosis system based on concatenation technique and TL technique. Indeed, the Coronavirus diagnosis system is employing six different transfer-learning techniques. Moreover, the aim was to enhance coronavirus recognition accuracy by developing a novel diagnostic model that integrates the performance of TL algorithms by employing a concatenation approach. This allows for more consistent predictions and enhances the learning model. In this research, the best-tested DL models have been selected from the recent literature of image-classification algorithms. Moreover, we have developed a new modified pre-trained model based on basic TL models, such as Xception, Inception V3, InceptionResNet V2, ResNet50 V2, MobileNet V2, and finally DenseNet201. Indeed, we used two prediction levels according to the input shape using the concatenation technique between two modified pre-trained models. Finally, we have proven that this technique can contribute to improving the performance of basic TL models, especially since the two generated models achieved a high accuracy compared to the six basic TL models studied.
The proposed architecture will be used to detect other chest illnesses and diseases in the future, such as cancer [60], Parkinson [61,62], heart diseases [63], cystic fibrosis [64], and chronic obstructive pulmonary disease (COPD) [65]. On the other hand, we propose to employ Artificial Intelligence of Things (AIoT) to improve the resilience and accuracy of our system for detecting epidemic or dangerous diseases. [66,67,68]. This area or this new method is known as AIoT, and it mixes artificial intelligence (AI) technologies and Internet of Things (IoT) infrastructure. In reality, IoT adds to IA connectivity and data interchange, while IA contributes to the ML capabilities of devices.

Author Contributions

Conceptualization, O.E.G., S.H. and B.C.; methodology, O.E.G., S.H., B.C., M.A.-S. and F.S.; software, O.E.G., B.C.; validation, S.H., B.C.; formal analysis, A.R., M.H. and F.S.; investigation, O.E.G.; resources, S.H.; data curation, O.E.G., S.H.; writing—original draft preparation, O.E.G., B.C., M.A.-S., A.R. and F.S.; writing—review and editing, O.E.G., B.C., M.A.-S. and A.R.; visualization, O.E.G.; supervision, A.R., B.C. and M.A.-S.; project administration, B.C., F.S. and M.H.; funding acquisition, F.S., M.A.-S. and M.H. All authors have read and agreed to the published version of the manuscript.

Funding

This research received no external funding.

Data Availability Statement

Acknowledgments

The researchers would like to thank the Deanship of Scientific Research, Qassim University, for funding the publication of this project.

Conflicts of Interest

The authors declare no conflict of interest in the publication of this paper.

References

  1. Astuti, I. Severe Acute Respiratory Syndrome Coronavirus 2 (SARS-CoV-2): An Overview of Viral Structure and Host Response. Diabetes Metab. Syndr. Clin. Res. Rev. 2020, 14, 407–412. [Google Scholar] [CrossRef]
  2. Sohrabi, C.; Alsafi, Z.; O’Neill, N.; Khan, M.; Kerwan, A.; Al-Jabir, A.; Iosifidis, C.; Agha, R. World Health Organization Declares Global Emergency: A Review of the 2019 Novel Coronavirus (COVID-19). Int. J. Surg. 2020, 76, 71–76. [Google Scholar] [CrossRef] [PubMed]
  3. Larsen, J.R.; Martin, M.R.; Martin, J.D.; Kuhn, P.; Hicks, J.B. Modeling the Onset of Symptoms of COVID-19. Front. Public Health 2020, 8, 473. [Google Scholar] [CrossRef]
  4. Vetter, P.; Vu, D.L.; L’Huillier, A.G.; Schibler, M.; Kaiser, L.; Jacquerioz, F. Clinical Features of Covid-19. BMJ 2020, 369, m1470. [Google Scholar] [CrossRef] [PubMed] [Green Version]
  5. On behalf of the COVID-19 Commission of Accademia Nazionale dei Lincei, Rome; Forni, G.; Mantovani, A. COVID-19 Vaccines: Where We Stand and Challenges Ahead. Cell Death Differ. 2021, 28, 626–639. [Google Scholar] [CrossRef] [PubMed]
  6. Mohanty, S.; Rashid, M.H.A.; Mridul, M.; Mohanty, C.; Swayamsiddha, S. Application of Artificial Intelligence in COVID-19 Drug Repurposing. Diabetes Metab. Syndr. Clin. Res. Rev. 2020, 14, 1027–1031. [Google Scholar] [CrossRef]
  7. Long, C.; Xu, H.; Shen, Q.; Zhang, X.; Fan, B.; Wang, C.; Zeng, B.; Li, Z.; Li, X.; Li, H. Diagnosis of the Coronavirus Disease (COVID-19): RRT-PCR or CT? Eur. J. Radiol. 2020, 126, 108961. [Google Scholar] [CrossRef] [PubMed]
  8. Hamida, S.; Gannour, O.E.; Cherradi, B.; Ouajji, H.; Raihani, A. Optimization of Machine Learning Algorithms Hyper-Parameters for Improving the Prediction of Patients Infected with COVID-19. In Proceedings of the 2020 IEEE 2nd International Conference on Electronics, Control, Optimization and Computer Science (ICECOCS), Kenitra, Morocco, 2–3 December 2020; IEEE: Piscataway, NJ, USA, 2020; pp. 1–6. [Google Scholar]
  9. Terrada, O.; Hamida, S.; Cherradi, B.; Raihani, A.; Bouattane, O. Supervised Machine Learning Based Medical Diagnosis Support System for Prediction of Patients with Heart Disease. Adv. Sci. Technol. Eng. Syst. J. 2020, 5, 269–277. [Google Scholar] [CrossRef]
  10. Terrada, O.; Cherradi, B.; Hamida, S.; Raihani, A.; Moujahid, H.; Bouattane, O. Prediction of Patients with Heart Disease Using Artificial Neural Network and Adaptive Boosting Techniques. In Proceedings of the 2020 3rd International Conference on Advanced Communication Technologies and Networking (CommNet), Marrakech, Morocco, 4–6 September 2020; IEEE: Piscataway, NJ, USA, 2020; pp. 1–6. [Google Scholar]
  11. Xie, J.; Jiang, J.; Wang, Y.; Guan, Y.; Guo, X. Learning an Expandable EMR-Based Medical Knowledge Network to Enhance Clinical Diagnosis. Artif. Intell. Med. 2020, 107, 101927. [Google Scholar] [CrossRef]
  12. Terrada, O.; Cherradi, B.; Raihani, A.; Bouattane, O. Atherosclerosis Disease Prediction Using Supervised Machine Learning Techniques. In Proceedings of the 2020 1st International Conference on Innovative Research in Applied Science, Engineering and Technology (IRASET), Meknes, Morocco, 16–19 April 2020; IEEE: Piscataway, NJ, USA, 2020; pp. 1–5. [Google Scholar]
  13. Sharma, P.; Choudhary, K.; Gupta, K.; Chawla, R.; Gupta, D.; Sharma, A. Artificial Plant Optimization Algorithm to Detect Heart Rate & Presence of Heart Disease Using Machine Learning. Artif. Intell. Med. 2020, 102, 101752. [Google Scholar] [CrossRef]
  14. Cherradi, B.; Terrada, O.; Ouhmida, A.; Hamida, S.; Raihani, A.; Bouattane, O. Computer-Aided Diagnosis System for Early Prediction of Atherosclerosis Using Machine Learning and K-Fold Cross-Validation. In Proceedings of the 2021 International Congress of Advanced Technology and Engineering (ICOTEN), Taiz, Yemen, 4–5 July 2021; IEEE: Piscataway, NJ, USA, 2021; pp. 1–9. [Google Scholar]
  15. Terrada, O.; Cherradi, B.; Raihani, A.; Bouattane, O. A Novel Medical Diagnosis Support System for Predicting Patients with Atherosclerosis Diseases. Inform. Med. Unlocked 2020, 21, 100483. [Google Scholar] [CrossRef]
  16. Hamida, S.; Cherradi, B.; Terrada, O.; Raihani, A.; Ouajji, H.; Laghmati, S. A Novel Feature Extraction System for Cursive Word Vocabulary Recognition Using Local Features Descriptors and Gabor Filter. In Proceedings of the 2020 3rd International Conference on Advanced Communication Technologies and Networking (CommNet), Marrakech, Morocco, 4–6 September 2020; IEEE: Piscataway, NJ, USA, 2020; pp. 1–7. [Google Scholar]
  17. Alsaeedi, A.; Al-Sarem, M. Detecting Rumors on Social Media Based on a CNN Deep Learning Technique. Arab. J. Sci. Eng. 2020, 45, 10813–10844. [Google Scholar] [CrossRef]
  18. Vijh, M.; Chandola, D.; Tikkiwal, V.A.; Kumar, A. Stock Closing Price Prediction Using Machine Learning Techniques. Procedia Comput. Sci. 2020, 167, 599–606. [Google Scholar] [CrossRef]
  19. Madani, Y.; Erritali, M.; Bouikhalene, B. Using Artificial Intelligence Techniques for Detecting COVID-19 Epidemic Fake News in Moroccan Tweets. Results Phys. 2021, 25, 104266. [Google Scholar] [CrossRef]
  20. Meldo, A.; Utkin, L.; Kovalev, M.; Kasimov, E. The Natural Language Explanation Algorithms for the Lung Cancer Computer-Aided Diagnosis System. Artif. Intell. Med. 2020, 108, 101952. [Google Scholar] [CrossRef]
  21. Ait Ali, N.; Cherradi, B.; El Abbassi, A.; Bouattane, O.; Youssfi, M. GPU Fuzzy C-Means Algorithm Implementations: Performance Analysis on Medical Image Segmentation. Multimed. Tools Appl. 2018, 77, 21221–21243. [Google Scholar] [CrossRef]
  22. Ali, N.A.; Abbassi, A.E.; Cherradi, B. The Performances of Iterative Type-2 Fuzzy C-Mean on GPU for Image Segmentation. J. Supercomput. 2021, 77, 1–19. [Google Scholar] [CrossRef]
  23. Bouattane, O.; Cherradi, B.; Youssfi, M.; Bensalah, M.O. Parallel C-Means Algorithm for Image Segmentation on a Reconfigurable Mesh Computer. Parallel Comput. 2011, 37, 230–243. [Google Scholar] [CrossRef] [Green Version]
  24. Li, Y.; Chen, P.; Li, Z.; Su, H.; Yang, L.; Zhong, D. Rule-Based Automatic Diagnosis of Thyroid Nodules from Intraoperative Frozen Sections Using Deep Learning. Artif. Intell. Med. 2020, 108, 101918. [Google Scholar] [CrossRef] [PubMed]
  25. Pereira, R.M.; Bertolini, D.; Teixeira, L.O.; Silla, C.N.; Costa, Y.M.G. COVID-19 Identification in Chest X-Ray Images on Flat and Hierarchical Classification Scenarios. Comput. Methods Programs Biomed. 2020, 194, 105532. [Google Scholar] [CrossRef]
  26. Vaishya, R.; Javaid, M.; Khan, I.H.; Haleem, A. Artificial Intelligence (AI) Applications for COVID-19 Pandemic. Diabetes Metab. Syndr. Clin. Res. Rev. 2020, 14, 337–339. [Google Scholar] [CrossRef]
  27. Li, Z.; Zhao, S.; Chen, Y.; Luo, F.; Kang, Z.; Cai, S.; Zhao, W.; Liu, J.; Zhao, D.; Li, Y. A Deep-Learning-Based Framework for Severity Assessment of COVID-19 with CT Images. Expert Syst. Appl. 2021, 185, 115616. [Google Scholar] [CrossRef]
  28. Moujahid, H.; Cherradi, B.; Al-Sarem, M.; Bahatti, L.; Bakr Assedik Mohammed Yahya Eljialy, A.; Alsaeedi, A.; Saeed, F. Combining CNN and Grad-Cam for COVID-19 Disease Prediction and Visual Explanation. Intell. Autom. Soft Comput. 2022, 32, 723–745. [Google Scholar] [CrossRef]
  29. Hamida, S.; El Gannour, O.; Cherradi, B.; Raihani, A.; Moujahid, H.; Ouajji, H. A Novel COVID-19 Diagnosis Support System Using the Stacking Approach and Transfer Learning Technique on Chest X-Ray Images. J. Healthc. Eng. 2021, 2021, 9437538. [Google Scholar] [CrossRef] [PubMed]
  30. Schmidhuber, J. Deep Learning in Neural Networks: An Overview. Neural Netw. 2015, 61, 85–117. [Google Scholar] [CrossRef] [Green Version]
  31. Yamashita, R.; Nishio, M.; Do, R.K.G.; Togashi, K. Convolutional Neural Networks: An Overview and Application in Radiology. Insights Imaging 2018, 9, 611–629. [Google Scholar] [CrossRef] [PubMed] [Green Version]
  32. Liu, L.; Shen, C.; Hengel, A. van den Cross-Convolutional-Layer Pooling for Image Recognition. IEEE Trans. Pattern Anal. Mach. Intell. 2017, 39, 2305–2313. [Google Scholar] [CrossRef] [Green Version]
  33. Hutchison, D.; Kanade, T.; Kittler, J.; Kleinberg, J.M.; Mattern, F.; Mitchell, J.C.; Naor, M.; Nierstrasz, O.; Pandu Rangan, C.; Steffen, B.; et al. Evaluation of Pooling Operations in Convolutional Architectures for Object Recognition. In Artificial Neural Networks—ICANN 2010; (Lecture Notes in Computer, Science); Diamantaras, K., Duch, W., Iliadis, L.S., Eds.; Springer: Berlin/Heidelberg, Germany, 2010; Volume 6354, pp. 92–101. ISBN 978-3-642-15824-7. [Google Scholar]
  34. Basha, S.H.S.; Dubey, S.R.; Pulabaigari, V.; Mukherjee, S. Impact of Fully Connected Layers on Performance of Convolutional Neural Networks for Image Classification. Neurocomputing 2020, 378, 112–119. [Google Scholar] [CrossRef] [Green Version]
  35. Moujahid, H.; Cherradi, B.; Al-Sarem, M.; Bahatti, L. Diagnosis of COVID-19 Disease Using Convolutional Neural Network Models Based Transfer Learning. In Innovative Systems for Intelligent Health Informatics (Lecture Notes on Data Engineering and Communications Technologies); Saeed, F., Mohammed, F., Al-Nahari, A., Eds.; Springer International Publishing: Cham, Switzerland, 2021; Volume 72, pp. 148–159. ISBN 978-3-030-70712-5. [Google Scholar]
  36. Morís, D.I.; de Moura Ramos, J.J.; Buján, J.N.; Hortas, M.O. Data Augmentation Approaches Using Cycle-Consistent Adversarial Networks for Improving COVID-19 Screening in Portable Chest X-Ray Images. Expert Syst. Appl. 2021, 185, 115681. [Google Scholar] [CrossRef]
  37. El Gannour, O.; Hamida, S.; Cherradi, B.; Raihani, A.; Moujahid, H. Performance Evaluation of Transfer Learning Technique for Automatic Detection of Patients with COVID-19 on X-Ray Images. In Proceedings of the 2020 IEEE 2nd International Conference on Electronics, Control, Optimization and Computer Science (ICECOCS), Kenitra, Morocco, 2–3 December 2020; IEEE: Piscataway, NJ, USA, 2020; pp. 1–6. [Google Scholar]
  38. Khan, M.; Mehran, M.T.; Haq, Z.U.; Ullah, Z.; Naqvi, S.R.; Ihsan, M.; Abbass, H. Applications of Artificial Intelligence in COVID-19 Pandemic: A Comprehensive Review. Expert Syst. Appl. 2021, 185, 115695. [Google Scholar] [CrossRef]
  39. Ashour, A.S.; Eissa, M.M.; Wahba, M.A.; Elsawy, R.A.; Elgnainy, H.F.; Tolba, M.S.; Mohamed, W.S. Ensemble-Based Bag of Features for Automated Classification of Normal and COVID-19 CXR Images. Biomed. Signal Process. Control 2021, 68, 102656. [Google Scholar] [CrossRef]
  40. Koyuncu, H.; Barstuğan, M. COVID-19 Discrimination Framework for X-Ray Images by Considering Radiomics, Selective Information, Feature Ranking, and a Novel Hybrid Classifier. Signal Process. Image Commun. 2021, 97, 116359. [Google Scholar] [CrossRef]
  41. Sharifrazi, D.; Alizadehsani, R.; Roshanzamir, M.; Joloudari, J.H.; Shoeibi, A.; Jafari, M.; Hussain, S.; Sani, Z.A.; Hasanzadeh, F.; Khozeimeh, F.; et al. Fusion of Convolution Neural Network, Support Vector Machine and Sobel Filter for Accurate Detection of COVID-19 Patients Using X-Ray Images. Biomed. Signal Process. Control 2021, 68, 102622. [Google Scholar] [CrossRef]
  42. Fan, Y.; Liu, J.; Yao, R.; Yuan, X. COVID-19 Detection from X-Ray Images Using Multi-Kernel-Size Spatial-Channel Attention Network. Pattern Recognit. 2021, 119, 108055. [Google Scholar] [CrossRef]
  43. Das, S.; Roy, S.D.; Malakar, S.; Velásquez, J.D.; Sarkar, R. Bi-Level Prediction Model for Screening COVID-19 Patients Using Chest X-Ray Images. Big Data Res. 2021, 25, 100233. [Google Scholar] [CrossRef]
  44. Thakur, S.; Kumar, A. X-Ray and CT-Scan-Based Automated Detection and Classification of Covid-19 Using Convolutional Neural Networks (CNN). Biomed. Signal Process. Control 2021, 69, 102920. [Google Scholar] [CrossRef]
  45. Ozcan, T. A New Composite Approach for COVID-19 Detection in X-Ray Images Using Deep Features. Appl. Soft Comput. 2021, 111, 107669. [Google Scholar] [CrossRef]
  46. Shorfuzzaman, M.; Masud, M.; Alhumyani, H.; Anand, D.; Singh, A. Artificial Neural Network-Based Deep Learning Model for COVID-19 Patient Detection Using X-Ray Chest Images. J. Healthc. Eng. 2021, 2021, 5513679. [Google Scholar] [CrossRef] [PubMed]
  47. Hasan, M.D.K.; Ahmed, S.; Abdullah, Z.M.E.; Monirujjaman Khan, M.; Anand, D.; Singh, A.; AlZain, M.; Masud, M. Deep Learning Approaches for Detecting Pneumonia in COVID-19 Patients by Analyzing Chest X-Ray Images. Math. Probl. Eng. 2021, 2021, 9929274. [Google Scholar] [CrossRef]
  48. Al-Rakhami, M.S.; Islam, M.M.; Islam, M.Z.; Asraf, A.; Sodhro, A.H.; Ding, W. Diagnosis of COVID-19 from X-Rays Using Combined CNN-RNN Architecture with Transfer Learning. Health Inform. 2020, 1–14. [Google Scholar] [CrossRef]
  49. Gaur, L.; Bhatia, U.; Jhanjhi, N.Z.; Muhammad, G.; Masud, M. Medical Image-Based Detection of COVID-19 Using Deep Convolution Neural Networks. Multimed. Syst. 2021, 27, 1–10. [Google Scholar] [CrossRef]
  50. Zulkifley, M.A.; Abdani, S.R.; Zulkifley, N.H.; Shahrimin, M.I. Residual-Shuffle Network with Spatial Pyramid Pooling Module for COVID-19 Screening. Diagnostics 2021, 11, 1497. [Google Scholar] [CrossRef]
  51. Barua, P.D.; Muhammad Gowdh, N.F.; Rahmat, K.; Ramli, N.; Ng, W.L.; Chan, W.Y.; Kuluozturk, M.; Dogan, S.; Baygin, M.; Yaman, O.; et al. Automatic COVID-19 Detection Using Exemplar Hybrid Deep Features with X-Ray Images. IJERPH 2021, 18, 8052. [Google Scholar] [CrossRef]
  52. Pan, S.J.; Yang, Q. A Survey on Transfer Learning. IEEE Trans. Knowl. Data Eng. 2010, 22, 1345–1359. [Google Scholar] [CrossRef]
  53. Chollet, F. Xception: Deep Learning with Depthwise Separable Convolutions. arXiv 2017, arXiv:1610.02357,. [Google Scholar]
  54. Szegedy, C.; Vanhoucke, V.; Ioffe, S.; Shlens, J.; Wojna, Z. Rethinking the Inception Architecture for Computer Vision. arXiv 2015, arXiv:1512.00567. [Google Scholar]
  55. Szegedy, C.; Ioffe, S.; Vanhoucke, V.; Alemi, A. Inception-v4, Inception-ResNet and the Impact of Residual Connections on Learning. arXiv 2016, arXiv:1602.07261. [Google Scholar]
  56. He, K.; Zhang, X.; Ren, S.; Sun, J. Identity Mappings in Deep Residual Networks. arXiv 2016, arXiv:1603.05027. [Google Scholar]
  57. Sandler, M.; Howard, A.; Zhu, M.; Zhmoginov, A.; Chen, L.-C. MobileNetV2: Inverted Residuals and Linear Bottlenecks. arXiv 2019, arXiv:1801.04381. [Google Scholar]
  58. Huang, G.; Liu, Z.; van der Maaten, L.; Weinberger, K.Q. Densely Connected Convolutional Networks. arXiv 2018, arXiv:1608.06993. [Google Scholar]
  59. Ren, X.; Du, S.; Zheng, Y. Parallel RCNN: A Deep Learning Method for People Detection Using RGB-D Images. In Proceedings of the 2017 10th International Congress on Image and Signal Processing, BioMedical Engineering and Informatics (CISP-BMEI), Shanghai, China, 14–16 October 2017; IEEE: Piscataway, NJ, USA, 2017; pp. 1–6. [Google Scholar]
  60. Laghmati, S.; Cherradi, B.; Tmiri, A.; Daanouni, O.; Hamida, S. Classification of Patients with Breast Cancer Using Neighbourhood Component Analysis and Supervised Machine Learning Techniques. In Proceedings of the 2020 3rd International Conference on Advanced Communication Technologies and Networking (CommNet), Marrakech, Morocco, 4–6 September 2020; IEEE: Piscataway, NJ, USA, 2020. [Google Scholar]
  61. Ouhmida, A.; Raihani, A.; Cherradi, B.; Terrada, O. A Novel Approach for Parkinson’s Disease Detection Based on Voice Classification and Features Selection Techniques. Int. J. Online Eng. 2021, 17, 111. [Google Scholar] [CrossRef]
  62. Ouhmida, A.; Terrada, O.; Raihani, A.; Cherradi, B.; Hamida, S. Voice-Based Deep Learning Medical Diagnosis System for Parkinson’s Disease Prediction. In Proceedings of the 2021 International Congress of Advanced Technology and Engineering (ICOTEN), Taiz, Yemen, 4–5 July 2021; IEEE: Piscataway, NJ, USA, 2021; pp. 1–5. [Google Scholar]
  63. Lopes, R.R.; Bleijendaal, H.; Ramos, L.A.; Verstraelen, T.E.; Amin, A.S.; Wilde, A.A.M.; Pinto, Y.M.; de Mol, B.A.J.M.; Marquering, H.A. Improving Electrocardiogram-Based Detection of Rare Genetic Heart Disease Using Transfer Learning: An Application to Phospholamban p.Arg14del Mutation Carriers. Comput. Biol. Med. 2021, 131, 104262. [Google Scholar] [CrossRef] [PubMed]
  64. Zucker, E.J.; Barnes, Z.A.; Lungren, M.P.; Shpanskaya, Y.; Seekins, J.M.; Halabi, S.S.; Larson, D.B. Deep Learning to Automate Brasfield Chest Radiographic Scoring for Cystic Fibrosis. J. Cyst. Fibros. 2020, 19, 131–138. [Google Scholar] [CrossRef] [Green Version]
  65. Altan, G.; Kutlu, Y.; Allahverdi, N. Deep Learning on Computerized Analysis of Chronic Obstructive Pulmonary Disease. IEEE J. Biomed. Health Inform. 2020, 24, 1344–1350. [Google Scholar] [CrossRef]
  66. Oniani, S.; Marques, G.; Barnovi, S.; Pires, I.M.; Bhoi, A.K. Artificial Intelligence for Internet of Things and Enhanced Medical Systems. In Bio-inspired Neurocomputing; (Studies in Computational Intelligence); Bhoi, A.K., Mallick, P.K., Liu, C.-M., Balas, V.E., Eds.; Springer: Singapore, 2021; Volume 903, pp. 43–59. ISBN 9789811554940. [Google Scholar]
  67. Sun, L.; Jiang, X.; Ren, H.; Guo, Y. Edge-Cloud Computing and Artificial Intelligence in Internet of Medical Things: Architecture, Technology and Application. IEEE Access 2020, 8, 101079–101092. [Google Scholar] [CrossRef]
  68. Talukder, A.; Haas, R. AIoT: AI Meets IoT and Web in Smart Healthcare. In Proceedings of the 13th ACM Web Science Conference 2021, Virtual Event, 21–25 June 2021; Association for Computing Machinery: New York, NY, USA, 2021; pp. 92–98. [Google Scholar]
Figure 1. The proposed diagnosis system architecture.
Electronics 11 00103 g001
Figure 2. The Samples of X-rays from 4 classes: (a) Normal sample; (b) Tuberculosis sample; (c) Coronavirus sample; (d) Viral-Pneumonia sample.
Electronics 11 00103 g002
Figure 3. The architecture of the proposed concatenation model based on the modified ResNet50 V2 and MobileNet V2 models.
Electronics 11 00103 g003
Figure 4. The proposed architecture of concatenation model based on the modified Xception and Inception V3 models.
Electronics 11 00103 g004
Figure 5. The accuracy and Loss of all modified pre-trained models. (a) Xception model, (b) Inception V3 model, (c) InceptionResNet V2 model, (d) ResNet50 V2 model, (e) MobileNet V2 model, (f) Dense-Net201 model.
Electronics 11 00103 g005aElectronics 11 00103 g005b
Figure 6. Accuracy and Loss curves for proposed concatenation model. (a) Proposed concatenation model of the modified ResNet50 V2 and MobileNet V2 models, (b) Proposed concatenation model of the modified Xception and Inception V3 models.
Electronics 11 00103 g006
Figure 7. The confusion-matrix for classification models. (a) Xception model, (b) Inception V3 model, (c) InceptionResNet V2 model, (d) ResNet50 V2 model, (e) MobileNet V2 model, (f) DenseNet201 model.
Electronics 11 00103 g007
Figure 8. The confusion-matrix demonstrates the Proposed Concatenation classifier. (a) Proposed concatenation model based on the modified ResNet50 V2 and MobileNet V2 models, (b) Proposed concatenation model based on the modified Xception and Inception V3 models.
Electronics 11 00103 g008
Figure 9. ROC curves were obtained by the studied models. (a) Xception based model, (b) Inception V3 based model, (c) InceptionResNet V2 based model, (d) ResNet50 V2 model, (e) MobileNet V2 based model, (f) DenseNet201 based model.
Electronics 11 00103 g009
Figure 10. ROC curves obtained by the Proposed Concatenation classifier. (a) Proposed concatenation model based on the modified ResNet50 V2 and MobileNet V2 models, (b) Proposed concatenation model based on the modified Xception and Inception V3 models.
Electronics 11 00103 g010
Figure 11. Metrics for Performance Evaluation for all studied models.
Electronics 11 00103 g011
Table 1. Summary of related work.
Ref.No. of ClassesModelsAccuracyPrecisionSensitivitySpecificity
[39]CoronavirusBoF98.6%97.7%99.4%N.A
Normal
[40]CoronavirusHybrid Classifier99.53%N.AN.AN.A
Normal
Bac-pneumonia
[41]CoronavirusCNN-SVM + Sobel99.61%N.A99.80%99.56%
Normal
[42]CoronavirusMKSC98.2%97.52%98.05%97.82%
Normal
[43]CoronavirusBi-level classification99.26%99.23%99.26%N.A
Normal
Pneumonia
[44]CoronavirusCNN99.64%99.56%99.58%N.A
Normal
Coronavirus98.28%98.22%98.25%N.A
Normal
Pneumonia
[45]CoronavirusSLB184.71%87.75%86.13%90.91%
SLB280.89%83.79%81.67%88.71%
SLB380.00%84.28%80.60%88.08%
NormalSLB484.44%87.80%84.73%90.73%
FFB183.82%87.32%85.07%90.35%
FFB284.27%87.65%85.60%90.62%
FFB387.64%90.87%88.13%92.59%
PneumoniaFFB479.91%83.28%80.93%88.11%
FFB582.13%85.90%83.40%89.36%
FFB681.87%85.90%82.40%89.18%
[46]CoronavirusResNet50 V295.49%96.85%99.19%98.27%
NormalVGG1692.70%97.50%94.35%98.69%
PneumoniaInception V392.97%97.60%98.39%98.67%
[47]Coronavirus
Normal
Pneumonia
VGG1691.69%92.33%95.92%100%
[48]Coronavirus
Normal
Pneumonia
VGG19-RNN99.85%N.AN.AN.A
[49]CoronavirusVGG1687.84%82.00%82.33%91.20%
NormalInception-V391.32%87.54%89.00%94.00%
Viral-pneumoniaEfficientNetB092.93%88.30%90.00%95.00%
[50]CoronavirusResidual-Shuffle-Net97.39%97.40%97.39%98.69%
Usual
Pneumonia
[51]Control
Bacterial Pneumonia
Viral Pneumonia
Coronavirus
Exemplar COVID-19FclNet997.60%N.AN.AN.A
Table 2. Sources of data were utilized to create a consolidated dataset with four classes [29].
Sources of DatasetsCoronavirusNormalViral-PneumoniaTuberculosis
Coronavirus Radiography Database 1120013411345-
Coronavirus Detection X-ray Dataset 260880412-
Coronavirus Patients Lungs X-ray Images 37028--
Coronavirus X-rays 470---
Viral-Pneumonia vs. Bacteria-Pneumonia 5--1493-
Chest X-ray Database of Tuberculosis (TB) 6---3500
Resulting Dataset1400224932503500
Table 3. The dataset partitions of used dataset [29].
CategoryTraining (80%)Validation and Testing (20%)Total (100%)
Normal17994502249
Tuberculosis28007003500
Coronavirus11202801400
Viral-Pneumonia26006503250
Total8319208010,399
Table 4. The proposed modified based Xception model architecture.
DesignationOutput-ShapeParameters Number
Original Modelxception_v210 × 10 × 204820,861,480
Additional Layersconv2d_1 (Conv2D)10 × 10 × 10242,098,176
mp_1 (MaxPooling2D)5 × 5 × 10240
flatten (Flatten)25,6000
Dense-1102426,215,424
Dense-2512524,800
Dense-3256131,328
Dense-441028
Table 5. The proposed modified-based Inception V3 model architecture.
DesignationOutput ShapeParameters Number
Original ModelInception-V38 × 8 × 204821,802,784
Additional Layersconv2d_1 (Conv2D)8 × 8 × 10242,098,176
mp_1 (MaxPooling2D)4 × 4 × 10240
flatten (Flatten)16,3840
Dense-1102416,778,240
Dense-2512524,800
Dense-325613,128
Dense-441028
Table 6. The proposed modified-based InceptionResNet V2 model architecture.
DesignationOutput ShapeParameters Number
Original ModelInceptionresnet-V28 × 8 × 153654,336,736
Additional Layersconv2d_1 (Conv2D)8 × 8 × 10241,573,888
mp_1 (MaxPooling2D)4 × 4 × 10240
flatten (Flatten)16,3840
Dense-1102416,778,240
Dense-2512524,800
Dense-3256131,328
Dense-441028
Table 7. The proposed modified-based ResNet50 V2 model architecture.
DesignationOutput ShapeParameter Number
Original Modelresnet50_v27 × 7 × 204823,564,800
Additional Layersconv2d_1 (Conv2D-1)7 × 7 × 10242,098,176
mp_1 (MaxPooling2D)3 × 3 × 10240
flatten (Flatten)92160
Dense-110249,438,208
Dense-2512524,800
Dense-3256131,328
Dense-441028
Table 8. The proposed modified-based MobileNet V2 model architecture.
DesignationOutput ShapeParameter Number
Original Modelmobilenet_v27 × 7 × 12802,257,984
Additional Layersconv2d_1 (Conv2D)7 × 7 × 10241,311,744
mp_1 (MaxPooling2D)3 × 3 × 10240
flatten (Flatten)92160
dense_1 (Dense)10249,438,208
dense_2 (Dense)512524,800
dense_3 (Dense)256131,328
dense_4 (Dense)41028
Table 9. The proposed modified-based DenseNet201 model architecture.
DesignationOutput ShapeParameter Number
Original ModelDenseNet2017 × 7 × 192018,321,984
Additional Layersconv2d_1 (Conv2D)7 × 7 × 10241,967,104
mp_1 (MaxPooling2D)3 × 3 × 10240
flatten (Flatten)92160
dense_1 (Dense)10249,438,208
dense_2 (Dense)512524,800
dense_3 (Dense)256131,328
dense_4 (Dense)41028
Table 10. The proposed modified-based DenseNet201 model architecture.
Modified ModelsTrainable
Parameters
No Trainable
Parameters
Total
Parameters
Xception based model49,777,70854,52849,832,236
Inception V3 based model41,301,92434,43241,336,356
InceptionResNet V2 based model73,285,47660,54473,346,020
ResNet50 V2 based model35,712,90045,44035,758,340
MobileNet V2 based model13,896,56834,11213,930,680
DenseNet201 based model30,155,396229,05230,384,452
Table 11. The detailed architecture of the proposed concatenation model based on the modified ResNet50 V2 and MobileNet V2 models.
Proposed Concatenation Model Based on Resnet50 V2 and MobileNet V2
TL1 Layer-typeParametersTL1 Layer-typeParameters
TL1_resnet50v223,564,800TL2_mobilenetv22,257,984
TL1_Conv2D-12,098,176TL1_Conv2D-11,311,744
TL1_MaxPooling2D-10TL1_MaxPooling2D-10
TL1_Flatten0TL1_Flatten0
TL1_Dense-19,438,208TL1_Dense-19,438,208
TL1_Dense-2524,800TL1_Dense-2524,800
TL1_Dense-3131,328TL1_Dense-3131,328
Concatenate LayerOutput ShapeParameters
concatenate_model (concatenate)5120
concatenate_dense_1 (Dense)42052
Table 12. The detailed architecture of the proposed concatenation model based on the modified Xception and Inception V3 models.
Proposed Concatenate Model Based on Xception and Inception V3
TL1 Layer typeOutput ShapeParametersTL1 Layer typeOutput ShapeParameters
TL1_xception10 × 10 × 204820,861,480TL2_inceptionv38 × 8 × 204821,802,784
TL1_Conv2D-110 × 10 × 10242,098,176TL2_conv2d_1 (Conv2D)8 × 8 × 10242,098,176
TL1_MaxPooling2D-15 × 5 × 10240TL2_mp_1 (MaxPooling2D)4 × 4 × 10240
TL1_Flatten25,6000TL2_flatten (Flatten)16,3840
TL1_Dense-1102426,215,424TL2_dense_1 (Dense)102416,778,240
TL1_Dense-2512524,800TL2_dense_2 (Dense)512524,800
TL1_Dense-3256131,328TL2_dense_3 (Dense)256131,328
Concatenate LayerOutput ShapeParameters
concatenate_model (concatenate)5120
concatenate_dense_1 (Dense)42052
Table 13. The best hyper-parameters were used for the modified models and the two proposed concatenation models in the training phase.
ModelsAll Modified ModelsProposed Model 1Proposed Model 2
Activation FunctionsHidden 1Relu
Hidden 2
Hidden 3
OutputSoftmax
OptimizerAdam
Learning Rate1 × 10−4
Batch Size16
Loss FunctionCategorical cross-entropy
Epochs25
1 Proposed concatenation model based on the modified ResNet50 V2 and MobileNet V2 models. 2 Proposed concatenation model based on the modified Xception and Inception V3 models.
Table 14. Evaluation Models’ performance based on metrics scoring.
Modified ModelsAccuracyLossPrecisionSensitivitySpecificityNPV
Xception based Model99.42%0.034299.46%99.04%99.79%99.83%
Inception V3 based Model99.23%0.030998.96%%99.34%99.75%99.72%
InceptionResNet V2 based Model99.42%0.026899.46%99.13%99.80%99.82%
ResNet50 V2 based Model99.51%0.021999.50%99.32%99.83%99.85%
MobileNet V2 based Model98.36%0.051898.40%97.99%99.45%99.46%
DenseNet201 based Model99.51%0.032999.64%99.17%99.82%99.86%
Proposed Model 199.71%0.01599.40%99.67%99.88%99.86%
Proposed Model 299.80%0.00599.85%99.71%99.93%99.94%
1 Proposed concatenation model based on the modified ResNet50 V2 and MobileNet V2 models. 2 Proposed concatenation model based on the modified Xception and Inception V3 models.
Table 15. Models runtimes and time by epoch description.
Modified ModelsAccuracyRuntimeTime/EpochTotal Parameters (Millions)
Xception Based Model99.42%1 h 25 min 46 s206 s49
Inception V3 Based Model99.23%33 min 7 s79 s41
InceptionResNet V2 Based Model99.42%1 h 14 min 37 s178 s73
ResNet50 V2 Based Model99.51%20 min 59 s50 s35
MobileNet V2 Based Model98.36%19 min 50 s47 s13
DenseNet201 Based Model99.51%42 min 31 s101 s30
Proposed Model 199.71%2 h 36 min 45 s386 s49
Proposed Model 299.80%3 h 1 min 36 s434 s91
1 Proposed concatenation model based on the modified ResNet50 V2 and MobileNet V2 models. 2 Proposed concatenation model based on the modified Xception and Inception V3 models.
Table 16. Comparative results for the obtained model with previous research in the literature.
WorksMethodsAccuracyPrecisionSensitivitySpecificity
[39]BoF98.6%97.7%99.4%N.A
[40]Hybrid Classifier99.53%N.AN.AN.A
[41]CNN-SVM + Sobel99.61%N.A99.80%99.56%
[42]MKSC98.2%97.52%98.05%97.82%
[43]Bi-level classification99.26%99.23%99.26%N.A
[44]CNN98.28%98.22%98.25%N.A
[45]FFB387.64%90.87%88.13%92.59%
[46]ResNet50 V295.49%96.85%99.19%98.27%
[47]VGG1691.69%92.33%95.92%100%
[49]EfficientNetB092.93%88.30%90.00%95.00%
[50]Residual-Shuffle-Net97.39%97.40%97.39%98.69%
Proposed modelsCon RN50V2_MNV2 199.71%99.40%99.67%99.88%
Con Xcep_IncepV3 299.80%99.85%99.71%99.93%
1 Proposed concatenation model based on the modified ResNet50 V2 and MobileNet V2 models. 2 Proposed concatenation model based on the modified Xception and Inception V3 models.
Publisher’s Note: MDPI stays neutral with regard to jurisdictional claims in published maps and institutional affiliations.

