Article

Wearable Wireless Physiological Monitoring System Based on Multi-Sensor

College of Electronic Information and Optical Engineering, Nankai University, Tianjin 300350, China
*
Author to whom correspondence should be addressed.
These authors contributed equally to this work.
Electronics 2021, 10(9), 986; https://doi.org/10.3390/electronics10090986
Submission received: 20 March 2021 / Revised: 14 April 2021 / Accepted: 19 April 2021 / Published: 21 April 2021

Abstract

:
The purpose of wearable technology is to use multimedia, sensors, and wireless communication to integrate specific technology into user clothes or accessories. With the help of various sensors, the physiological monitoring system can collect, process, and transmit physiological signals without causing damage. Wearable technology has been widely used in patient monitoring and people’s health management because of its low-load, mobile, and easy-to-use characteristics, and it supports long-term continuous work and can carry out wireless transmissions. In this paper, we established a Wi-Fi-based physiological monitoring system that can accurately measure heart rate, body surface temperature, and motion data and can quickly detect and alert the user about abnormal heart rates.

1. Introduction

In recent years, with economic and social development, people’s health has been constantly threatened by various factors. For example, cardiovascular disease has remained the main cause of disease burden in the world in recent years. According to surveys, as of 2019, the number of global cardiovascular disease cases had reached 523 million and the death toll had reached 18.6 million. In most countries, cardiovascular disease has continued to increase for decades [1]. At the same time, the medical system is facing challenges. For example, as medical costs rise, the affordability of medical expenses has become an important topic and there are conflicts between medical resources and medical needs [2]. From the perspective of highly hidden and harmful diseases such as cardiovascular diseases, health monitoring is very important in modern society and can reduce risks to health and reduce burden on the medical system. In the field of health monitoring, Internet of Things technology has become a very important technology and there has been some work to analyze the factors that affect the design of the Internet of Things [3]. With the improvement of technologies such as the Internet of Things, the related costs of health monitoring continue to decrease and wearable devices have become a reliable tool for health monitoring. Users now mainly obtain wearable devices through online purchases, and such devices are continuously popularized and developed through online channels [4]. Because of the portability of wearable devices, they play an increasingly important role in long-term health monitoring. For example, smart watches have some technical and psychological characteristics and are already a widely used mobile health communication tool [5,6]. From the current point of view, it is an important development direction for wearable devices to concentrate multiple sensing tasks on a single device and to realize comprehensive monitoring of multiple data [7].
Wearable devices rely on various sensors to collect bodily and environmental data, to conduct comprehensive analysis of the data, and to transmit the required information to the master computer through communication. These tasks can carry out effective physiological monitoring to achieve disease prevention and to reduce medical burden. Currently, in the field of wearable devices, there are related work on monitoring different types of data.
Chételat et al. [8] designed a new system to monitor large sets of physiological, kinetics, and environmental parameters. Moreover, the system they designed is easy to disassemble when the clothes need to be washed. Jun Liu et al. [9] presented a long-term monitoring system based on multi-sensors. The data are transmitted via Bluetooth but may not meet the sampling rate requirements. Wasimuddin et al. [10] proposed an improved method based on CNN, which can identify the type of arrhythmia in real time based on ECG waves, and it is also adaptable in wearable systems. Jung et al. [11] proposed a new method to monitor ECG with two wireless modules. Cheng Xu et al. [12] proposed a human motion tracking technology based on a hybrid approach of multiple sensors. James Coates et al. [13] designed a wearable multi-sensor system that collects data including temperature, humidity, and galvanic skin response. The abovementioned wearable system designs have limitations in different aspects. For example, data-processing algorithms that rely on models have difficulty in obtaining labeled data; digital–analog hybrid systems may be affected by noise; and some devices have limitations in long-term monitoring tasks.
We designed a wearable physiological monitoring system based on Wi-Fi technology. Our device integrates ECG signal sensors, temperature sensors, and motion sensors, which can perform real-time monitoring of the wearer’s ECG, body temperature, movement acceleration, etc. The system uses algorithms to process data in the MCU and sends the information to the PC or the cloud via Wi-Fi for processing and display. The system realizes long-term and reliable monitoring of physiological signals through the wearable device, and we use low-power devices to implement hardware design to optimize the overall power consumption of the system.
We can briefly summarize the main contributions of the current research as follows:
  • Establishing a wearable physiological monitoring system based on multiple sensors to monitor ECG signals, body surface temperature, and sports data.
  • Proprosing a new, complete design of a module with ADS1292 (Dallas, TX, USA) to monitor ECG signals from the hardware and algorithm.
  • Using the LMT70 chip (Dallas, TX, USA) to design a body surface temperature sensor module, and performing polynomial fitting in the range of 30–40 °C to improve the accuracy.
  • In the design of the ranging algorithm, considering that the motion plane in the application scene can be approximated as a two-dimensional plane and adjusting the transformation matrix to reduce the amount of calculation.

2. Materials and Methods

2.1. System Architecture

This section describes the design of the wearable wireless physiological monitoring system that can monitor the user’s ECG, motion data, and body surface temperature. As depicted in Figure 1, the system is composed of several sensors and a main controller for the purpose of monitoring.
The monitoring system uses MSP-EXP430F5529 (Dallas, TX, USA)as a microcontroller, and the sensor includes an ECG signal sensor, a body surface temperature sensor, and a motion sensor. We used a Wi-Fi module for wireless data transmission. At the same time, the collected data are displayed on the PC interface in real time and uploaded to the cloud data platform.
The system workflow is as follows: After initialization, the MSP430 (Dallas, TX, USA) microcontroller first sends the corresponding information to the Wi-Fi module to complete the network connection between the Wi-Fi module and the PC or mobile phone terminal. Each sensor is directly connected to the MSP-EXP430F5529 microcontroller. According to the circuit design, the sensor adopts an UART/SPI/I2C protocol in communication with the microcontroller. Each sensor is used to measure specific parameters (ECG data, temperature data, and motion data). The sensors continue to collect data and to send the data they collect to the microcontroller in real time. The MSP430 microcontroller packs the data according to the agreed upon rules, and the Wi-Fi module sends data frames to the PC or mobile phone and uploads them to the cloud.

2.2. Hardware Design

The hardware of the system includes a microcontroller, a Wi-Fi module, an ECG signal sensor module, a temperature sensor module, and a motion sensor module.
The microcontroller receives data continuously sent by the sensor, encapsulates the data into a data frame, and then sends the encapsulated data frame to the Wi-Fi module for data transmission. We chose MSP-EXP430F5529 as the microcontroller for the system. This microcontroller is produced by TI and uses the MSP430F5529 chip. MSP430F5529 is the latest generation of ultralow-power single-chip microcomputers with an integrated USB, can be applied to tasks such as wireless sensing, and is one of the single-chip microcomputers with the lowest working power consumption [14]. The ultralow power-consumption characteristics of MSP430F5529 and the multiple peripherals integrated by the single-chip microcomputer are suitable for this system and provide the possibility for future improvements.
The Wi-Fi module is used to send the data frames generated by the microcontroller to a PC or mobile phone terminal and uploads the data to the cloud. We chose ESP8266 (Shanghai, China), which is produced by Espressif company, as the Wi-Fi module in the system. ESP8266 is a high-performance UART-WiFi module. The module uses a serial port (LVTTL) to communicate with the MCU (or other serial devices) and has a built-in TCP/IP protocol stack, which can convert between serial ports and Wi-Fi. In this system, MSP430F5529 completes initialization and data transmission of ESP8266 through AT commands. In this local area network, we set ESP8266 to STA mode and the PC or mobile phone terminal to AP mode. The TCP protocol is used for communication between the STA and the AP. After MSP430F5529 receives the data from the sensors, it packs the data into a data frame according to a certain format, which includes sensor data and a data header for verification. ESP8266 will immediately send the data through Wi-Fi after receiving the data from the serial port.
The peak value of the ECG signal is about 1 mv, and the internal noise of the human body is a type of interference to the detection of low-frequency and low-amplitude ECG signals. Therefore, an analog front end with high gain and low cutoff frequency is essential for back-end digital conversion and processing of the ECG signal. We used TI’s ADS1292 (Dallas, TX, USA) analog front end, which has two low-noise PGAs and two high-resolution ADCs inside. It has an SPI interface. The quiescent current is 20 μA and the shutdown current is less than 1 μA. It contains all of the functions usually required for portable low-power medical ECG applications and is suitable for low-power and high-precision ECG measurement tasks [15]. The hardware circuit of the ECG signal sensor module based on ADS1292 is shown in Figure 2. The module uses ADS1292 as the core chip and AP2112K (Shanghai, China) as the voltage regulator chip, which converts 5 V voltage to 3.3 V to power the module. At the same time, it uses TXS0108E as the conversion chip of the logic level.
The temperature sensor module takes TI’s LMT70 chip as the main part, and the schematic diagram of the temperature sensor module based on the LMT70 chip is shown in Figure 3. LMT70 is a high-precision, low-power CMOS analog temperature sensor with output enable pins. Its accuracy in the range of 20 °C to 42 °C is ±0.05 °C (typical value) or ±0.13 °C (maximum) [16]. The module also uses TI’s ADS1115 chip as the ADC. ADS1115 is an I2C-compatible 16-bit high-precision low-power ADC. The current during continuous operation is only 150 μA, which is very suitable for power-constrained measurement tasks. The module also uses the LP2985 chip (Dallas, TX, USA) as a voltage regulator chip to supply power.
We coose MPU6050, which is produced by Invensense company, as the motion sensor. The module integrates a three-axis gyroscope and a three-axis accelerometer and has a built-in 16-bit ADC. MPU6050 transmits information such as angular velocity and acceleration to MCU through I2C, which is used for Euler angle calculation and pose estimation, and then completes tasks such as step counting and distance calculation.

2.3. Software Design

The data directly collected by the hardware circuit (including acceleration and bio-voltage) cannot intuitively reflect the user’s state, such as distance and number of steps. Similarly, we cannot directly obtain the user’s heart rate and ECG waveform, so we need to process and analyze the data to obtain information about the user. This section describes the algorithm and software design in the established wearable wireless physiological monitoring system. The overall algorithm flowchart of the system is shown in Figure 4.

2.3.1. ECG Data Processing and Heart Rate Calculation

In the standard ECG waveform, the baseline refers to the zero potential baseline, which is usually determined by the TP segment in the ECG waveform. The ST segment represents the process between the termination of ventricular depolarization and the beginning of repolarization. The normal ST segment is slightly concave and is the line segment from the end of the QRS complex to the beginning of the T wave in the image. Under normal circumstances, the ST segment should be aligned with the baseline [17]. However, in the process of collecting data from the ECG signal sensor, due to the change in electrode resistance, the drift of the amplifier’s DC bias, and the slow motion of human muscles or breathing, the zero potential baseline is shifted, which affects the ECG waveform [18].
The frequency range of baseline drift is about 0.05 Hz to 5 Hz, and the main frequency component is about 0.1 Hz, which is low-frequency interference. The frequency range of the ST segment in ECG is about 0.6–0.7 Hz [19], which is close to the frequency range of baseline drift. Therefore, if a high-pass filter is used to eliminate baseline drift, severe distortion occurs in the ST segment. To solve this problem, we design a median filter to process the ECG data.
We used digital discrete signals to represent ECG signals:
X = { x j } ( < j < + )
Suppose that the length of the filter window is L ( L = 2 N + 1 ) , and N is a positive integer. At a certain moment, the signal samples in the window are as follows:
x i N , , x i , , x i + N
where x i is the sample signal value at the center of the window. The center value of the 2 N + 1 signal values in the window arranged from large to small is the output value of the median filter. The width of the window used in this method is L = 51 . which is
y i = M e d [ x i N , , x i , , x i + N ]
The magnitude of the ECG signal is only several millivolts, and the main frequency range is between 0.05 Hz and 100 Hz [20]. After removing the baseline drift, the signal needs to be passed through a low-pass filter to eliminate the interference with a frequency above 100 Hz. The transfer function of the Buteterworth low-pass filter we designed is as follows:
H ( z ) = 0.5962 z 4 + 2.385 z 3 + 3.5775 z 2 + 2.385 z + 0.5962 z 4 + 2.9767 z 3 + 3.4219 z 2 + 1.7858 z + 0.3555
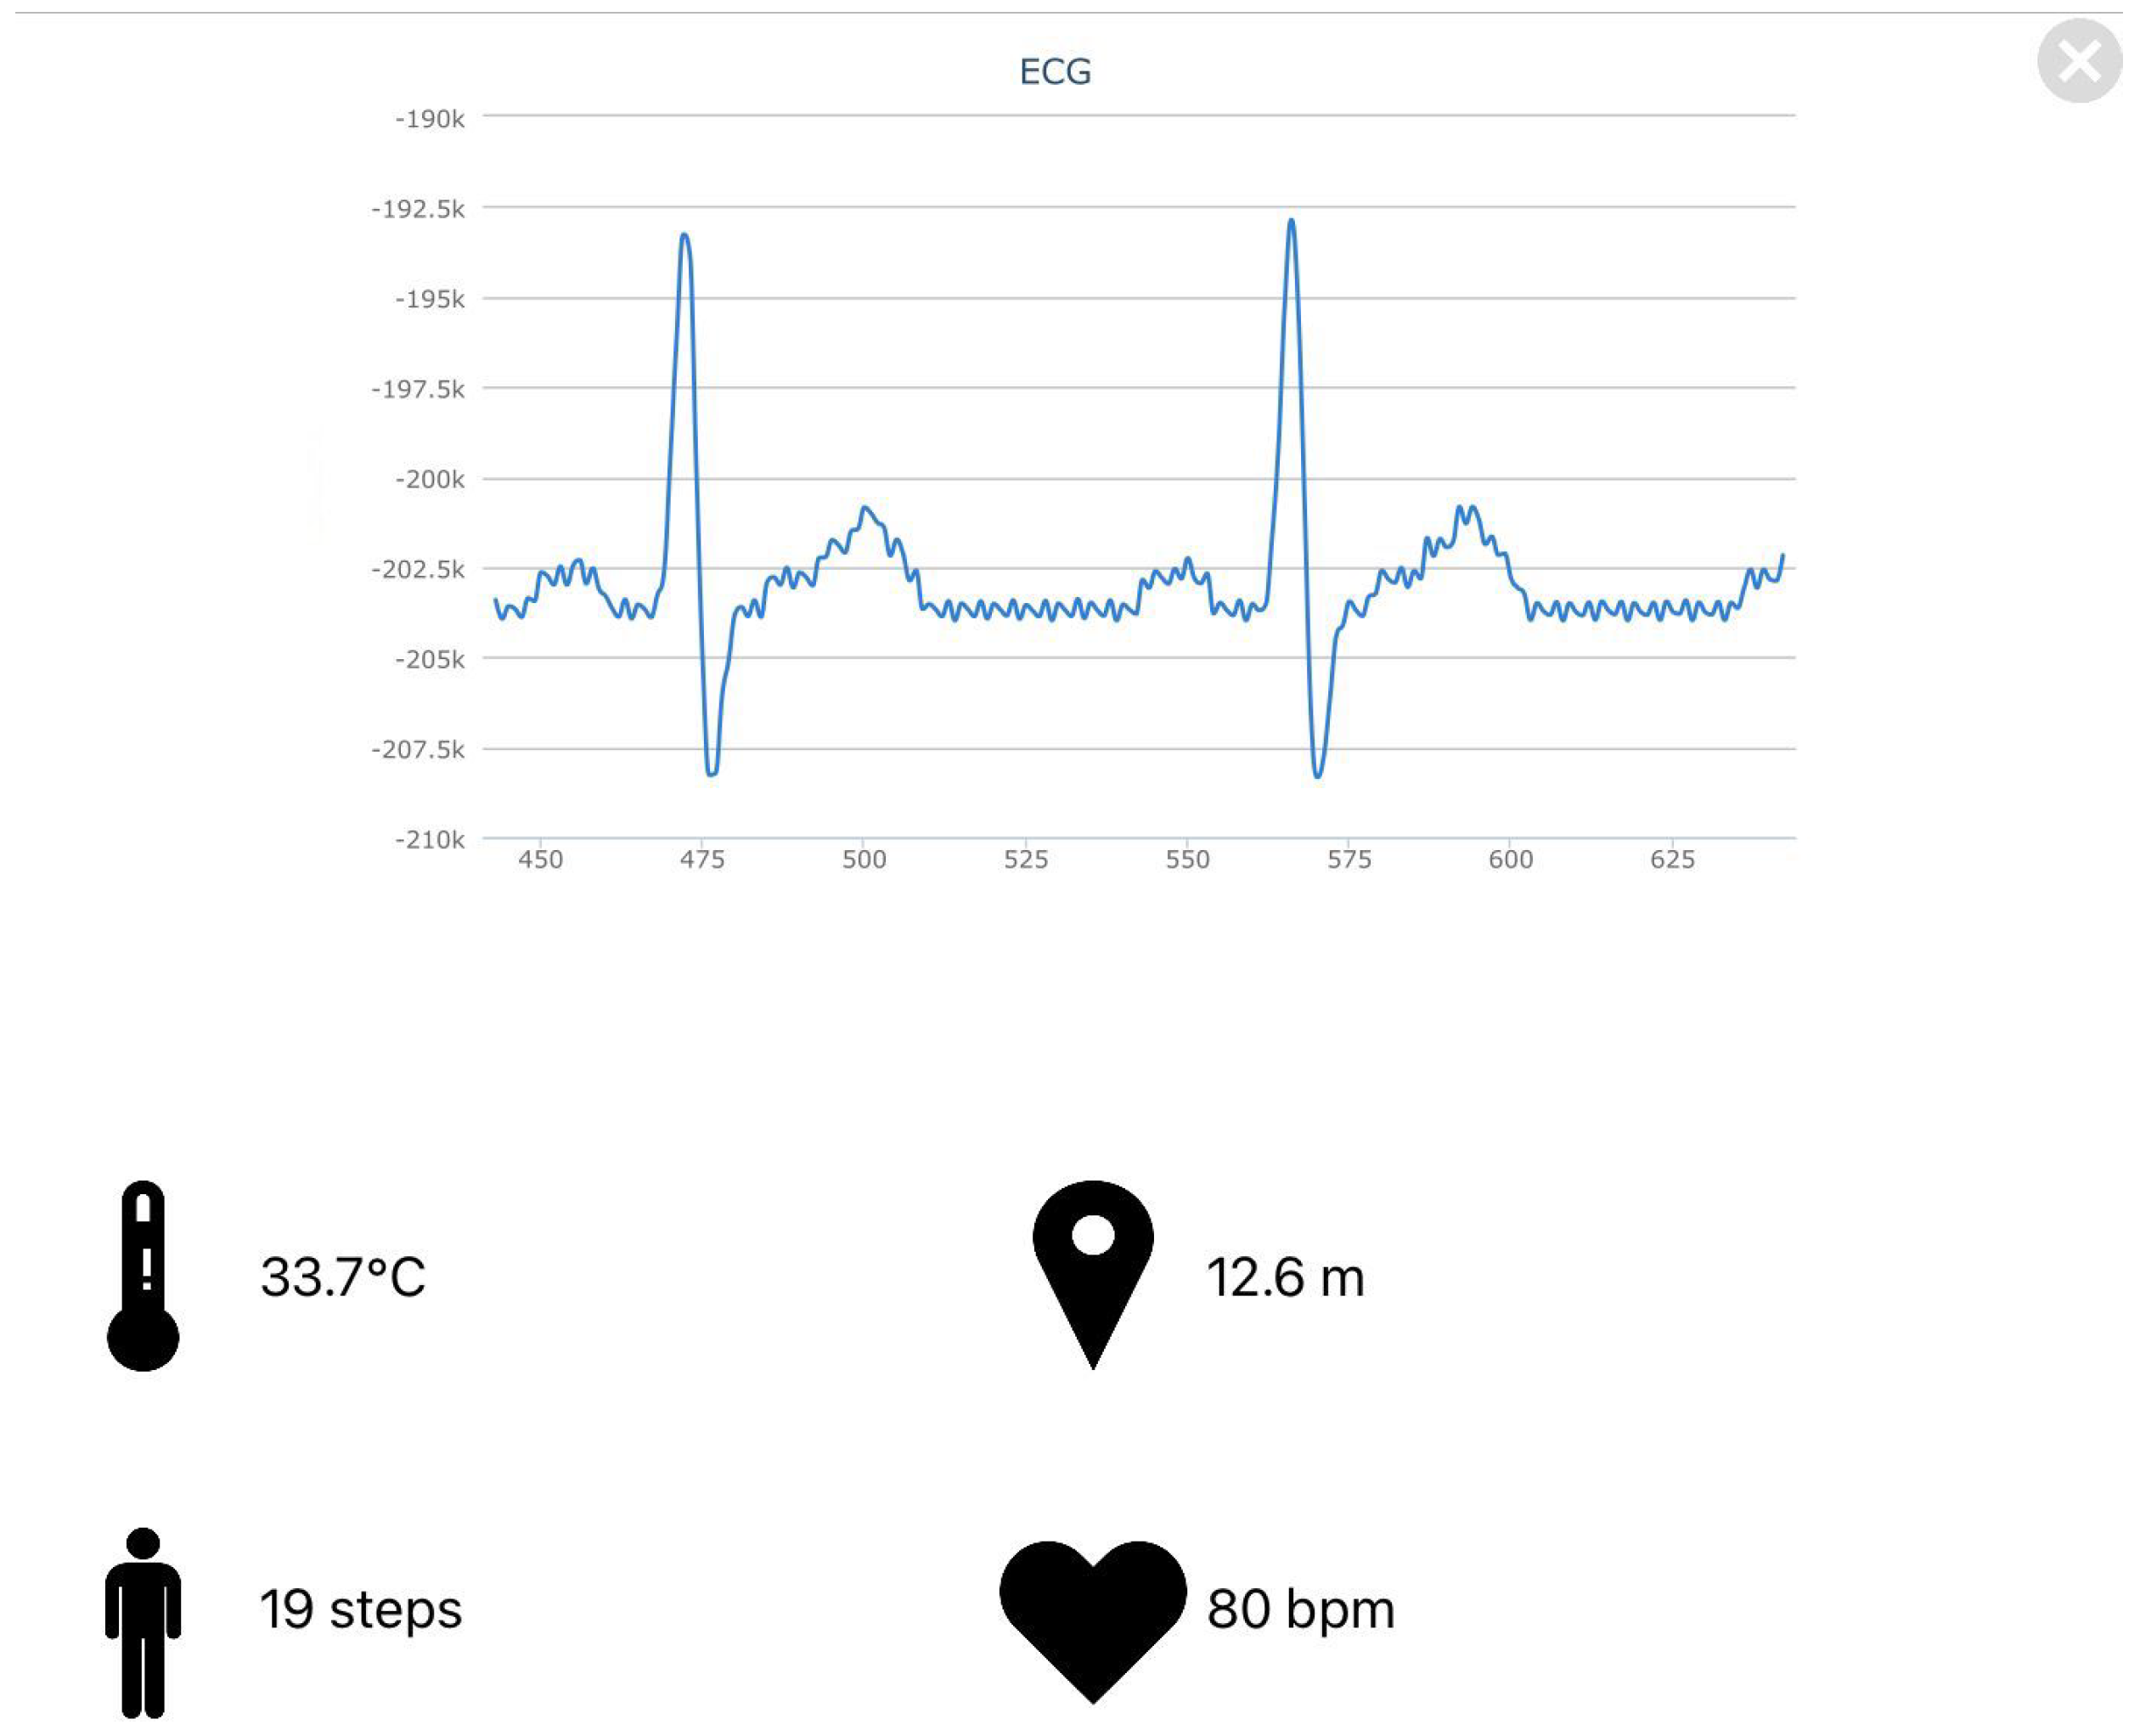
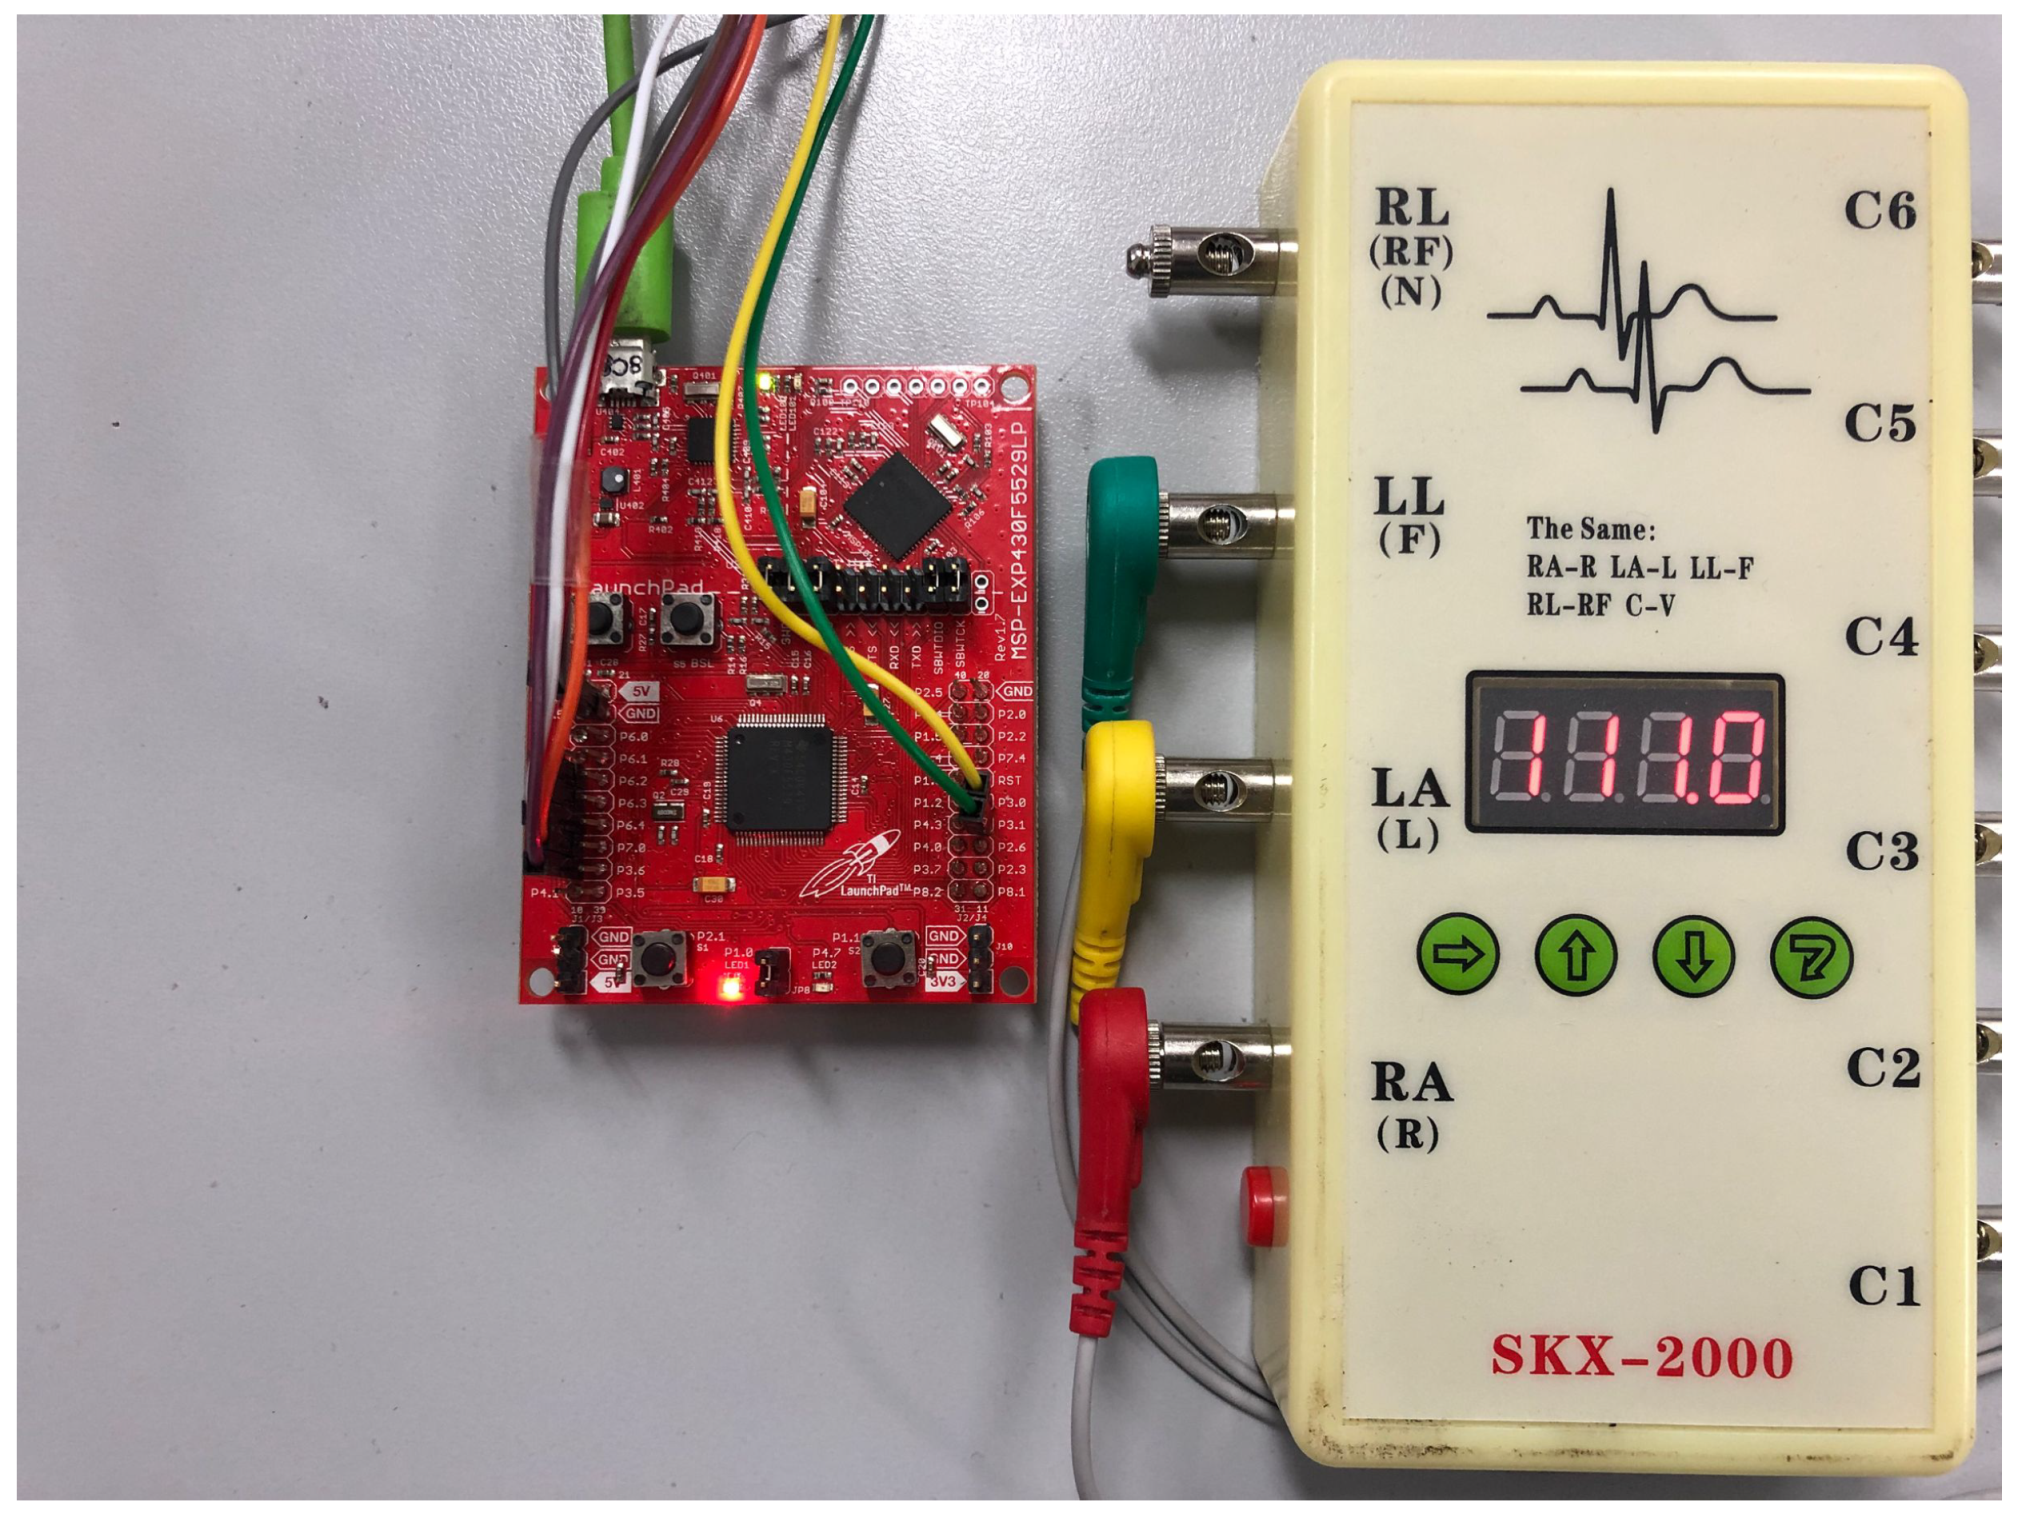
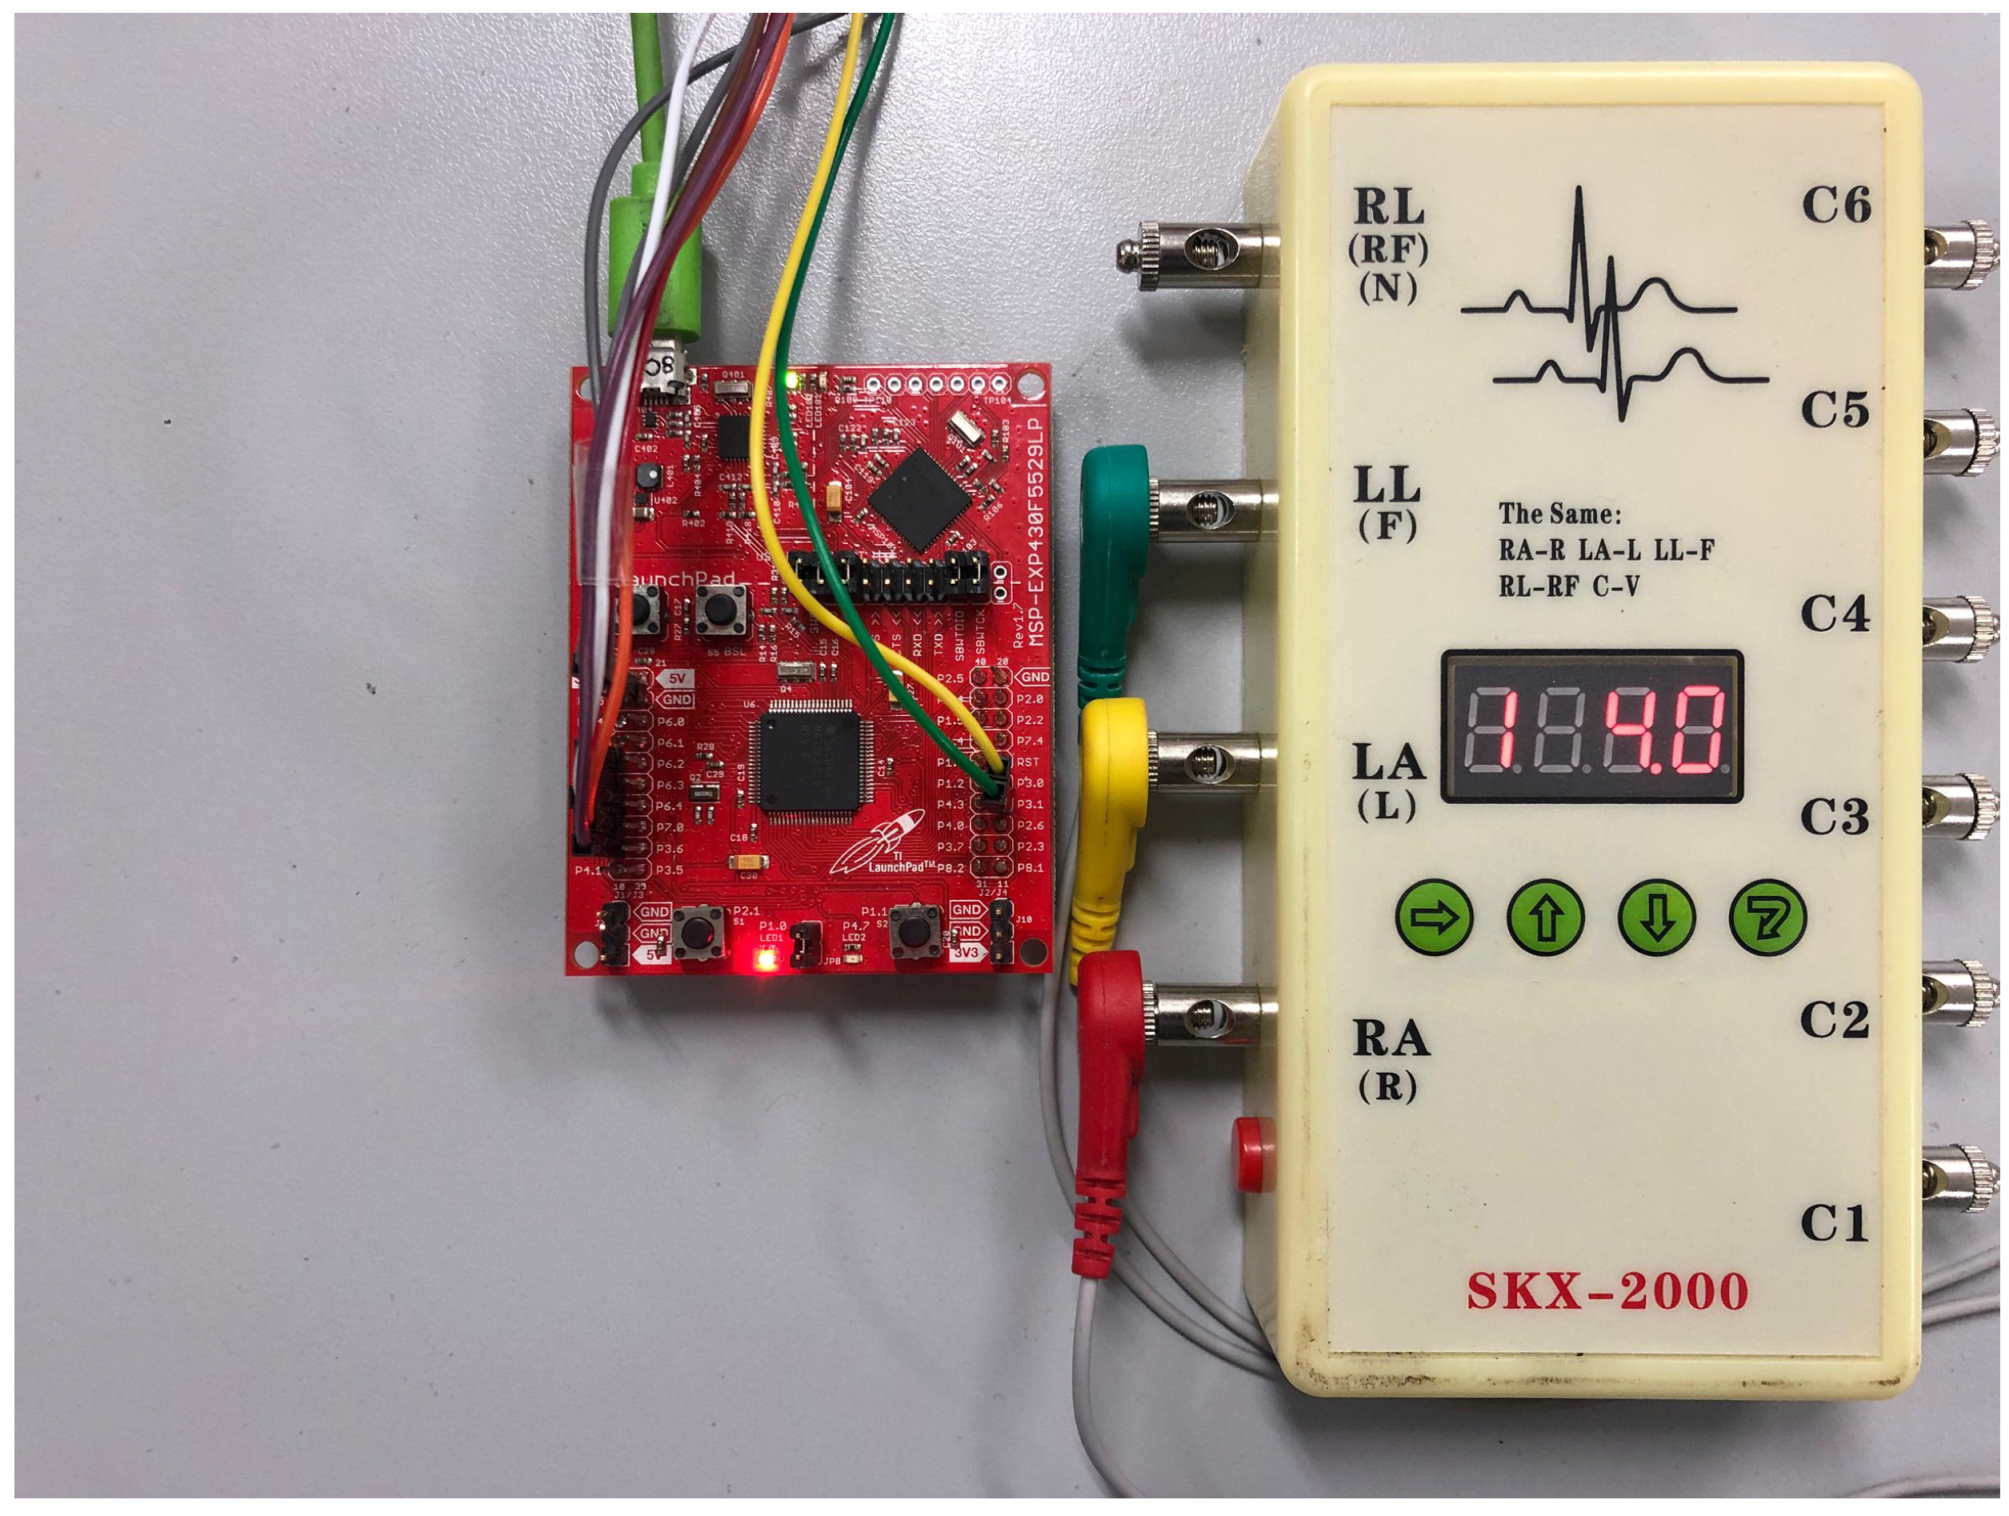
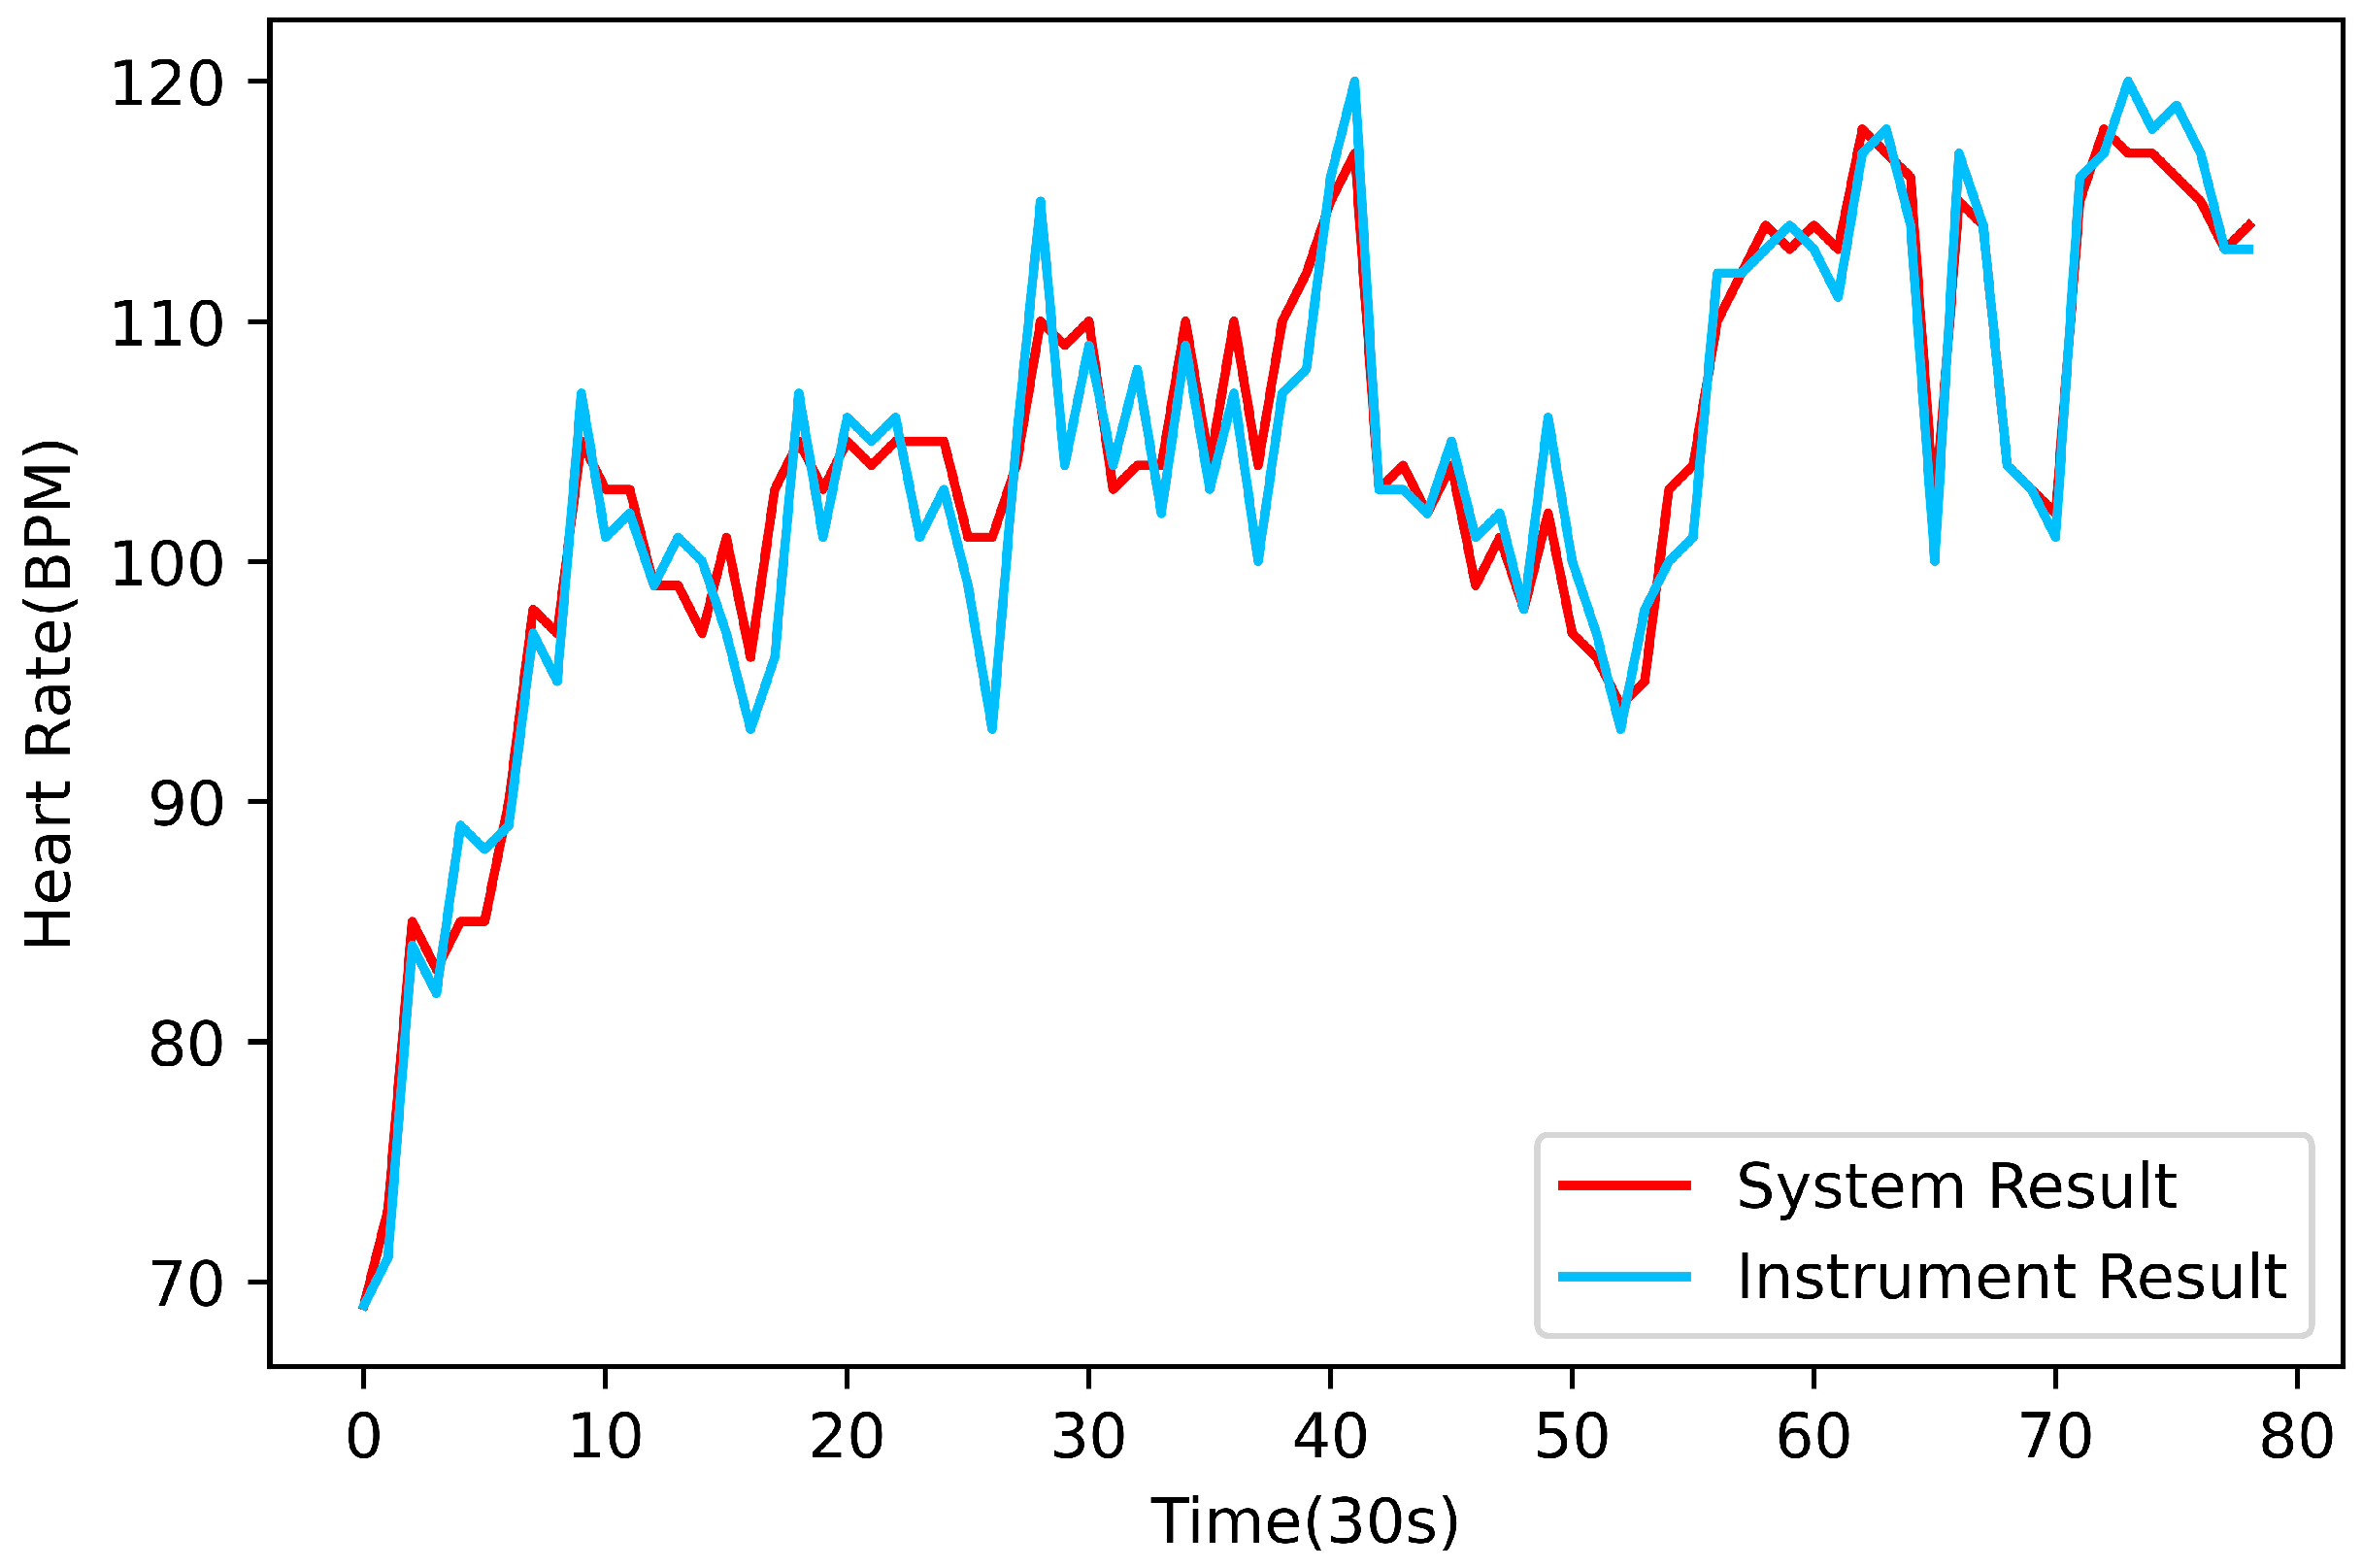
Heart rate measurement is performed by analyzing the peak voltage in the QRS complex [21]. The algorithm finds the index values corresponding to the peak voltages of several consecutive QRS complexes of the ECG signal and then obtains the current heart rate according to the sampling frequency or sampling interval.

2.3.2. Body Surface Temperature Measurement
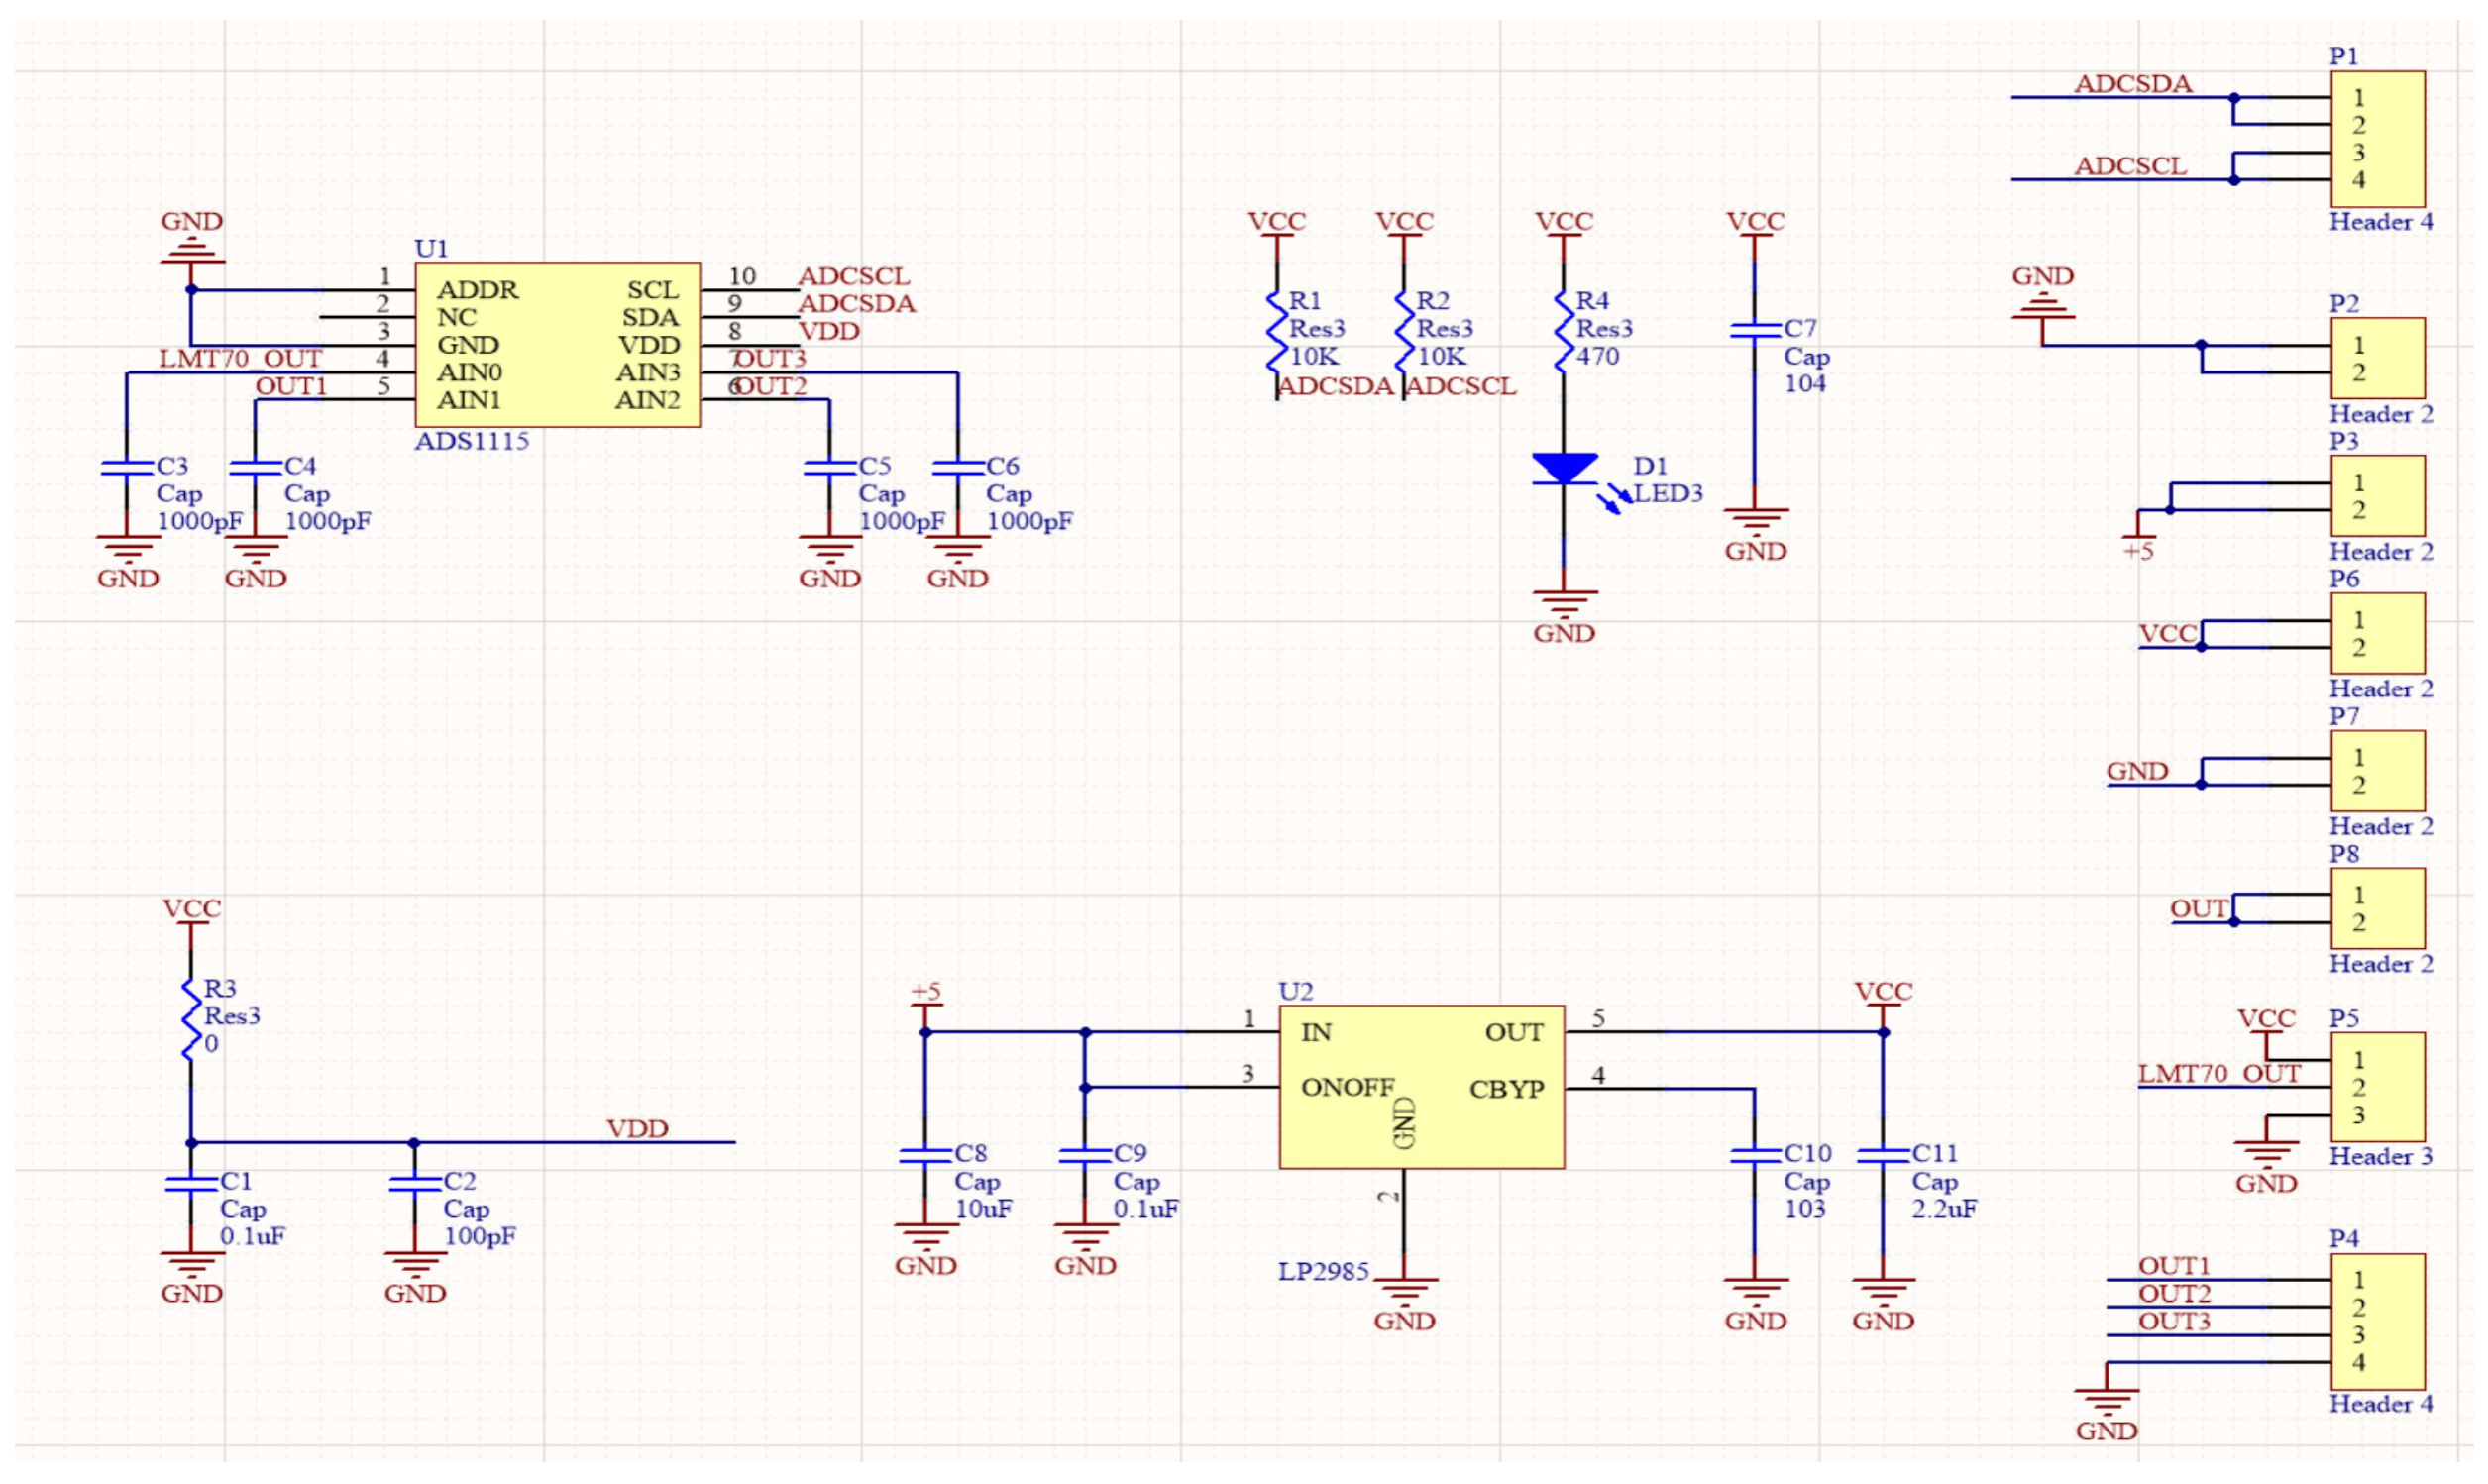
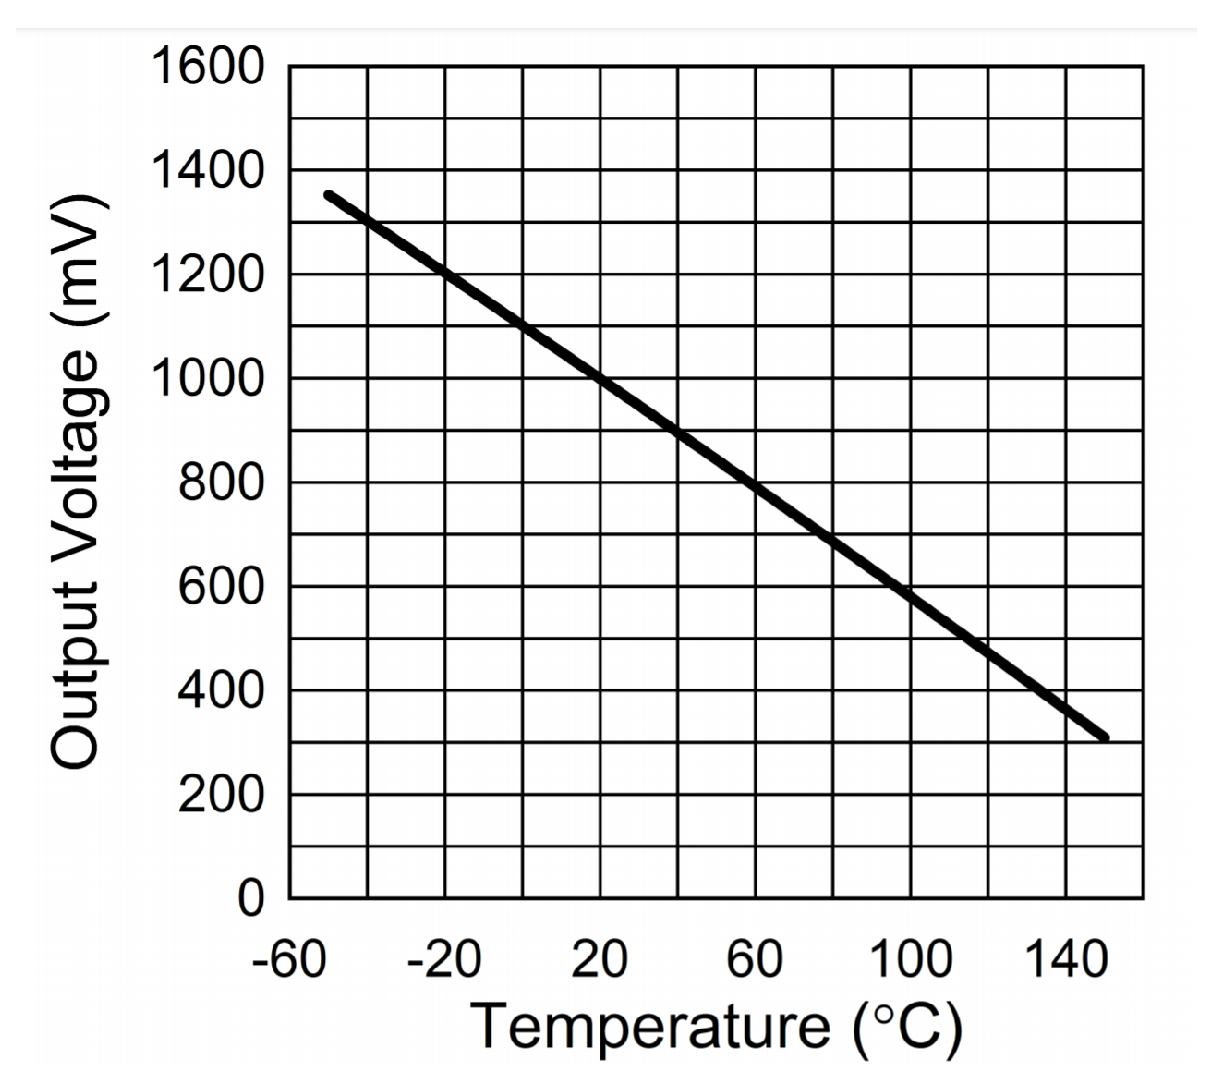
As depicted in Figure 5, the output value of the TAO pin of LMT70 has a negative correlation with temperature:
The relationship between U T A O and ambient temperature can be expressed by the following formula:
d U T A O d T = 5.19   mV / ° C
However, if the task requires an accurate measurement of temperature in the range of 30–40 °C, the linear relationship between voltage and temperature cannot meet the requirements for accuracy. Therefore, it is necessary to fit the voltage value output using the TAO pin with a quadratic polynomial or cubic polynomial in the range of 30–40 °C. When fitting, we use a stable value of the body surface thermometer as the true value of body temperature, measure the stable voltage value output using the sensor composed of LMT70 in the same environment, and then perform polynomial fitting on the voltage and the temperature.
The results of polynomial fitting based on the value of the body surface thermometer and the voltage output by the LMT70 chip in the range of 30–40 °C are as follows:
Quadratic polynomial fitting result:
T = a u T A O 2 + b u T A O + c a = 8.45 × 10 6 , b = 1.76 × 10 1 , c = 2.04 × 10 2
Cubic polynomial fitting result:
T = a u T A O 3 + b u T A O 2 + c u T A O + d a = 1.06 × 10 9 , b = 5.75 × 10 6 , c = 1.79 × 10 1 , d = 2.04 × 10 2

2.3.3. Pose Estimation and Motion Data Measurement

The algorithm combined with a driver program estimates the pose and collects the motion data for MPU6050. MPU6050 can read the three-axis acceleration and three-axis angular velocity information at high speed [22], but the pose information reflecting the human body movement cannot be directly collected and needs to be obtained through the corresponding algorithm. The algorithm selects a quaternion as the pose information to be obtained, and the quaternion can avoid the singularity when three variables are used to represent the pose information.
Quaternions are generally written as follows:
q = q 0 + q 1 i + q 2 j + q 3 k
where i , j , and k are the three imaginary parts of the quaternion.
The quaternion calculation in the microprocessor can be approximated by the Runge–Kutta method with the angular velocity data read by the sensor. In our design, taking into account the real-time need to obtain motion data, the digital motion processor inside the drive module (DMP) solves the quaternion, which reduces the burden of the external processor and avoids cumbersome steps such as filtering and data fusion. At the same time, high-speed and accurate data can be obtained by reading the DMP registers, which can satisfy applications running at lower frequencies. DMP can provide accurate and stable data to update the frequency of the motion data and the frequency of the reading data using an external processor.
The quaternion and acceleration data are sent to the MCU through I2C, and the algorithm for step counting and distance calculation is executed on the MCU. First, the MCU updates the Euler angle in real time according to the quaternion. The Euler angle can more intuitively reflect the real-time motion posture, and the Euler angle is used in step counting and distance calculation.
The formula for calculating Euler angles with quaternion is as follows:
r o l l = arctan 2 q 2 q 3 + 2 q 0 q 1 2 q 1 2 2 q 2 2 + 1 r a d p i t c h = arcsin 2 q 1 q 3 + 2 q 0 q 2 r a d y a w = arctan 2 q 1 q 2 + 2 q 0 q 3 2 q 2 2 2 q 3 2 + 1 r a d
Rad means that the result of the calculation is converted from radians to angles.
For practical applications, the algorithm uses the comparison between the Euler angle change rate and the corresponding threshold to adjust the system’s judgment of the motion state, and 5 ° /s is selected as the threshold.
The overall motion data measurement algorithm has two parts: step counting and distance calculation. The step counting algorithm uses 40 ms as a delay to read the acceleration collected by the accelerometer to calculate the number of steps. The algorithm initially eliminates the noise in the acceleration data through the mean filter [23]. Considering that the acceleration waveform has obvious peaks when people are walking, the algorithm combines the threshold to filter the interference and to save effective fluctuations. The threshold is set to 3.05 × 10 3 g. Next, the algorithm checks the acceleration data of the three axes in accordance with the law of motion. The threshold of the peak difference is set to 6.1 × 10 3 g. Finally, the algorithm combines the current motion state and the detection results of the three axes to count the steps.
In the distance calculation algorithm, we chose to use two-dimensional numerical integration to calculate the distance [24]. First, the Euler angle can express the rotation matrix connecting the world coordinate system and the current coordinate system:
R X Y Z ( r o l l , p i t c h , y a w ) = R Z ( y a w ) R X ( r o l l ) R Y ( p i t c h )
R Z ( y a w ) = cos y sin y 0 sin y cos y 0 0 0 1
R X ( r o l l ) = 1 0 0 0 cos r sin r 0 sin r cos r
R Y ( p i t c h ) = cos p 0 sin p 0 1 0 sin p 0 cos p
The vector in the current coordinate system can be transformed to the world coordinate system through such a matrix:
a x a y a z = R X Y Z a x a y a z
where a x , a y , a z represents the acceleration vector obtained by measurement and a x , a y , a z represents the acceleration transformed to world coordinates.
Finally, the algorithm can obtain the distance in the three-dimensional space through two-dimensional numerical integration. In the calculation process, we used the motion state and other information to process the acceleration and velocity to eliminate the interference from gravity acceleration and noise. In practical applications, walking can be considered movement on a two-dimensional plane, and this approximation is more suitable for the requirements of distance calculation tasks. Under this approximation, the matrix can be degenerated to second order, reducing the burden of calculation including filtering, and finally, the result can be corrected in combination with the step counting information. In the walking round-trip test, this algorithm achieved more accurate results.

3. System Implementation and Results

3.1. System Implementation

The use process of the physiological monitoring system is as follows: connect the system to a 5 V power supply, the MCU automatically initializes after powering on and automatically sets the network parameters for the Wi-Fi module. After the MCU confirms that the network is correctly connected, sampling is performed, and the data sent by each sensor are processed and packaged. The user sticks the three-terminal lead of the ECG signal sensor in the correct position on the body, places the temperature sensor on the wrist, and then fixes the motion sensor on the waist. As shown in Figure 6, after the system is properly initialized, the terminal interface will display the user’s relevant information in real time. Implementation of our system on a subject is shown in Figure 7.

3.2. Data Collection

In order to test the physiological monitoring system developed in this paper, we selected 10 healthy subjects, and all participants signed a consent form. In the experiment, the relevant information of the subjects at rest and in motion was obtained. The basic information of the subjects is shown in Table 1:

3.3. Body Surface Temperature Test Results and Analysis

In order to verify the accuracy of the system to measure body surface temperature, we let the subjects sit quietly on a chair and then activated the physiological monitoring system. We compared the body surface temperature measured by the system with the value measured by the body surface thermometer (model: CK-T1503). The measuring range of the body surface thermometer is 33–40 degrees °C. In the test, we used the monitoring system and the thermometer to collect the body surface temperature of each participant’s wrist 10 times and to calculate the average value (generally, the body surface temperature varies widely) and that at room temperature (25 °C). The body surface temperature may be 2 °C lower than the body temperature); the results are shown in Table 2:
From the experimental results, we can conclude that the maximum absolute error between the body surface temperature measured by the system and the instrument is 0.4 °C, and the average absolute error is 0.21 °C. The results show that the measurement results of the system are close to those of the instrument, which indicates that the system meets the actual measurement requirements.

3.4. ECG Data Test Results and Analysis

3.4.1. ECG Signal Simulator Test Results

We first used the ECG signal simulator to test the accuracy of the system. As shown in Figure 8, the model of the ECG signal simulator was SKX-2000 and the 3 lead modes used by the simulator were LL, LA, and RA. We tested the different heart rates generated by the simulator and observed whether the detection system alerts us to abnormal heart rates (too high or too low). The results are shown in Table 3 and Figure 8, Figure 9 and Figure 10.

3.4.2. Human ECG Signal Test Results

When measuring the actual ECG signal, we let the subjects exercise at a certain intensity to continuously increase their heart rate. At the same time, we used the finger clip heart rate measuring instrument and the monitoring system designed in this paper to record the tester’s heart rate.
As shown in Figure 11, the figure shows the results measured by a subject using a finger clip heart rate tester and the detection system designed in this paper. During the test, the subject’s heart rate continued to rise and fluctuated to a certain extent. Table 4 analyzes the result analysis of the tester and the detection system of this paper. The correlation coefficient of the two equipment detection results is 0.969, the maximum absolute error is 8 BPM, and the absolute error range is 1.924 ± 1.540 BPM. The system design can be seen from the results. The accuracy meets the needs of daily use, indicating that the system is effective and reliable.

3.5. Motion Data Test Results

After the subject wore our detection system, we let the subject walk back and forth on a 5 m band tape to detect the accuracy of the number of steps and distance. The experimental results are shown in Table 5 and Table 6.
The maximum absolute error of the number of steps measured by this system is 3 steps/10 steps, and the average absolute error is 0.66 steps/10 steps. The maximum error of the distance measured by this system is 0.5 m/5 m, and the average absolute error is 0.33 m/5 mm. The experimental results of the number of steps and distance indicate that the system has high measurement accuracy for motion data and is suitable for practical use.

3.6. Power Consumption Measurement Results

We measured the operating currents of different modules of the system when the Wi-Fi module continuously sends and receives data, and the results are shown in Table 7:
It can be concluded from the measurement results that two 2000 mAh dry batteries can make the system work continuously for more than 24 h while continuously sending and receiving data. When the ESP8266 module is turned off and data are transmitted through a wired connection, a lower operating current can be achieved. Therefore, our physiological monitoring system basically meets the needs of low power consumption and high endurance and is suitable for continuous measurement situations.

4. Conclusions

In this paper, we proposed a physiological monitoring system based on multiple sensors. The system can monitor a variety of physiological signals in the human body and can display the collected physiological signals on the terminal in real time. By comparing the system with a standard medical monitor, the accuracy and feasibility of the system are verified. In the temperature data measurement, we performed polynomial fitting correction on the output voltage of the LMT70 to make the temperature module more accurate in the body surface temperature range; in the ECG signal measurement, we collected the bioelectric signal with the ADS1292 chip as the core. The collected ECG signals were processed to reduce the interference of baseline drift on the ECG waveform. The results show that our heart rate test results are very close to medical equipment, and an alarm can be presented when the subject’s heart rate is too high or too low; in the motion data measurement, we used the acceleration and angular velocity data returned by the MPU6050 to calculate the pose and to calculate the distance and the number of steps. At the same time, we tested the power consumption of the system in the case of continuous data transmission and reception. The total current of the system was about 83 mA. When the Wi-Fi module was turned off, the total power consumption of the system was about 15 mA, which meets the requirements of low power consumption. In future research, we will try to improve the portability of the entire system, to integrate other sensors, and to reduce the circuit volume of the existing system. We tried to perform further analysis based on the returned physiological signals, such as monitoring cardiovascular diseases based on the abnormal part of the ECG waveform.

Author Contributions

Conceptualization, H.L.; methodology, H.L.; software, Y.L.; validation, Y.L.; formal analysis, R.Y. and G.S.; investigation, H.L., Y.L., and R.Y.; resources, Y.L.; data curation, R.Y.; writing—original draft preparation, H.L.; writing—review and editing, H.L. and G.S.; visualization, H.L.; supervision, G.S.; project administration, G.S.; funding acquisition, G.S. All authors have read and agreed to the published version of the manuscript.

Funding

This work was supported by the Tianjin Key Laboratory of Optoelectronic Sensor and Sensor Network Technology.

Data Availability Statement

Data available on request due to restrictions eg privacy or ethical.

Acknowledgments

The authors would like to thank all of the editors and anonymous reviewers for their careful reading and insightful remarks.

Conflicts of Interest

The authors declare no conflict of interest.

References

  1. Gam, A.; Gar, B.; Fuster, C.V. The Global Burden of Cardiovascular Diseases and Risk Factors: 2020 and Beyond. J. Am. Coll. Cardiol. 2019, 74, 2529–2532. [Google Scholar] [CrossRef]
  2. 2018 Global Health Care Outlook-The Evolution of Smart Health Care. Available online: https://www2.deloitte.com/content/dam/Deloitte/global/Documents/Life-Sciences-Health-Care/gx-lshc-hc-outlook-2018.pdf (accessed on 11 March 2021).
  3. Shin, D. How do technological properties influence user affordance of wearable technologies? Interact. Stud. 2019, 20, 307–338. [Google Scholar] [CrossRef]
  4. Wu, J.; Wang, F.; Liu, L.; Shin, D. Effect of Online Product Presentation on the Purchase Intention of Wearable Devices: The Role of Mental Imagery and Individualism–Collectivism. Front. Psychol. 2020, 11, 56. [Google Scholar] [CrossRef] [PubMed] [Green Version]
  5. Kim, K.J.; Shin, D.H.; Yoon, H. Information tailoring and framing in wearable health communication. Inf. Process. Manag. 2017, 53, 351–358. [Google Scholar] [CrossRef]
  6. Kim, K.J.; Shin, D. An acceptance model for smart watches: Implications for the adoption of future wearable technology. Internet Res. Electron. Netw. Appl. Policy 2015, 25. [Google Scholar] [CrossRef]
  7. Mostafa, H.; Kerstin, T.; Regina, S. Wearable Devices in Medical Internet of Things: Scientific Research and Commercially Available Devices. Healthc. Inform. Res. 2017, 23, 4–15. [Google Scholar] [CrossRef]
  8. Chételat, O.; Oster, J.; Grossenbacher, O.; Hutter, A.; Krauss, J.; Giannakis, A. A highly integrated wearable multi-parameter monitoring system for athletes. In Proceedings of the 15th Nordic-Baltic Conference on Biomedical Engineering and Medical Physics (NBC 2011), Aalborg, Denmark, 14–17 June 2011; Springer: Berlin/Heidelberg, Germany, 2011; pp. 148–151. [Google Scholar] [CrossRef]
  9. Liu, J.; Xie, F.; Zhou, Y.; Zou, Q.; Wu, J. A wearable health monitoring system with multi-parameters. In Proceedings of the 2013 6th International Conference on Biomedical Engineering and Informatics, Hangzhou, China, 16–18 December 2013; pp. 332–336. [Google Scholar] [CrossRef]
  10. Wasimuddin, M.; Elleithy, K.; Abuzneid, A.; Faezipour, M.; Abuzaghleh, O. Multiclass ECG Signal Analysis Using Global Average-Based 2-D Convolutional Neural Network Modeling. Electronics 2021, 10, 170. [Google Scholar] [CrossRef]
  11. Jung, J.; Shin, S.; Kang, M.; Kang, K.H.; Kim, Y.T. Development of Wearable Wireless Electrocardiogram Detection System using Bluetooth Low Energy. Electronics 2021, 10, 608. [Google Scholar] [CrossRef]
  12. Xu, C.; He, J.; Zhang, X.; Zhou, X.; Duan, S. Towards Human Motion Tracking: Multi-Sensory IMU/TOA Fusion Method and Fundamental Limits. Electronics 2019, 8, 142. [Google Scholar] [CrossRef] [Green Version]
  13. Coates, J.; Chipperfield, A.; Clough, G. Wearable Multimodal Skin Sensing for the Diabetic Foot. Electronics 2016, 5, 45. [Google Scholar] [CrossRef] [Green Version]
  14. MSP430F552x, MSP430F551x Mixed-Signal Microcontrollers Datasheet (Rev. P). Available online: https://www.ti.com/lit/ds/symlink/msp430f5529.pdf (accessed on 11 March 2021).
  15. ADS129x Low-Power, 2-Channel, 24-Bit Analog Front-End for Biopotential Measurements Datasheet (Rev. C). Available online: https://www.ti.com/lit/ds/symlink/ads1292.pdf (accessed on 11 March 2021).
  16. LMT70, LMT70A ±0.05 °C Precision Analog Temperature Sensor, RTD and Precision NTC Thermistor IC Datasheet (Rev. A). Available online: https://www.ti.com/lit/ds/symlink/lmt70.pdf (accessed on 11 March 2021).
  17. Costa, R.; Winkert, T.; Manhães, A.; Teixeira, J.P. QRS Peaks, P and T Waves Identification in ECG. Procedia Comput. Sci. 2021, 181, 957–964. [Google Scholar] [CrossRef]
  18. Bao, X.; Abdala, A.K.; Kamavuako, E.N. Estimation of the Respiratory Rate from Localised ECG at Different Auscultation Sites. Sensors 2021, 21, 78. [Google Scholar] [CrossRef] [PubMed]
  19. Zhang, F.; Tang, X.; Tong, A.; Wang, B.; Wang, J. An Automatic Baseline Correction Method Based on the Penalized Least Squares Method. Sensors 2020, 20, 15. [Google Scholar] [CrossRef] [Green Version]
  20. Husain, K.; Mohd Zahid, M.S.; Ul Hassan, S.; Hasbullah, S.; Mandala, S. Advances of ECG Sensors from Hardware, Software and Format Interoperability Perspectives. Electronics 2021, 10, 105. [Google Scholar] [CrossRef]
  21. Nasim, A.; Sbrollini, A.; Morettini, M.; Burattini, L. Extended Segmented Beat Modulation Method for Cardiac Beat Classification and Electrocardiogram Denoising. Electronics 2020, 9, 1178. [Google Scholar] [CrossRef]
  22. Znamenshchykov, Y.; Shkyrya, Y.; Nekrasov, S.; Dovhopolov, A. Determination of the angle of the device inclination relative to the horizon using a measuring system based on the MPU6050 microelectromechanical sensor. In Bulletin of the National Technical University «KhPI» Series New Solutions in Modern Technologies; National Technical University “Kharkiv Polytechnic Institute”: Kharkiv Oblast, Ukraine, 2020; pp. 65–70. [Google Scholar] [CrossRef]
  23. Mitschke, C.; Kiesewetter, P.; Milani, T.L. The Effect of the Accelerometer Operating Range on Biomechanical Parameters: Stride Length, Velocity, and Peak Tibial Acceleration during Running. Sensors 2018, 18, 130. [Google Scholar] [CrossRef] [Green Version]
  24. Ojeda, L.; Borenstein, J. Non-GPS navigation with the personal dead-reckoning system—Art. no. 65610C. Proc. SPIE Int. Soc. Opt. Eng. 2007, 1. [Google Scholar] [CrossRef] [Green Version]
Figure 1. The architecture of the wireless physiological monitoring system.
Electronics 10 00986 g001
Figure 2. The circuit design of ECG signal sensor module.
Electronics 10 00986 g002
Figure 3. The circuit design of the body surface temperature sensor module.
Electronics 10 00986 g003
Figure 4. Overall algorithm diagram.
Electronics 10 00986 g004
Figure 5. Output characteristic curve of LMT70.
Electronics 10 00986 g005
Figure 6. User interface on a mobile terminal.
Electronics 10 00986 g006
Figure 7. System implementation on one subject’s body.
Electronics 10 00986 g007
Figure 8. The output heart rate of the ECG simulator is 40 BPM, which simulates the condition of a low heart rate, and the system LED lights up as an alarm.
Electronics 10 00986 g008
Figure 9. The output heart rate of the ECG simulator is 110 BPM, which simulates the condition of a high heart rate, and the system LED lights up as an alarm.
Electronics 10 00986 g009
Figure 10. The output heart rate of the ECG simulator is 80 BPM, which simulates the normal condition of the heart rate, and the system does not set off an alarm.
Electronics 10 00986 g010
Figure 11. The results of the finger clip heart rate instrument and the monitoring system designed in this paper.
Electronics 10 00986 g011
Table 1. Basic information of the subjects.
SubjectsGenderAge
S1Male20
S2Male21
S3Female20
S4Male23
S5Male26
S6Male25
S7Female23
S8Male20
S9Male19
S10Female21
Table 2. Body surface temperature test results.
SubjectsCK-T1503/°COur System/°CError/°C
S133.833.9+0.1
S233.433.1−0.3
S333.633.7+0.1
S433.734.1+0.4
S533.533.3−0.2
S633.333.4+0.1
S732.933.2+0.3
S833.633.4−0.2
S933.433.40
S1033.533.2−0.4
Table 3. ECG signal simulator test results.
Simulator Output/BPMOur System/BPMError/BPMAlarm
40400Y
50500Y
60600N
70700N
80800N
90900N
1001000N
1101100Y
1201200Y
1301300Y
Table 4. ECG signal simulator test results.
ParametersTest Result
Maximum absolute error8 BPM
Average absolute error1.92 BPM
Standard deviation of absolute error1.54 BPM
Correlation coefficient0.9699
Table 5. Movement steps measurement result.
Experiment NumberReal Steps/StepSystem Result/StepError Step/10 Steps
10100
2021+1
13032+1
40420
5053+1
6062−1
10100
20200
23033+3
4042−1
50520
6061−1
109−1
2020+1
33031+1
40410
5050−1
60600
Table 6. Movement distance measurement result.
Experiment NumberReal Distance/mSystem Result/mError m/5 m
5.05.1+0.1
10.010.5+0.4
115.015.7+0.2
20.021.0+0.3
25.025.5−0.4
30.031.0+0.5
5.05.2+0.2
10.010.4+0.2
215.015.9+0.5
20.021.4+0.5
25.026.0−0.6
30.031.5+0.5
5.04.8−0.2
10.09.80
315.015.2+0.4
20.020.5+0.3
25.025.9+0.4
30.030.5−0.4
Table 7. System power consumption data.
ModuleCurrent
ESP8266 (Continuously send and receive data)68 mA
ECG sensor and temperature sensorAbout 12 mA
MPU60501.3 mA
Total currentAbout 83 mA
Publisher’s Note: MDPI stays neutral with regard to jurisdictional claims in published maps and institutional affiliations.

