
A Web-Based Tool for Automatic Detection and Visualization of DNA Differentially Methylated Regions


Abstract
1. Introduction
2. Related Work
3. Materials and Methods
3.1. Infrastructure
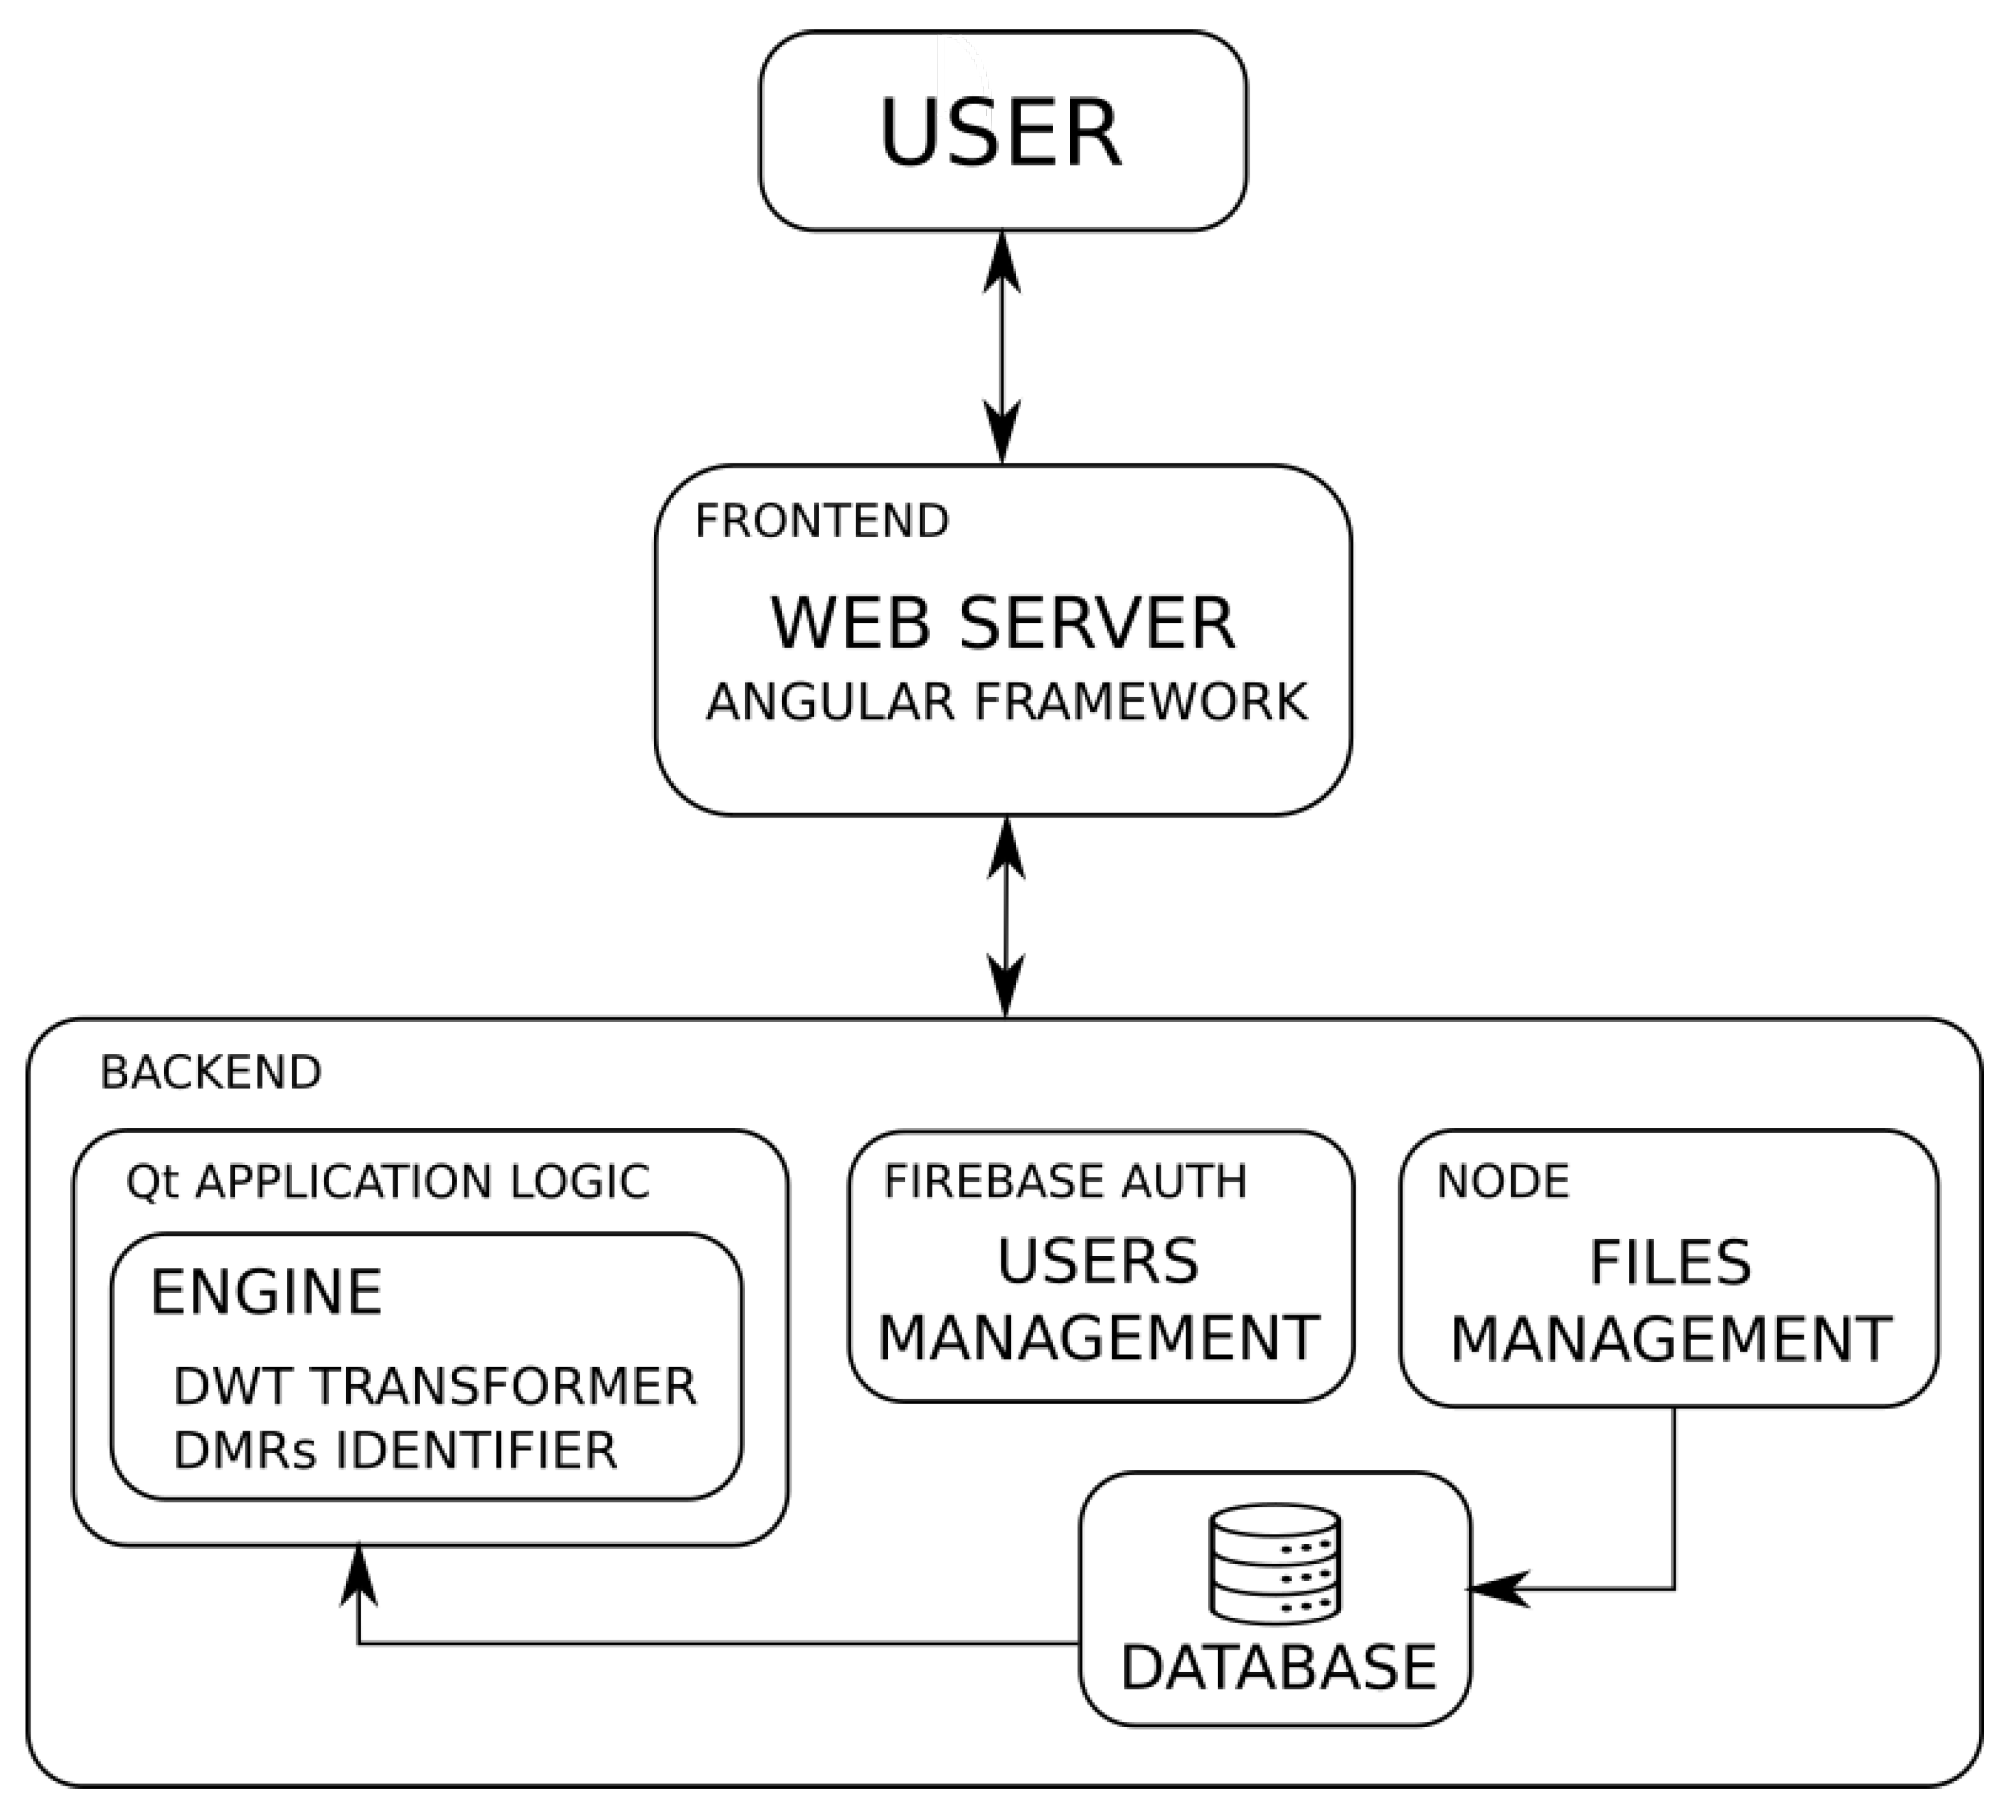
3.2. Architecture
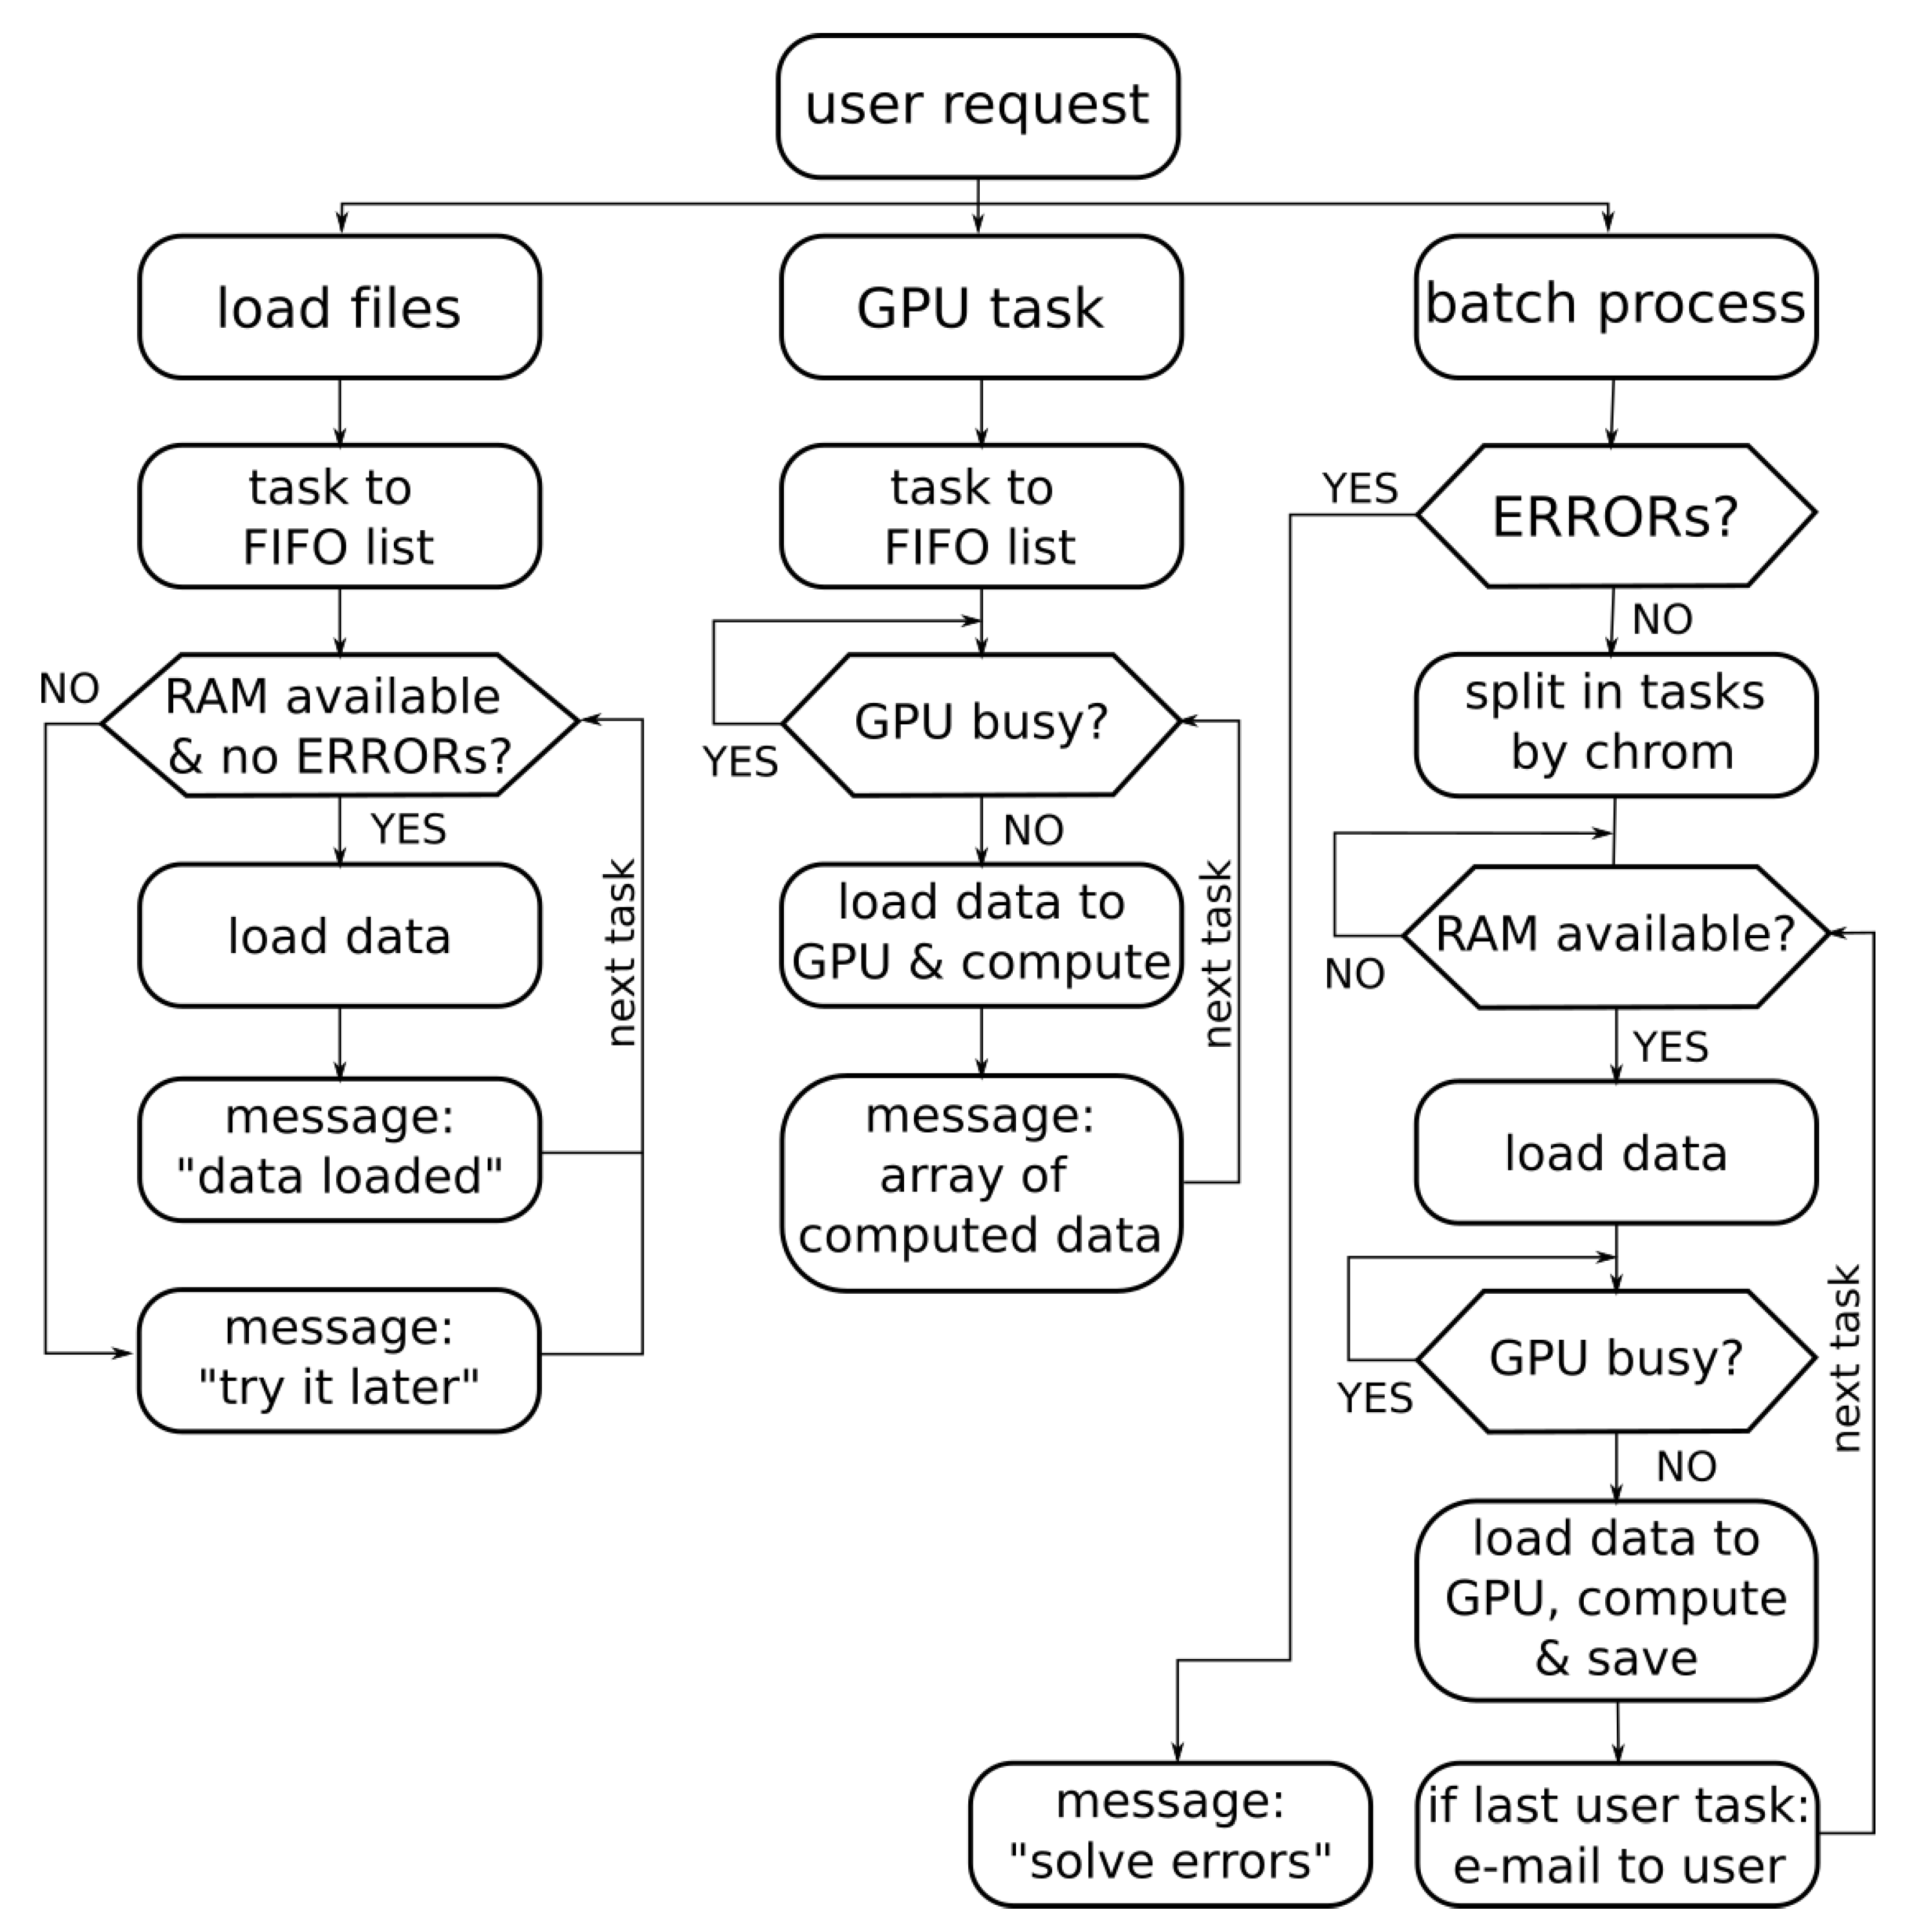
3.3. Concurrent Access
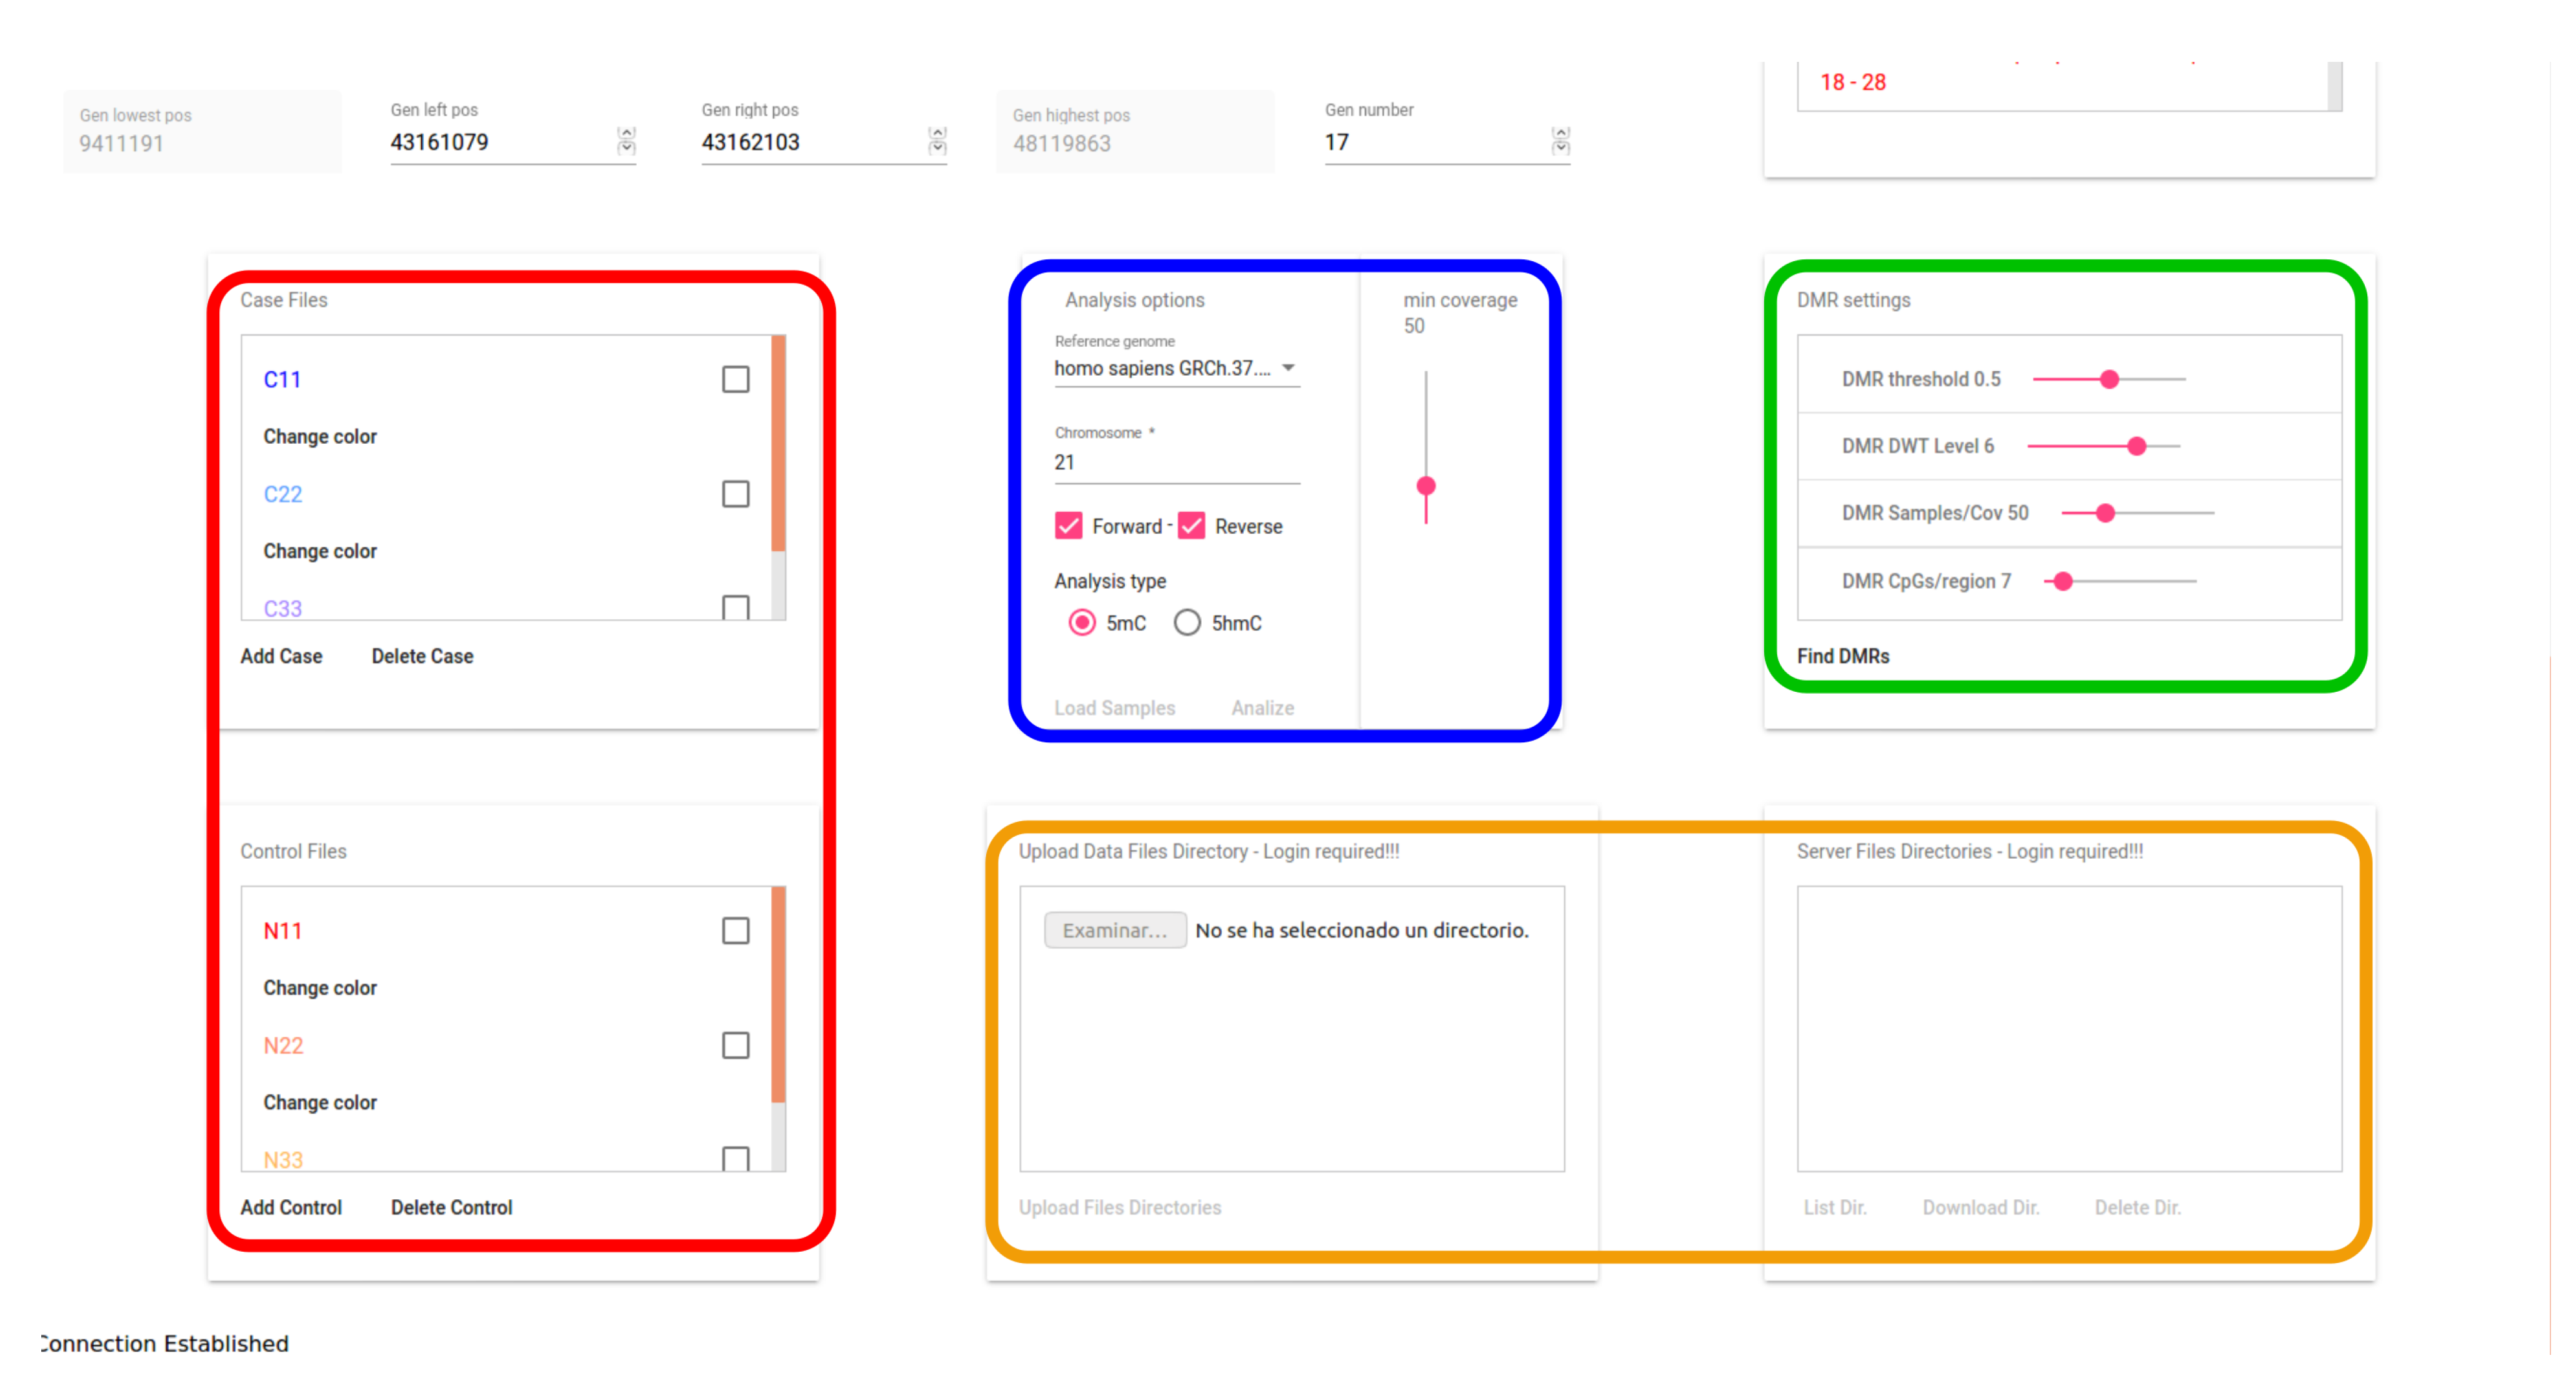
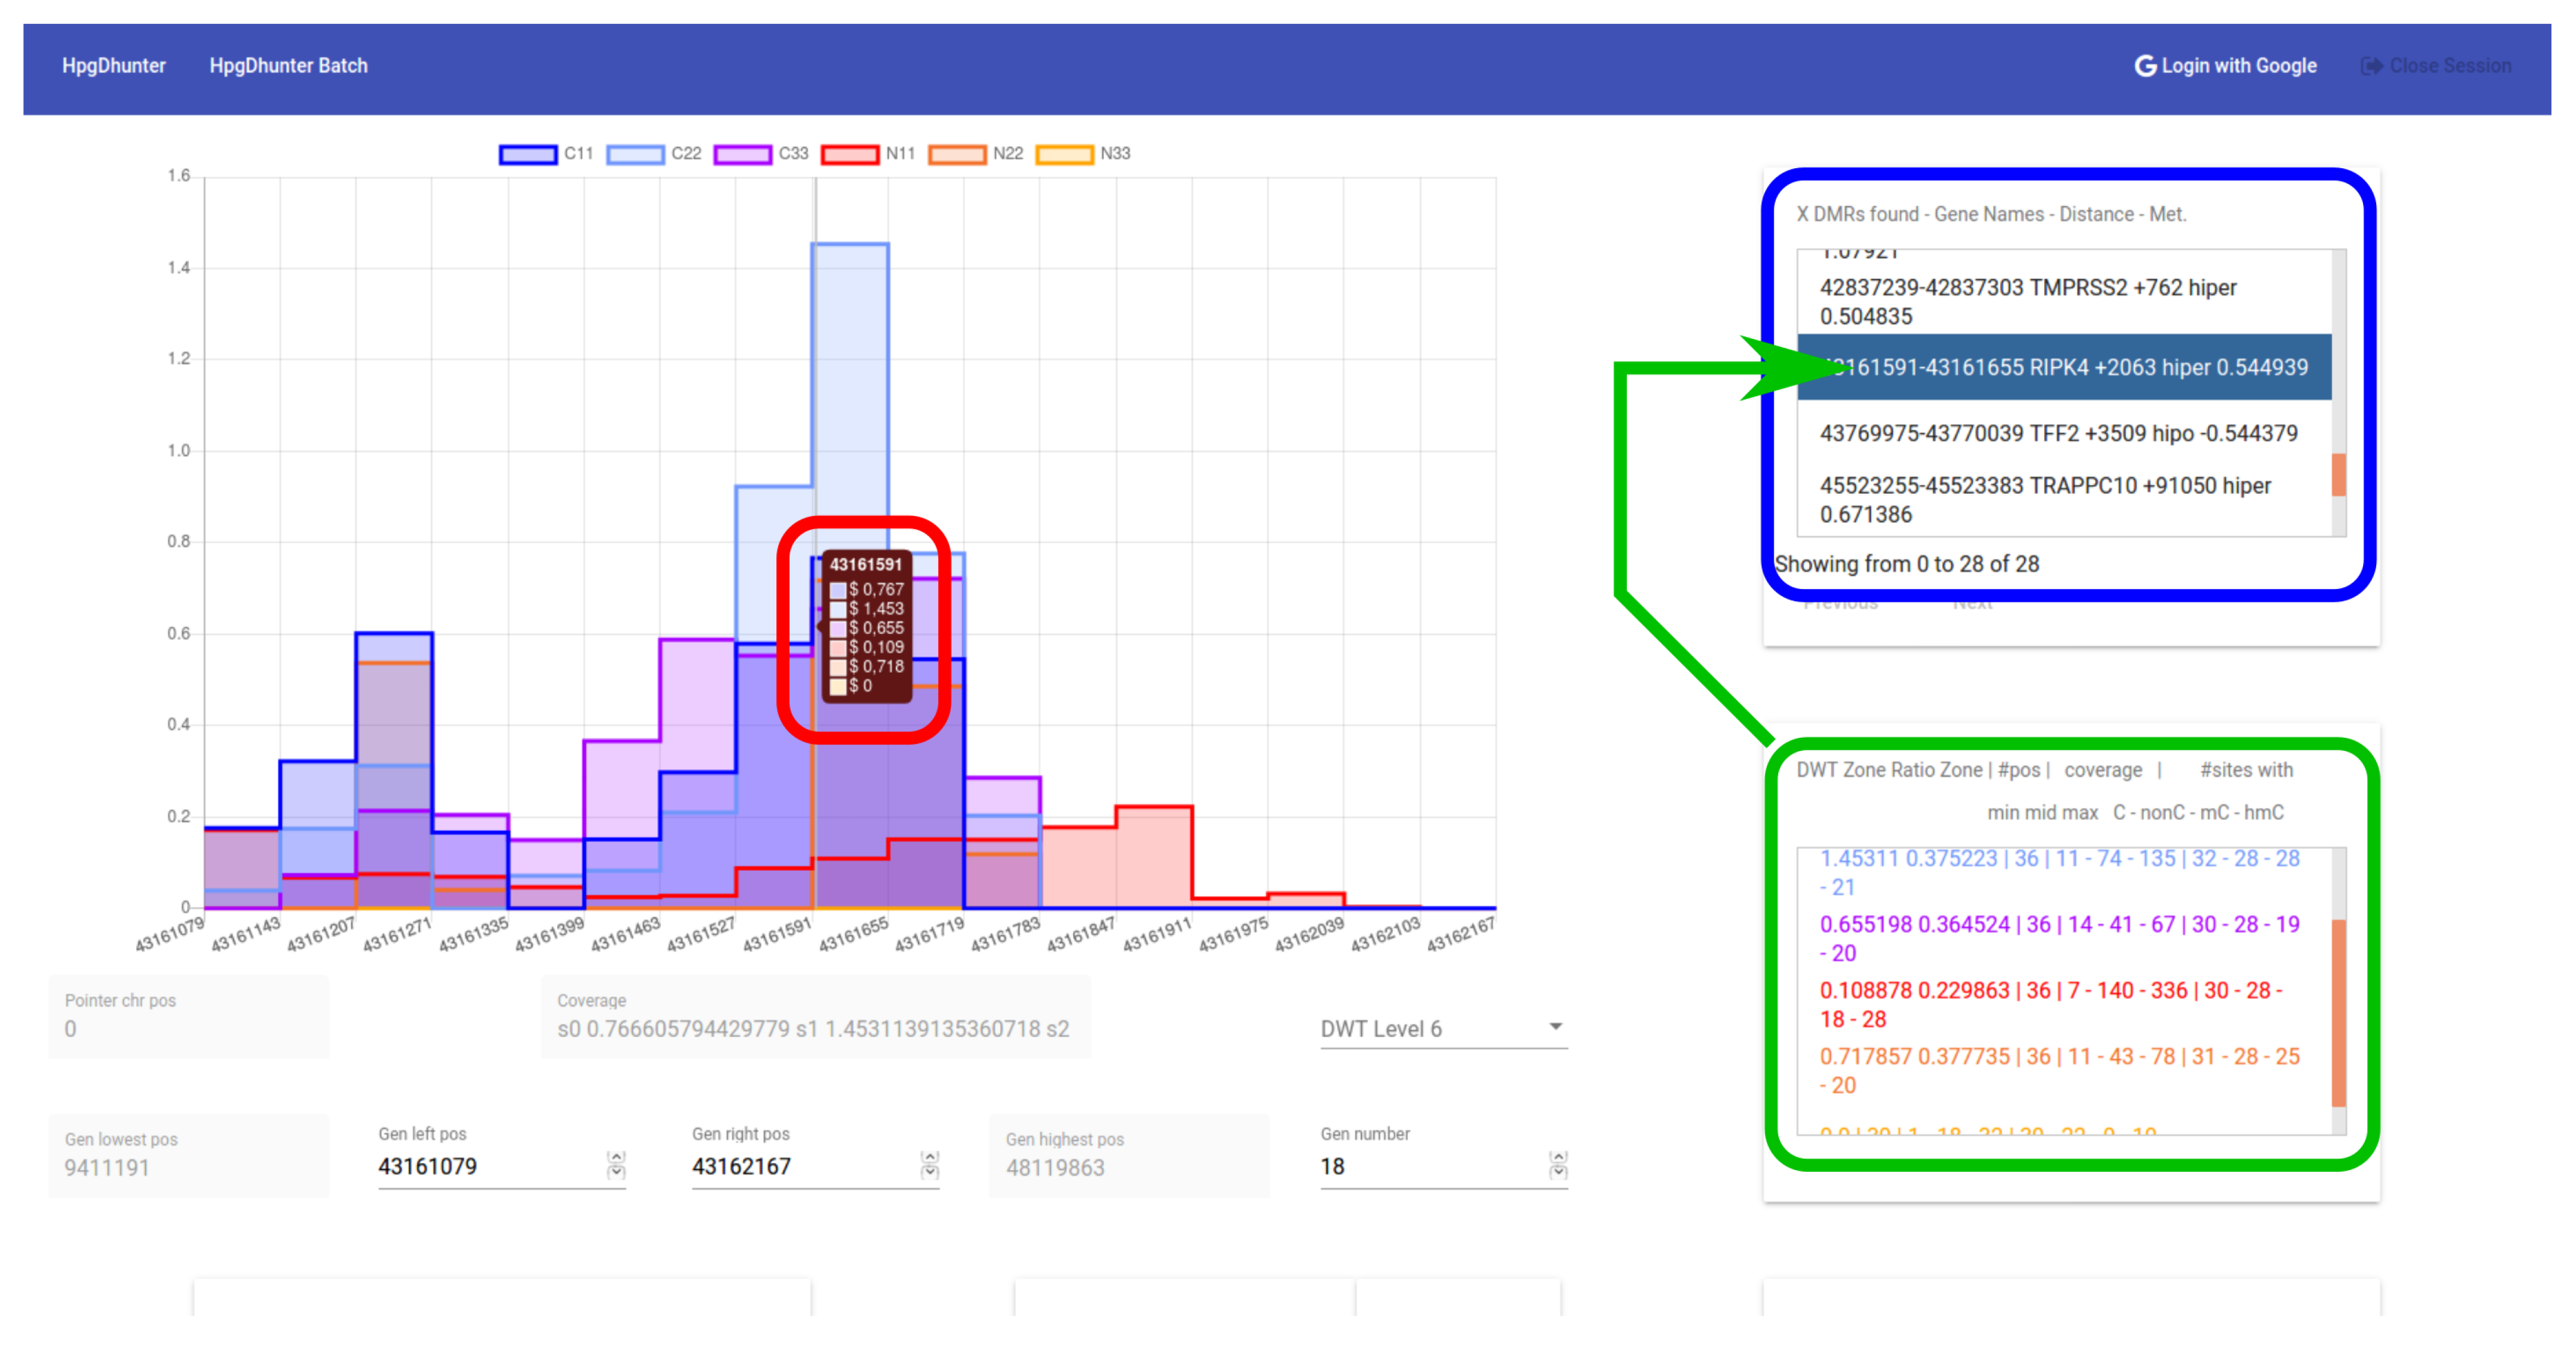
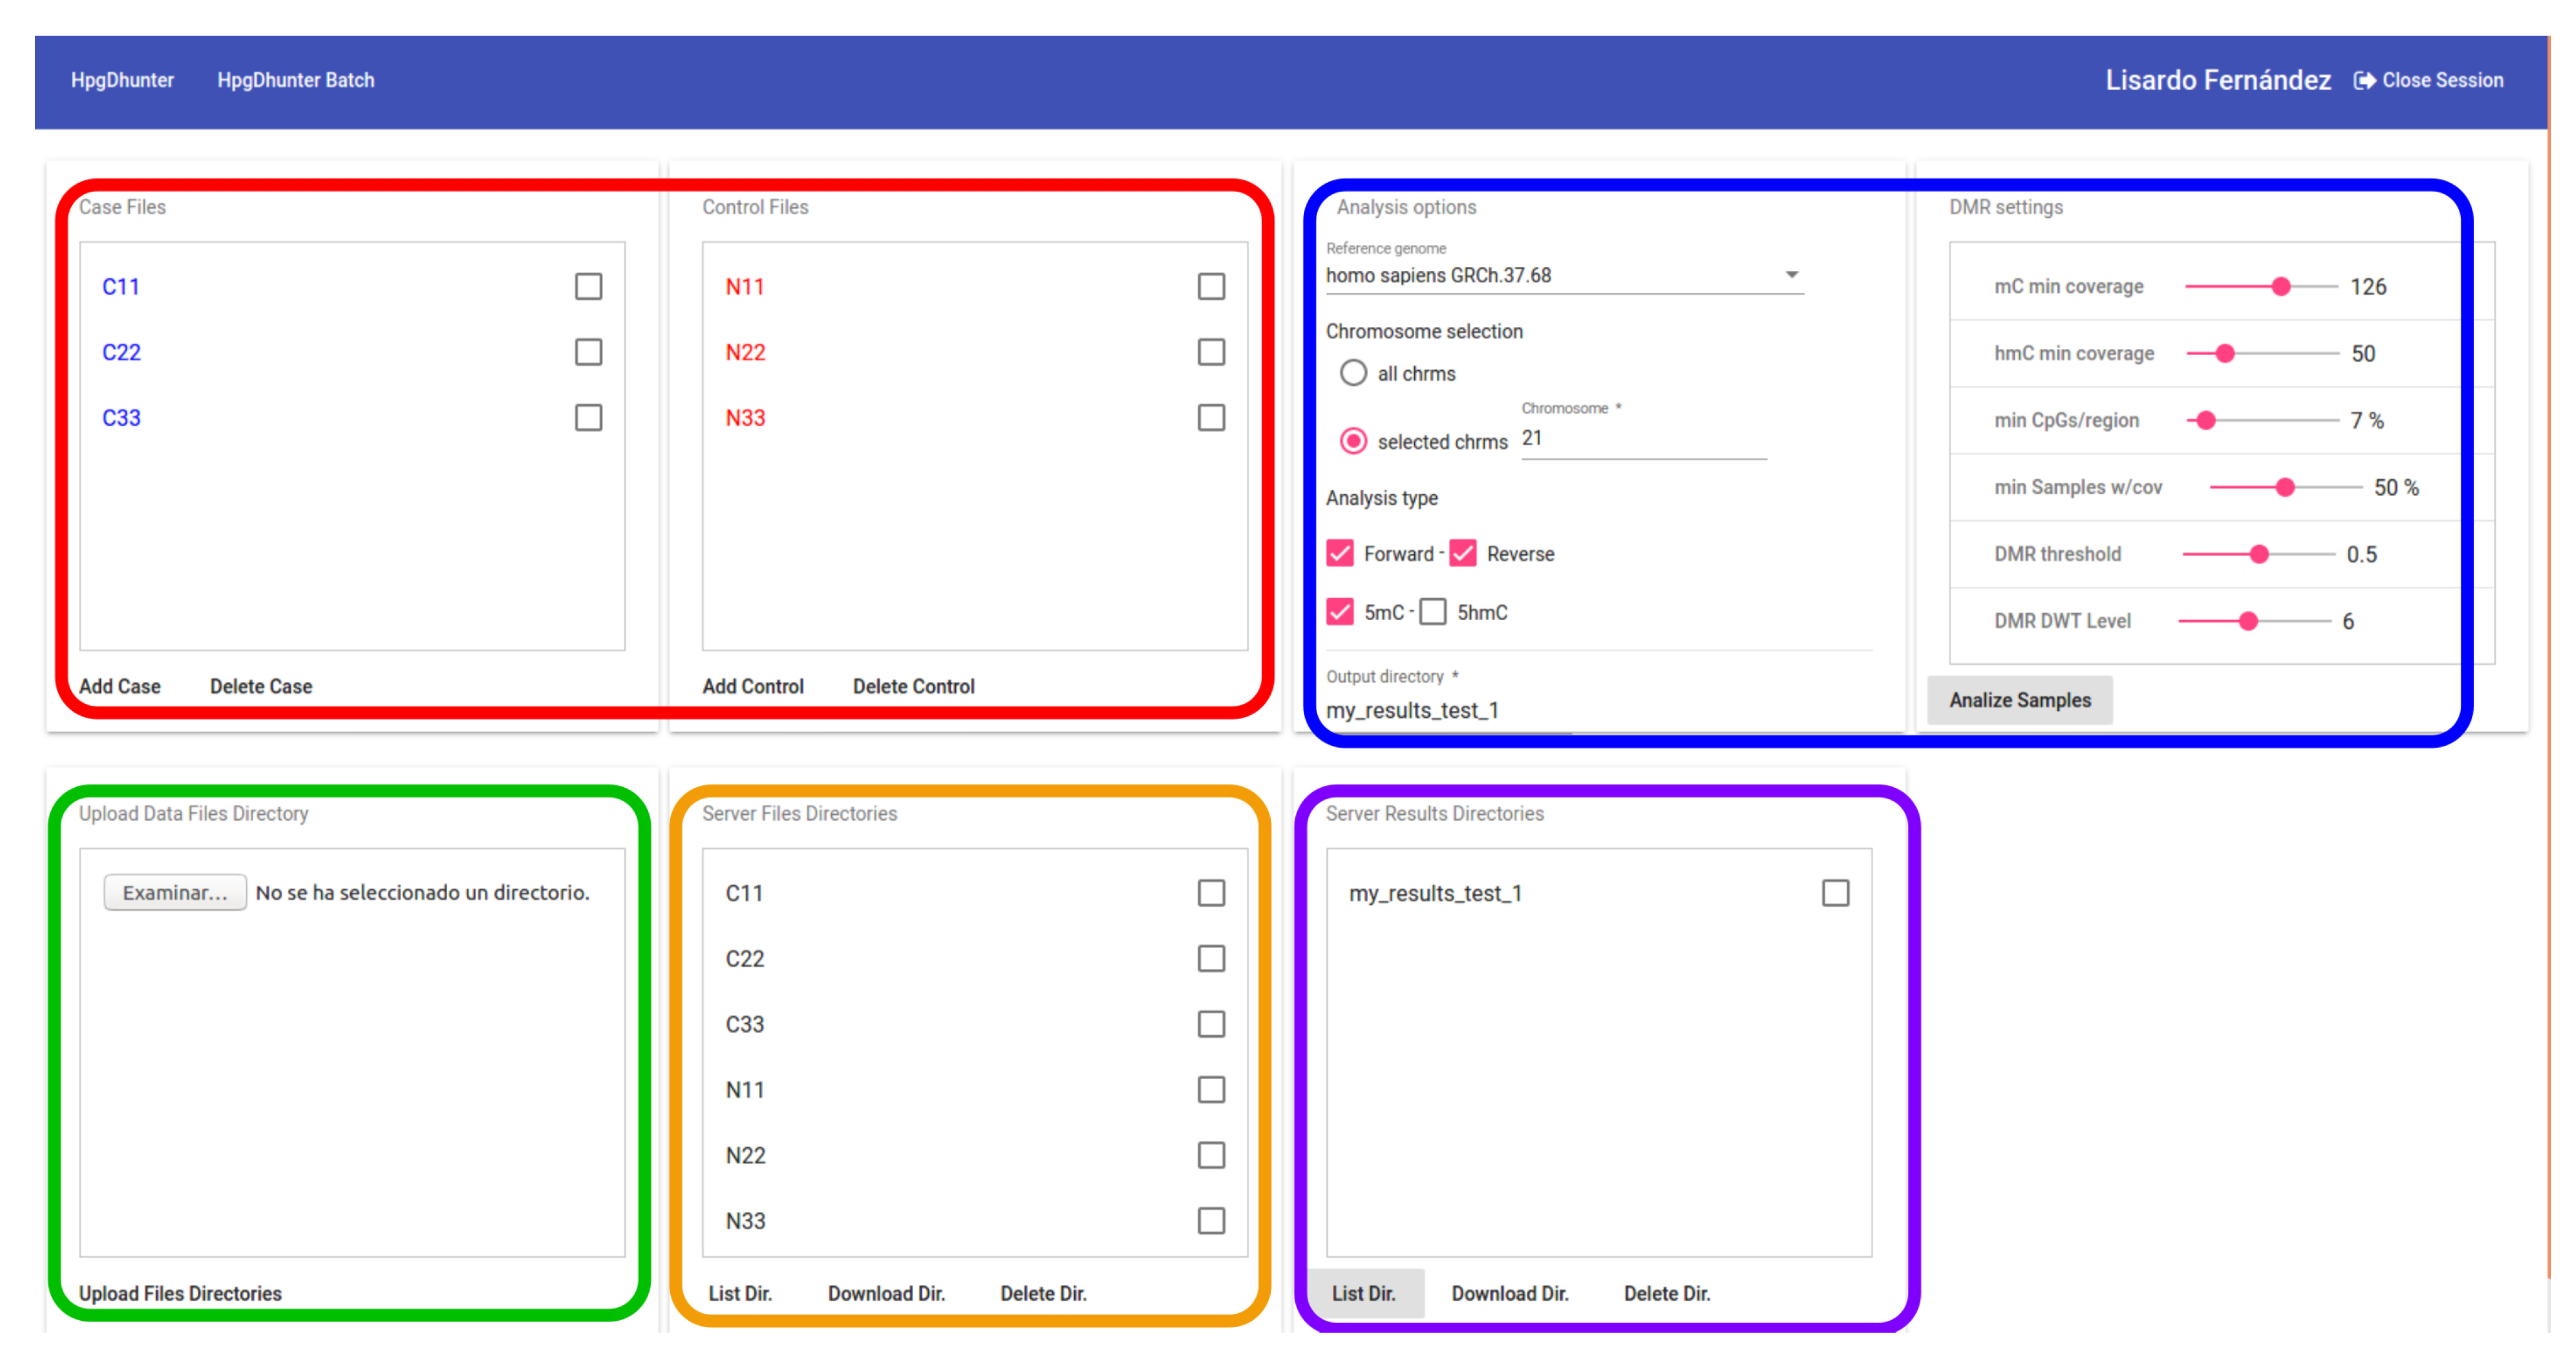
3.4. User Interface
4. Results and Discussion
5. Conclusions
Author Contributions
Funding
Conflicts of Interest
Abbreviations
| CGH | Comparative Genomic Hybridization |
| CRISPR | Clustered Regularly Interspaced Palindromic Repeats |
| DMR | Differentially Methylated Region |
| DNA | DeoxyriboNucleic Acid |
| DWT | Discrete Wavelet Transform |
| GO | Gene Ontology |
| GPU | Graphics Processing Unit |
| SOA | Service Oriented Architecture |
| PCR | Polymerase Chain Reaction |
References
- Bird, A. DNA methylation patterns and epigenetic memory. Genes Dev. 2002, 16, 6–21. [Google Scholar] [CrossRef]
- Jones, P.A.; Takai, D. The Role of DNA Methylation in Mammalian Epigenetics. Science 2001, 293, 1068–1070. [Google Scholar] [CrossRef]
- Wu, H.; Tao, J.; Sun, Y.E. Regulation and function of mammalian DNA methylation patterns: A genomic perspective. Brief. Funct. Genom. 2012, 11, 240–250. [Google Scholar] [CrossRef]
- Jones, P.A. Functions of DNA methylation: Islands, start sites, gene bodies and beyond. Nat. Rev. Genet. 2013, 13, 484–492. [Google Scholar] [CrossRef]
- Laird, P.W. Principles and challenges of genome-wide DNA methylation analysis. Nat. Rev. Genet. 2010, 11, 191–203. [Google Scholar] [CrossRef]
- Krueger, F.; Andrews, S.R. Bismark: A flexible aligner and methylation caller for Bisulfite-Seq applications. Bioinformatics 2011, 27, 1571–1572. [Google Scholar] [CrossRef] [PubMed]
- Chen, P.Y.; Cokus, S.; Pellegrini, M. BS Seeker: Precise mapping for bisulfite sequencing. BMC Bioinform. 2010, 11, 203. [Google Scholar] [CrossRef]
- Harris, E.Y.; Ponts, N.; Le Roch, K.G.; Lonardi, S. BRAT-BW: Efficient and accurate mapping of bisulfite-treated reads. Bioinformatics 2012, 28, 1795–1796. [Google Scholar] [CrossRef] [PubMed]
- Olanda, R.; Pérez, M.; Orduña, J.M.; Tárraga, J.; Dopazo, J. A new parallel pipeline for DNA methylation analysis of long reads datasets. BMC Bioinform. 2017, 18, 161. [Google Scholar] [CrossRef]
- Hansen, K.D.; Langmead, B.; Irizarry, R.A. BSmooth: From whole genome bisulfite sequencing reads to differentially methylated regions. Genome Biol. 2012, 13, R83. [Google Scholar] [CrossRef]
- Hebestreit, K.; Dugas, M.; Klein, H.U. Detection of significantly differentially methylated regions in targeted bisulfite sequencing data. Bioinformatics 2013, 29, 1647–1653. [Google Scholar] [CrossRef]
- Sun, D.; Xi, Y.; Rodriguez, B.; Park, H.J.; Tong, P.; Meong, M.; Goodell, M.A.; Li, W. MOABS: Model based analysis of bisulfite sequencing data. Genome Biol. 2014, 15, R38. [Google Scholar] [CrossRef]
- Wu, H.; Xu, T.; Feng, H.; Chen, L.; Li, B.; Yao, B.; Qin, Z.; Jin, P.; Conneely, K.N. Detection of differentially methylated regions from whole-genome bisulfite sequencing data without replicates. Nucleic Acids Res. 2015, 43, e141. [Google Scholar] [CrossRef]
- Shafi, A.; Mitrea, C.; Nguyen, T.; Draghici, S. A survey of the approaches for identifying differential methylation using bisulfite sequencing data. Brief. Bioinform. 2018, 19, 737–753. [Google Scholar] [CrossRef]
- Xie, C.; Leung, Y.K.; Chen, A.; Long, D.X.; Hoyo, C.; Ho, S.M. Differential methylation values in differential methylation analysis. Bioinformatics 2018, 35, 1094–1097. [Google Scholar] [CrossRef]
- Catoni, M.; Tsang, J.M.; Greco, A.P.; Zabet, N. DMRcaller: A versatile R/Bioconductor package for detection and visualization of differentially methylated regions in CpG and non-CpG contexts. Nucleic Acids Res. 2018, 46, e114. [Google Scholar] [CrossRef]
- Blume, A. methylKit, DNA methylation analysis from high-throughput bisulfite sequencing data. Genome Biol. 2018. [Google Scholar] [CrossRef]
- Fernández, L.; Pérez, M.; Orduña, J.M. Visualization of DNA methylation results through a GPU-based parallelization of the wavelet transform. J. Supercomput. 2019, 75, 1496–1509. [Google Scholar] [CrossRef]
- Fernández, L.; Pérez, M.; Olanda, R.; Orduña, J.M.; Marquez-Molins, J. HPG-DHunter: An ultrafast, friendly tool for DMR detection and visualization. BMC Bioinform. 2020, 21, 287. [Google Scholar] [CrossRef]
- Wang, Z.; Li, X.; Jiang, Y.; Shao, Q.; Liu, Q.; Chen, B.; Huang, D. swDMR: A Sliding Window Approach to Identify Differentially Methylated Regions Based on Whole Genome Bisulfite Sequencing. PLoS ONE 2015, 10, e0132866. [Google Scholar] [CrossRef]
- Liu, H.; Liu, X.; Zhang, S.; Lv, J.; Li, S.; Shang, S.; Jia, S.; Wei, Y.; Wang, F.; Su, J.; et al. Systematic identification and annotation of human methylation marks based on bisulfite sequencing methylomes reveals distinct roles of cell type-specific hypomethylation in the regulation of cell identity genes. Nucleic Acids Res. 2016, 44, gkv1332. [Google Scholar] [CrossRef]
- Müller, F.; Scherer, M.; Assenov, Y.; Lutsik, P.; örn Walter, J.; Lengauer, T.; Bock, C. RnBeads 2.0: Comprehensive analysis of DNA methylation data. Genome Biol. 2019, 20, 55. [Google Scholar] [CrossRef]
- Kuo, H.C.; Lin, P.Y.; Chung, T.C.; Chao, C.M.; Lai, L.C.; Tsai, M.H.; Chuang, E.Y. DBCAT: Database of CpG Islands and Analytical Tools for Identifying Comprehensive Methylation Profiles in Cancer Cells. J. Comput. Biol. 2011, 18, 113–1017. [Google Scholar] [CrossRef]
- Illumina DRAGEN Bio-IT Platform. Available online: https://www.illumina.com/products/by-type/informatics-products/dragen-bio-it-platform.html (accessed on 30 April 2021).
- Qlucore Omics Explorer—Analysis of DNA Methylation Data. Available online: https://qlucore.com/dnamethylation (accessed on 30 April 2021).
- Al-Shahrour, F.; Minguez, P.; Vaquerizas, J.M.; Conde, L.; Dopazo, J. BABELOMICS: A suite of web tools for functional annotation and analysis of groups of genes in high-throughput experiments. Nucleic Acids Res. 2005, 33, W460–W464. [Google Scholar] [CrossRef]
- Yang, J.H.; Kim, B.W.; Nam, S.J.; Kwon, Y.; Lee, D.H.; Lee, J.Y.; Hwang, C.S.; Lee, Y.H.; Hwang, S.H.; Park, I.C.; et al. MetaCore: An application-specific programmable DSP development system. IEEE Trans. Very Large Scale Integr. Syst. 2000, 8, 173–183. [Google Scholar] [CrossRef]
- Blankenberg, D.; Kuster, G.V.; Coraor, N.; Ananda, G.; Lazarus, R.; Mangan, M.; Nekrutenko, A.; Taylor, J. Galaxy: A web-based genome analysis tool for experimentalists. Curr. Protoc. Mol. Biol. 2010, 89, 19.10.1–19.10.21. [Google Scholar] [CrossRef]
- Antonov, A.V.; Schmidt, T.; Wang, Y.; Mewes, H.W. ProfCom: A web tool for profiling the complex functionality of gene groups identified from high-throughput data. Nucleic Acids Res. 2008, 36, 347. [Google Scholar] [CrossRef]
- Zheng, Q.; Wang, X.J. GOEAST: A web-based software toolkit for Gene Ontology enrichment analysis. Nucleic Acids Res. 2008, 36, W358–W363. [Google Scholar] [CrossRef]
- Rainer, J.; Sanchez-Cabo, F.; Stocker, G.; Sturn, A.; Trajanoski, Z. CARMAweb: Comprehensive R- and bioconductor-based web service for microarray data analysis. Nucleic Acids Res. 2006, 34, W498–W503. [Google Scholar] [CrossRef]
- Carver, T.; Thomson, N.; Bleasby, A.; Berriman, M.; Parkhill, J. DNAPlotter: Circular and linear interactive genome visualization. Bioinformatics 2009, 25, 119–120. [Google Scholar] [CrossRef]
- Derrien, T.; André, C.; Galibert, F.; Hitte, C. AutoGRAPH: An interactive web server for automating and visualizing comparative genome maps. Bioinformatics 2007, 23, 498–499. [Google Scholar] [CrossRef][Green Version]
- Adler, P.; üri Reimand, J.; Jänes, J.; Kolde, R.; Peterson, H.; Vilo, J. KEGGanim: Pathway animations for high-throughput data. Bioinformatics 2008, 24, 588–590. [Google Scholar] [CrossRef]
- Lai, W.; Choudhary, V.; Park, P.J. CGHweb: A tool for comparing DNA copy number segmentations from multiple algorithms. Bioinformatics 2008, 24, 1014–1015. [Google Scholar] [CrossRef][Green Version]
- Mitra, A.; Kesarwani, A.K.; Pal, D.; Nagaraja, V. WebGeSTer DB—A transcription terminator database. Nucleic Acids Res. 2011, 39, 129. [Google Scholar] [CrossRef]
- Humann, J.L.; Lee, T.; Ficklin, S.; Main, D. Structural and Functional Annotation of Eukaryotic Genomes with GenSAS. In Gene Prediction: Methods and Protocols; Springer: New York, NY, USA, 2019; pp. 29–51. [Google Scholar] [CrossRef]
- Ferrè, F.; Clote, P. BTW: A web server for Boltzmann time warping of gene expression time series. Nucleic Acids Res. 2006, 34, 482. [Google Scholar] [CrossRef] [PubMed]
- Rousseau, C.; Gonnet, M.; Romancer, M.L.; Nicolas, J. CRISPI: A CRISPR interactive database. Bioinformatics 2009, 25, 3317–3318. [Google Scholar] [CrossRef]
- Gupta, S.K.; Padmanabhan, B.R.; Diene, S.M.; Lopez-Rojas, R.; Kempf, M.; Landraud, L.; Rolain, J.M. ARG-ANNOT, a new bioinformatic tool to discover antibiotic resistance genes in bacterial genomes. Antimicrob. Agents Chemother. 2014, 58, 212–220. [Google Scholar] [CrossRef]
- Bao, Y.; Bolotov, P.; Dernovoy, D.; Kiryutin, B.; Tatusova, T. FLAN: A web server for influenza virus genome annotation. Nucleic Acids Res. 2007, 35, 280. [Google Scholar] [CrossRef] [PubMed]
- Cantarel, B.; Korf, I.; Robb, S.; Parra, G.; Ross, E.; Moore, B.; Holt, C.; Alvarado, A.S.; Yandell, M. MAKER: An easy-to-use annotation pipeline designed for emerging model organism genomes. Genome Res. 2008, 18, 188–196. [Google Scholar] [CrossRef]
- Bhave, S.V.; Hornbaker, C.; Phang, T.L.; Saba, L.; Lapadat, R.; Kechris, K.; Gaydos, J.; McGoldrick, D.; Dolbey, A.; Leach, S.; et al. The PhenoGen informatics website: Tools for analyses of complex traits. BMC Genet. 2007, 8, 59. [Google Scholar] [CrossRef]
- Sulyman, S. Client-Server Model. IOSR J. Comput. Eng. 2014, 16, 57–71. [Google Scholar] [CrossRef]
- Zeilinger, H.; Anees, T. SOA Model for High Availability of Services. In Proceedings of the IARIA Conference on Communication Theory, Reliability, and Quality of Service, Venice, Italy, 21–26 April 2013. [Google Scholar]
- Perkins, B.; Hammer, J.; Reid, J. XML and JSON; John Wiley & Sons: Hoboken, NJ, USA, 2018; pp. 673–696. [Google Scholar] [CrossRef]
- Mason, P. JavaScript. In SAS Stored Processes; Apress: Berkeley, CA, USA, 2020; pp. 65–80. [Google Scholar] [CrossRef]
- Bühler, P.; Schlaich, P.; Sinner, D. Html5. In HTML5 und CSS3. Bibliothek der Mediengestaltung; Springer Vieweg: Berlin/Heidelberg, Germany, 2017; pp. 1–42. [Google Scholar] [CrossRef]
- Olsson, M. CSS Properties. In CSS3 Quick Syntax Reference; Apress: Berkeley, CA, USA, 2019; pp. 53–56. [Google Scholar] [CrossRef]
- bin Uzayr, S.; Cloud, N.; Ambler, T. JavaScript Frameworks for Modern Web Development: The Essential Frameworks, Libraries, and Tools to Learn Right Now; Apress: Berkeley, CA, USA, 2019; pp. 523–539. [Google Scholar] [CrossRef]
- Biswal, M. React Lifecycle Methods. Available online: https://www.researchgate.net/publication/337731350_React_lifecycle_methods (accessed on 30 April 2021).
- Bucea-Manea-Tonis, R. Angular JS—The Newest Technology in Creating Web Applications. Ann. Spiru Haret Univ. Econ. Ser. 2016, 16, 103. [Google Scholar] [CrossRef]
- Neto, M.; Andrade, S.; Novais, R. Cross-Platform Multimedia Application Development: For Mobile, Web, Embedded and IoT with Qt/QML; Association for Computing Machinery: Gramado, Brazil, 2017; pp. 23–26. [Google Scholar] [CrossRef]
- Siboldi, M. Node JS Performance Testing. Available online: https://digitalcommons.calpoly.edu/laessp/35 (accessed on 30 April 2021).
- Moroney, L. Using Authentication in Firebase. In The Definitive Guide to Firebase; Apress: Berkeley, CA, USA, 2017; pp. 25–50. [Google Scholar] [CrossRef]
- González, C.; Pérez, M.; Orduña, J.M.; Chaves, J.; García, A.B. HPG-HMapper: A DNA hydroxymethylation analysis tool. Int. J. High Perform. Comput. Appl. 2020, 34, 57–65. [Google Scholar] [CrossRef]
- Dabrowski, J.; Munson, E.V. 40 years of searching for the best computer system response time. Interact. Comput. 2011, 23, 555–564. Available online: https://academic.oup.com/iwc/article-pdf/23/5/555/1900920/iwc23-0555.pdf (accessed on 30 April 2021). [CrossRef]
- Card, S.; Robertson, G.; Mackinlay, J. The Information Visualizer, an Information Workspace. In Proceedings of the SIGCHI Conference on Human Factors in Computing Systems, New Orleans, LA, USA, 27 April–2 May 1991; pp. 181–186. [Google Scholar] [CrossRef]


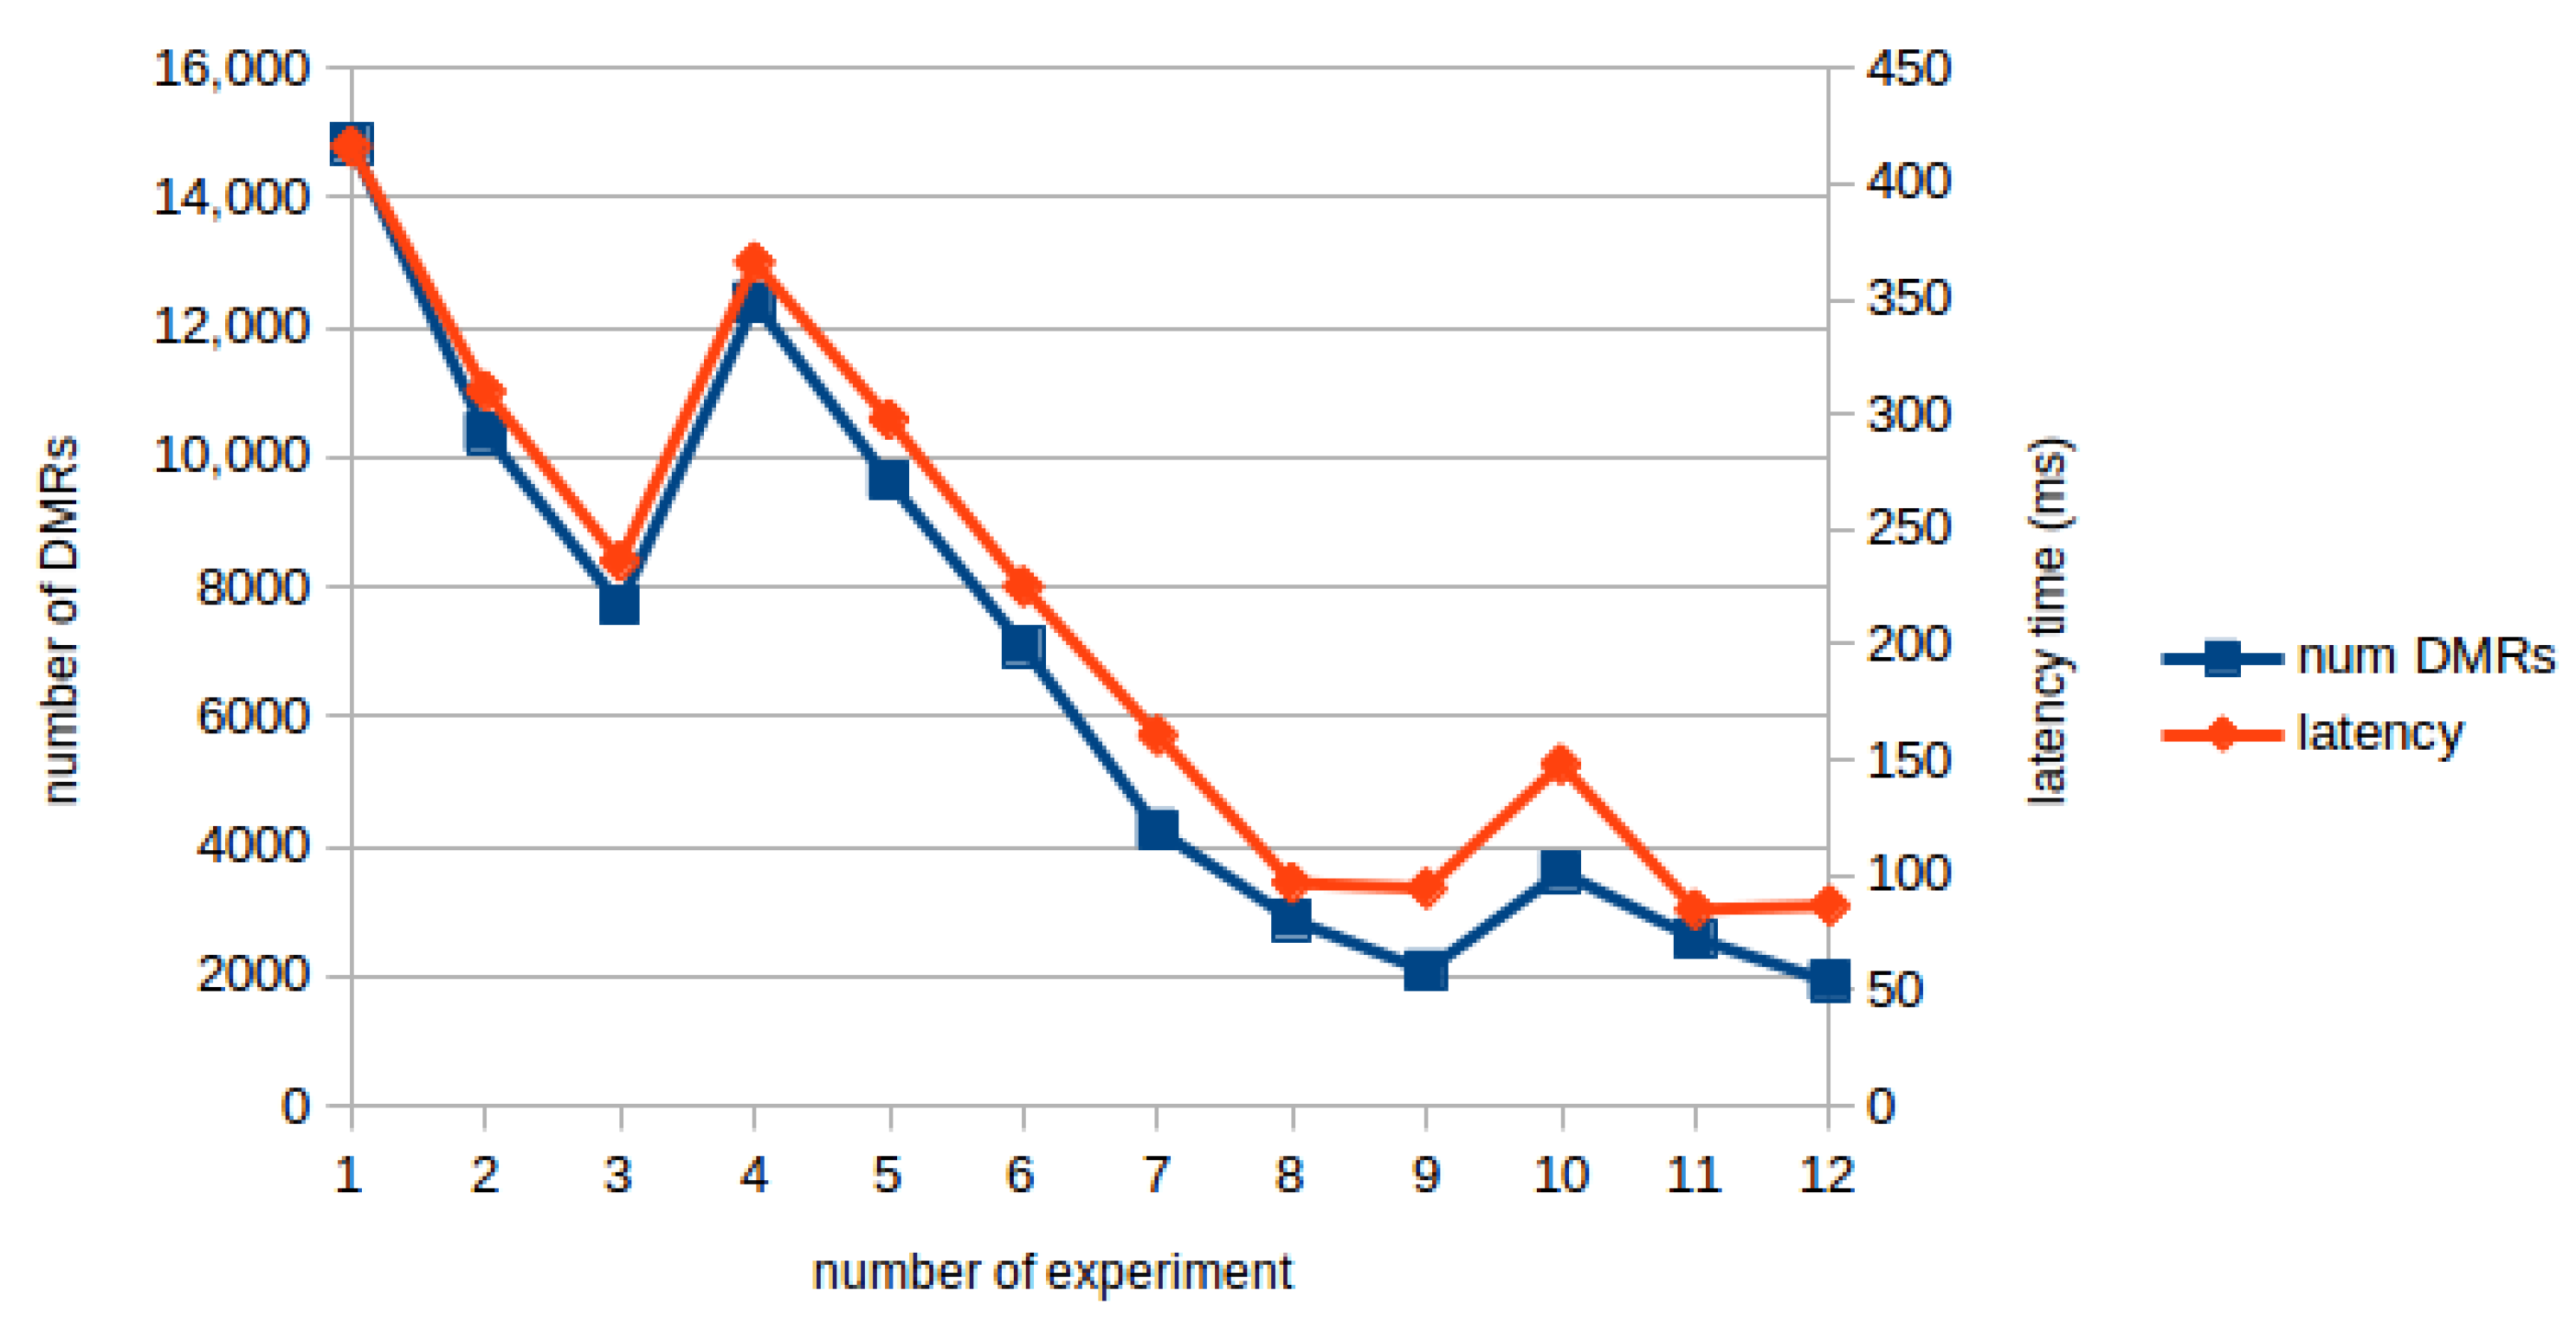
| Exp | Cov | Thr | Dwt Level | Num DMRs | Process (ms) | Response (ms) | Comm Delay (ms) |
|---|---|---|---|---|---|---|---|
| 1 | 1 | 0.25 | 5 | 14,846 | 1179 | 1595 | 416 |
| 2 | 6 | 10,369 | 738 | 1048 | 310 | ||
| 3 | 7 | 7719 | 490 | 727 | 236 | ||
| 4 | 0.30 | 5 | 12,393 | 1104 | 1470 | 366 | |
| 5 | 6 | 9641 | 731 | 1029 | 298 | ||
| 6 | 7 | 7085 | 448 | 673 | 225 | ||
| 7 | 5 | 0.25 | 5 | 4256 | 1021 | 1182 | 161 |
| 8 | 6 | 2866 | 768 | 865 | 97 | ||
| 9 | 7 | 2082 | 453 | 548 | 94 | ||
| 10 | 0.30 | 5 | 3603 | 997 | 1145 | 148 | |
| 11 | 6 | 2576 | 722 | 807 | 85 | ||
| 12 | 7 | 1915 | 446 | 533 | 87 |
| Chrom | DMR Server | DMR Client | Comm Delay | Num DMRs | Load Files | T1 DMR + Load Files | T2 [19] Table 13 A–D | Speedup T2/T1 |
|---|---|---|---|---|---|---|---|---|
| 2 | 21,998 | 22,902 | 904 | 719 | 26,340 | 49,242 | 270,559 | 5.49 |
| 3 | 17,655 | 18,414 | 759 | 554 | 22,675 | 41,089 | 218,035 | 5.31 |
| 4 | 15,665 | 16,359 | 694 | 391 | 14,812 | 31,171 | 154,287 | 4.95 |
| 7 | 13,483 | 14,232 | 749 | 555 | 19,634 | 33,866 | 190,588 | 5.63 |
| 8 | 12,438 | 13,116 | 678 | 380 | 15,660 | 28,776 | 148,693 | 5.17 |
| 9 | 12,514 | 13,244 | 730 | 489 | 17,100 | 30,344 | 172,293 | 5.68 |
| 11 | 12,336 | 13,188 | 852 | 607 | 25,046 | 38,234 | 214,391 | 5.61 |
| 12 | 14,118 | 14,928 | 810 | 496 | 21,505 | 36,433 | 180,999 | 4.97 |
| 13 | 8465 | 8744 | 279 | 182 | 6302 | 15,046 | 74,378 | 4.94 |
| 17 | 7997 | 8893 | 896 | 624 | 22,299 | 31,192 | 190,331 | 6.10 |
| 20 | 5680 | 6293 | 613 | 312 | 12,335 | 18,628 | 103,958 | 5.58 |
| 22 | 3841 | 4408 | 567 | 291 | 11,729 | 16,137 | 94,399 | 5.85 |
| total (ms) | 146,190 | 154,721 | 215,437 | 370,158 | 2,012,911 | average 5.54 | ||
| (min) | 2.44 | 2.58 | 3.59 | 6.17 | 33.55 |
Publisher’s Note: MDPI stays neutral with regard to jurisdictional claims in published maps and institutional affiliations. |
© 2021 by the authors. Licensee MDPI, Basel, Switzerland. This article is an open access article distributed under the terms and conditions of the Creative Commons Attribution (CC BY) license (https://creativecommons.org/licenses/by/4.0/).
Share and Cite
Fernández, L.; Olanda, R.; Pérez, M.; Orduña, J.M. A Web-Based Tool for Automatic Detection and Visualization of DNA Differentially Methylated Regions. Electronics 2021, 10, 1083. https://doi.org/10.3390/electronics10091083
Fernández L, Olanda R, Pérez M, Orduña JM. A Web-Based Tool for Automatic Detection and Visualization of DNA Differentially Methylated Regions. Electronics. 2021; 10(9):1083. https://doi.org/10.3390/electronics10091083
Chicago/Turabian StyleFernández, Lisardo, Ricardo Olanda, Mariano Pérez, and Juan M. Orduña. 2021. "A Web-Based Tool for Automatic Detection and Visualization of DNA Differentially Methylated Regions" Electronics 10, no. 9: 1083. https://doi.org/10.3390/electronics10091083
APA StyleFernández, L., Olanda, R., Pérez, M., & Orduña, J. M. (2021). A Web-Based Tool for Automatic Detection and Visualization of DNA Differentially Methylated Regions. Electronics, 10(9), 1083. https://doi.org/10.3390/electronics10091083