Article

Application of Deep Neural Network to the Reconstruction of Two-Phase Material Imaging by Capacitively Coupled Electrical Resistance Tomography

1
Engineering Tomography Laboratory (ETL), Department of Electronic and Electrical Engineering, University of Bath, Bath BA2 7AY, UK
2
State Key Laboratory of Industrial Control Technology, College of Control Science and Engineering, Zhejiang University, Hangzhou 310058, China
*
Author to whom correspondence should be addressed.
These two authors contribute equally for this paper.
Electronics 2021, 10(9), 1058; https://doi.org/10.3390/electronics10091058
Submission received: 9 March 2021 / Revised: 25 April 2021 / Accepted: 26 April 2021 / Published: 29 April 2021
(This article belongs to the Special Issue Regularization Techniques for Machine Learning and Their Applications)

Abstract

:
A convolutional neural network (CNN)-based image reconstruction algorithm for two-phase material imaging is presented and verified with experimental data from a capacitively coupled electrical resistance tomography (CCERT) sensor. As a contactless version of electrical resistance tomography (ERT), CCERT has advantages such as no invasion, low cost, no radiation, and rapid response for two-phase material imaging. Besides that, CCERT avoids contact error of ERT by imaging from outside of the pipe. Forward modeling was implemented based on the practical circular array sensor, and the inverse image reconstruction was realized by a CNN-based supervised learning algorithm, as well as the well-known total variation (TV) regularization algorithm for comparison. The 2D, monochrome, 2500-pixel image was divided into 625 clusters, and each cluster was used individually to train its own CNN to solve the 16 classes classification problem. Inherent regularization for the assumption of binary materials enabled us to use a classification algorithm with CNN. The iterative TV regularization algorithm achieved a close state of the two-phase material reconstruction by its sparsity-based assumption. The supervised learning algorithm established the mathematical model that mapped the simulated resistance measurement to the pixel patterns of the clusters. The training process was carried out only using simulated measurement data, but simulated and experimental tests were both conducted to investigate the feasibility of applying a multi-layer CNN for CCERT imaging. The performance of the CNN algorithm on the simulated data is demonstrated, and the comparison between the results created by the TV-based algorithm and the proposed CNN algorithm with the real-world data is also provided.

1. Introduction

Electrical impedance tomography (EIT) has been studied and widely applied in medical imaging and process tomography since it was introduced in the 1980s [1,2,3,4,5]. The conductivity distribution within the target region, such as areas of the human body or the contents of a pipeline or vessel, can be revealed based on the impedance measurements via electrodes placed on the boundary of the region [6]. Compared with other imaging protocols, EIT has the advantages of producing images with high temporal resolutions while having a relatively low cost, no radiation, no invasion, rapid response, and simplicity for application [6,7]. In late 1980s, when EIT was introduced to the process tomography field, electrical resistance tomography (ERT), a particular case of EIT, was proposed [8,9]. Compared with EIT, it has similar imaging processes, except that the phase angle of the detected impedance is omitted so that the images are reconstructed solely by the resistance [8].
However, direct contact between the electrodes and conductive medium in traditional ERT causes problems. ERT images are sensitive to electrode properties, such as contact impedance [10]. In medical applications, high-value contact impedance would vary with body movement and studied areas [11]. Besides that, it is sensitive to the nature of the contact layer, and thus the lack of boundary properties in clinical experiments could lead to inaccuracy [11]. In the engineering field, severe errors may be caused by the electrochemical erosion effect and polarization effect of the electrodes after extended periods of contact with the conductive liquids [8]. Besides that, the contamination of the electrodes would bring measurement deviations [12]. In 2010, a contactless approach, termed capacitively coupled electrical resistance tomography (CCERT), was proposed by Wang et al. [12,13,14]. Based on the capacitively coupled contactless conductivity detection (C4D) technique, CCERT avoids contact error by inserting an insulation layer between the electrodes and conductive contents [11]. Besides that, experiments show that CCERT could have a larger excitation frequency domain than that of traditional ERT, which results in better imaging results [15,16]. Therefore, CCERT is attracting more and more researchers’ attention. So far, CCERT has been applied in gas–liquid two-phase materials, brain imaging, and breast cancer detection [16,17,18].
Like other electrical tomography (ET), CCERT also has the highly nonlinear and ill-posed inverse problem. Traditional algorithms used to solve the ET inverse problem include noniterative methods and iterative methods, facing the challenges of reconstruction speed and accuracy [19]. In the last several years, with the development of GPUs, the deep learning (DL) algorithm has shown its promising potential in image application and has also been suggested as an alternative for inverse problem solving. Inspired by the neuronal network of the human brain, DL adopts machine learning algorithms to model sophisticated abstractions of the raw input data through a deep architecture containing multiple hidden layers to implement linear and nonlinear transformations [20]. Although the history of DL dates back to 1965, it has only been rapidly developed in recent years, mainly in its improved computational abilities and nonlinearity-solving abilities, and these fast improvements therefore increase the network depth [21,22]. Up to now, deep neural networks (DNNs) have been applied to solve the inverse problem of imaging, super resolution, de-noising, and film colorization [23,24]. Since a DNN is flexible in high-dimensional function expression, it can theoretically approximate the entire inverse map, thus avoiding the iterative process [25]. More studies on DNNs in inverse problem solving can be found in [26,27].
For ET techniques, DNN algorithms are also suggested as a way to solve the inverse problem and reconstruct images. The convolutional neural network (CNN), one of the most-used DNN models, has the properties of being a deep, fully connected, and feedforward model. As a CNN is good at extracting essential features from the input data and mapping nonlinear functions, it is relatively computationally efficient compared to other DNN methods [28]. In recent studies, the cascaded end-to-end convolutional neural network (CEE-CNN) was built by Wei et al. to apply the induced current learning method (ICLM) to solve the nonlinear reconstruction problem in EIT [29]. Motivated by the linear perturbation analysis of the forward map, Fan et al. used the BCR-Net-based neural network to approximate both the forward and inverse maps, using the proposed neural network to replace the traditional Dirichlet-to-Neumann (DtN) map [25]. More studies of CNN-based ET applications can be viewed in [30,31]. In addition, the studies of artificial neural networks (ANNs), another popular DNN model, have also attracted lots of interest for ET application. Fernández-Fuentes et al. developed an ANN-based inverse problem solver for EIT, which takes the boundary measurements as the input and generates the conductivity value of each mesh of triangular elements of the image [32]. Rymarczyk et al. compared some machine learning algorithms for industrial ET, including the ANN, LARS, and elastic net methods, and they used a set of trained subsystems to generate the value of each pixel of the image in parallel [33].
In this work, a multi-layer feedforward CNN was established to achieve image reconstruction for CCERT industrial application. During training, the 2D monochrome 2500-pixel image was divided into 625 clusters, and then the proposed CNN was trained separately for each pixel cluster of the image to achieve feature extraction and classification. A supervised learning algorithm built a mathematical model for the cluster to map the input resistance to the output pixel pattern. With the 12-electrode circular CCERT system, the proposed multi-layer CNN model was examined by both simulation and experiment data. In addition, the reconstructed images obtained with the CNN method were compared with the images produced by a traditional reconstruction algorithm: a TV algorithm.

2. Methods

2.1. System Configuration and Data Acquisition Principle

For the CCERT system, data were collected via the boundary-placed electrodes. This research studied the performance of a circular electrode sensor, where 12 electrodes were evenly spaced and attached to the outside of the sensing area with an angle of 25°, as shown in Figure 1a. The size of one electrode was 150 mm × 24 mm, with the inner and outer diameters of the sensing area being 106 mm and 110 mm, respectively.
During the measurement process, a 3.3 V AC voltage with 500 kHz was applied as the excitation signal. For each independent measurement, only two electrodes were selected as the exciting and detecting electrode pair, where the AC voltage was injected into the excitation electrode and the current was detected via the detection electrode, and the remaining electrodes were kept at floating potentials at the same time. The equivalent detection circuit can be simplified as in Figure 1b, in which C 1 and C 2 express the coupling capacitances and Z x represents the impedance of the sensing area. Only the resistance part was involved in the CCERT system, and it could be calculated from the applied voltage and the real part of the detected current based on Ohm’s law. In a complete measurement cycle, electrode 1 was first selected as the excitation electrode, and electrode 2 to electrode 12 were successively selected as the detection electrode. The whole process continued until electrodes 11 and 12 constituted an electrode pair. For the same sample, the detected resistance between a certain electrode pair remained the same no matter which acted as the excitation electrode or the detection electrode. Therefore, in each measurement cycle, the total number of independent measurements was n ( n 1 ) 2 = 12 × ( 12 1 ) 2 = 66, where n is the number of electrodes.

2.2. Conventional Forward Modeling and Image Reconstruction Algorithm of CCERT

Conventional CCERT is the technique that enables the reconstruction of the internal conductivity distribution from the boundary resistance measurements with the sensitivity matrix and reconstruction algorithm. The imaging process has two essential stages: one is the forward modeling, and the other is image reconstruction, often termed as the inverse problem [34]. During the test, the time difference (TD) method was adopted to obtain the resistance projection (P), where P equaled the difference of the resistances at different times: one with a homogeneous conductive background and the other with detected samples added into the background [35]. Tap water with a conductivity of σ = 0.018 S/m was taken as the background medium.
In the forward problem, the boundary equations were obtained based on the known conductivity distribution within the target region. Two assumptions are made in the forward modeling process. The first assumption is that the electromagnetic field can be regarded as a quasi-static electric field, since the detected area is much smaller than the wavelength of the excitation signal under the commonly applied frequencies [18]. The second one is that the fringe effect caused by the finite electrode length can be neglected in order to simplify the modeling process [18]. Therefore, based on Maxwell’s equations, the forward problem at the under-radio frequency within the sensing area Ω can be written as [11]
· ( ( σ ( x , y ) + j ω ε ( x , y ) ) u ( x , y ) ) = 0 ,   ( x , y ) Ω
where σ ( x , y ) , ε ( x , y ) , and u ( x , y ) are the conductivity, permittivity, and electrical potential distribution of the sensing area, respectively, ω is the angular frequency of the excitation signal ( ω = 2 π f , where f is the excitation frequency), and represents the gradient operator. Then, the boundary conditions can be derived as
{ u a ( x , y ) = V                                 ( x , y ) Γ a                               u b ( x , y ) = 0                                 ( x , y ) Γ b                               u c ( x , y ) n = 0                                 ( x , y ) Γ c   ( c a , b .   )
where V is the amplitude of the excitation voltage, n represents the normal unit vector pointing out of the boundary. a , b , and c are the indexes of the excitation electrode, the detection electrode, and the remaining floating electrodes, respectively, and Γ a , Γ b , and Γ c are the spatial locations of the corresponding electrodes.
Then, the sensitivity matrix (S), which reveals the relationship between the resistance projection (P) and conductivity distribution (G), can be determined based on the simulation [12]. During the forward simulation, a critical process is to mesh the sensing region and the system model into a finite number of elements. In this work, the discretization process is conducted by COMSOL Multiphysics. The simulation process is carried out by MATLAB R2020b, MathWorks.Inc, USA, as well as COMSOL Multiphysics. The excitation AC voltage is simulated as a 500 kHz frequency and 1 V amplitude signal. After injecting the AC voltage signal to the electrode, the ith current measurement on the detection electrode can be represented as
I i =   J m n d Γ
where I i is the ith current measurement ( i = 1 , 2 , , 66 ) and J m n is the measured current density of the electrode pair m and n. Then, the corresponding ith resistance measurement between the electrode pair can be written as
R i = R e a l ( V i I i ) = R e a l ( 1 I i )
With the whole measurement data, the sensitivity matrix of CCERT is
S = [ S 11 S 1 N S M 1 S M N ]
S i j = I σ = R e a l ( I i j I i 0 ) σ 1 σ 0 = 1 / R i j 1 / R i 0 σ 1 σ 0 ,                       ( S ij S )
where M is the total number of measurements, N is the total number of meshing elements, S i j is the sensitivity matrix associated with the ith measurement and jth element, and I i 0 and R i 0 are the ith current and resistance measurement when the imaging region is at a background state, respectively, where the conductivity of all elements equals to σ 0 . When the conductivity of the jth element changes from σ 0 to σ 1 while the remaining elements still have σ 0 conductivity, the ith current and resistance measurements then become I i j and R i j .
After calculating the sensitivity matrix, the image reconstruction process can be conducted. For simplicity, the approximated linear relationship between P (change in resistance measured data), S, and G (change in electrical conductivity) can be expressed as
P = S G
The inverse problem cannot be solved directly by multiplying P and the inverse of S to obtain G, given the following reasons. First, the solution is under-determined since there are more variables than equations [11]. Secondly, G is very sensitive to the perturbations of P [11]. Additionally, CCERT is a type of soft field tomography, which means the actual sensitivity matrix changes with the conductivity distribution [11]. Therefore, proper image reconstruction algorithms are needed in order to solve the inverse reconstruction problem.
For circular CCERT, linear back projection (LBP) was adopted first due to its advantages of simplicity and rapidity, but the image quality was limited. Therefore, an algorithm which combined LBP with a K-means clustering method was proposed to improve the image quality [36]. In 2014, a new hybrid algorithm which adopted Tikhonov regularization as the initial guess and took the simultaneous iterative reconstruction technique (SIRT) for standard iterations was proposed [12]. In 2017, the method consisting of a combination of the Levenberg–Marquardt (L–M) method and the simultaneous algebraic reconstruction technique (SART) was put forward. This method applied L–M for the initial guess and SART for final reconstruction [37]. Recently, the total variation (TV) algorithm with split Bregman iterations was used for CCERT reconstruction [15].
A simple image reconstruction can be performed using LBP:
G     S T   P
An iterative TV algorithm is an effective method for recovering and reconstructing piecewise constant signals. It is a deterministic technique that safeguards discontinuities in image processing tasks, so it is well suited for this two-phase imaging.
An anisotropic TV regularization term is expressed by Equation (9):
R I T V ( G ) = j | | D j   G | | 1
where D j represents a finite difference approximation of the spatial image gradient. An isotropic version of the TV function is given by Equation (10) and was used in this work:
G = a r g   m i n   G   (   α   | | G | | 1 ) ,               s . t .   | | S G P | | 2 < q
where q is the error threshold and α is the regularization parameter. The higher the regularization (smoothing) parameter gets, the more impact the regularization will have on the solutions and, consequently, the more details will be lost from the image. Indeed, with the increase of α , the contrast of the image becomes lower, and the boundaries within the object become smoother. After carefully choosing the regularization parameter, we optimized the image by deleting the artifacts. A more detailed description of the proposed TV method for CCERT can be seen in [15]. To be able to compare this method with the binary CNN algorithm, the TV-reconstructed images were the thresholds for the binary images.

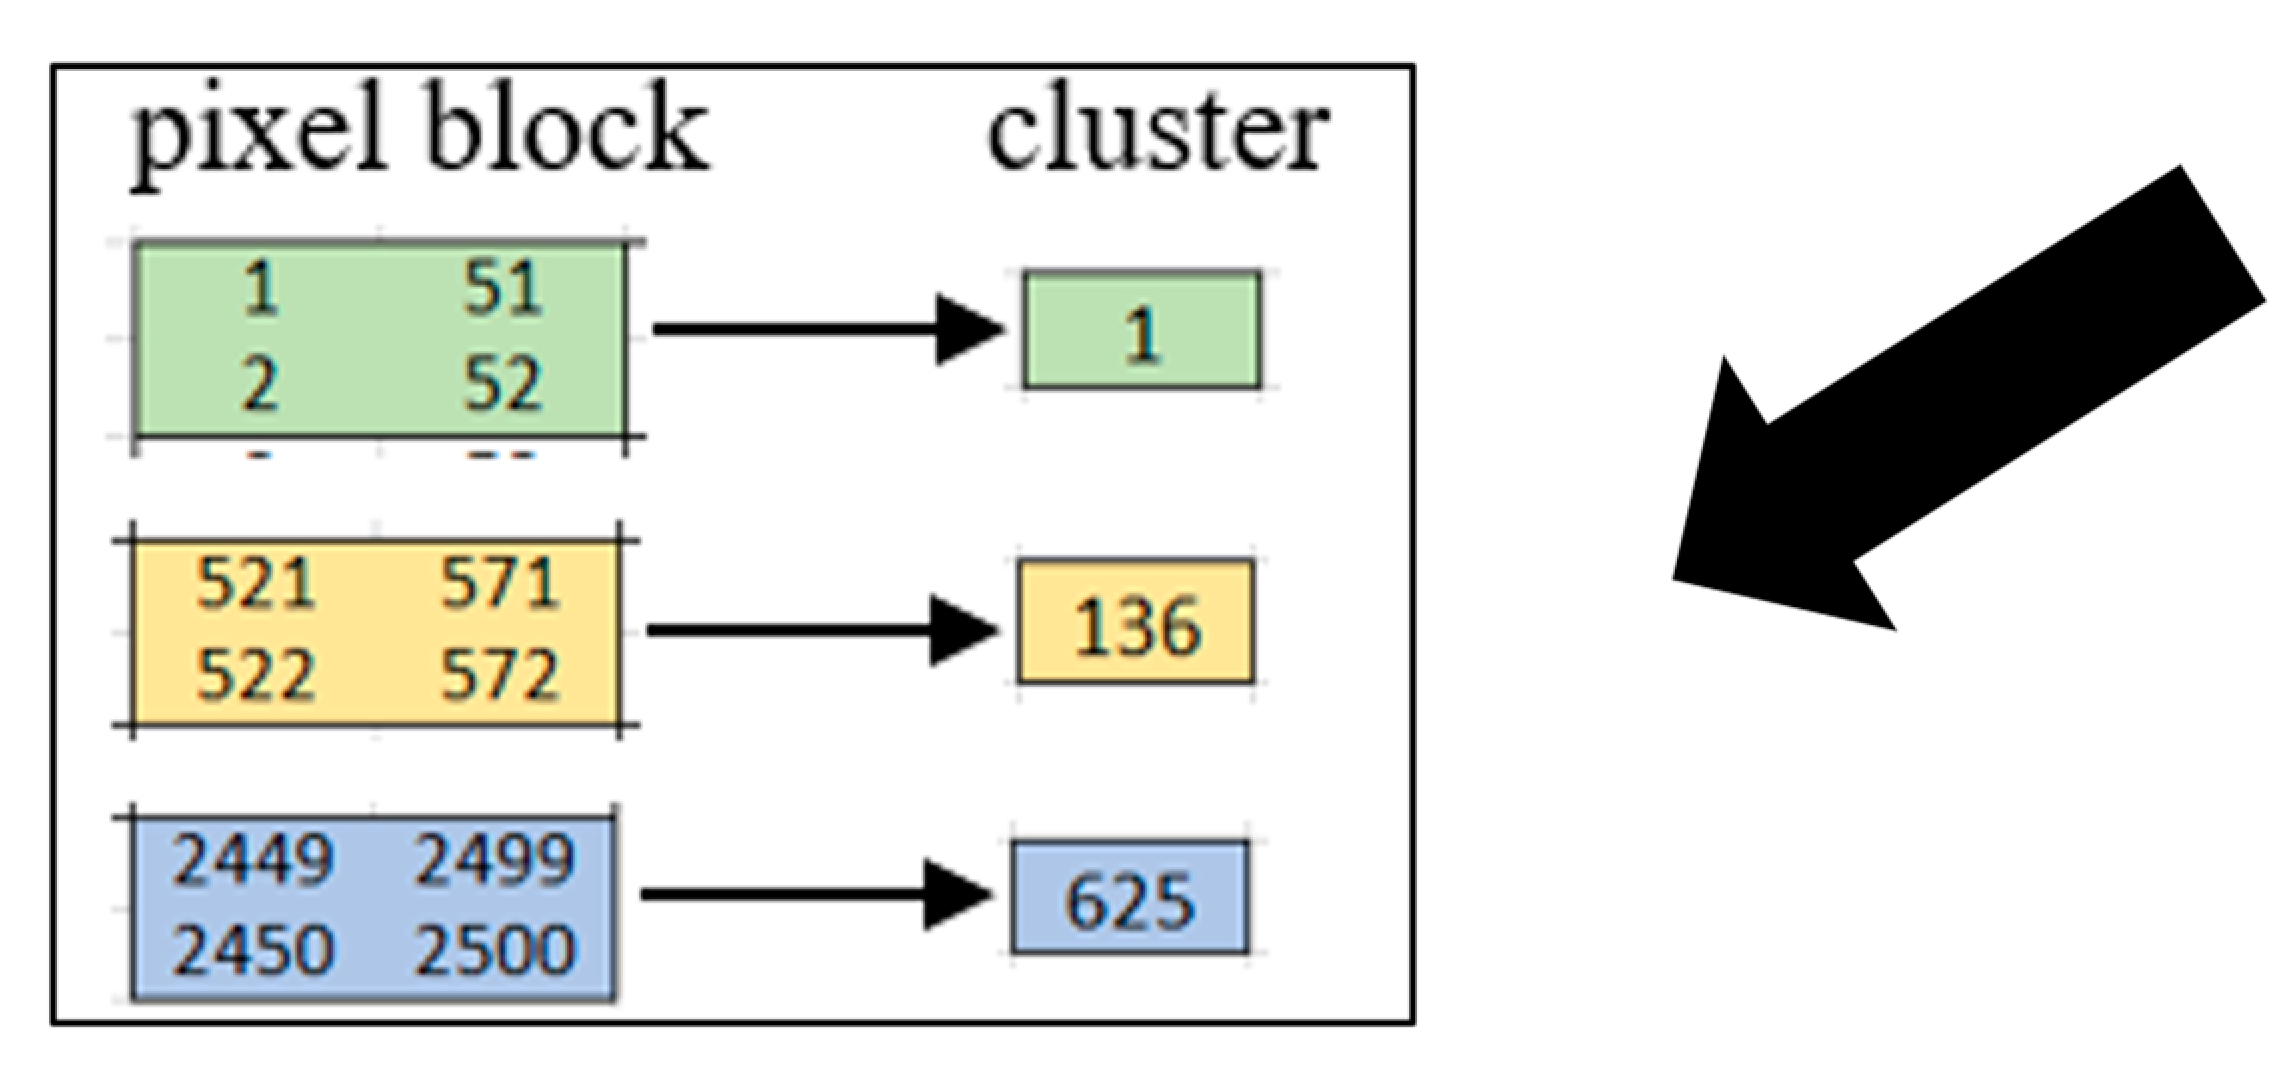
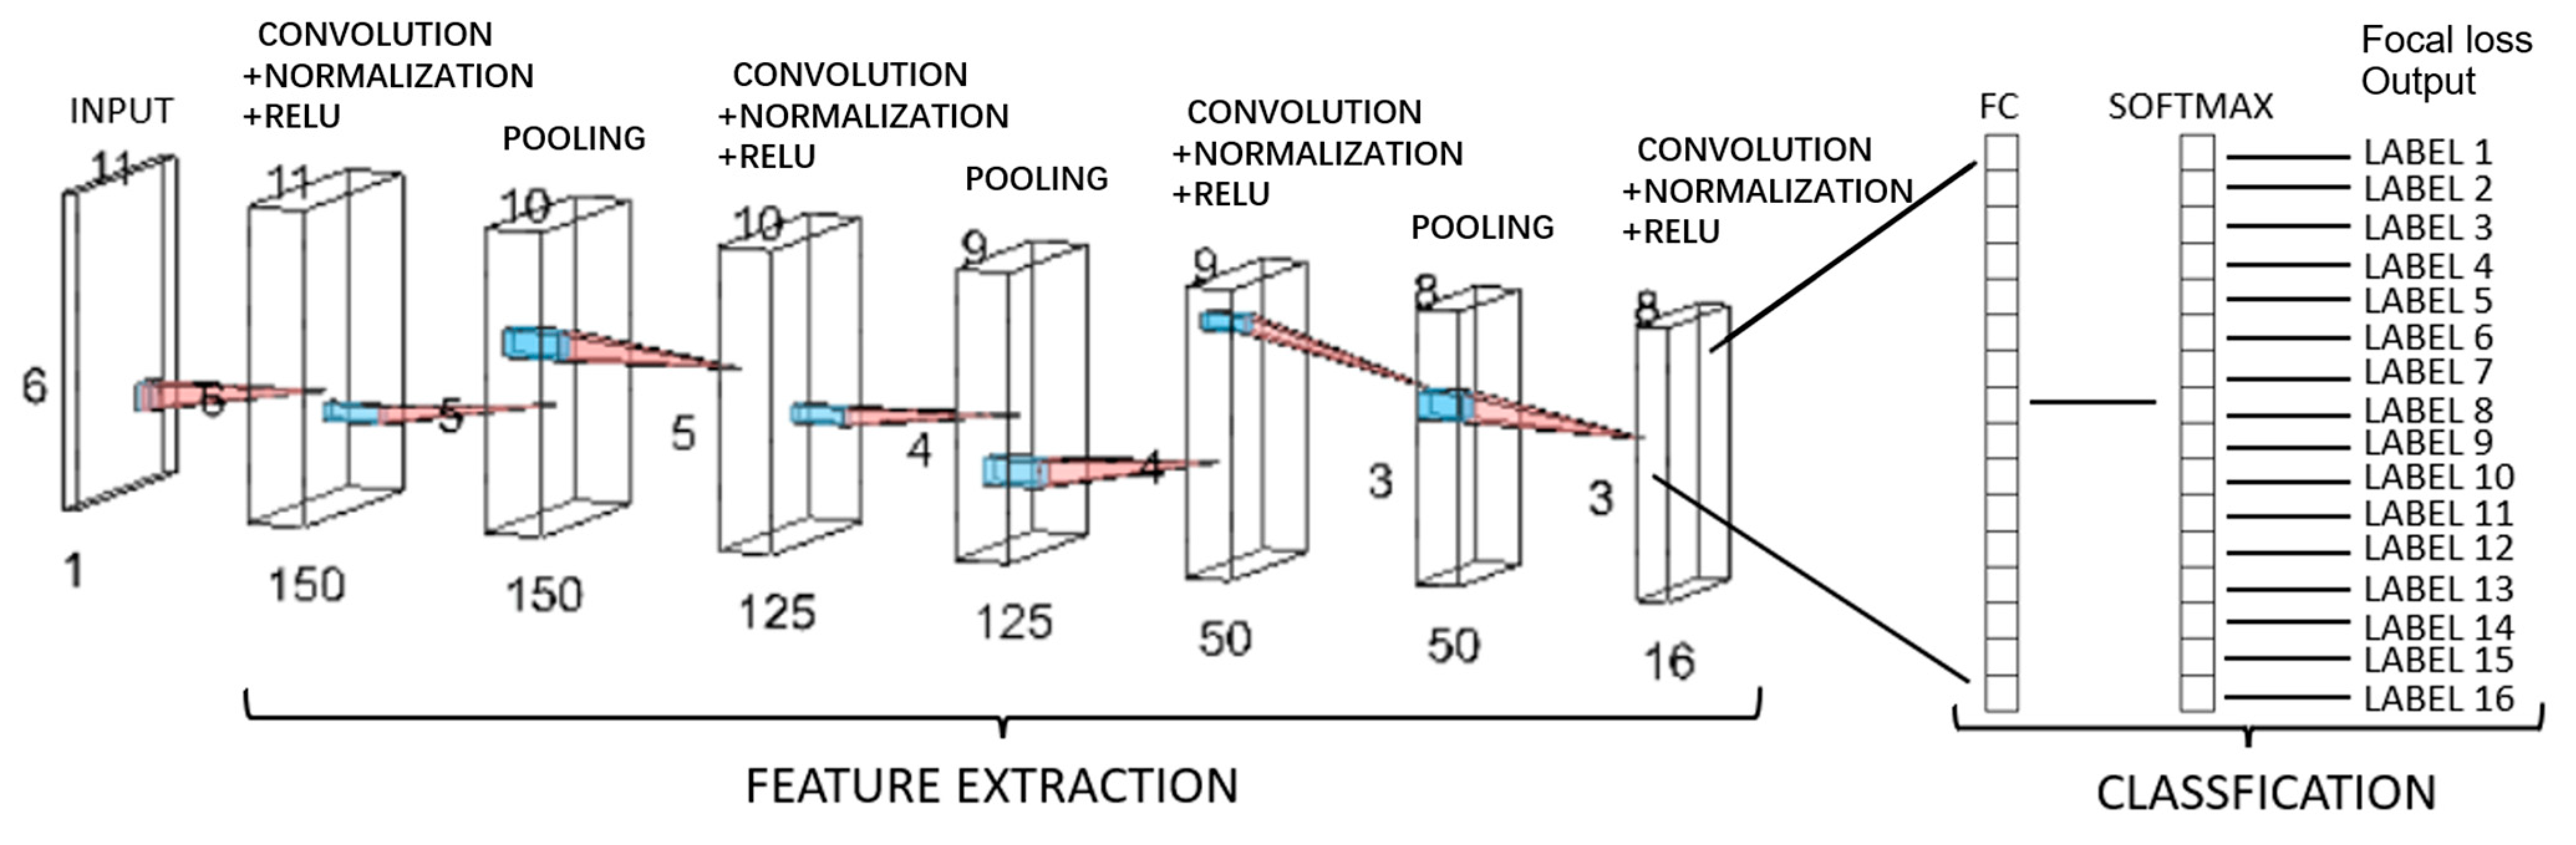
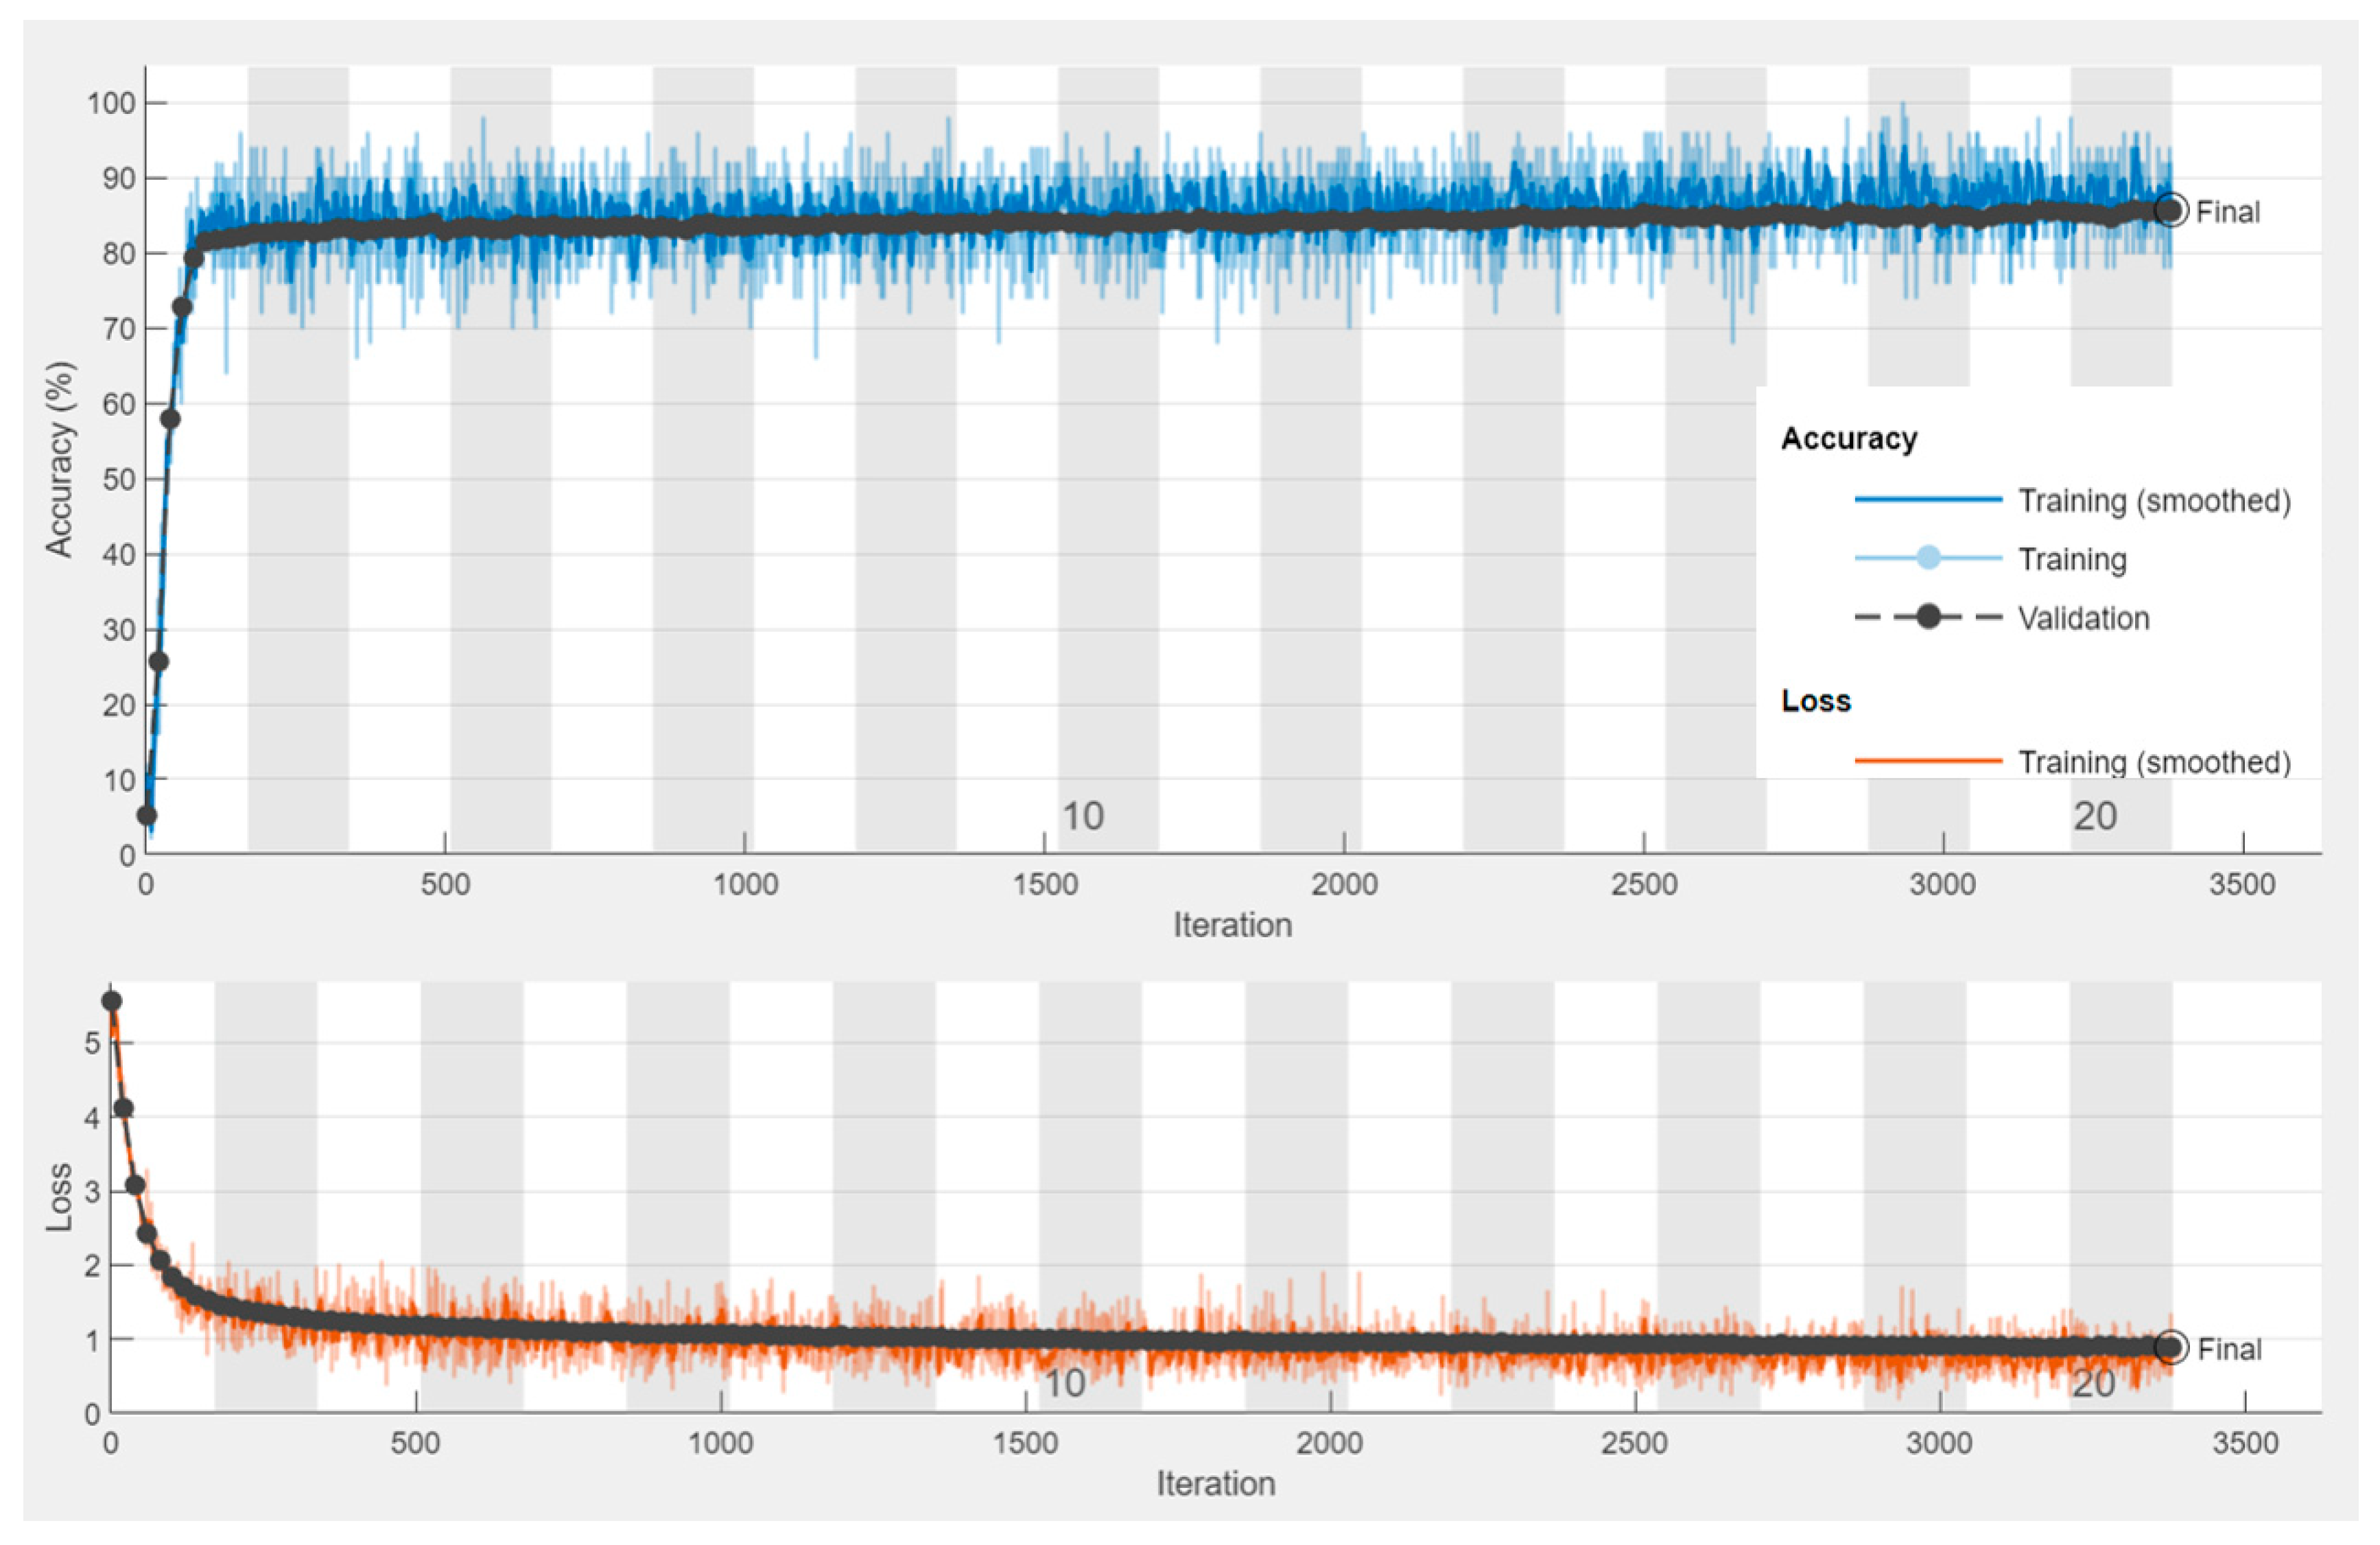
2.3. CNN-Based Image Reconstruction CCERT
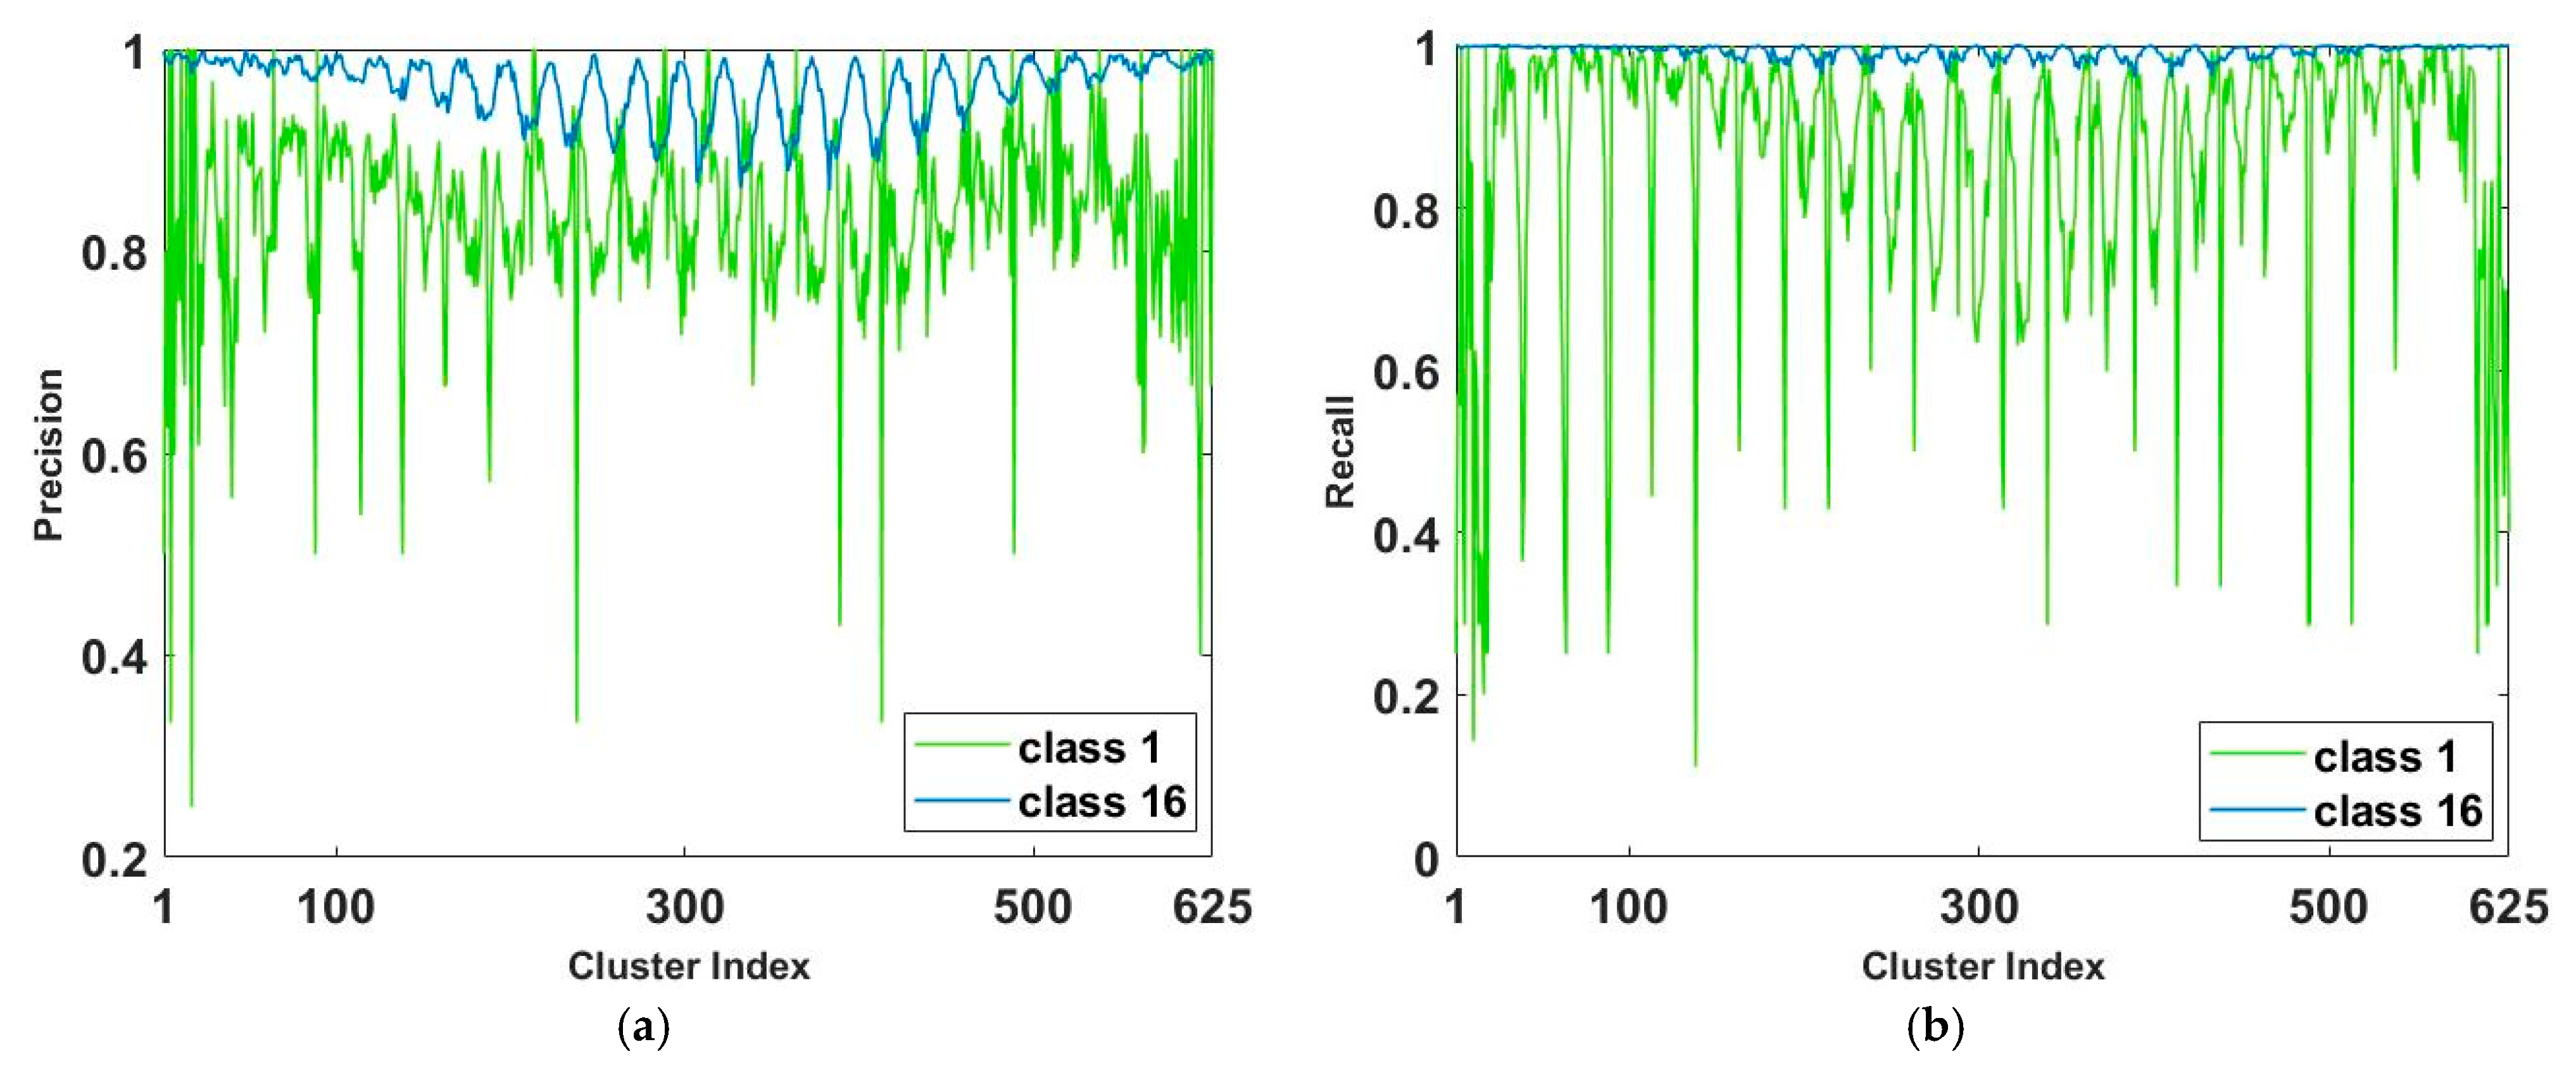
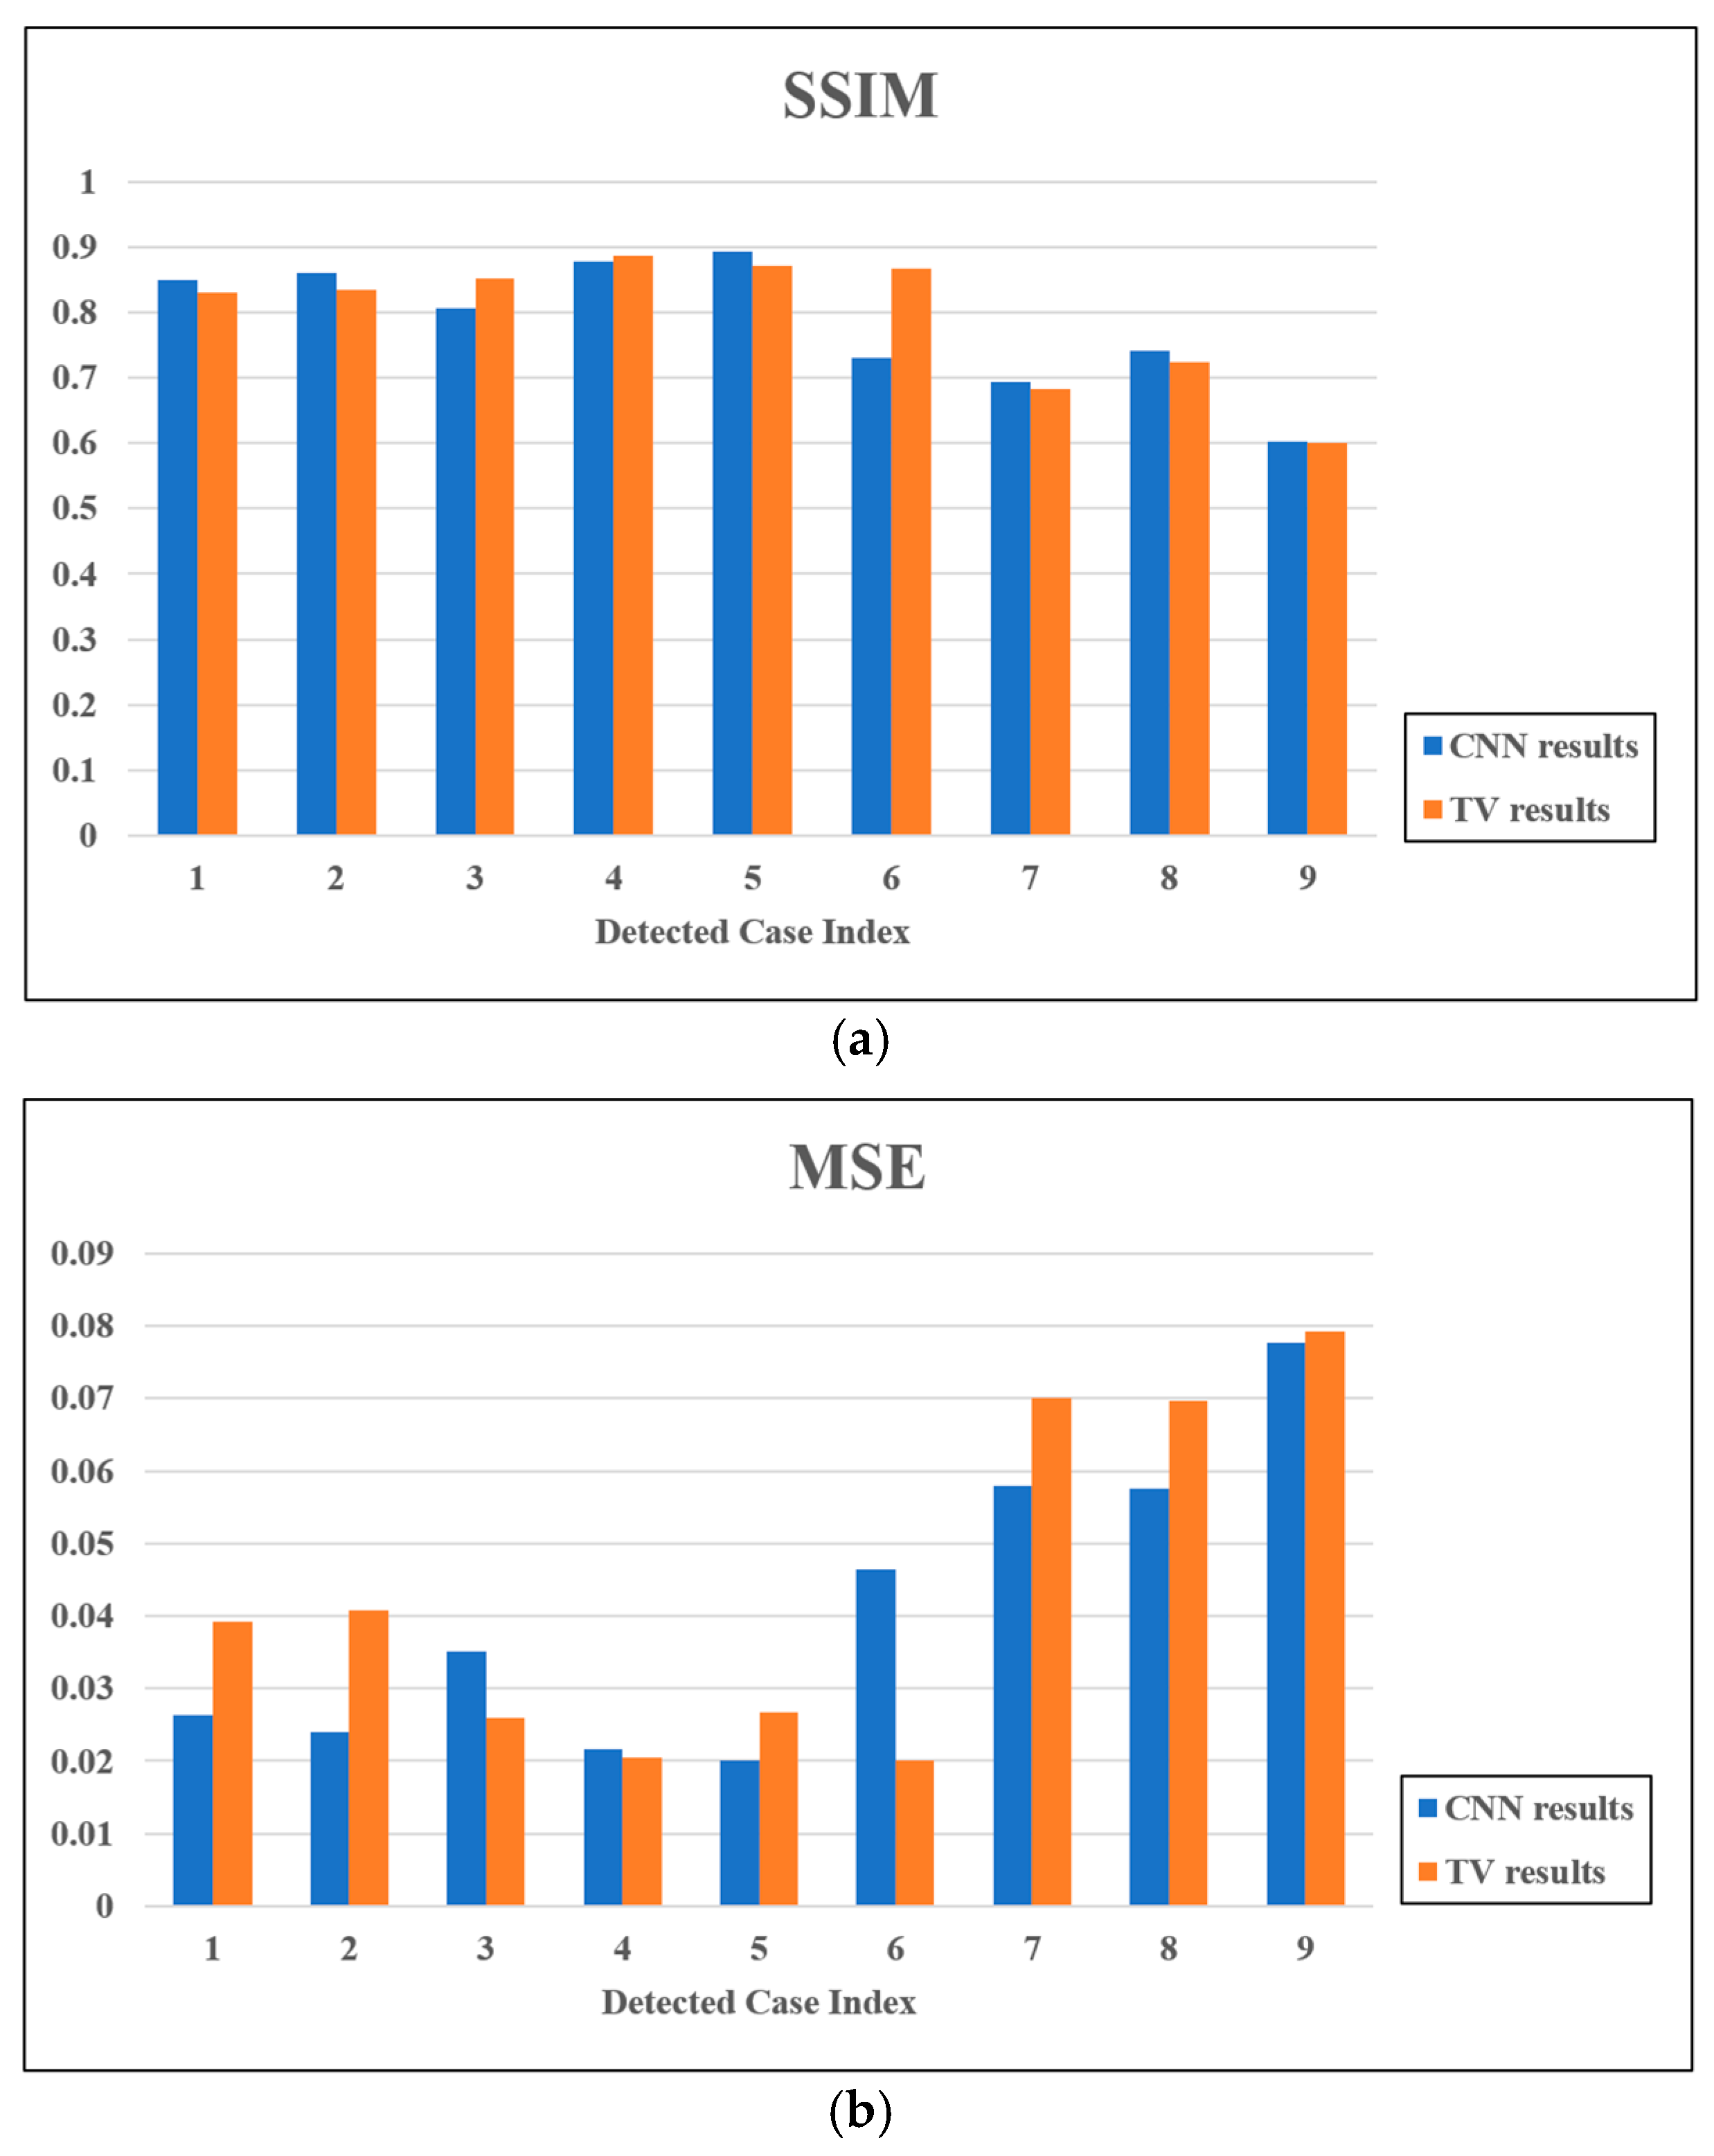
The supervised learning algorithm is one kind of machine learning algorithm. As task-driven learning, it aims to find a mathematical model for mapping the inputs and their correct outputs through a backpropagation (BP) learning algorithm. It is commonly applied in various classification problems, including image classification, fraud detection, and diagnostics, as well as regression problems including risk assessments, score prediction, and market forecasting.
In this research, a CNN-based supervised learning algorithm was adopted for image reconstruction which established a mathematical model of mapping the input of 66 resistance measurements to the desired output pixel pattern [38]. The resulting image was meshed into a 50 × 50 pixel grid, and the pixels were equally spaced. These 2500 pixels were sorted first by row and then by column. As such, in the first column and from the first row to the last row, the pixels were numbered from 1 to 50. Then, in the second column and from the first row to the last row, the pixels were numbered from 51 to 100. Following the same rule, the pixels in the last column from the first row to the last row were numbered from 2451 to 2500. If a single CNN were used to image the entire 2500-pixel image, there would be 2 2500 pixel distribution classes for the CNN to classify, which would be almost impossible for training. The problem was solved by dividing the 50 × 50 pixel image into a 25 × 25 pixel image with non-overlapping clusters, with each cluster representing a 2 × 2 pixel block. Since the space of each pixel point on the image was the same, the space of the clusters was also the same among each other. The conversions between pixels and clusters can be viewed in Figure 2. The clusters were also sorted first by row and then by column. Thus, taking cluster 1 as an example, it corresponds to the area of pixel 1, 2, 51, and 52.
After completing the transformation, a distinct CNN could be applied for each cluster, and the classification became feasible since there were 2 4 = 16 pixel patterns within one cluster. Their labeling and matrix expressions are displayed in Table 1. As the proposed CNN model was designed for two-phase material application, the result could be represented as the binary image, where 0 and 1 mean the background and inclusion.
Then, the image reconstruction could be realized by the conversion process via the 625 CNN models, as shown in Figure 3. The 625 CNN results were converted into 625 2 × 2 binary matrices, based on Table 1, and the conversion between cluster patterns and the final pixel image took the reverse of the conversion from pixel to cluster, as explained in Figure 2, to form the final 50 × 50 pixel image. The development of each CNN followed the general procedure of the deep learning method as shown in Figure 4, which mainly included accessing data, constructing network architecture, setting training options, and conducting training, along with hand-tunings to achieve a fitting model.
Simulation data were generated based on the precalculated sensitivity matrix (S) and labeled for each CNN based on the cluster’s pixel pattern. A total of 10,000 cases were generated for the network training, containing 5000 single-inclusion cases, 2500 double-inclusion cases, and 2500 triple-inclusion cases. All the inclusions were in the quasi-circular shape, with diameters from a 10 pixel-length to a 20 pixel-length placed on all locations of the image. Random noise was added to the simulation based on the standard deviation value of the background measurement for network training. Each set of 66 resistances were scaled to [0 1] to avoid gradient vanishing and converted into an 11 × 6 matrix. The structure of the matrix could be any combination of a size of 66, such as 11 × 6, 6 × 11, or 2 × 33. The final result would be the same no matter what matrix structure was used.
The CNN layers were constructed with the aid of the deep network designer application MATLAB R2020b, MathWorks.Inc, USA. After hand-tunings, the 625 CNNs adopted the same 19-layer architecture to realize feature extraction and classification, and the network architecture is displayed in Figure 5. In this work, hand-tuning of the hyperparameters included the following: (1) tuning the hyperparameters related to the network structure, such as the number of hidden layers and units and the activation function, and (2) tuning the hyperparameters related to the training algorithm, such as the optimizer, initial learning rate, number of epochs, and batch size. For different cases, the hand-tuning was different, but the trade-off needed to be considered alongside the training to avoid underfitting or overfitting cases. Convolution layers functioned as feature extractors by executing convolution operations between the receptive fields of the input and the kernels. An activation function—the rectified linear unit (ReLU)—introduced nonlinearity to the network via ReLU ( x ) =   max ( x ,   0 ) . Max pooling performed nonlinear downsampling on each feature map by taking the max value of the feature block to reduce computation while keeping essential information and providing invariance to the local translation. Batch normalization improved the stability, performance, and speed of the network. The fully connected (FC) layer flattened the 3D features into a 1D vector for classification, and the softmax layer calculated the probability of the input data belonging to each class. The distribution of 16 pattern classes was unbalanced. After randomly sampling the different cases, Table 2 shows the 16 classes’ distribution for all sampled cases. Though the number appearing for each class may have varied with the added noise, class 1 and class 16 accounted for the majority of the possibilities. Thus, the focal loss layer was critical, since it was applied as the output layer to deal with the data imbalance between classes. The details of the CNN layers and parameters are given in Table 3.
The training was carried out on each CNN separately through the BP algorithm and Adam optimizer in order to find the most suitable weights and bias for the model, which could result in minimal prediction cross-entropy loss. The simulation dataset was randomly divided into training data, validation data, and test data at a ratio of 80%:10%:10%, respectively. The ‘initial learning rate’ was set as 1 × 10⁻⁵, ‘MaxEpochs’ was 20, ‘MiniBatchSize’ was 50, the validation frequency was 20, and the rest of the configuration parameters were set to the default values. The optimization process went through a maximum of 3380 iterations before reaching the final convergence. For these 625 CNN networks, the minimum validation accuracy after training was 85.6% and the average validation accuracy was 94.4%. The number of clusters with a validation accuracy above 90% was 536, accounting for 85.7% of all clusters. Figure 6 displays the training progress plot generated by MATLAB R2020b, MathWorks.Inc, USA, for the 313 t h cluster, which was the hardest one to reconstruct as it was located in the center of the sensing area. Due to the characteristic of the soft field, the sensitivity in the center area was lower than that near the sensor. In Figure 7b, the validations and test accuracies of the other clusters are also shown. The selected demonstration clusters were positioned at the midline of the vertical axis with the same space. Figure 7a shows the position of the selected cluster with red squares, and the corresponding clusters are the 63rd, 188th, 313th, 438th, and 563rd clusters. From the results, it can be seen that the cluster near the sensor area would have better CNN performance. In Figure 6, the deep blue curve and black curve in the top image represent the training accuracy and validation accuracy, respectively, and the orange curve and black curve in the bottom image represent the training loss and validation loss, respectively. With the growing training iterations, the accuracy curves increased gradually, achieving over 85.6% accuracy after training, while the loss curves decreased. Based on the tendency of the curves, it could be regarded as a good-fitting network. Besides that, the accuracy of the test dataset for the 313 t h cluster reached 85.93%, verifying the generalization ability of the model.
When assessing the performance of the CNN, if the dataset used to train the network was unbalanced, the trained network may have been underfitted. Therefore, metrics other than the accuracy were needed to assist in the analysis, such as the confusion matrix (including recall and precision values) and the receiver operating characteristic (ROC) curve. In our design, since we trained the distinct CNN for each cluster instead of individual pixels, and these 16 classes of the same cluster would not have the same occurring probability, thus there were variabilities in the recall and precision values of different classes for the same cluster. Classes 1 and 16 had the highest occurring probability; therefore, the precision and recall values of 625 CNNs for these two classes were relatively stable and high, and the metrics showed that the value was smaller when the cluster was at the center area while larger when the cluster was close to the sensor. Figure 8 shows the plot of the precision and recall values of 625 CNN networks for class 1 and class 16. For class 16, the minimum precision and recall values of the 625 CNNs were 86% and 96%, respectively. For class 1, though a few networks underperformed, in aggregate, 85.9% of the networks achieved more than a 75% precision value, and 79.6% of the networks achieved more than a 75% recall value. For the other classes, the performance of the network varied among clusters, and the values of these metrics were low, mostly falling below 20%. Although such results may have introduced errors in boundary reconstruction, it was necessary to train the network with all 16 classes. By training the network with more different cases, the performance of the 625 CNNs for classification could be improved, thus providing the images with more accurate boundaries.
Compared with other simple networks such as the shallow neural network, our proposed 625 multi-layer deep neural network performed better. The 625 CNNs possessed an average accuracy of 94.4% and had high precision and recall values for class 1 and class 16, which were the two most important classes. Taking the 63rd, 188th, and 313th clusters as examples, the test accuracy of the 625 CNNs was 96.22%, 89.34%, and 85.93%, while the accuracy of the shallow network with the same depth (150) was 93.7%, 84%, and 83.7%, respectively. Moreover, the recall and precision values of the 625 CNNs for class 1 and class 16 were much higher than those of the shallow network, implying that the shallow network has a higher probability of misclassifying class 1 or class 16 than other classes, which will affect the image results. Judging from the complete simulation and experimental image results shown in the following sections, our network was able to correctly determine the location and size of the inclusions, and the performance of the system met our design goals.
The 625 CNN models were saved separately and applied for simulation reconstruction and experimental reconstruction. The image reconstruction accuracy was analyzed quantitatively by calculating the structural similarity (SSIM), the mean squared error (MSE), and the peak signal-to-noise ratio (PSNR) between the reconstructed image and the referencing image. The SSIM, MSE, and PSNR are all metrics used to assess image quality [39,40]. The MSE is the average energy of the difference between the current image and the referencing image, while the PSNR is the ratio between the energy of the peak image value and the mean energy of the noise. The calculations of these two methods are both based on the error between the corresponding pixel points. Suppose that there are two images: the current image X and the referencing image Y . The total number of pixels is N for both images, and the pixel value belonging to them is x i and y i , respectively. Therefore, the calculating algorithm of the MSE and PSNR can be expressed as
M S E = 1 N i N ( e i ) 2 = 1 N i N ( x i y i ) 2
P S N R ( i n   d B ) = 10 · log 10 L 2 M S E = 20 · log 10 L M S E
where L is the maximum pixel value of the current image. The less distorted image should have a higher PSNR value but a lower MSE value.
The SSIM is an index showing the similarity between two images. Different from the MSE and PSNR, the SSIM evaluates the quality of an image with a region of pixels instead of the individual pixel points, and thus it conforms to the human visual system. It calculates the similarity between the images in terms of luminance, contrast, and structure. The formulation of SSIM is
S S I M = ( 2 μ x μ y + c 1 ) ( 2 σ x y + c 2 ) ( μ x 2 + μ y 2 + c 1 ) ( σ x 2 + σ y 2 + c 2 )
where μ x is the average of x ,   μ y is the average of y , σ x 2 and σ y 2 are the variance of x and y , respectively, σ x y is the covariance of x and y , and c 1 and c 2 are the variables that stabilize the division. The value range of the SSIM is 0–1, and the image with better quality should have a higher SSIM value.

3. Results

3.1. Simulation Reconstruction Results

In all simulation and experiment results, binary images were used, and they were cut into circular shape to match the shape of the sensing system. The reconstruction results obtained via traditional TV algorithm were also given. For the accuracy analyses of the TV and CNN results, we used the input simulation image as the reference (‘True’ image). To give a better comparison between the two methods, the term ‘TV-CNN’ was also given. This took the TV result as the reference and thus showed the difference between the CNN results and the reference.
Table 4 gives the results of 9 simulation cases, in which cases 1–3 and cases 4–6 contained single inclusions with diameters of 16 pixels and 14 pixels, respectively, cases 7–8 were for double inclusions with diameters of 16 pixels and 14 pixels, and case 9 included three inclusions with diameters of 16 pixels, 14 pixels, and 12 pixels. For a better comparison, the initial pixel images recovered by the CNN were converted from binary images to RGB images with our MATLAB R2020b, MathWorks.Inc, USA, drawing function. Since some noise was added to the simulated measured data during the training process, the noise in the data translated to artifacts in the image domain. In the real experiments, we had the true 0 and 1 situations representing the conducting and nonconducting materials, where any value in between was ignored.
From the above table, we can see that the 625 CNN models could effectively reveal the number, size, and position of the simulated inclusions, with an average SSIM of 0.8658, average MSE of 0.0203, and average PSNR of 18.0856. With the increasing number of inclusions, the SSIM dropped and the MSE increased, while it could still reach an SSIM of over 0.7 and an MSE of less than 0.05 for three-sample detection. The consistency between the TV results and CNN results verifies the reliability of the CNN models and provides feasibility for experimental reconstruction.

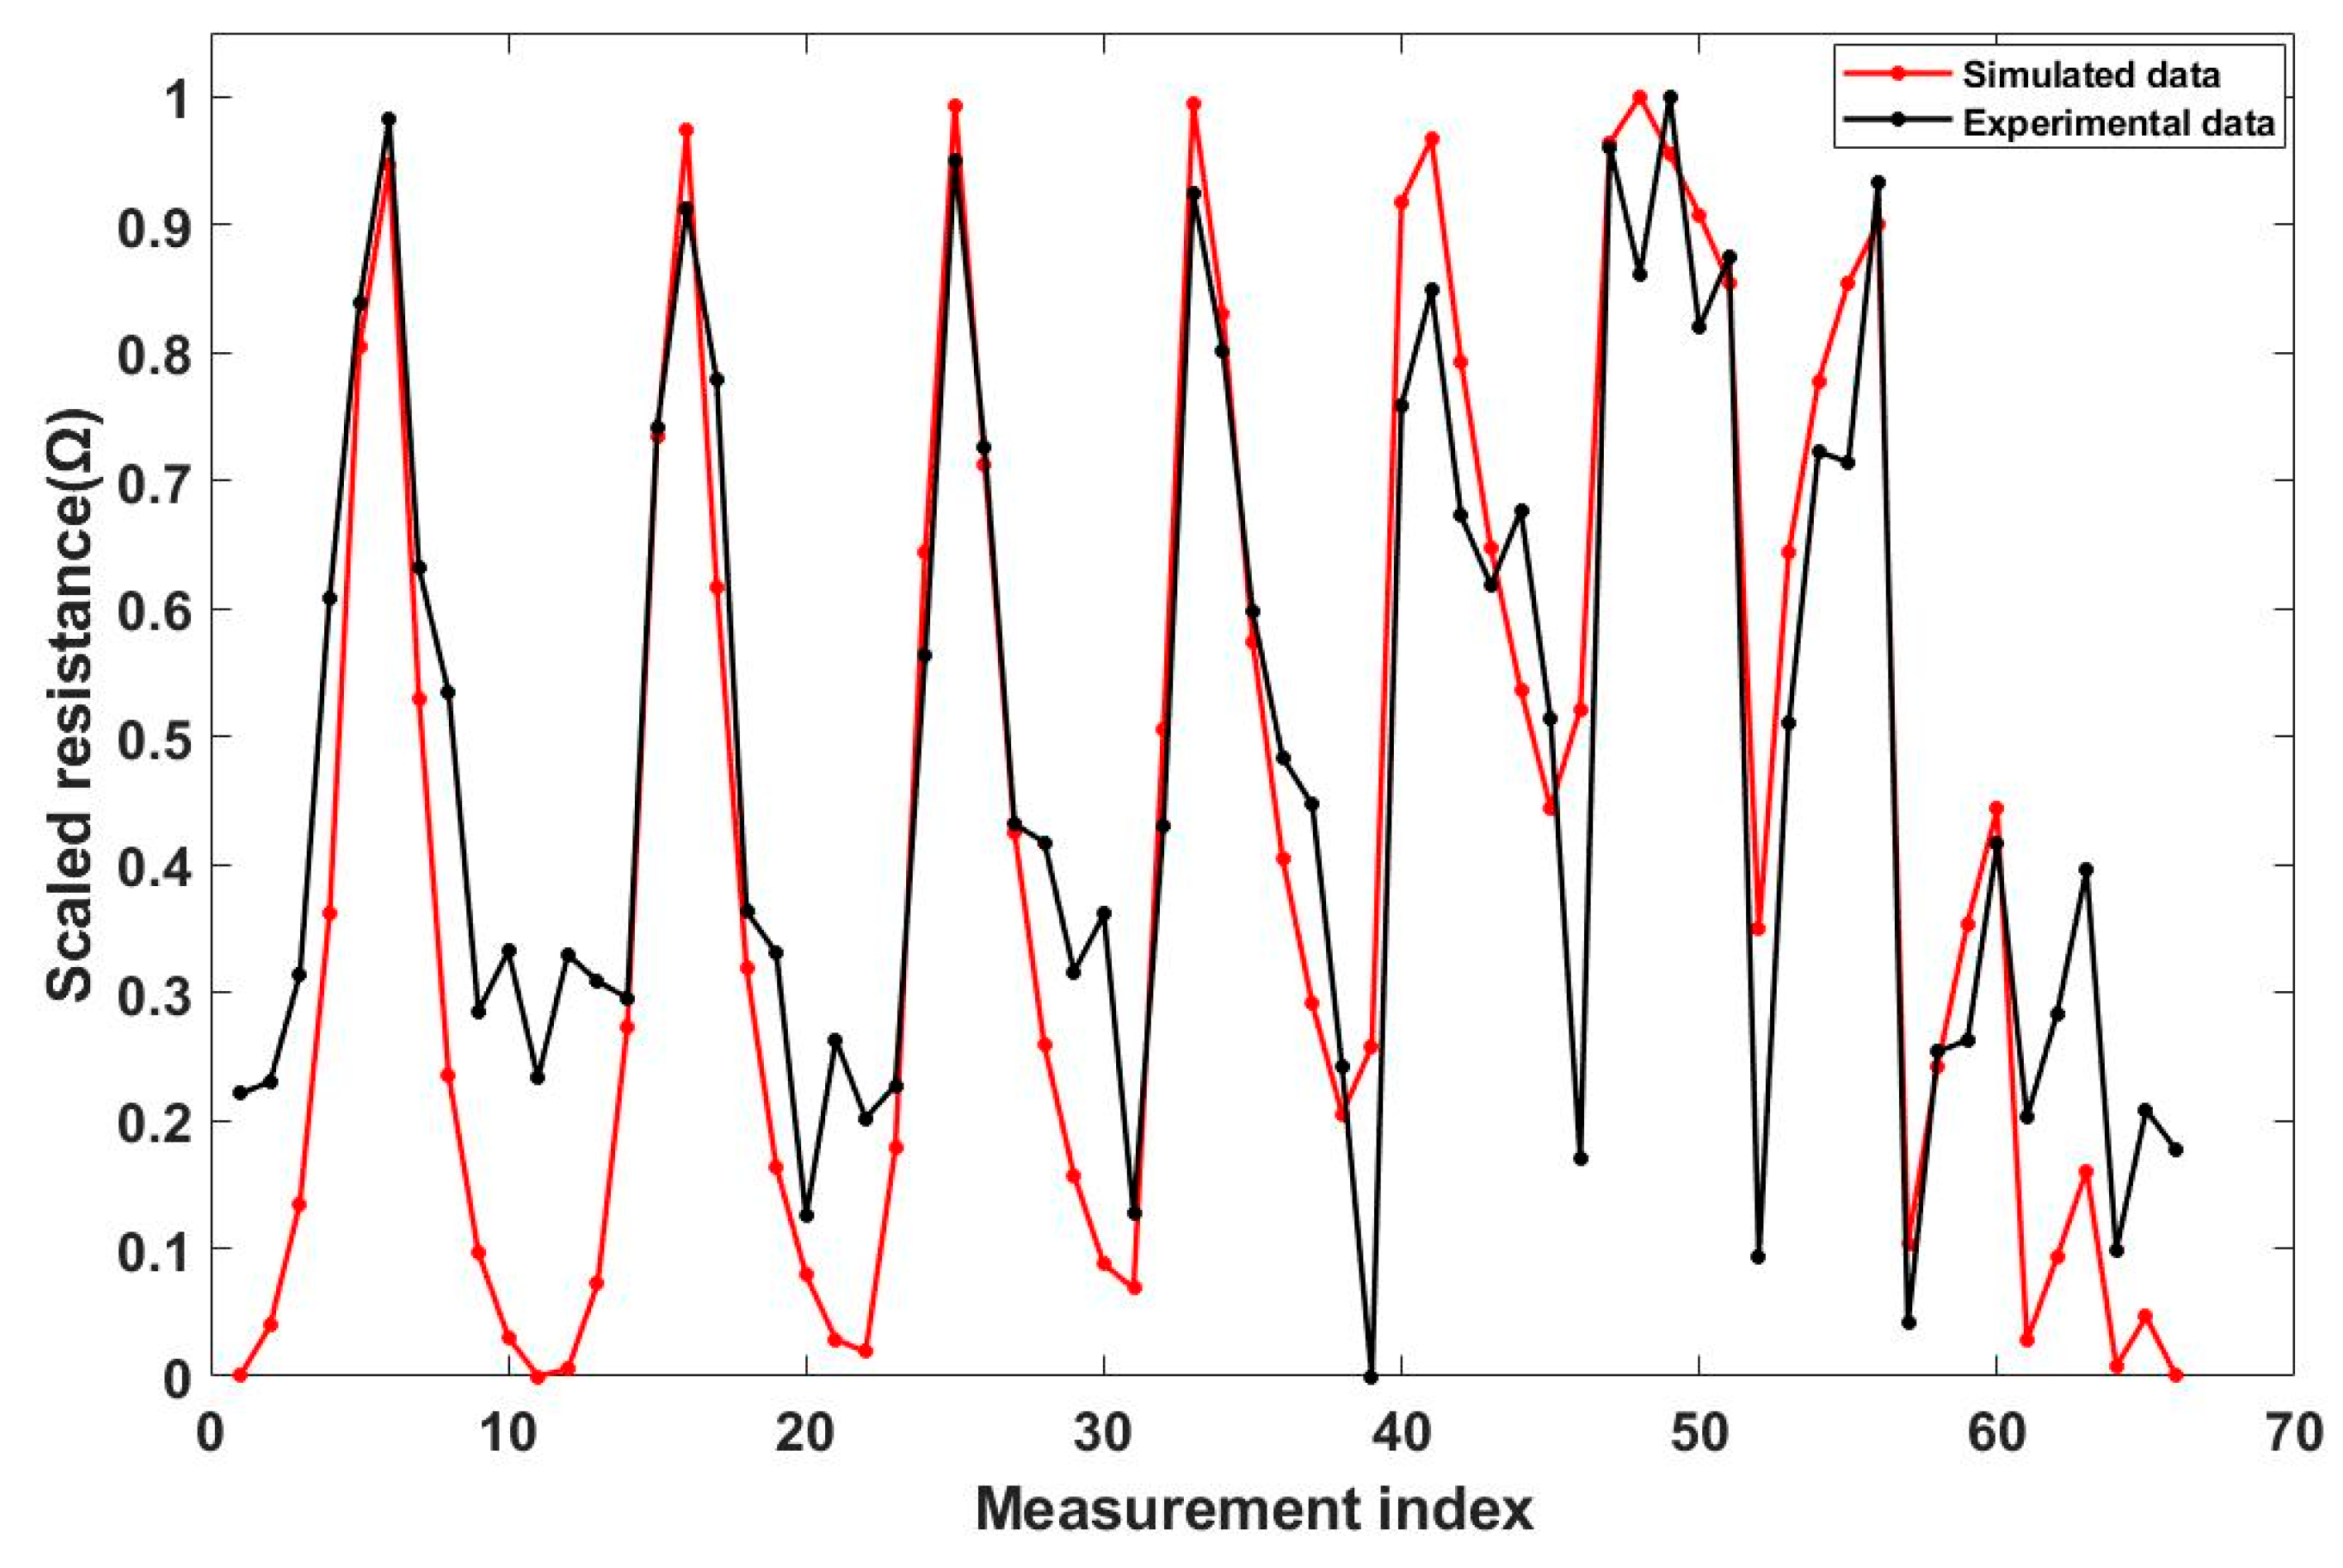
3.2. Experimental Reconstruction Results

Experimental data was collected from the CCERT system as shown in Figure 9a,b, which included an insulating pipe, a 12-electrode circular array sensor, 12 excitation and detection units, a signal control and processing unit, and a microcomputer. Plastic rods with diameters of 34.5 mm, 29.5 mm, and 26.5 mm were utilized as detected samples, which approximately matched the simulated inclusions with diameters of 16 pixels, 14 pixels, and 12 pixels, respectively. Their distributions also corresponded to the examined simulation cases in Table 4, so we took the same simulation image as the true image for each case. The TD method was adopted to eliminate background effects. Like in the simulated training data, each set of 66 experimental resistances were scaled to [0 1] and converted into an 11 × 6 matrix before being put into the models. The experimental reconstruction results are demonstrated in Table 5.
Comparing Table 4 and Table 5, for each case, the SNR value by the CNN for experimental reconstruction was lower than that of the simulation reconstruction due to the random noise and interference during measurements. Besides that, the effect of scaling also amplified the differences. Taking case 1 as an example, Figure 10 plots the 66 scaled resistance measurement data of the simulation and experimental tests. Both reasons led to a decrease of the SSIM and increase of the MSE in practical reconstruction. Even so, Table 5 shows that the CNN can be well applied for real data to reveal the relative size and position of the plastic rods, with an average SSIM of 0.7846, average MSE of 0.0408, and average PSNR of 14.3733, which indicates that our networks did well in terms of noise tolerance. The average SSIM, MSE, and PSNR for the TV method were 0.7947, 0.0436, and 14.1732, respectively. Figure 11a–c shows the comparisons of the SSIM, MSE, PSNR values via the CNN and TV methods.
In all nine experimental cases, six cases had higher SSIM values, lower MSE values, and higher PSNR values with the CNN method than those with the TV algorithm, which demonstrates the improvement in image reconstruction accuracy for the CCERT system by the multi-CNN approach and the feasibility of applying deep learning for two-phase material imaging by CCERT. What is more, the typical calculation time to reconstruct the image with the 625 DL models was around 1 min. Though the time of producing one image with a CNN was longer than that with the TV algorithm (several seconds) at the current time, the improvement of GPUs in the future can accelerate the reconstruction process to provide real-time imaging.

4. Conclusions

This research studied the feasibility of a CNN-based reconstruction algorithm for a circular CCERT system. CCERT has the same advantages as the traditional ERT system, including simplicity, no invasions, no radiation, rapid response, and a low cost. Additionally, CCERT avoids contact errors by inserting an insulation layer between the conductive mediums and electrodes. Additionally, CCERT could achieve a higher image quality due to the extended frequency range. The forward model was simulated based on the Maxwell equations and FEM method, and the image reconstruction was realized by a deep learning approach. A CNN was adopted as the network architecture due to its superior ability to extract features from the input data, and thus its suitability to use CNNs for classification tasks. Each 2500-pixel image was divided into 625 clusters so that a CNN could be applied on each cluster to solve the distinct multi-class classification problems. Each CNN took in data and mapped them into a label representing the pixel distribution. The CNN models were achieved by accessing data, constructing layers, setting training options, and conducting training. The training of each CNN was carried out separately to pursue a fitting model for each cluster. After tunings, the 625 models could achieve satisfying training accuracies, and they were then applied for the reconstruction of entire images. Both the simulation images and practical measurement images achieved acceptable results, which confirmed the practicability of applying multiple CNNs for image reconstruction in circular CCERT. The training with the simulated data and successful tests conducted with experimental data are very promising; the results allow greater depth of computer-based optimization of the CCERT system. In this study, the CNN approach was compared with one of the state-of-the-art total variation algorithms and provided similar performance. The TV algorithm still needed thresholding of the final image, which was not always straightforward, while the CNN was directly producing binary images. In this work, we considered nine scenarios to test whether the proposed CNN was capable of imaging with high quality. It is worth noticing that there were good performances shown by the state-of-the-art traditional imaging methods, such as TV algorithm, as well as both the shallow and deep neural networks. In future work, as more scenarios are considered to train the system, such as the case where inclusions contact each other, the performance of the system will become better. In theory, the proposed method should handle such nonlinearity, but it needs to be compared with a nonlinear traditional algorithm.

Author Contributions

Methodology and initial idea, G.M., Y.J., and M.S.; software development and analysis, G.M. and Z.C.; supervision, M.S. and B.W.; validation, M.S., B.W., and Y.J.; data collection, Y.J.; writing, G.M. and Z.C.; read and reviewed by M.S., B.W., and Y.J. All authors have read and agreed to the published version of the manuscript.

Funding

G.M.’s work was supported in part by the University of Bath, and in part by the Catherine and Raoul Hughes.

Data Availability Statement

Data can be provided upon request.

Conflicts of Interest

The authors declare no conflict of interest.

References

  1. Barber, D.C.; Brown, B.H. Applied potential tomography. J. Phys. E Sci. Instrum. 1984, 17, 723. [Google Scholar] [CrossRef]
  2. Brown, B.H.; Barber, D.C.; Seagar, A.D. Applied potential tomography: Possible clinical applications. Clin. Phys. Physiol. Meas. 1985, 6, 109. [Google Scholar] [CrossRef] [PubMed]
  3. Holder, D.S. Electrical impedance tomography (EIT) of brain function. Brain Topogr. 1992, 5, 87–93. [Google Scholar] [CrossRef] [PubMed]
  4. Adler, A.; Arnold, J.H.; Bayford, R.; Borsic, A.; Brown, B.; Dixon, P.; Faes, T.J.; Frerichs, I.; Gagnon, H.; Gärber, Y.; et al. GREIT: A unified approach to 2D linear EIT reconstruction of lung images. Physiol. Meas. 2009, 30, S35. [Google Scholar] [CrossRef]
  5. Cho, K.H.; Kim, S.; Lee, Y.J. A fast EIT image reconstruction method for the two-phase flow visualization. Int. Commun. Heat Mass Transf. 1999, 26, 637–646. [Google Scholar] [CrossRef]
  6. Brown, B.H. Medical Impedance Tomography and Process Impedance Tomography: A Brief Review. Meas. Sci. Technol 2001, 12, 991–996. [Google Scholar] [CrossRef]
  7. Adler, A.; Boyle, A. Electrical Impedance Tomography; Wiley Online Library: Hoboken, NJ, USA, 2020. [Google Scholar]
  8. Wahaba, Y.A.; Rahimb, R.A.; Rahimanc, M.H.F. Non-invasive Process Tomography in Chemical Mixtures—A Review. Sens. Actuators B Chem. 2015, 210, 602–617. [Google Scholar] [CrossRef]
  9. York, T.A. Status of Electrical Tomography in Industrial Applications. J. Electron. Imgaing 2001, 10, 608–619. [Google Scholar] [CrossRef]
  10. Boyle, A.; Adler, A. The Impact of Electrode Area, Contact Impedance and Boundary Shape on EIT Images. Physiol. Meas. 2011, 32, 745–754. [Google Scholar] [CrossRef]
  11. Jiang, Y.; Soleimani, M. Capacitively Coupled Resistivity Imaging for Biomaterial and Biomedical Applications. IEEE Access 2018, 6, 27069–27079. [Google Scholar] [CrossRef]
  12. Wang, B.; Tan, W.; Huang, Z.; Ji, H.; Li, H. Image Reconstruction Algorithm for Capacitively Coupled Electrical Resistance Tomography. Flow Meas. Instrum. 2014, 40, 216–222. [Google Scholar] [CrossRef]
  13. Wang, B.; Hu, Y.; Ji, H.; Huang, Z.; Li, H. A Novel Electrical Resistance Tomography System Based on C4D Technique. IEEE Trans. Instrum. Meas. 2013, 62, 1017–1024. [Google Scholar] [CrossRef]
  14. Wang, B.; Zhang, W.; Huang, Z.; Ji, H.; Li, H. Modeling and Optimal Design of Sensor for Capcacitively Coupled Electrical Resistance Tomography System. Flow Meas. Instrum. 2013, 31, 3–9. [Google Scholar] [CrossRef]
  15. Jiang, Y.; Soleimani, M. Capacitively Coupled Phase-based Dielectric Spectroscopy Tomography. Sci. Rep. 2018, 8, 1–10. [Google Scholar] [CrossRef]
  16. Ma, G.; Soleimani, M. Spectral Capacitively Coupled Electrical Resistivity Tomography for Breast Cancer Detection. IEEE Access 2020, 8, 50900–50910. [Google Scholar] [CrossRef]
  17. Wang, Y.; Wang, B.; Huang, Z.; Ji, H.; Li, H. New Capacitively Coupled Electrical Resistance Tomography (CCERT) System. Meas. Sci. Techonol. 2018, 29, 104007. [Google Scholar] [CrossRef]
  18. Jiang, Y.; Soleimani, M. Capacitively Coupled Electrical Impedance Tomography for Brain Imaging. IEEE Trans. Med Imaging 2019, 38, 2104–2113. [Google Scholar] [CrossRef] [PubMed]
  19. Tan, C.; Lv, S.; Dong, F.; Takei, M. Image Reconstruction Based on Convolutional Neural Network for Electrical Resistance Tomography. IEEE Sens. J. 2019, 19, 196–204. [Google Scholar] [CrossRef]
  20. Deng, L.; Yu, D. Deep Learning: Methods and Applications. Found. Trends Signal Process. 2014, 7, 197–387. [Google Scholar] [CrossRef] [Green Version]
  21. Hahnlosor, R.H.; Mahowald, M.A.; Douglas, R.J.; Seung, H.S. Digital Selection and Analogue Amplification Coexist in a Cortex-inspired Silicon Circuit. Nature 2000, 405, 947–951. [Google Scholar] [CrossRef]
  22. Glorot, X.; Bordes, A.; Bengio, Y. Deep Sparse Rectifier Neural Networks. In Proceedings of the Fourteenth International Conference on Artificial Intelligence and Statistics, (AISTATS), Fort Lauderdale, FL, USA, 11–13 April 2011. [Google Scholar]
  23. Lucas, A.; LIiadis, M.; Molina, R.; Katsaggelos, A. Using Deep Neural Networks for Inverse Porblems in Imaging: Beyond Analytical Methods. IEEE Signal Process. Mag. 2018, 35, 20–36. [Google Scholar] [CrossRef]
  24. DeOldify: Colorizing and Restoring Old Images and Videos with Deep Learning. Available online: https://blog.floydhub.com/colorizing-and-restoring-old-images-with-deep-learning/ (accessed on 20 September 2020).
  25. Fan, Y.; Ying, L. Solving Electrical Impedance Tomography with Deep Learning. J. Comput. Phys. 2020, 404, 109119. [Google Scholar] [CrossRef] [Green Version]
  26. Li, H.; Schwab, J.; Antholzer, S.; Haltmeier, M. NETT: Solving Inverse Problems with Deep Neural Networks. Inverse Probl. 2020, 36, 065005. [Google Scholar] [CrossRef] [Green Version]
  27. Amjad, J.; Sokolic, J.; Rodrigues, M.R. On Deep Learning for Inverse Problems. In Proceedings of the 26th European Signal Processing Conference (EUSIPCO), Rome, Italy, 3–7 September 2018. [Google Scholar]
  28. Aghdam, H.; Heravi, J. Elnaz, Guide to Convolutional Neural Networks; Springer: Berlin, Germany, 2017. [Google Scholar]
  29. Wei, Z.; Chen, X. Induced-current learning method for nonlinear reconstructions in electrical impedance tomography. IEEE Trans. Med Imaging 2019, 39, 1326–1334. [Google Scholar] [CrossRef] [PubMed]
  30. Zheng, J.; Ma, H.; Peng, L. A CNN-Based Image Reconstruction for Electrical Capacitance Tomography. In Proceedings of the 2019 IEEE International Conference on Imaging Systems and Techniques (IST), Abu Dhabi, United Arab Emirates, 8–10 December 2019. [Google Scholar]
  31. Xiao, J.; Liu, Z.; Zhao, P.; Ji, Y.; Huo, J. Deep Learning Image Reconstruction Simulation for Electromagnetic Tomography. IEEE Sens. J. 2018, 18, 3290–3298. [Google Scholar] [CrossRef]
  32. Fernández-Fuentes, X.; Mera, D.; Gómez, A.; Vidal-Franco, I. Towards a fast and accurate eit inverse problem solver: A machine learning approach. Electronics 2018, 7, 422. [Google Scholar] [CrossRef] [Green Version]
  33. Rymarczyk, T.; Kłosowski, G.; Kozłowski, E.; Tchórzewski, P. Comparison of selected machine learning algorithms for industrial electrical tomography. Sensors 2019, 19, 1521. [Google Scholar] [CrossRef] [PubMed] [Green Version]
  34. Tholin-Chittenden, C.; Soleimani, M. Planar Array Capacitive Imaging Sensor Design Optimization. IEEE Sens. J. 2017, 17, 8059–8071. [Google Scholar] [CrossRef] [Green Version]
  35. Li, F.; Soleimani, M.; Abascal, J. Planar Array Magnetic Induction Tomography Further Improvement. Sens. Rev. 2019, 39, 257–268. [Google Scholar] [CrossRef] [Green Version]
  36. Wang, Y. Study on Image Reconstruction of Capacitively Coupled Electrical Impedance Tomography (CCEIT). Meas. Sci. Techonol. 2019, 30, 094002. [Google Scholar] [CrossRef]
  37. Tan, W.; Wang, B.; Huang, Z.; Ji, H.; Li, H. New image reconstruction algorithm for capacitively coupled electrical resistance tomography. IEEE Sensors J. 2017, 17, 8234–8241. [Google Scholar] [CrossRef]
  38. Russell, S.J.; Norvig, P. Artificial Intelligence: A Modern Approach, 3rd ed.; Prentice Hall: Hoboken, NJ, USA, 2010. [Google Scholar]
  39. Ndajah, P.; Kikuchi, H.; Yukawa, M.; Watanabe, H.; Muramatsu, S. SSIM image quality metric for denoised images. In Proceedings of the 3rd WSEAS Int. Conf. on Visualization, Imaging and Simulation, Faro, Portugal, 3–5 November 2010; pp. 53–58. [Google Scholar]
  40. Sara, U.; Akter, M.; Uddin, M.S. Image quality assessment through FSIM, SSIM, MSE and PSNR—A comparative study. J. Comput. Commun. 2019, 7, 8–18. [Google Scholar] [CrossRef] [Green Version]
Figure 1. (a) Demonstration of an electrode pair. (b) Equivalent detection circuit.
Electronics 10 01058 g001
Figure 2. Conversion between pixels and clusters, showing the whole picture of the pixels and the demonstration of conversion process.
Electronics 10 01058 g002aElectronics 10 01058 g002b
Figure 3. The reconstruction processes.
Electronics 10 01058 g003
Figure 4. The CNN (convolutional neural network) model development.
Electronics 10 01058 g004
Figure 5. The CNN architecture illustration.
Electronics 10 01058 g005
Figure 6. The training progress plot for the 313th cluster, generated by MATLAB.
Electronics 10 01058 g006
Figure 7. (a) Cluster grid and the selected clusters (marked with red squares). (b) Comparison of the selected clusters for validation and test accuracy.
Electronics 10 01058 g007
Figure 8. The plot of the (a) precision and (b) recall values of 625 CNN networks for class 1 and class 16.
Electronics 10 01058 g008
Figure 9. (a) A photo of the 12-electrode CCERT (capacitively coupled electrical resistance tomography) system and (b) the 12-electrode CCERT system setup.
Electronics 10 01058 g009
Figure 10. Simulated and experimental resistance plot for case 1.
Electronics 10 01058 g010
Figure 11. (a) SSIM (structural similarity) plot (b) MSE (mean squared error) plot (c) PSNR (peak signal-to-noise ratio) plot for 9 reconstruction cases by CNN and TV (total variation).
Electronics 10 01058 g011aElectronics 10 01058 g011b
Table 1. Pixel distributions within one cluster.
Label Number12345678910111213141516
Binary Matrix 1 1 1 1 1 1 0 1 1 0 1 1 0 1 1 1 1 1 1 0 1 0 0 1 0 1 1 0 0 0 1 1 1 1 0 0 1 0 1 0 0 1 0 1 0 0 0 1 1 0 0 0 0 0 1 0 0 1 0 0 0 0 0 0
Pixel Pattern Electronics 10 01058 i001 Electronics 10 01058 i002 Electronics 10 01058 i003 Electronics 10 01058 i004 Electronics 10 01058 i005 Electronics 10 01058 i006 Electronics 10 01058 i007 Electronics 10 01058 i008 Electronics 10 01058 i009 Electronics 10 01058 i010 Electronics 10 01058 i011 Electronics 10 01058 i012 Electronics 10 01058 i013 Electronics 10 01058 i014 Electronics 10 01058 i015 Electronics 10 01058 i016
Table 2. The 16 class distributions of the sampled cases. (Each case had 625 distribution possibilities).
CaseWith a Single 14-Pixel Length InclusionWith a Single 16-Pixel Length InclusionWith 14- and 16-Pixel Length InclusionsWith 16-, 14-, and 12-Pixel Length Inclusions
Class
1453482102
20103
30103
40103
50103
60000
70000
83353
93353
103053
113053
121114
131114
141114
151114
16564577519483
Table 3. Details of CNN (convolutional neural network) layers and parameters.
LayerName and TypeOperationActivationsLearnable
1Imageinput
(Image Input)
11 × 6 × 1 images with ‘zerocenter’ normalization 11 × 6 × 1 -
2conv_1
(Convolution)
150 3 × 3 × 1 convolutions with stride [1 1] and padding ‘same’ 11 × 6 × 150 Weights 3 × 3 × 1 × 150
Bias 1 × 1 × 150
3batchnorm_1
(Batch Normalization)
Batch normalization with 150 channels 11 × 6 × 150 Offset 1 × 1 × 150
Scale 1 × 1 × 150
4relu_1
(ReLU)
ReLU 11 × 6 × 150 -
5maxpool_1
(Max Pooling)
2 × 2 max pooling with stride [1 1] and padding [0 0 0 0] 10 × 5 × 150 -
6conv_2
(Convolution)
125 3 × 3 × 150 convolutions with stride [1 1] and padding ‘same’ 10 × 5 × 125 Weights 3 × 3 × 150 × 125
Bias 1 × 1 × 125
7batchnorm_2
(Batch Normalization)
Batch normalization with 125 channels 10 × 5 × 125 Offset 1 × 1 × 125
Scale 1 × 1 × 125
8relu_2
(ReLU)
ReLU 10 × 5 × 125 -
9maxpool_2
(Max Pooling)
2 × 2 max pooling with stride [1 1] and padding [0 0 0 0] 9 × 4 × 125 -
10conv_3
(Convolution)
50 3 × 3 × 125 convolutions with stride [1 1] and padding ‘same’ 9 × 4 × 50 Weights 3 × 3 × 125 × 50
Bias 1 × 1 × 50
11batchnorm_3
(Batch Normalization)
Batch normalization with 50 channels 9 × 4 × 50 Offset 1 × 1 × 50
Scale 1 × 1 × 50
12relu_3
(ReLU)
ReLU 9 × 4 × 50 -
13maxpool_3
(Max Pooling)
2 × 2 max pooling with stride [1 1] and padding [0 0 0 0] 8 × 3 × 50 -
14conv_4
(Convolution)
16 3 × 3 × 50 convolutions with stride [1 1] and padding ‘same’ 8 × 3 × 16 Weights 3 × 3 × 50 × 16
Bias 1 × 1 × 16
15batchnorm_4
(Batch Normalization)
Batch normalization with 16 channels 8 × 3 × 16 Offset 1 × 1 × 16
Scale 1 × 1 × 16
16relu_4
(ReLU)
ReLU 8 × 3 × 16 -
17fc
(Fully Connected)
16 fully connected layer 1 × 1 × 16 Weights 16 × 384
Bias 16 × 1
18softmax
(Softmax)
Softmax 1 × 1 × 16 -
19focallossoutput
(Focal Loss Layer)
Focal loss layer--
Table 4. Detailed simulation reconstruction results and accuracy analyses.
CaseImage Reconstruction IllustrationsEvaluation Metrics
1 Electronics 10 01058 i017SSIMCNN0.9011
TV0.8544
TV-CNN0.9215
MSECNN0.0140
TV0.0240
TV-CNN0.0100
PSNRCNN18.5387
TV16.1979
TV-CNN20.0000
2 Electronics 10 01058 i018SSIMCNN0.9150
TV0.8425
TV-CNN0.8863
MSECNN0.0124
TV0.0296
TV-CNN0.0180
PSNRCNN19.0658
TV15.2871
TV-CNN17.4473
3 Electronics 10 01058 i019SSIMCNN0.9043
TV0.9842
TV-CNN0.9131
MSECNN0.0132
TV0.0020
TV-CNN0.0120
PSNRCNN18.7943
TV26.9897
TV-CNN19.2082
4 Electronics 10 01058 i020SSIMCNN0.9502
TV0.9270
TV-CNN0.9170
MSECNN0.0064
TV0.0116
TV-CNN0.0132
PSNRCNN21.9382
TV19.3554
TV-CNN18.7943
5 Electronics 10 01058 i021SSIMCNN0.9288
TV0.8886
TV-CNN0.8576
MSECNN0.0092
TV0.0184
TV-CNN0.0276
PSNRCNN20.3621
TV17.3518
TV-CNN15.5909
6 Electronics 10 01058 i022SSIMCNN0.9538
TV0.8735
TV-CNN0.8668
MSECNN0.0060
TV0.0168
TV-CNN0.0196
PSNRCNN22.2185
TV17.7469
TV-CNN17.0774
7 Electronics 10 01058 i023SSIMCNN0.7713
TV0.6736
TV-CNN0.6740
MSECNN0.0388
TV0.0568
TV-CNN0.0660
PSNRCNN14.1117
TV12.4565
TV-CNN11.8046
8 Electronics 10 01058 i024SSIMCNN0.7660
TV0.6240
TV-CNN0.6574
MSECNN0.0356
TV0.0704
TV-CNN0.0724
PSNRCNN14.4855
TV11.5243
TV-CNN11.4026
9 Electronics 10 01058 i025SSIMCNN0.7016
TV0.5970
TV-CNN0.4947
MSECNN0.0472
TV0.0604
TV-CNN0.0868
PSNRCNN13.2606
TV12.1896
TV-CNN10.6148
Table 5. Experimental reconstruction results and accuracy analyses.
CaseImage Reconstruction IllustrationsEvaluation Metrics
1
Electronics 10 01058 i026
Electronics 10 01058 i027SSIMCNN0.8509
TV0.8300
TV-CNN0.8224
MSECNN0.0264
TV0.0392
TV-CNN0.0400
PSNRCNN15.7840
TV14.0671
TV-CNN13.9794
2
Electronics 10 01058 i028
Electronics 10 01058 i029SSIMCNN0.8599
TV0.8357
TV-CNN0.8729
MSECNN0.0240
TV0.0408
TV-CNN0.0320
PSNRCNN16.1979
TV13.8934
TV-CNN14.9485
3
Electronics 10 01058 i030
Electronics 10 01058 i031SSIMCNN0.8071
TV0.8531
TV-CNN0.8226
MSECNN0.0352
TV0.0260
TV-CNN0.0268
PSNRCNN14.5346
TV15.8503
TV-CNN15.7187
4
Electronics 10 01058 i032
Electronics 10 01058 i033SSIMCNN0.8778
TV0.8879
TV-CNN0.8581
MSECNN0.0216
TV0.0204
TV-CNN0.0268
PSNRCNN16.6555
TV16.9037
TV-CNN15.7187
5
Electronics 10 01058 i034
Electronics 10 01058 i035SSIMCNN0.8937
TV0.8708
TV-CNN0.9000
MSECNN0.0200
TV0.0268
TV-CNN0.0284
PSNRCNN16.9897
TV15.7187
TV-CNN15.4668
6
Electronics 10 01058 i036
Electronics 10 01058 i037SSIMCNN0.7317
TV0.8679
TV-CNN0.7244
MSECNN0.0464
TV0.0200
TV-CNN0.0464
PSNRCNN13.3348
TV16.9897
TV-CNN13.3348
7
Electronics 10 01058 i038
Electronics 10 01058 i039SSIMCNN0.6939
TV0.6830
TV-CNN0.7469
MSECNN0.0580
TV0.0700
TV-CNN0.0472
PSNRCNN12.3657
TV11.5490
TV-CNN13.2606
8
Electronics 10 01058 i040
Electronics 10 01058 i041SSIMCNN0.7415
TV0.7236
TV-CNN0.7440
MSECNN0.0576
TV0.0696
TV-CNN0.0496
PSNRCNN12.3958
TV11.5739
TV-CNN13.0452
9
Electronics 10 01058 i042
Electronics 10 01058 i043SSIMCNN0.6037
TV0.6000
TV-CNN0.6500
MSECNN0.0776
TV0.0792
TV-CNN0.0664
PSNRCNN11.1014
TV11.0127
TV-CNN11.7783
Publisher’s Note: MDPI stays neutral with regard to jurisdictional claims in published maps and institutional affiliations.

