Article

3D Sound Coding Color for the Visually Impaired

1
Department of Electronic and Electrical Engineering, Sungkyunkwan University, Suwon 16419, Gyeonggi-do, Korea
2
Department of Electrical and Computer Engineering, Sungkyunkwan University, Suwon 16419, Gyeonggi-do, Korea
3
Department of Human Information and Cognition Technology Convergence, Sungkyunkwan University, Suwon 16419, Gyeonggi-do, Korea
*
Author to whom correspondence should be addressed.
Electronics 2021, 10(9), 1037; https://doi.org/10.3390/electronics10091037
Submission received: 19 March 2021 / Revised: 15 April 2021 / Accepted: 22 April 2021 / Published: 27 April 2021
(This article belongs to the Special Issue Multi-Sensory Interaction for Blind and Visually Impaired People)

Abstract

:
Contemporary art is evolving beyond simply looking at works, and the development of various sensory technologies has had a great influence on culture and art. Accordingly, opportunities for the visually impaired to appreciate visual artworks through various senses such as auditory and tactile senses are expanding. However, insufficient sound expression and lack of portability make it less understandable and accessible. This paper attempts to convey a color and depth coding scheme to the visually impaired, based on alternative sensory modalities, such as hearing (by encoding the color and depth information with 3D sounds of audio description) and touch (to be used for interface-triggering information such as color and depth). The proposed color-coding scheme represents light, saturated, and dark colors for red, orange, yellow, yellow-green, green, blue-green, blue, and purple. The paper’s proposed system can be used for both mobile platforms and 2.5D (relief) models.

1. Introduction

According to the 2020 data on visual impairment from the WHO, globally, the number of people of all ages visually impaired is estimated to be 285 million, of whom 39 million are blind [1]. People with visual impairments are interested in visiting museums and enjoying visual art [2]. Although many museums have improved the accessibility of their exhibitions and artworks through specialized tours and the access to tactile representations of artworks [3,4,5], it is still not enough to meet the needs of the visually impaired [6].
Multisensory (or multimodal) integration is an essential part of information processing by which various forms of sensory information, such as sight, hearing, touch, and proprioception (also called kinesthesia, the sense of self-movement and body position), is combined into a single experience [7]. The cross sensation between sight and other senses here refers to the representation of sight and other senses at the same time, but the aim of this paper is to use more than two other senses, such as touch and audio, besides the visual one to perform at the same time. Making art accessible to the visually impaired requires the ability to convey explicit and implicit visual images through non-visual forms. It argues that a multi-sensory system is needed to successfully convey artistic images. What art teachers wanted to do most with their blind students is to have them imagine colors using a variety of senses—audio, touch, scent, music, poetry, or literature.
In viewing artworks by the visually impaired, museums generally provide visually impaired people with audio explanatory guides that focus on the visual representation of the objects in paintings [8]. Brule et al. [9] created a raised-line overlaying multisensory interactive map on a capacitive projected touch screen for visually impaired children after a five-week field study in a specialized institute. Their map consisted of several multisensory tangibles that can be explored in a tactile way but can also be smelled or tasted, allowing users to interact with them using touch, taste, and smell together. A sliding gesture in the dedicated menu in Mapsense filters geographical information (e.g., cities, seas, etc.). Additionally, the Mapsense design used conductive tangibles that can be detected. Some tangibles can be filled with “scents”, such as olive puree, mashed raisins, and honey, which means that they use different methods (scent and taste) to promote reflexive learning and use objects to support storytelling. The Metropolitan Museum of Art in New York has displayed replicas of the artworks exhibited in the museum [10]. The Art Talking Tactile Exhibit Panel in the San Diego Museum allows visitors to touch Juan Sánchez Cotán’s master still-life, “Quince, Cabbage, Melon, and Cucumber”, painted in Toledo, Spain, in 1602 [11]. If the users touch one of these panels with bare hands or wearing light gloves, they can hear information about the touched part. This is like tapping on an iPad to make something happen; however, instead of a smooth, flat touch screen, these exhibit panels can include textures, bas-relief, raised lines, and other tactile surface treatments. Dobbelstein et al. [12] introduced inScent, a wearable olfactory display that allows users to receive notifications through scent in a mobile environment. Anagnostakis et al. [13] used proximity and touch sensors to provide voice guidance on museum exhibits through mobile devices. Reichinger et al. [14] introduced the concept of a gesture-controlled interactive audio guide for visual artworks that uses depth-sensing cameras to sense the location and gestures of the user’s hands during tactile exploration of a bas-relief artwork model. The guide provides location-dependent audio descriptions based on user hand positions and gestures. Recently, Cavazos et al. [15] provided an audio description as well as related sound effects when the user touched a 2.5D-printed model with their finger. Thus, the visually impaired could enjoy it freely, independently, and comfortably through touch to feel the artwork shapes and textures and to listen and explore the explanation of objects of their interest without the need for a professional curator.
The use of binaural techniques that have been used to express the direction of sound is rarely used to express colors in works of art for the visually impaired. However, the connection between color and spatial audio using binaural recordings [16] of audio when appreciating colors in artworks using binaural sound has not been addressed. When using spatial audio to artificially represent the color wheel, it is necessary to investigate whether it is confusing or has a positive effect on color perception. Binaural technology allows the augmentation of spatial positioning of sound with the usage of a simple pair of headphones. Binaural recording and rendering refer specifically to recording and reproducing sounds in two ears [16]. It is designed to resemble the human two-ear auditory system and normally works with headphones [17]. Lessard et al. [18] investigated how the three-dimensional spatial mapping is carried out by early blind individuals with or without residual vision. Subjects were tested under monaural and binaural listening conditions. They found that early blind subjects could map their auditory environment with equal or better accuracy than sighted subjects. In [19], 3D-Sound was useful for visually impaired people; they felt significantly higher confidence in 3D-Sound.
This paper proposes a tool to intuitively recognize and understand the three elements of color: hue, value, and saturation using spatial audio. In addition, when touching objects in artwork with a finger, the description of the work is provided by voice, and the color, brightness, and depth of the object are expressed through the modulation of the voice.

2. Background and Related Works

2.1. Review of Tactile and Sound Coding Color

In order to convey color to visually impaired people, a method of coding color with tactile patterns or sounds has been proposed [20,21,22,23]. Taras et al. [20] presented a color code created for viewing on braille devices. The primary colors, red, blue, and yellow, are each coded by two dots. Mixed colors, for example, violet, green, orange, and brown, are coded as combinations of dots representing the primary colors. Additionally, the light and dark shades are added by using the second and third dots in the left column of the Braille cell.
Ramsamy-Iranah et al. [21] designed color symbols for children. The design process for the symbols was influenced by the children’s prior knowledge of shapes and linked to their surroundings. For example, a small square box was associated with dark blue, reflecting the blue square soap, a circle represented red because it was associated with the red “dot” called “bindi” on the forehead of a Hindu woman. Yellow was represented by small dots reflecting the pollen of flowers. Orange is a mixture of yellow and red; therefore, circles of smaller dimensions were used to represent orange. Horizontal lines represented purple, and curved lines were associated with the green representative of bendable grass stems.
Shin et al. [22] coded nine colors (pink, red, orange, yellow, green, blue, navy, purple, brown, and achromatic) using a grating orientation (a regularly spaced collection of identical, parallel, elongated elements). The texture stimuli for color were structured by matching variations of orientation to hue, the width of the line to chroma, and the interval between the lines to value. The eight chromatic colors were divided into 20° angles and were achromatic at 90°. Each color had nine levels of value and of chroma.
Cho et al. [23] developed a tactile color pictogram that used the shape of the sky, earth, and people derived from thoughts of heaven, earth, and people as metaphors. Colors could thus be recognized easily and intuitively by touching the different patterns. An experiment comparing the cognitive capacity for color codes found that users could intuitively recognize 24 chromatic and 5 achromatic colors with tactile codes [23].
Besides tactile patterns, sound patterns [24,25,26,27] use classical music sounds played on different instruments. Cho et al. [27] considered the tone, intensity, and pitch of melody sound extracted from classic music to express the brightness and saturation of colors. The sound code system represented 18 chromatic and 5 achromatic colors using classical music sounds played on different instruments. While using sound to depict color, tapping a relief-shaped embossed outline area transformed the color of that area into the sound of an orchestra instrument. Furthermore, the overall color composition of Van Gogh’s “The Starry Night” was expressed as a single piece of music that accounted for color using the tone, key, tempo, and pitch of the instruments. The shape could be distinguished by touching it with a hand, but the overall color composition could be conveyed as a single piece of music, thereby reducing the effort required to recognize color from needing to touch each pattern one by one [27].
Jabber et al. [28] developed an interface that automatically translated reference colors into spatial tactile patterns. A range of achromatic colors and six prominent basic colors were represented with three levels of chroma and values through a color watch design. The color was represented through combination discs that represented the color hue, and square discs that represented lightness, and were perceived by touch.
This paper introduces two sound color codes, a six-color wheel and an eight-color wheel, created with 3D sound, based on the aforementioned observations. Table 1 shows a comparison between the previous color codes and the two sound color codes proposed in this paper.

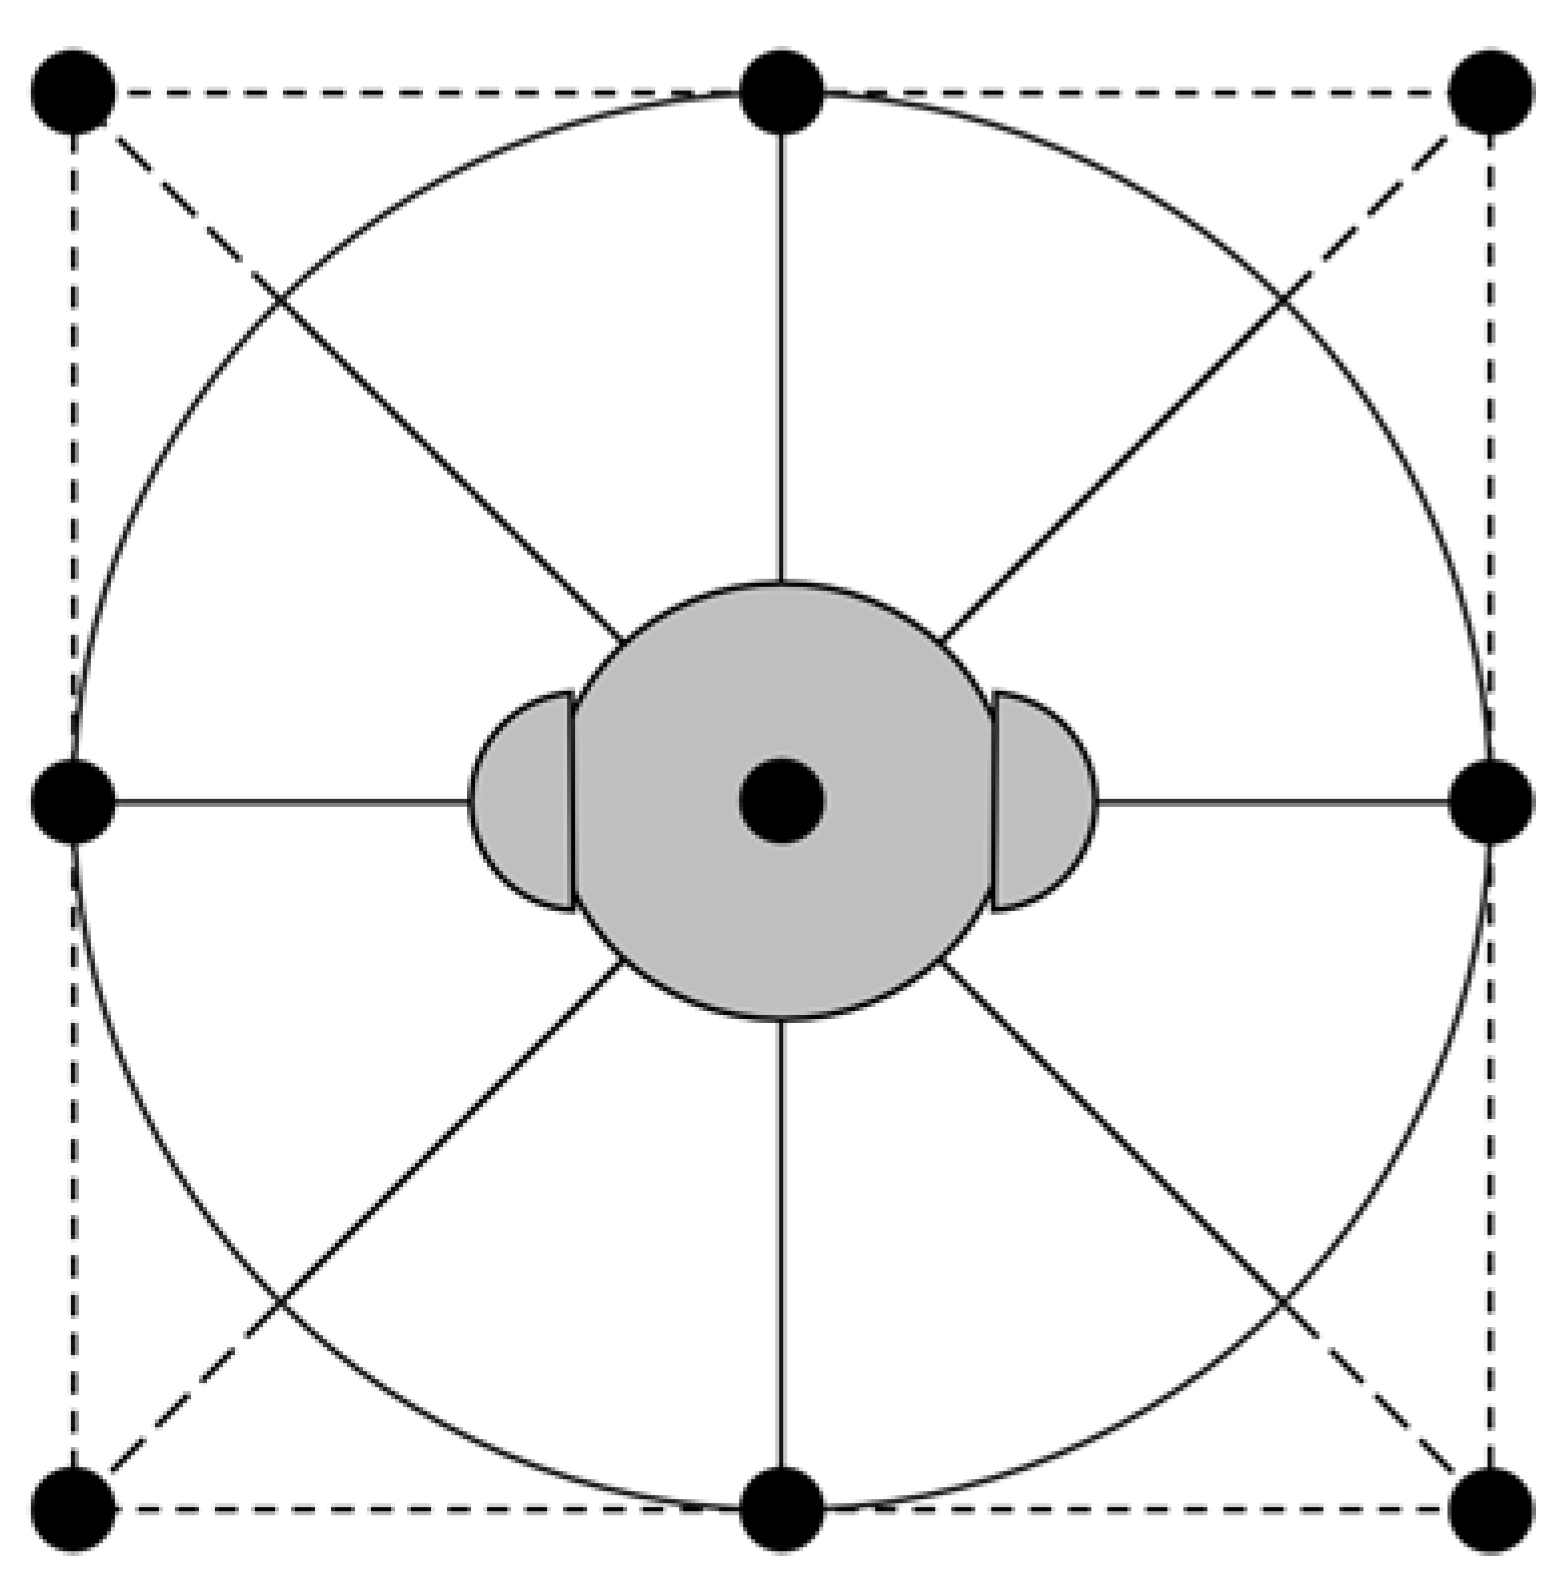
2.2. Review of HRTF Systems

The Head-Related Transfer Function (HRTF) is a filter defined on a spherical area that describes how the shape of the listener’s head, torso, and ears affects incoming sound from all directions [29]. When sound hits the listener, the size and shape of the head, ears and ear canal, the density of the head, and the size and shape of the nasal and oral cavity all alter the sound and affect the way the sound is perceived, raising some frequencies and attenuating others. Therefore, the time difference between the two ears, the level difference between the two ears, and the interaction between sound and personal body anatomy are important for HRTF calculation. In this way, the ordinary audio is converted to 3D sound. Although binaural synthesis with HRTFs has been implemented in real-time applications, only a few commercialized applications utilize it. Limited research exists on the differences between audio systems that use HRTF, compared to systems that do not [30]. Systems that do not use HRTF in their binaural synthesis instead often use a simplified interaural intensity difference (IID) [30]. This simplified IID alters the amplitude equally for all frequencies, relative to orientation and distance from the audio source to both ears of the listener. These systems do not utilize any audio cues for vertical placement and will therefore be referred to as “panning systems”, while systems that use HRTF do have cues for vertical placement, and will therefore be referred to as “3D audio systems”. Three-dimensional audio systems will show a difference in human localization performance compared to a panning system, because these systems utilize more precise spatial audio cues than panning systems. These results suggest that 3D audio systems are better than panning systems in terms of precision, speed, and navigation, in an audio-exclusive virtual environment [31]. Additionally, the non-individualized HRTF filters currently in use may lack the published accuracy [32], but a better-personalized HRTF will increase the accuracy. Most of the virtual auditory displays employ generic or non-individualized HRTF filters that lead to a decreased sound localization accuracy [33].
Use cases of individualized HRTFs can be found for hearing aids [34], dereverberation [35], stereo recording enhancements [36], emotion recognition [37], 3D detection assisting blind people to avoid obstacles [38], etc.
In [18,19,38], spatial sound was proven useful for visually impaired people, and they felt significantly higher confidence with spatial sound. This paper reveals through experiments that spatial sound expressing colors through HRTF is an effective way to convey color information. The paper’s spatial sound strategy is based on cognitive training and sensory adaptation to spatial sounds synthesized with a non-individualized HRTF. To the best of our knowledge, no HRTF has been applied to represent color wheels.
Drossos et al. [39] used binaural technology to provide accessible games for blind children. In the game of Tic-Tac-Toe, they used binaural processing of selected audio material performed by the utilization of a KEMAR HRTF library [40], and through three kinds of sound presentation methods to carry out the information transmission and feedback in the game. The first method was to use eight different azimuths in the 0° elevation plane to represent the Tic-Tac-Toe chessboard shown in Figure 1. The second method was to use a combination of three elevations and three azimuths to simulate a Tic-Tac-Toe chessboard standing upright in front of the user. The third method was the same as the second method, but used pitch instead of elevation.

2.3. Review of the Sound Representations of Colors

Newton’s Opticks [41] showed that the colors of the spectrum and the pitches of musical scales are similar (for example, “red” and “C”; “green” and “Ab”). Maryon [42] also explored the similarity between the ratio of each tone to the wavelength of each color to connect them. This method of associating the pitch frequency of the scale with color can be a way of substituting colors and notes for one another [43]. However, the various sensibilities that can be obtained through color are limited by simply substituting colors into the musical scale. Lavigna [44] suggested that the technique of a composer in organizing an orchestra seems very similar to the technique of a painter applying colors. In other words, a musician’s palette is a list of orchestral instruments.
A comprehensive survey of associations between color and sound can be found in [45], including how different color properties such as value and hue are mapped onto acoustic properties such as pitch and loudness. Using an implicit associations test, those researchers [45] confirmed the following cross-modal correspondences between visual and acoustic features. Pitch was associated with color lightness, whereas loudness mapped onto greater visual saliency. The associations between vowels and colors are mediated by differences in the overall balance of low- and high-frequency energy in the spectrum rather than by vowel identity as such. The hue of colors with the same luminance and saturation was not associated with any of the tested acoustic features, except for a weak preference to match higher pitch with blue (vs. yellow). In other research, high loudness was associated with orange/yellow rather than blue, and the high pitch was associated with yellow rather than blue [46].
Chroma has a relationship with sound intensity [46,47]. When the intensity of a sound is strong and loud, its color is close, intense, and deep. However, when the sound intensity is weak, the color feels pale, faint, and far away. A higher value is associated with higher pitch [48,49]. Children of all ages and adults matched pitch to value and loudness to chroma. The value (i.e., lightness) is high and heavily dependent on the light and dark levels of the color. Using the same concept in music, sound is divided into light and heavy feelings according to the high and low octaves of a scale. Another way to match color and sound is to associate an instrument’s tone with color, as in Kandinsky [24]. A low-pitched cello has a low-brightness dark blue color, a violin or trumpet-like instrument with a sharp tone feels red or yellow, and a high-pitched flute feels like a bright and saturated sky blue.

3. Binaural Audio Coding Colors with Spatial Color Wheel

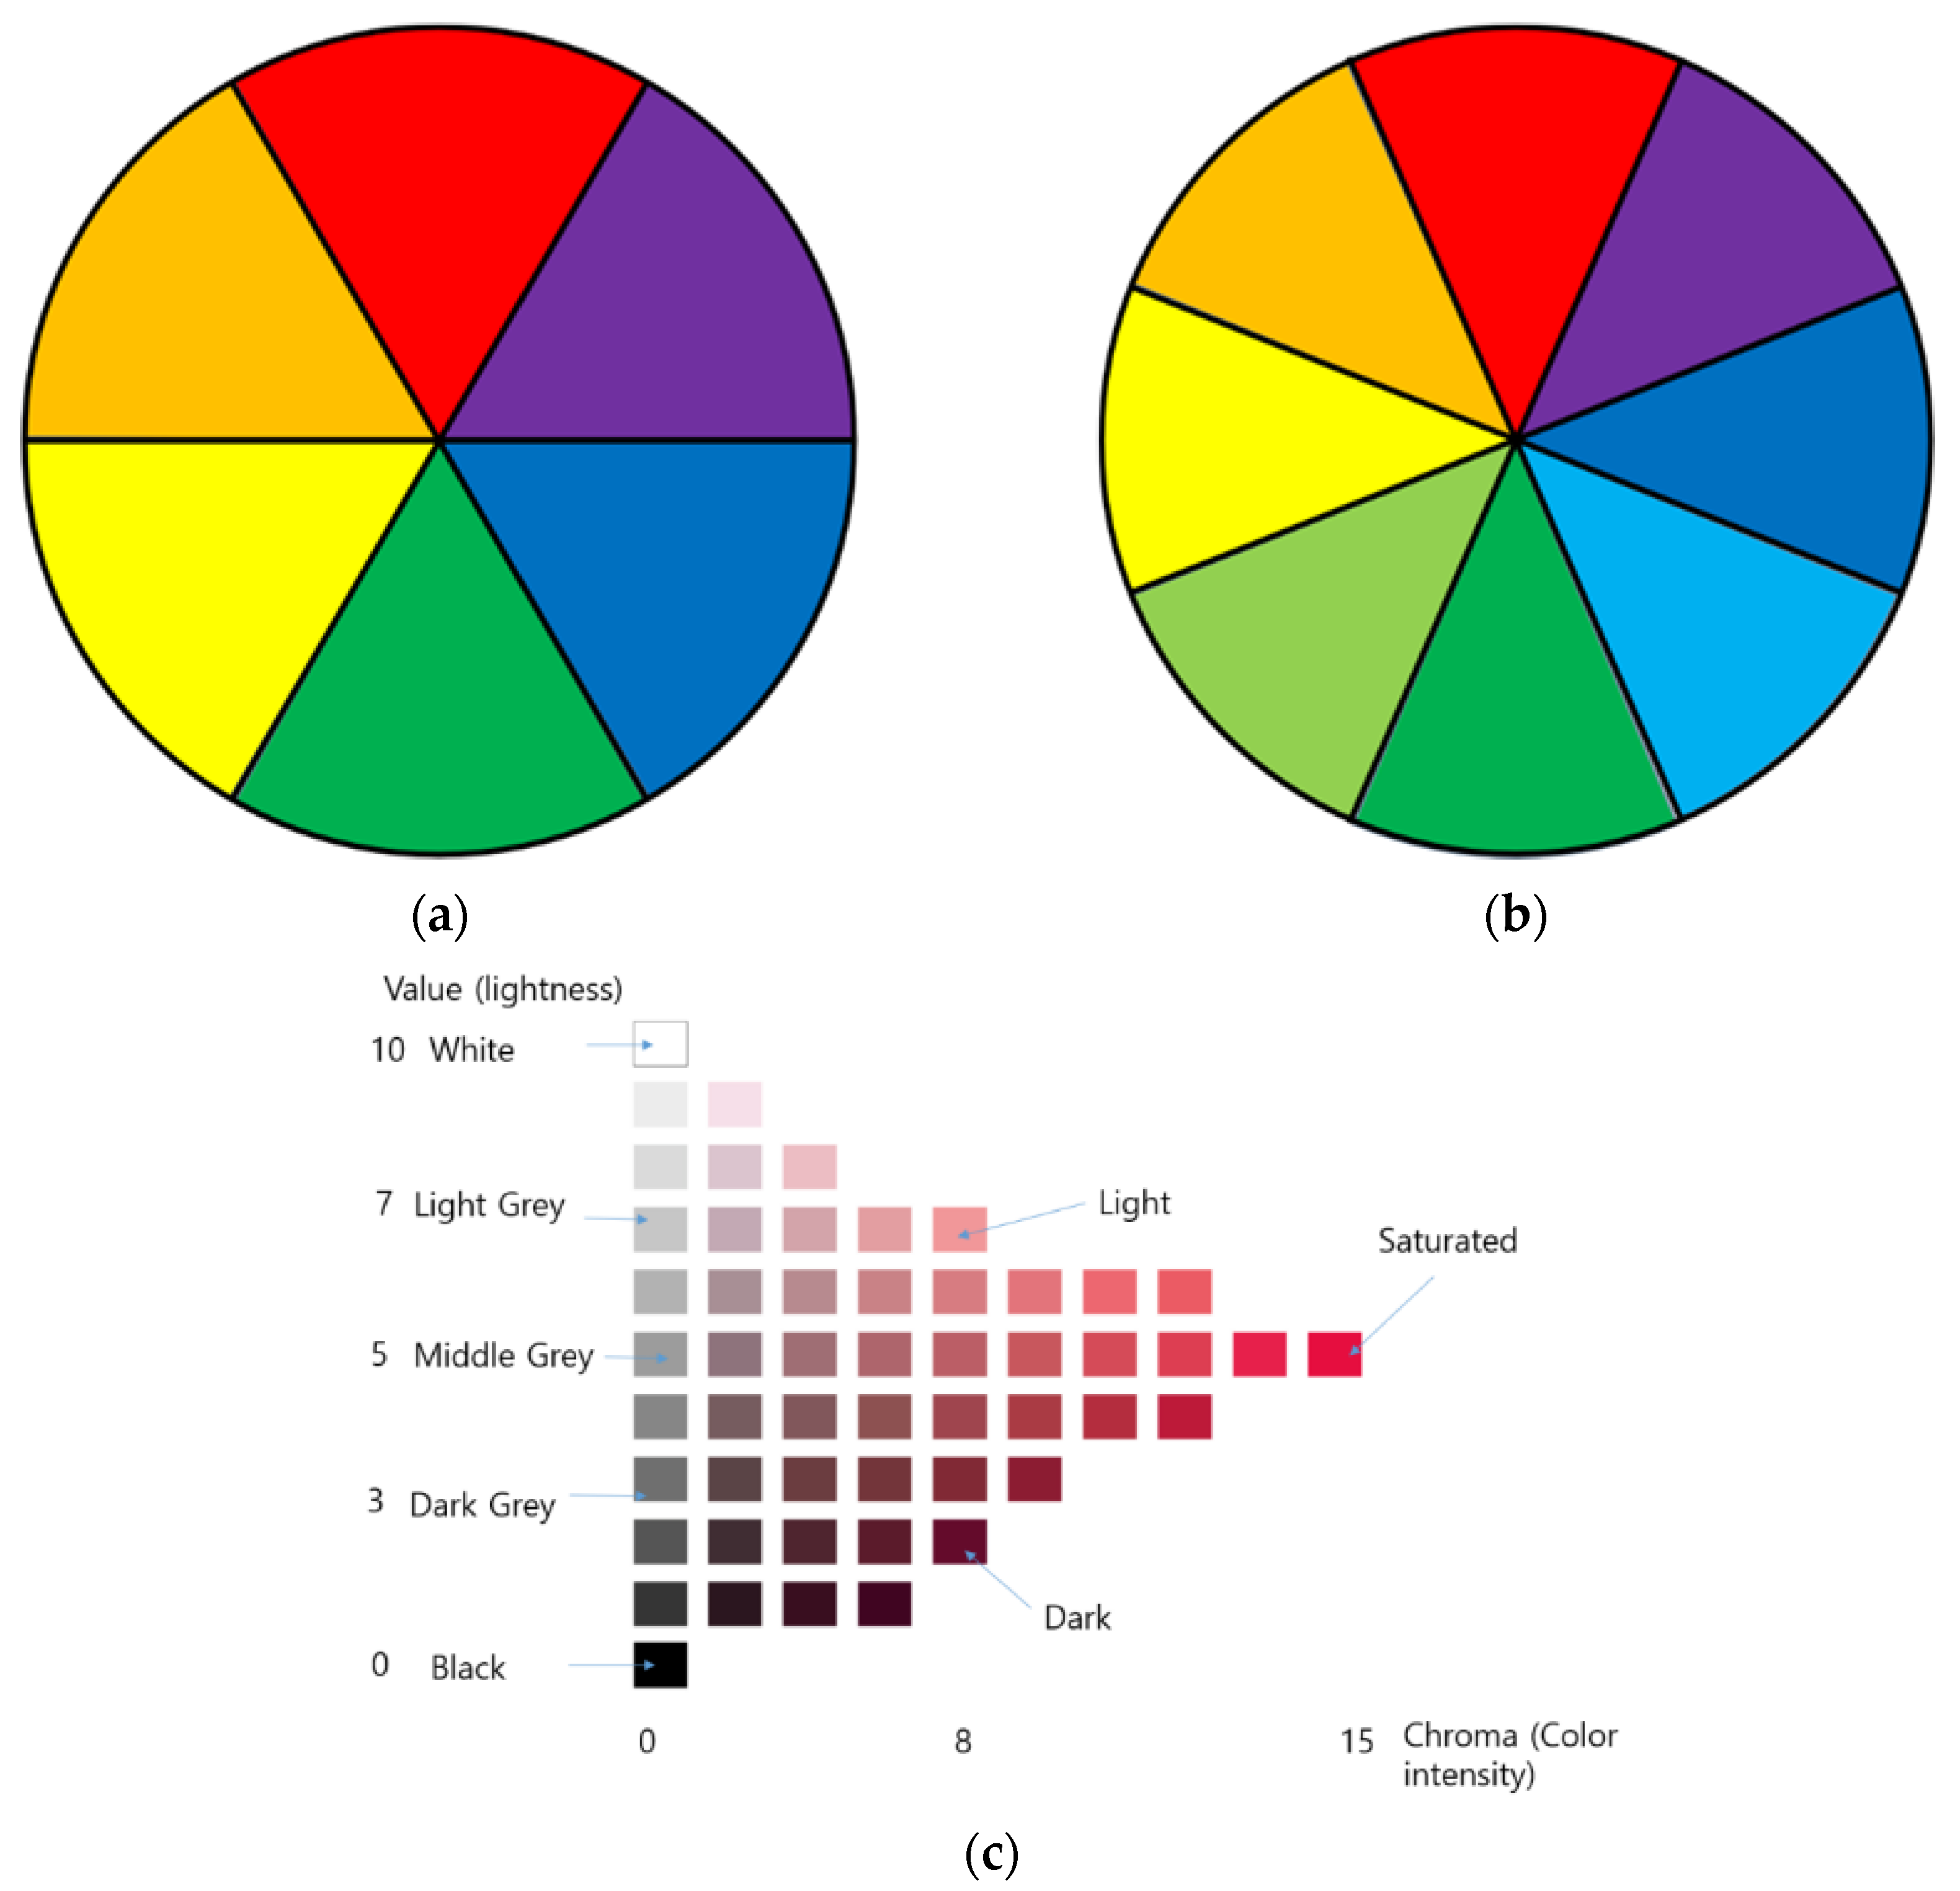
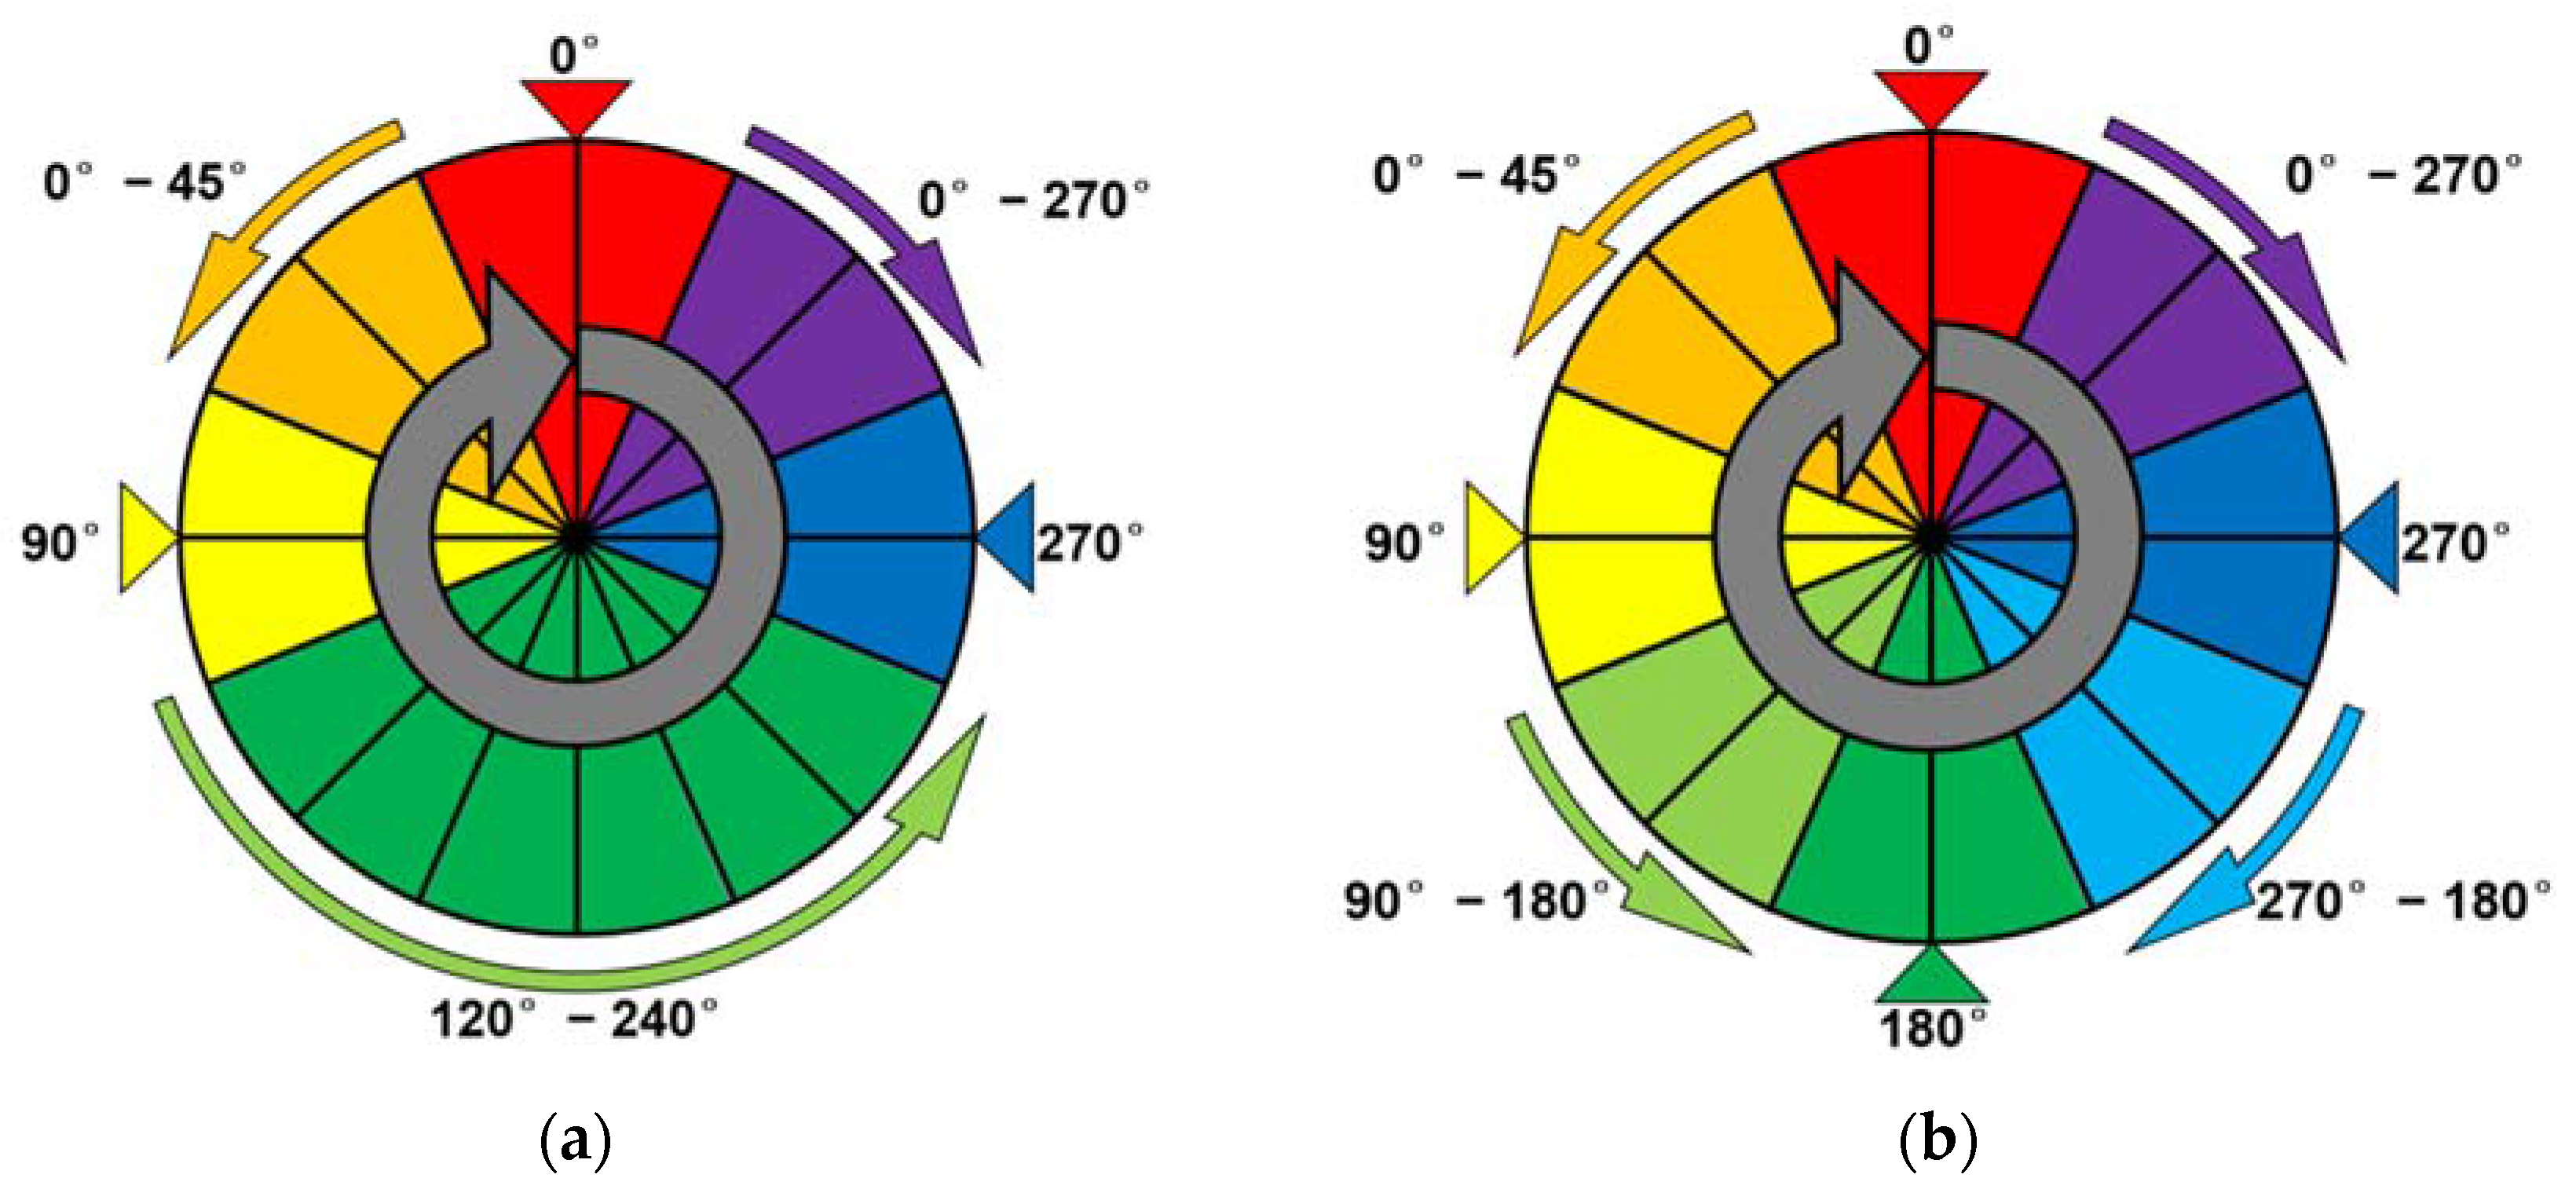
3.1. Spatial Sound Representations of Colors

The purpose of this study is to convey the concept of the spatial dimension of the color wheel. In other words, a timepiece watch makes it easy to familiarize oneself with the concept of relative time, and helps the reader understand the adjacency and complementarity of time. Similarly, this paper uses this concept for color presentation. In particular, for secondary colors such as orange, green, and purple, the basic concept of how the primary and secondary colors are created can be expressed simultaneously through the color wheel.
Figure 2 illustrates the RYB color wheel that was created by Johannes Itten [50]. There are two simplified color wheels that we want to express using 3D sound. One is a 6-color wheel composed of three primary colors (red, yellow, blue) and three secondary colors (orange, green, purple) as shown in Figure 2a, and the other as shown in Figure 2b is an 8-color wheel consisting of 8 colors (red, orange, yellow, yellow-green, green, blue-green, blue, purple). In addition, for each color (hue), three color tones (light, saturated, dark) as shown in Figure 2c are expressed in 3D sound. In addition, three achromatic colors of white, black and gray are expressed in 3D sound.
For easy identification of the color code, HRTF is used for the color representation with different fixed azimuth angles (0°, 45°, 90°, 135°, 180°, 225°, 270°, and 315°) to represent each color. However, the difference in the effect of the same HRTF for each person makes it possible to confuse 45°, 135°, 225°, and 315° with the adjacent angles. This effect is not ideal. Therefore, the primary colors are represented by a fixed 3D sound, and the secondary colors are represented by a moving 3D sound to make it easier to recognize how the two primary colors are mixed. The color representation of the six-color wheel codes is shown in Figure 3a and Table 2, and the eight-color wheel codes are shown in Figure 3b and Table 3. The six-color wheel codes are not represented like the six-color wheel in Figure 2a, because the fixed azimuth angles of 120° and 240° are relatively vague and not as accurate as 90° and 270°. Thus, yellow and blue are represented by 90° and 270°, and the range of green is relatively expanded.
Eight colors have three levels of brightness, expressed by changing the pitch of the sound. A normal audio sound represents saturated colors, an audio sound that raises three semitones represents a lighter color, and an audio sound that decreases three semitones represents a darker color. In this way, this paper proposes a color-coding system that can represent 24 chromatic colors and three achromatic colors. The strategy complies with the definition of light and dark colors in the Munsell color system, as shown in Figure 2c. The reason for raising or lowering the three semitones is that the three semitones have little effect on the pitch characteristics of the original sound. For achromatic colors, gray is represented by 3D sound from 360° to 0°. The black is the gray sound decreasing three chromatic scales, and white is the gray sound raising three chromatic scales.
There are many types of HRTF databases, such as the CIPIC HRTF-database [51], Listen HRTF-database [52], MIT HRTF-database [53], etc. This paper used the ITA HRTF-database [54,55] to change the audio direction by MATLAB. Additionally, Adobe Audition was used to change the sound of the pitch.

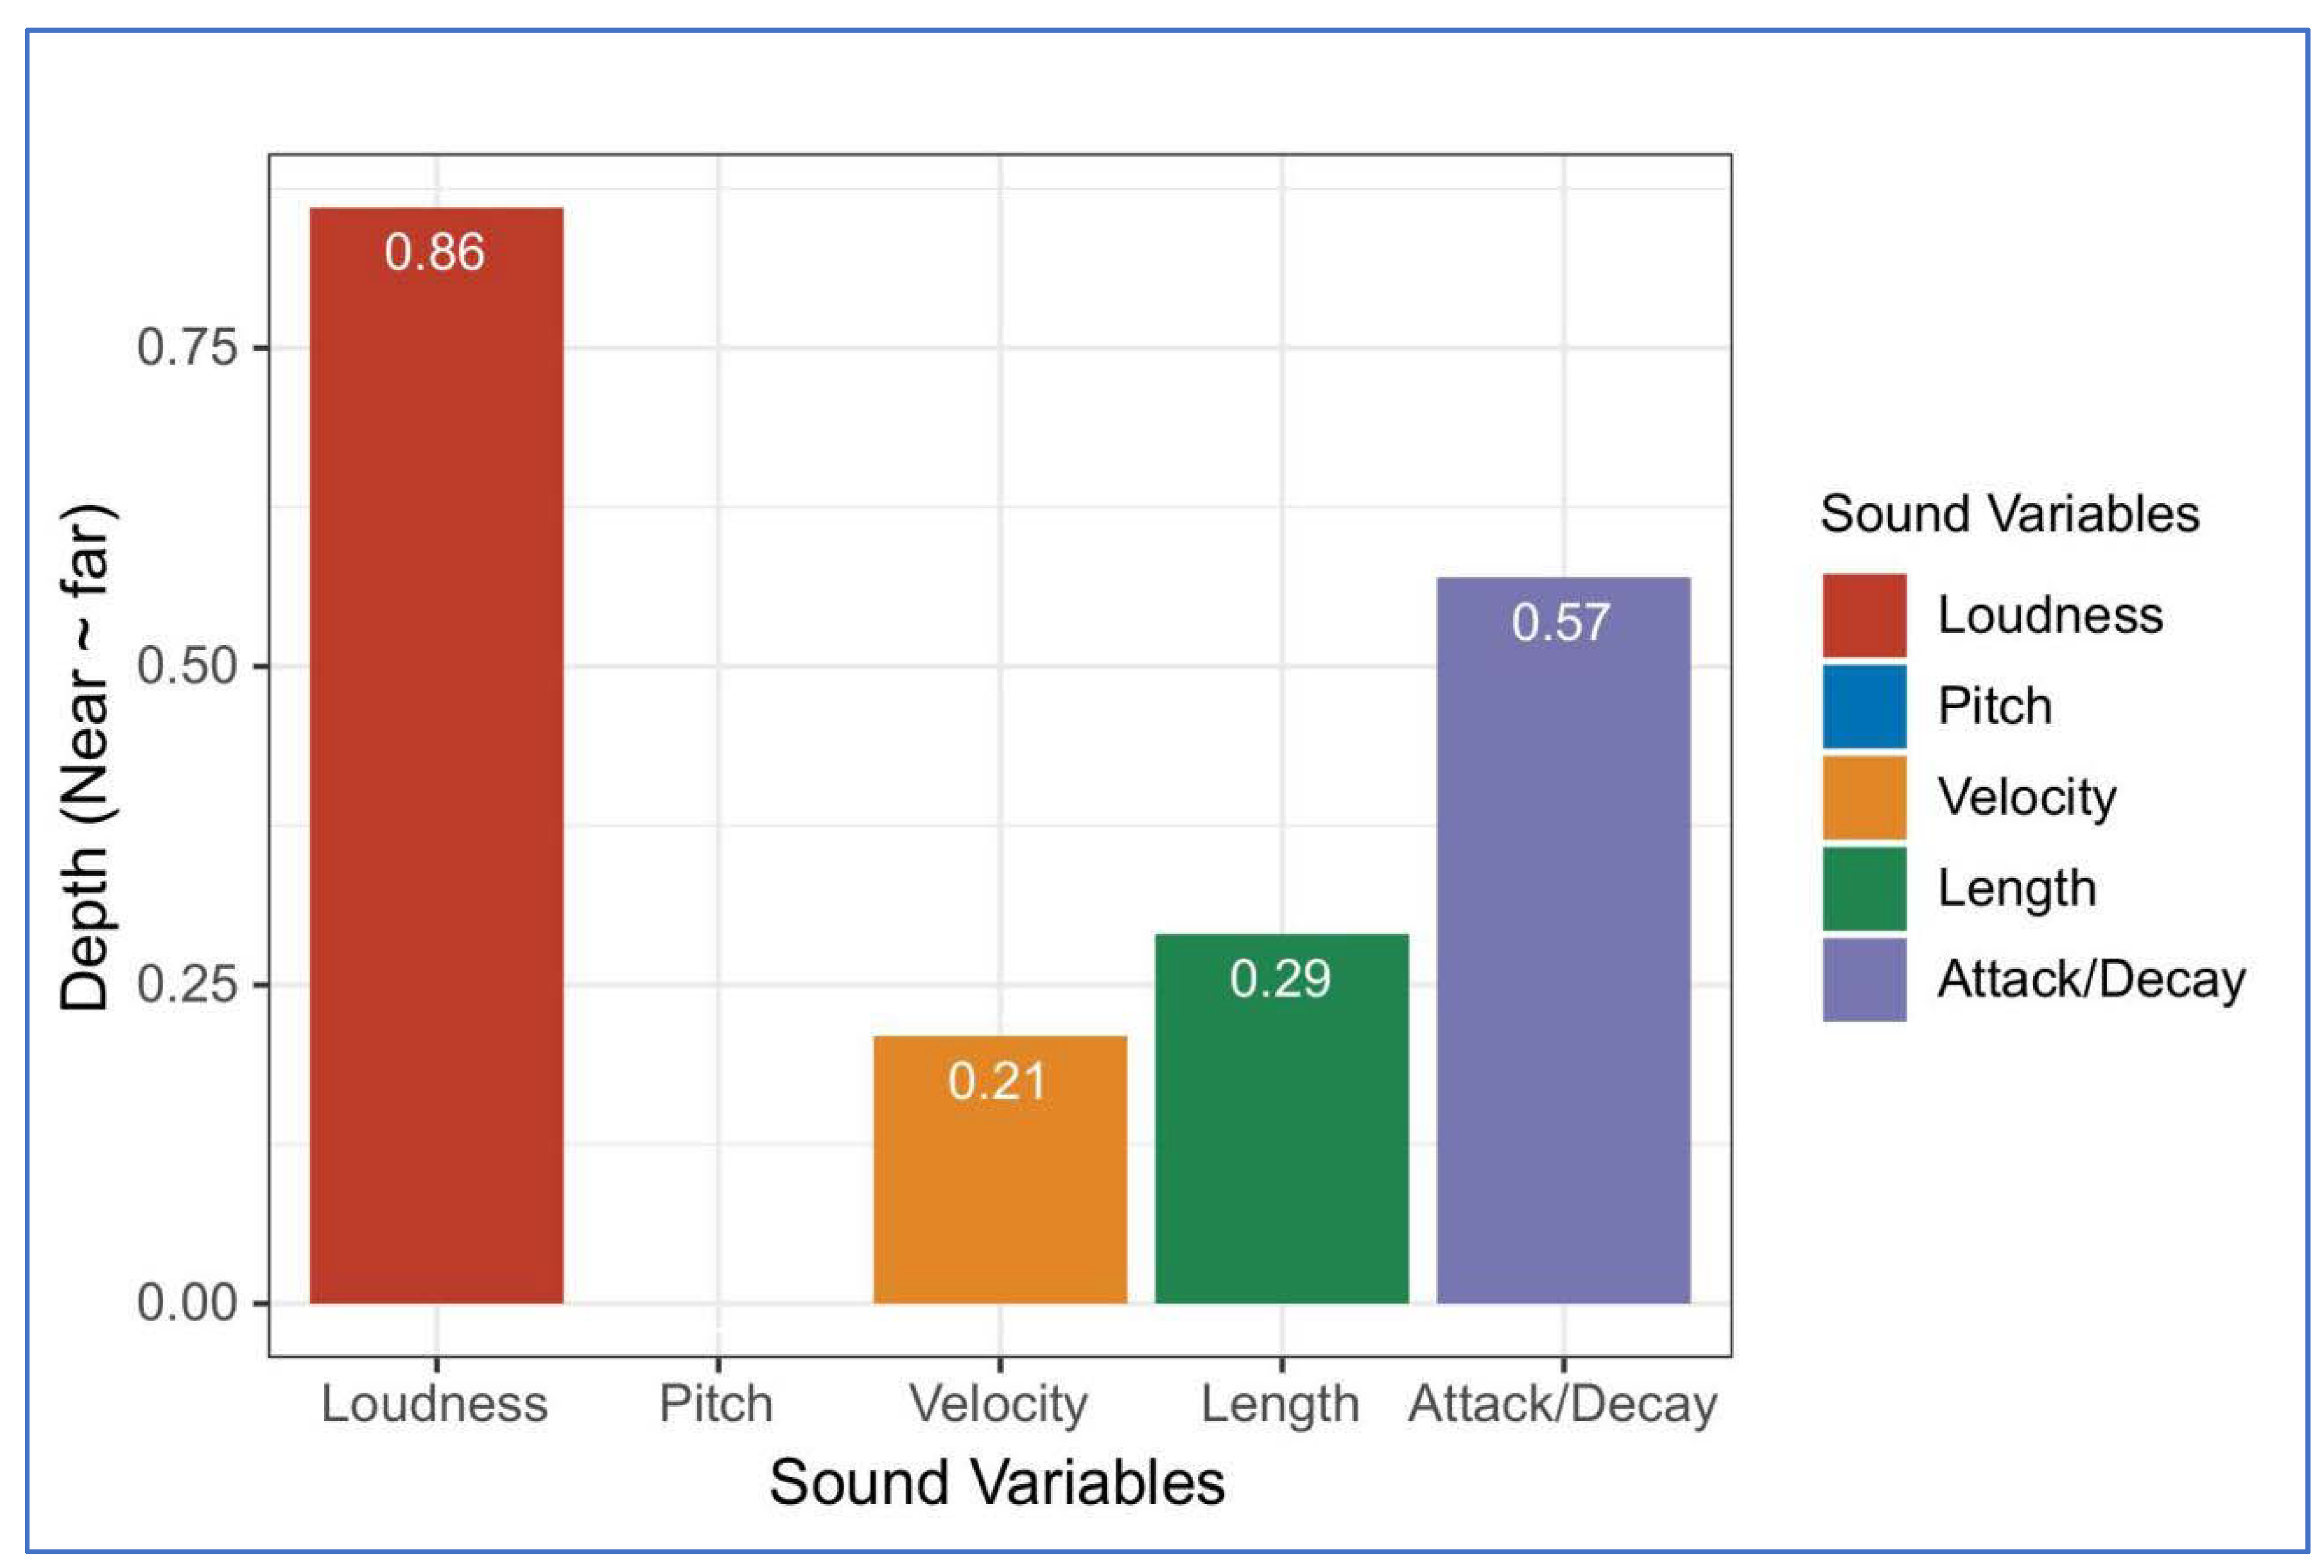
3.2. Sound Representations of Depth

In order to find the most suitable sound variables to express depth, the paper tested them experimentally and applied them to the sound code.

3.2.1. Matching Test

Sound Stimuli

According to the abstract sound variables [56], Table 4 indicates the changes in various related information such as language, direction, music, pitch, speed, size, depth, and special effects. This study used sound variables such as loudness, pitch, velocity, length, attack/decay for the matching with depth.

Semantic Stimuli

The purpose of this experiment is to find the most suitable sound variables to express depth. To obtain the association of sound variables and depth, this paper used the explicit association + implicit association test. That is, the explicit association is used first for match detection, and if no match can be made, the implicit association test is performed to match implicitly with other adjective pairs. Osgood [57] simplified the semantic space of the relative adjectives into three aspects, which are (1) evaluation (like–dislike), (2) potency (strong–weak), and (3) activity (fast–slow). The adjectives adopted in this research are pairs of adjectives with which people are familiar, such as emotion, shape, location, activity, texture, contrast, temperature, sound characteristics, etc. Thus, the simplified concept pairs of adjectives are chosen per aspect, shown in Table 5. Note that 11 pairs among them are related to sound attributes, as shown in Table 6.
This paper used sound variables such as loudness (Small~Loud), pitch (Low~High), velocity (Fast~Slow), length (Short~Long), and attack/decay (Decay~Attack) for this test. For each sound variable, participants received several audio segments with different levels of variability. Participants in the experiment used this audio file to recognize sound variables and evaluate how well those sound variables matched adjectives. In each of these 11 pairs of concepts, the score for the feeling conveyed by the sound attribute stimulus is 2 points when chosen as most positively consistent with the feeling of depth, −2 points when chosen as most negatively consistent with the feeling of depth, and 0 when chosen as least consistent with the feeling of depth. These score points were computed for each subject for each of the 11 sound-attribute stimuli.

Experiment Participants and Results

Seven members of Sungkyunkwan University were recruited as experiment participants. The gender split of the participants was 4 men and 3 women, and the average age was 22.29 years old (minimum 21 years old, maximum 24 years old). When participating in the experiment, side effects such as headaches could occur due to repeated auditory stimulation, and if they felt physical or mental discomfort; the experiment was conducted only after notifying the participants in advance that they could request to stop the experiment at any time.
Test results are shown in Table 7 and Figure 4. For each of the 11 pairs of adjective concepts in Table 7, the scores for the sense of depth transmitted by the sound stimulus are between −1 and 1. In other words, the absolute value of 1 is given when the sound stimulus feels the most consistent with the sense of depth, and 0 points are given when the sound stimulus is the most inconsistent with the sense of depth. By matching the results of sound variables with adjective pairs and matching results of sound variables with depth, this paper can conclude that there is a strong correlation between sound intensity and depth. That is, when the sound is loud it is associated with proximity, while when the sound intensity is small it is associated with depth.

3.2.2. Sound Representations of Color and Depth

With the results of the previous experiments, this study used the sound size variation to represent the sense of depth. To deepen the sense of depth, the paper added a reverberation effect while changing the sound size to make the sound depth more obvious. To make it easier to recognize the depth information expressed in velocity, only 3 distance levels (far, mid, and near) were used. The near level was set to the normal sound speed. The mid-level was set to 80% dry, 50% reverberation, and 10% early. The far level was set to 30% dry, 15% reverberation, and 10% early. The reverb setting was 1415 ms decay time, 57 ms pre-decay time, 880 ms diffusion, 22 perception, 1375 m3 room size, 1.56 dimensions, 13.6% left/right location, and 80 Hz high pass cutoff.

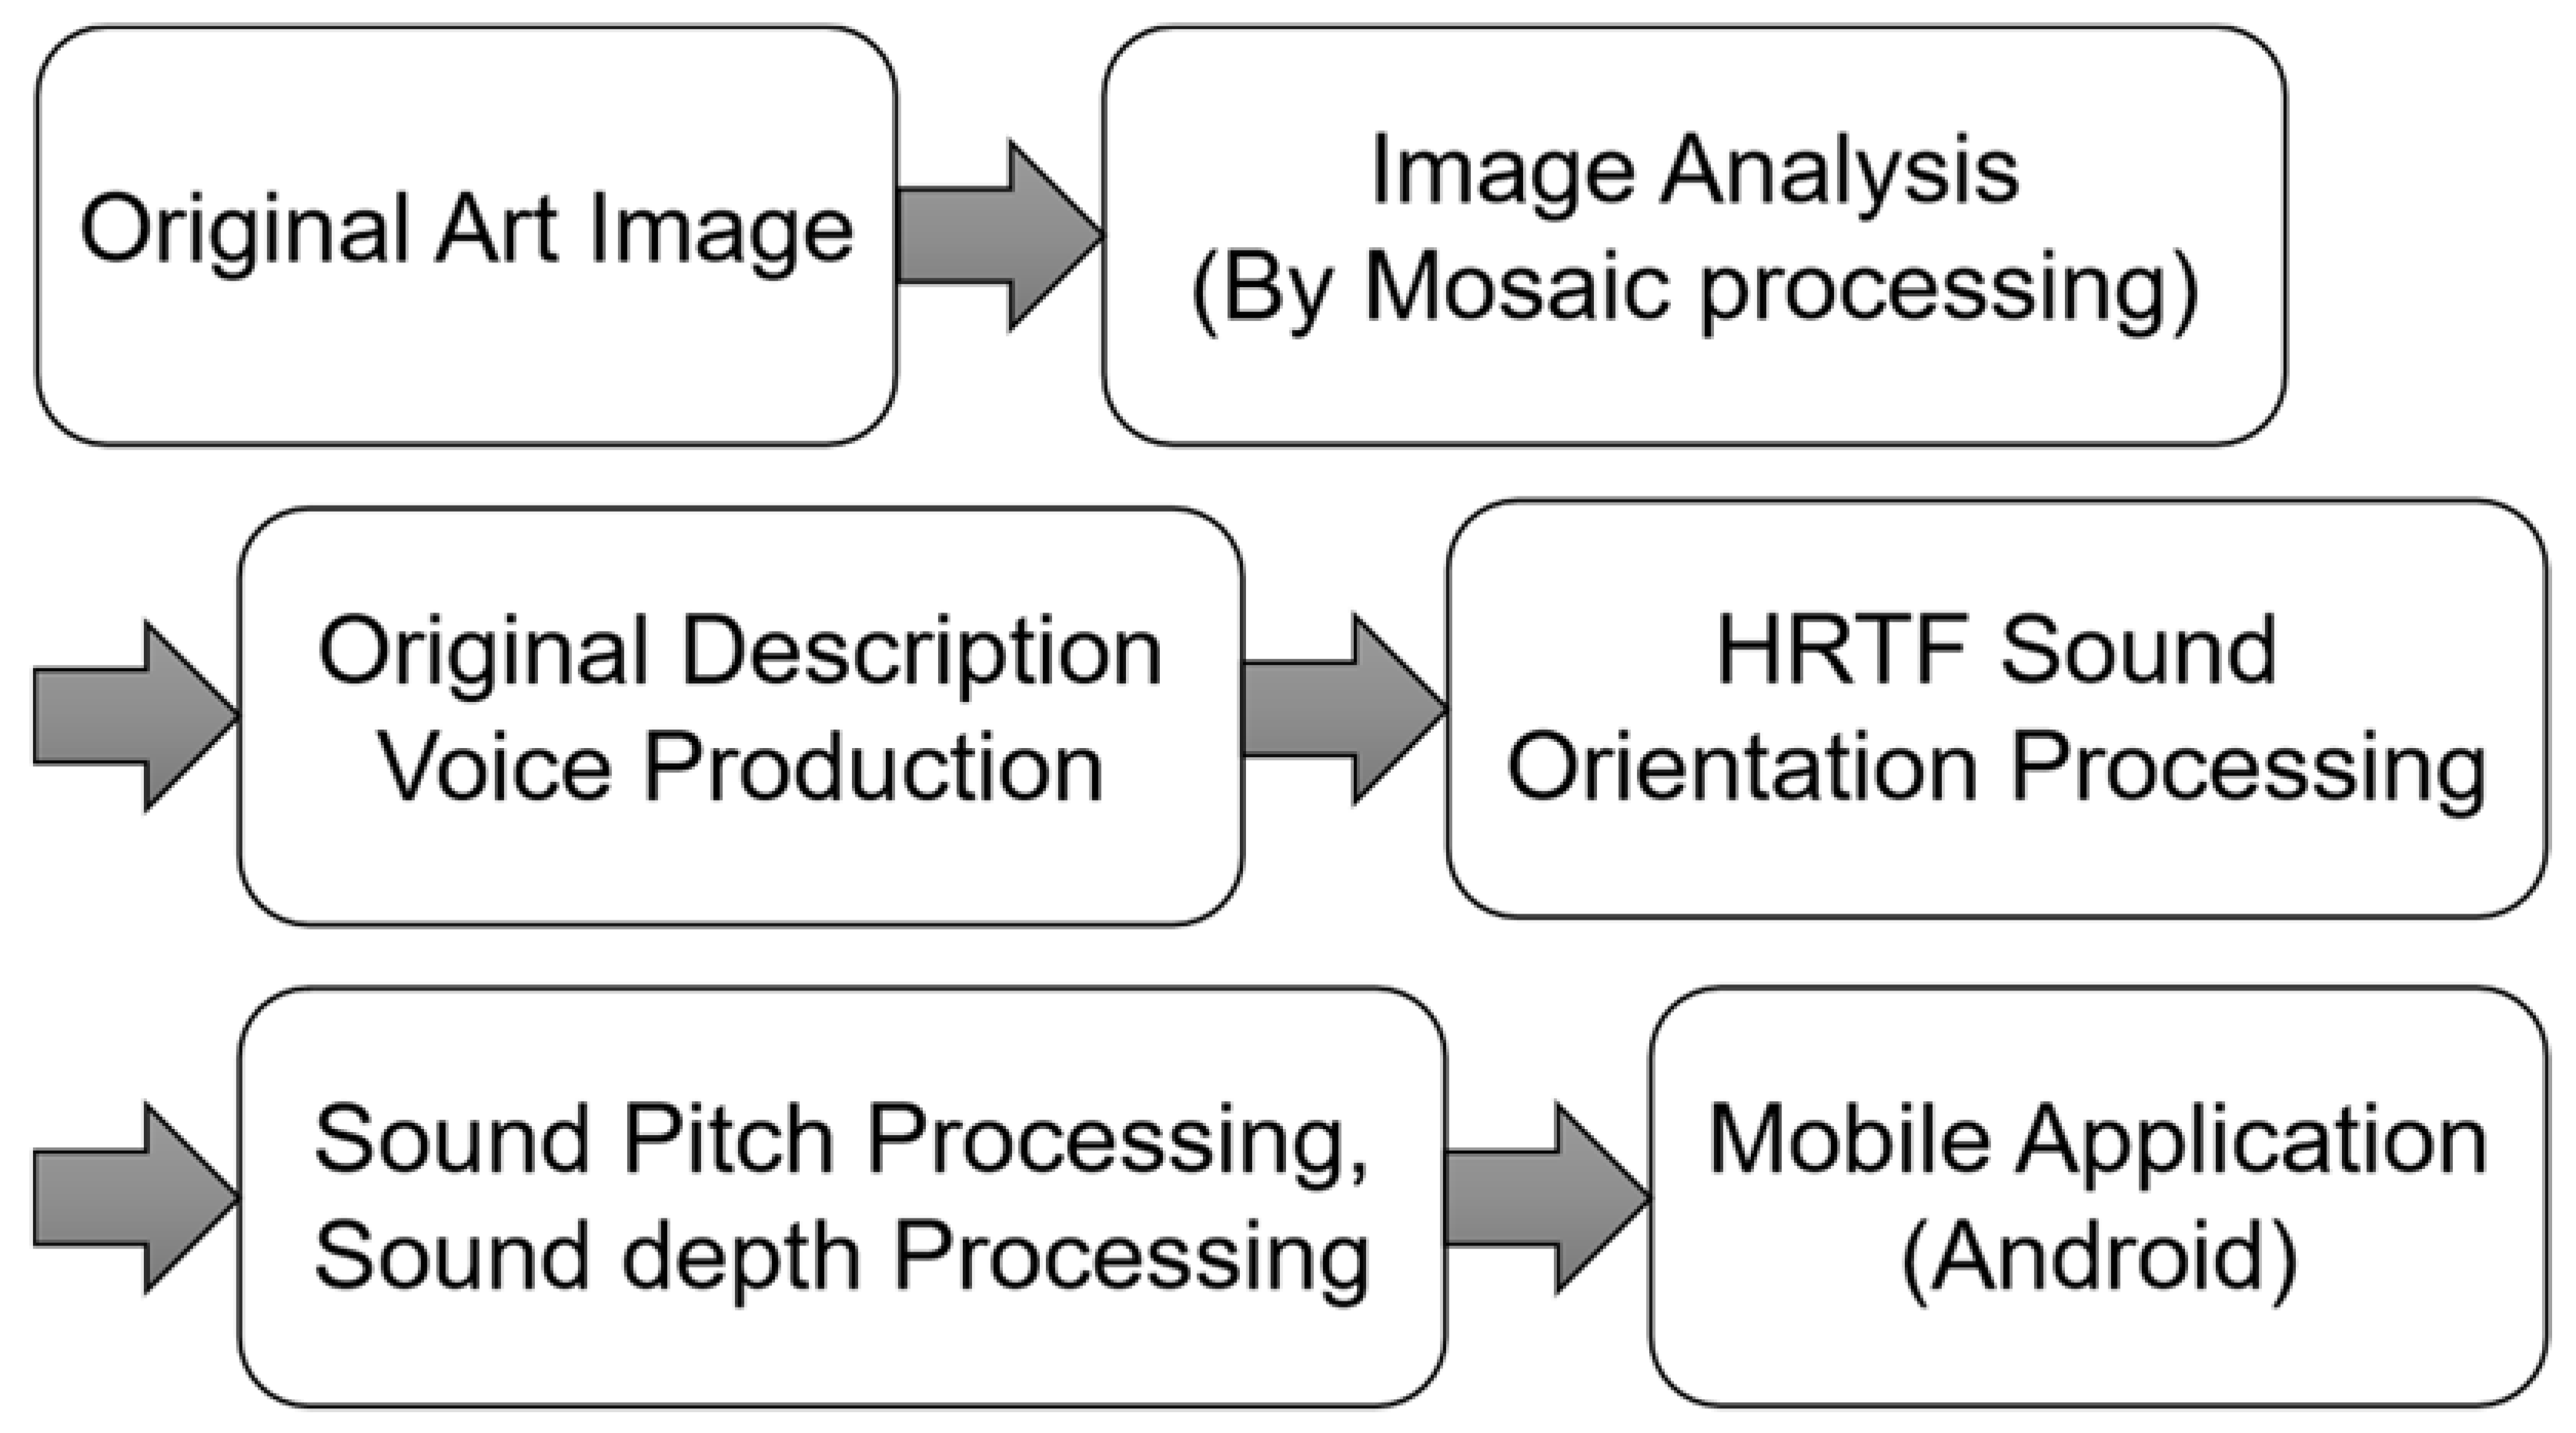
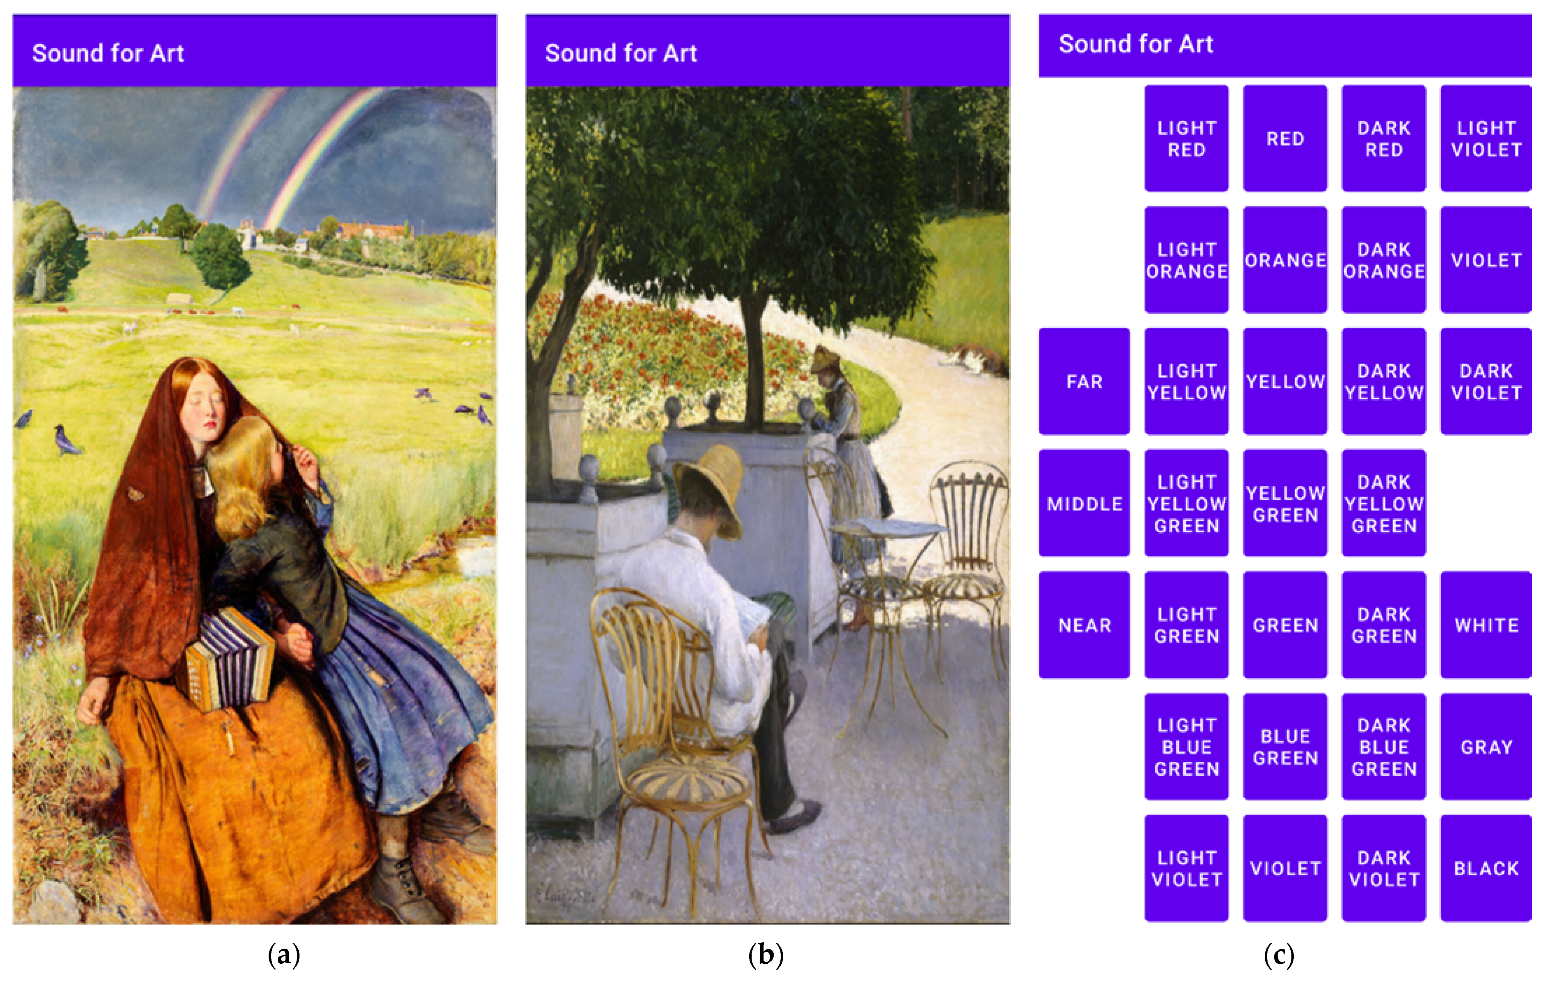
3.3. Prototyping Process

We have created an Android mobile application as a tool to deliver the proposed sound code to users. Figure 5 shows the prototyping process for creating a mobile application used as a tool for expressing color using the proposed sound code.
The first step was to analyze the images of the whole work. The specific method was to use software such as Photoshop to divide the artwork into specific grids (e.g., 15 × 19 or 12 × 15) and analyze the name, color, and depth of each object along with the artwork introduction. The analysis selected a specific name, color and brightness level, and depth level. The second step was to create an audio file corresponding to the spoken instructions with names for all analyzed objects. The third step was to apply HRTF to each part of the audio file corresponding to the object name to represent the object’s color in 3D sound. The fourth step was to use Adobe Audition audio processing software to perform pitch scaling without time scaling processing and reverberation processing on each part’s voice-described audio file through the lightness of the color and depth levels. The fifth step was to create a mobile application using Android Studio software. The basic making method was to split artworks as buttons in the way described above and add processed audio files to each part. The artworks used in this prototype as examples were John Everett Millais’ “The Blind Girl” and Gustave Caillebotte’s “The Orange Trees.” The prototype application interface is shown in Figure 6. Figure 6a,b shows where the user could apply the 3D sound coding to the artwork for viewing. By clicking on any part of the artwork, the user could access the audio description of the clicked area. Additionally, each voice description used sound coding in this paper. It was possible to obtain information about color, brightness, and depth while receiving the voice description. Figure 6c shows the listening test of the application. The user could perform headphone tests and sound learning in this interface.

4. User Test and Results

4.1. Participants

Ten students were recruited as participants of the experiment. The gender split of the participants was five males and five females, and the average age was 22.5 years (minimum 20 years old, maximum 25 years old). While participating in this experiment, repeated auditory stimulation may have caused side effects such as headaches, and if physical or mental discomfort was felt, participants were informed in advance that they could request to stop the experiment at any time. All participants used their own cell phones and earphones for the experiment. Five participants used the six-color wheel codes, and the other five participants used the eight-color wheel codes.
The experimental evaluation was performed in three stages: learning phase, tests, and feedback. During the learning phase, experiment participants learned and became familiarized with the sound codes through explanations, schematic, and sample audio. Test part divided into color, color + lightness, color + lightness + depth to be tested separately. In the test part, the participants were asked to perceive color, lightness, and depth through sound alone without looking at pictures such as the color wheel. After that, the participants evaluated the workload assessment and usability test.

4.2. Identification Tests

In experiment 1, experiment participants performed color identification on random sound samples that only transformed the color variable. As shown in Table 8, the color identification rate of Group A using six-color wheel codes was 100%. Additionally, for Group B with eight-color wheel codes used, the color identification rate was 86.67%.
In experiment 2, experiment participants performed color and lightness identification on random sound samples that transformed the color variable and the lightness variable. As shown in Table 9, the color discrimination rate and brightness discrimination rate of both groups A and B were 100%.
In experiment 3, participants performed color, brightness, and depth identification on random sound samples representing color, brightness, and depth variables. As shown in Table 10, there is confusion between red and blue in a multivariate situation. It is possible that the sound on the right side of the HRTF sample is a bit louder than the sound on the left side, which makes the right side similar to the front sound in the case of reverberation. Additionally, in the multivariate case, the depth variable may show a small recognition error.
When we analyzed the identification test results shown in Table 11, we found that the identification rate of S3 participants was significantly lower than that of other participants. This may be due to the headset brought by the individual participant. Excluding the S3 participants, the discrimination rate results were much better.

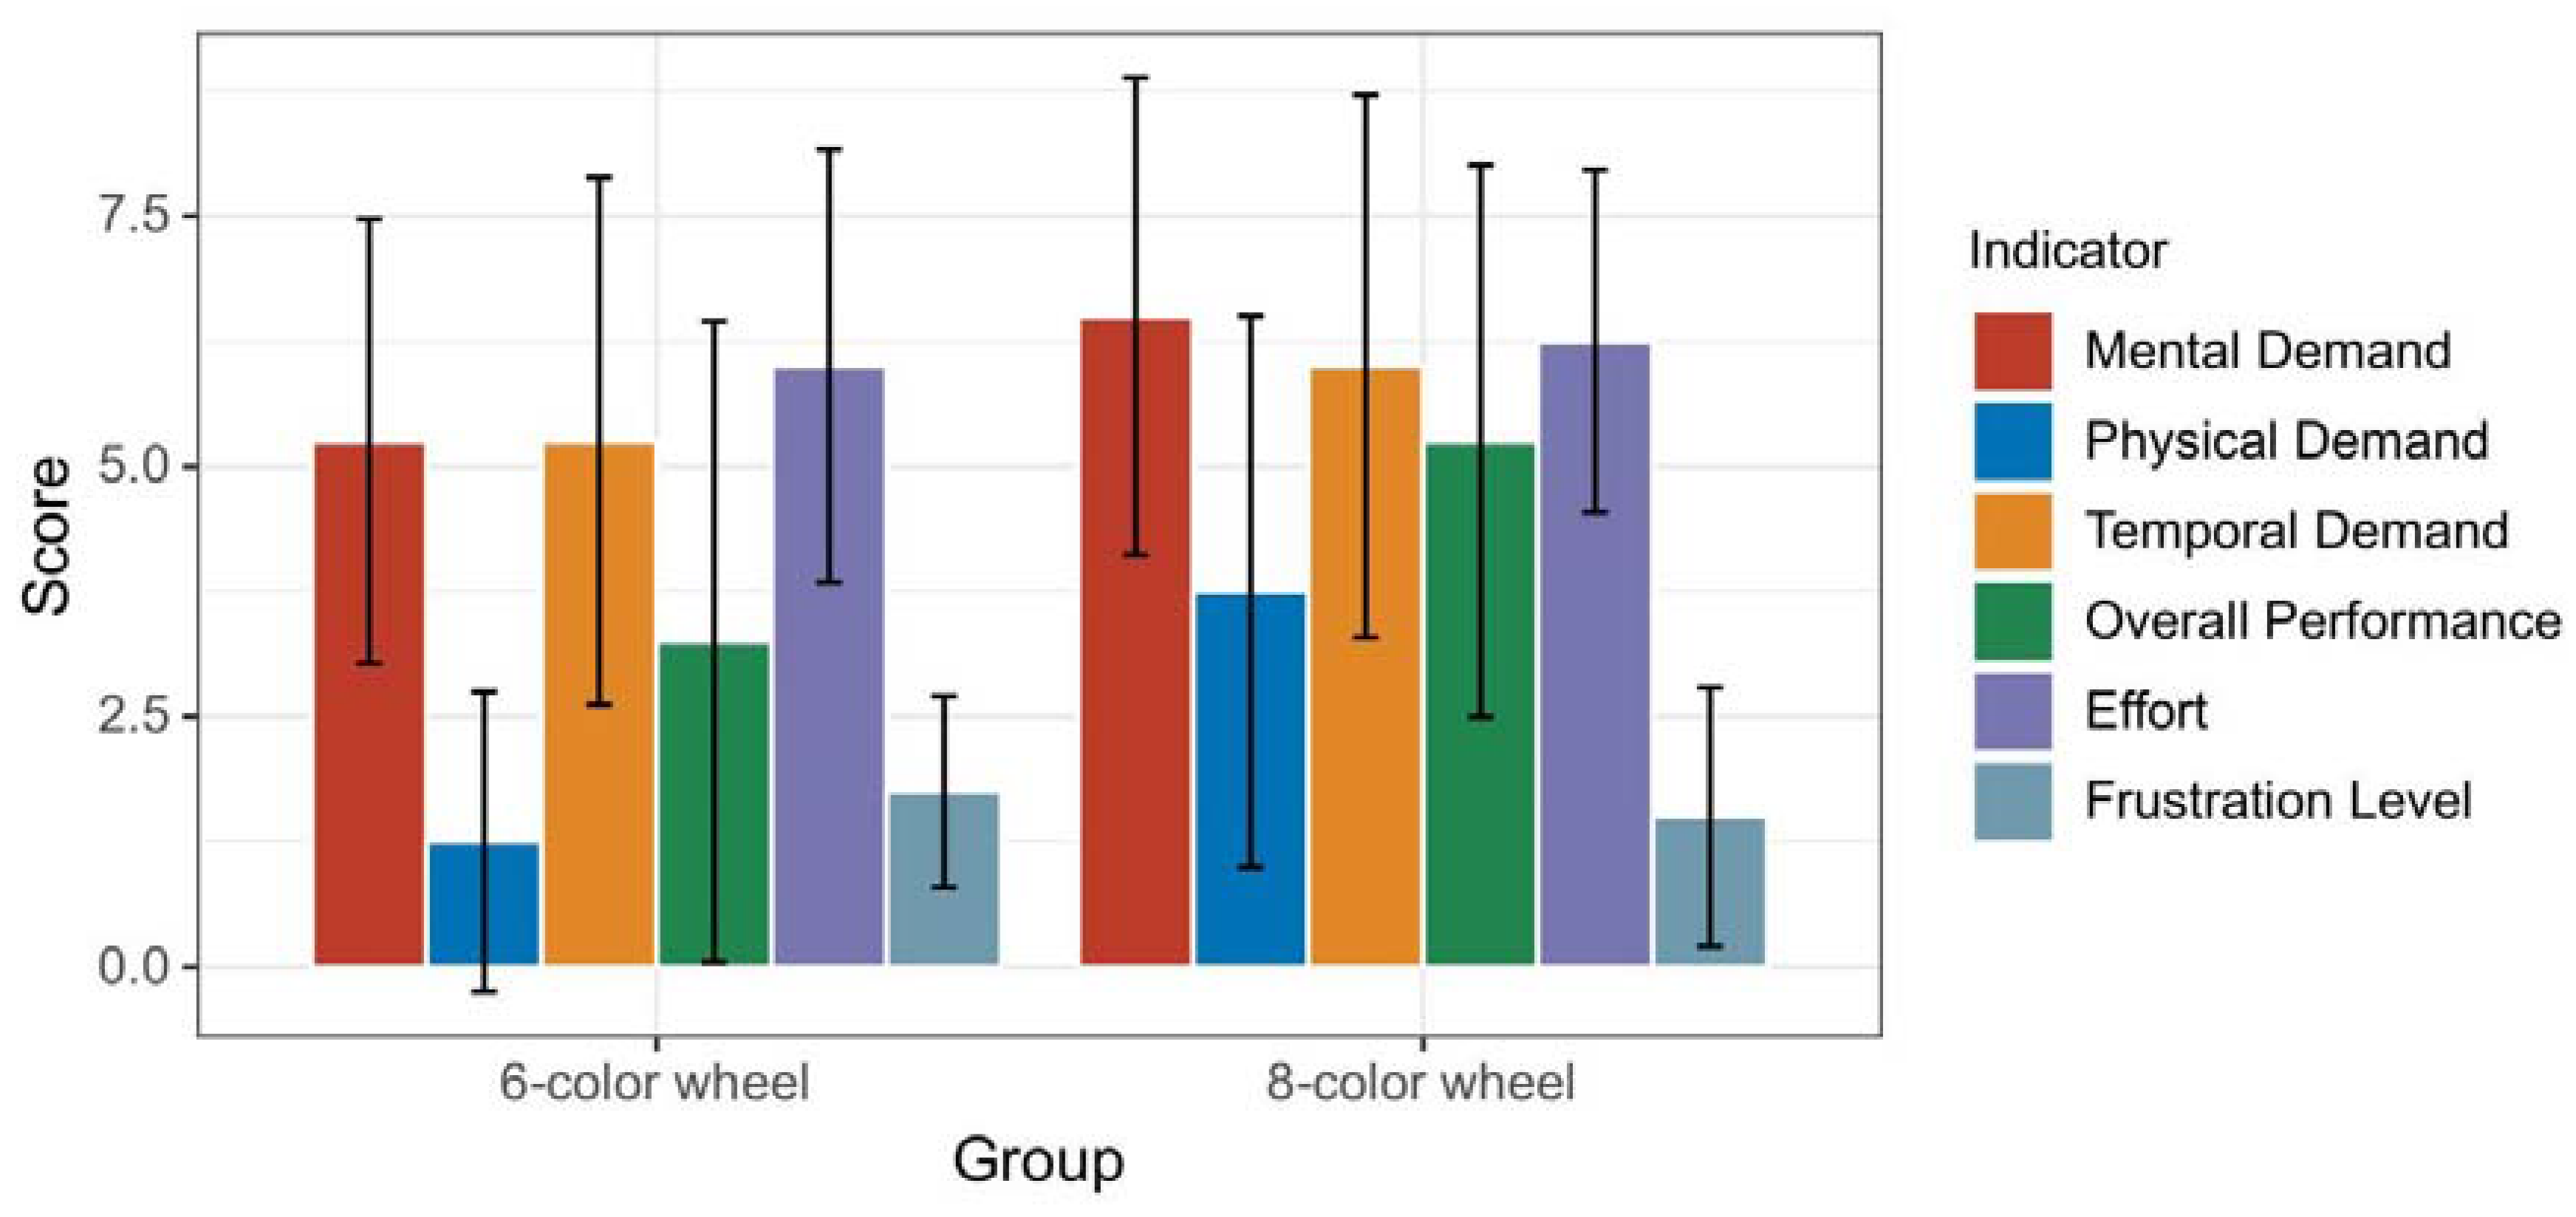
4.3. Workload Assessment

The Official NASA Task Load Index (TLX) is a subjective workload assessment tool that is used in various human–machine interface systems [58]. By incorporating a multi-dimensional rating procedure, NASA TLX derives an overall workload score based on a weighted average of ratings on six subscales: Mental Demand, Physical Demand, Temporal Demand, Performance, Effort, and Frustration. The scale from 0 to 10 points is chosen for the ease and familiarity of participants, with 0 ranging from very low to 10 being very high. TheTLX test was performed using uniform weights for all metrics. The six-color wheel codes achieved 43.75 points, and the eight-color wheel codes achieved 48.75 points.
Figure 7 summarizes workload assessment scores for subjects under the NASA-TLX test. The scores for Mental Demand, Temporal Demand, Overall Performance, and Effort were in the middle or upper-middle. This was because adding three variables to speech sound made it relatively more difficult to use while increasing efficiency. More time needs to be invested in practice and training based on understanding the principles. This also makes the task more demanding for first-time participants and can feel relatively difficult with insufficient learning, which can increase frustration in use. Gradual learning over time makes it less difficult. The reduction in variables and improvements in sound production methods will further reduce the difficulty of use.

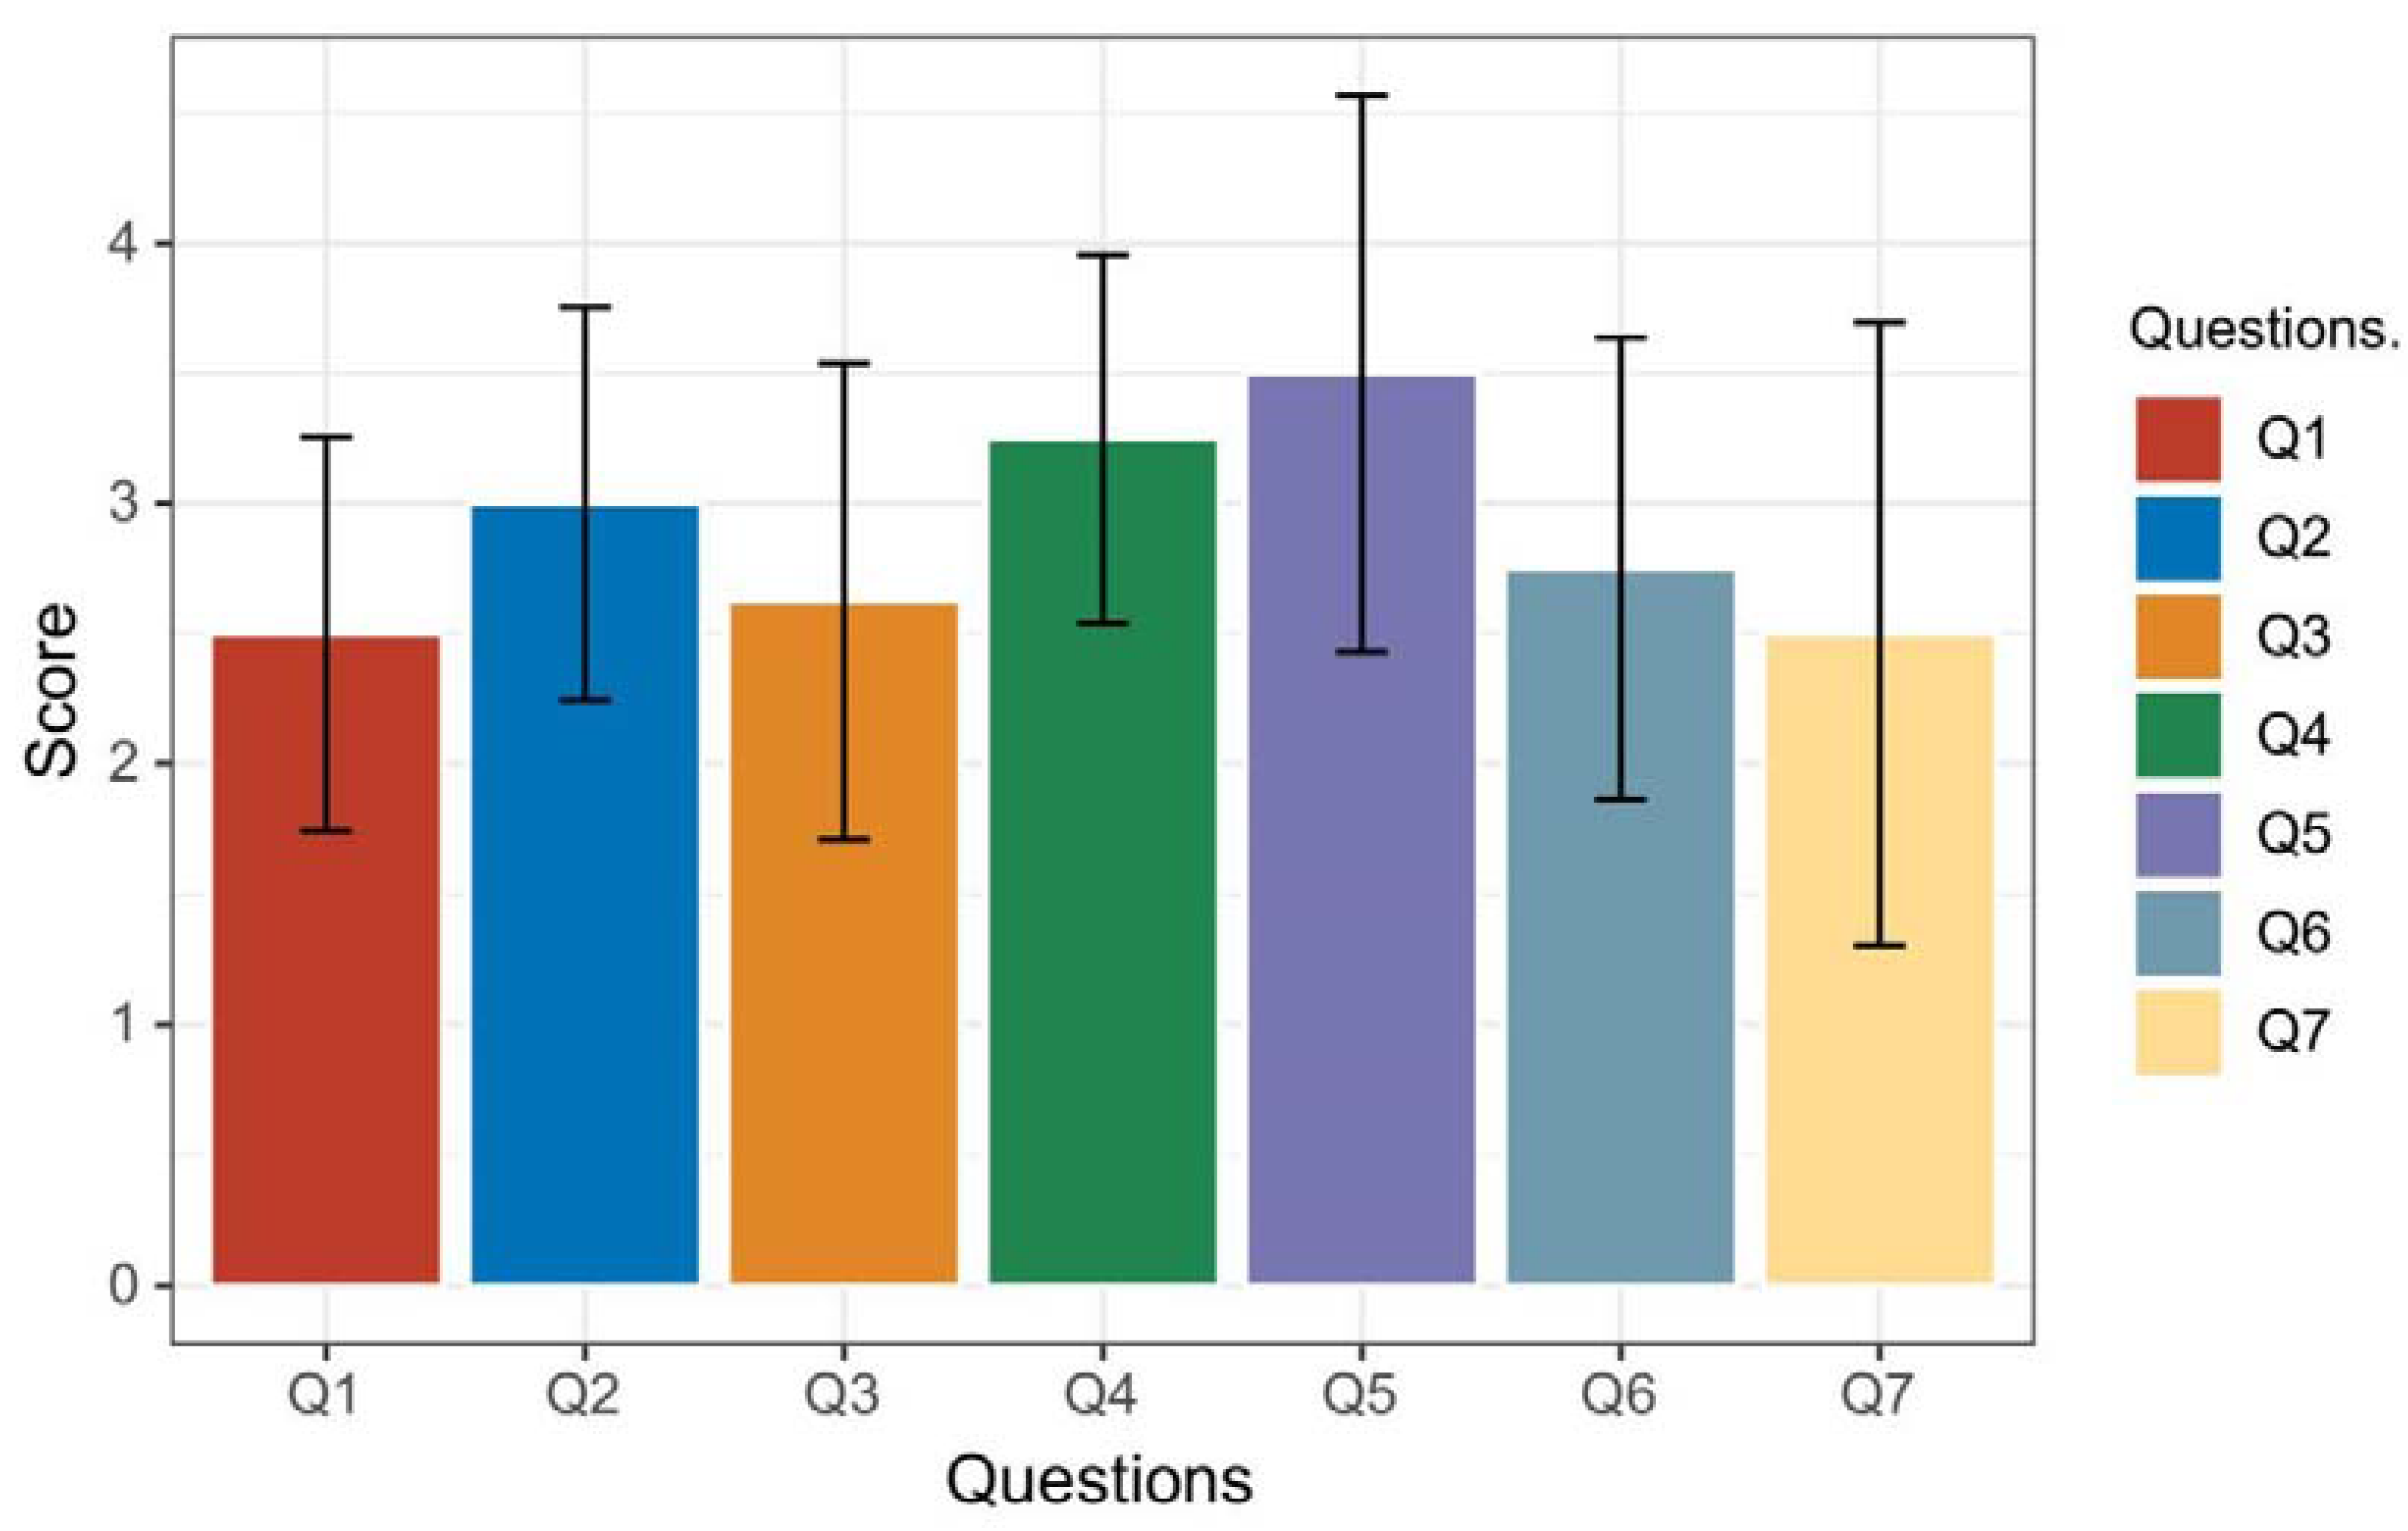
4.4. User Experience Test

User experience (UX) testing of participants in the experiment was performed by modifying the System Usability Scale approach to match the purpose of the experiment. The System Usability Scale (SUS) is a questionnaire that is used to evaluate the usability of products and services. These survey questions are used as a quantitative method to evaluate and gain actionable insights on the usability of a wide variety of new systems which may be either software or hardware [59].
Participants were asked to rate the following seven items:
(1)
I think that I would like to use this system frequently;
(2)
I found the complexity in this system appropriate;
(3)
I thought the system was easy to use;
(4)
I found that the various functions in this system were well integrated;
(5)
I thought that there was consistency in this system;
(6)
I would imagine that most people would learn to use this system very quickly;
(7)
I think this system was light to use.
The UX test scores were broken down for all participants out of 1–5 (strongly disagree through strongly agree). By converting on a hundred-point scale, the six-color wheel code score was 72.32 points, and the eight-color wheel code score was 71.43 points. The scored user experience results are provided in Figure 8. The average Q1 score was 2.5, Q2 was 3, Q3 was 2.63, Q4 was 3.25, Q5 was 3.5, Q6 was 2.75, and Q7 was 2.5. As with the questions discussed in the previous NASA-TLX section, the lack of time and unfamiliarity with the use of the program resulted in relatively low ratings for individual questions.
Table 12 lists the participants’ positive and negative feedback.

5. Discussion

In experiment 1, the color identification rate of Group A with six-color wheel codes used was 100%. Additionally, for Group B with eight-color wheel codes used, the color identification rate was 86.67%. In experiment 2, the color identification and the lightness rate of Group A and Group B was 100%. Additionally, in experiment 3, the color, lightness, and depth identification of participants were 95.56%, 99.26%, 95.93%. The overall recognition rate was very high and still performed well with multiple sound variables. However, because the number of colors in the eight-color wheel was more than that of the six-color wheel, the recognition rate was 13.33% lower than that of the six-color wheel. If the distinction between confused colors is strengthened, the recognition rate will be better.
In the workload assessment test, the six-color wheel codes scored 43.75 points, and the eight-color wheel codes scored 48.75 points; the total score was 46.25 points. The lower the rating, the less the load on the user. With a full score of 100, the overall score tended to be in the middle, i.e., the user load was medium. In the user experience test, the six-color wheel codes scored 72.32 points and the eight-color wheel codes scored 71.43 points. The higher the score, the better the user’s sense of use. With a score of 100 out of 100, the overall score was good. As described in the Results section, the experiment may feel relatively loaded and difficult to use due to insufficient learning and familiarity with the design. Additionally, due to the excessive number of variables used in the experiment, there may be a degree of fatigue for the participants. Therefore, a better HRTF matching seems necessary, which will make the effect more visible, and the participants could more clearly distinguish the colors. Additionally, audio optimization to make the audio more accurate and friendly is also a method, while simplifying the design will also optimize the user’s perception. Table 13 shows conflicting user feedback and future work to resolve the conflict.
This study has several advantages over other ones:
(1)
This study presented color, lightness, and depth information at the same time with 3D sound and voice modulation;
(2)
The virtual color wheel with 3D sound will help the user to understand the color composition;
(3)
Our method can be combined with tactile tools for multiple art enjoyment facets.
However, this study has some limitations:
(1)
The relative use of many variations of sound, which also makes it relatively more complex than other single variable methods, and also has basic requirements for the level of hearing. Additionally, the quality of the headphones will also directly affect the use of the effect;
(2)
The existing and publicly available HRTF methods still have some drawbacks, i.e., they may have some effects when the gap with the selected HRTF specimen is too large. This study simplified the design of this, but there are still some limitations;
(3)
The focus on function and lack of emotion may be useful for people with acquired visual impairment, while people with congenital visual impairment may lack empathy for color perception.
Through quiz tests and user evaluations, the sound code in future work could be improved in the following ways:
(1)
The audibility and accuracy of the sound can be improved. Finding a more popular HRTF conversion method, or exploring the private custom HRTF, will lead to improvements in sound accuracy. Additionally, a better way to create sound accurately will greatly improve the user experience;
(2)
While implementing complex functions, a simplified solution is needed to alleviate the user’s difficulty in using them. The solution is to reduce the content of the expression to reduce the sound variables. Another is to use single-variable audio in the form of different forms of touch by the mobile app to play the corresponding variable audio;
(3)
In this work, there were no large-scale tests using mobile applications. However, from the feedback of previous mobile applications, it is clear that the mobile application format will greatly increase the usability of the sound code we developed in this paper.

6. Conclusions

In this paper, we presented a methodology of 3D sound color coding using HRTF. The color hue is represented by the sound simulation of the position of the color wheel, and the lightness of color is reflected by the use of the sound pitch. The correlation between sound loudness and depth was found through experiments on the correlation between sound variables and depth, and the correlation was used to represent depth by changing the sound loudness and increasing the reverberation in addition to the original sound codes. Additionally, an identification test and system usability test were conducted in this study. A total of 97.88% of the identification test results showed that the system has excellent recognition. The results of the NASA TLX test and user experience test also showed the good usability of the system. Experiments with visually impaired subjects will be implemented in future studies.
This is a new attempt to express color. Although there are many ways to use sound to express color, there are few ways to use changes in a sound position to express color accurately. The variable of sound position is very common and familiar to the visually impaired. The use of this method also opens up a new direction in the way that art can be experienced by the visually impaired. However, there is still room for improvement in this method. Further refinements will increase the accuracy and usability. Future improvements in sound processing will also make recognition easier.
Neither sighted people nor people with visual impairment had experienced the proposed 3D sound coding colors before; therefore, it was judged that there were no significant differences in the perception ratings between sighted and visually impaired test people. However, future extended testing will be necessary to analyze the differences in the speed of perception between those two groups. Regarding the size of test participants, ten users who participated in this study’s experiments may not be enough even though the magic number 5 rule (Nielsen & Landauer [60]) is vastly known and used for usability testing. The sample size is a long-running debate. Lamontagne et al. [61] investigated how many users are needed in usability testing to identify negative phenomena caused by a combination of the user interface and the usage context. They focused on identifying psychophysiological pain points (i.e., emotionally irritant experienced by the users) during human–computer interaction. Fifteen subjects were tested in a new user training context and results show that out of the total psychophysiological pain points experienced by 15 participants, 82% of them were experienced with nine participants. In the implicit association test done by Greenwald et al. [62], thirty-two (13 male and 19 female) students from introductory psychology courses. Therefore, as future work, we will also further perform scaled experiments on sighted participants and people with visual impairment.
The visual perception of artwork is not just bound to distance and color, but to a collection of different tools that artists use to generate visual stimuli. These, for example, are color hue, color value, texture, placement, size, contrast changes, cool vs. warm colors, etc. A better understanding of how these tools affect the visual perception of artwork may in the future enable the implementation of experiments that employ new visual features which may help to achieve enhanced “visual understanding” through sound. Schifferstein [63] observed that vivid images occur in all sensory modalities. The quality of some types of sensory images tends to be better (e.g., vision, auditory) than of others (e.g., smell and taste) for sighted people. The quality of visual and auditory images did not differ significantly. Therefore, training these multi-dimensional auditory experiences and incorporating color hue, near/far (associated with warm/cool), and light/dark introduced in this paper may lead to more vivid visual imageries, incorporating color or seeing them with the mind’s eye. This study leaves other visual stimuli such as texture, placement, size, and contrast changes for the future work.
Synesthesia is a transition between senses in which one sense triggers another. When one sensation is lost, the other sensations not only compensate for the loss, but the two sensations are synergistic by adding another sensation to one [64]. Taggart et al. [65] found that artists, novelists, poets, and creative people have seven times more synesthesia than other fields. Artists often connect unconnected realms and blend the power of metaphors with reality. Synesthesia appears in all forms of art and provides a multisensory form of knowledge and communication. It is not subordinated but can expand the aesthetic through science and technology. Science and technology could thus function as a true multidisciplinary fusion project that expands the practical possibilities of theory through art. Synesthesia is divided into strong synesthesia and weak synesthesia. Strong synesthesia is characterized by a vivid image in one sensory modality in response to the stimulation of another sense. Weak synesthesia, on the other hand, is characterized by cross-sensory correspondences expressed through language or by perceptual similarities or interactions. Weak synesthesia is common, easily identified, remembered, and can be manifested by learning. Therefore, weak synesthesia could be a new educational method using multisensory techniques. Synesthetic experience is the result of a unified sense of mind; therefore, all experiences are synesthetic to some extent. The most prevalent form of synesthesia is the conversion of sound into color. In art, synesthesia and metaphor are combined. Through art, the co-sensory experience became communicative. The origin of the co-sensory experience can be found in painting, poetry, and music (visual, literary, musical). To some extent, all forms of art are co-sensory [66]. The core of an artwork is its spirit, but grasping that spirit requires a medium which can be perceived not only by the one sense intended, but also through various senses. In other words, the human brain creates an image by integrating multiple nonvisual senses and using a matching process with previously stored images to find and store new things through association. So-called intuition thus appears mostly in synesthesia. To understand reality as much as possible, it is necessary to experience reality in as many forms as possible; thus, synesthesia offers a richer reality experience than the separate senses, and that can generate unusually strong memories. Kandinsky said that when observing colors, all the senses (taste, sound, touch, and smell) are experienced together. An intensive review on Multi-sensory Experience and Color Recognition in Visual Arts Appreciation of Person with Visually Impairment can be found in Cho [67]. Therefore, a method for expressing colors through 3D audio could be developed, as has been presented in this paper. These weak synesthetic experiences of interpreting visual color information through 3D sound information will positively affect color perception for people with visual impairments.

Supplementary Materials

Author Contributions

Conceptualization, Y.L.; methodology, Y.L. and J.D.C.; software, Y.L.; validation, Y.L., J.D.C. and C.-H.L.; formal analysis, Y.L. and C.-H.L.; investigation, C.-H.L. and Y.L.; resources, Y.L.; data curation, Y.L.; writing—original draft preparation, Y.L. and J.D.C.; writing—review and editing, Y.L. and J.D.C.; visualization, Y.L.; supervision, J.D.C.; project administration, J.D.C.; funding acquisition, J.D.C. All authors have read and agreed to the published version of the manuscript.

Funding

This research was funded by the Science Technology and Humanity Converging Research Program of the National Research Foundation of Korea, grant number 2018M3C1B6061353.

Institutional Review Board Statement

The study was conducted according to the guidelines of the Declaration of Helsinki, and approved by the Institutional Review Board of Sungkyunkwan University (protocol code: 2020-11-005-001, 22 February 2021).

Informed Consent Statement

Informed consent was obtained from all subjects involved in the study.

Data Availability Statement

The sound files developed in this research are provided separately as Supplementary Materials.

Conflicts of Interest

The authors declare that they have no conflicts of interest.

References

  1. Global Data on Visual Impairment 2010. Available online: https://www.who.int/blindness/publications/globaldata/en/ (accessed on 6 April 2021).
  2. Coates, C. Best Practice in Making Museums More Accessible to Visually Impaired Visitors. 2019. Available online: https://www.museumnext.com/article/making-museums-accessible-to-visually-impaired-visitors/ (accessed on 30 November 2020).
  3. Accessible Guides at The British Museum. Available online: https://www.britishmuseum.org/visit/audio-guide (accessed on 26 January 2021).
  4. Audio Guides by The Metropolitan Museum of Art. Available online: https://www.metmuseum.org/visit/audio-guide (accessed on 26 January 2021).
  5. Art inSight and MoMA Audio by Museum of Modern Art. Available online: https://www.moma.org/visit/accessibility/index (accessed on 26 January 2021).
  6. Samantha Silverberg. A New Way to See: Looking at Museums through the Eyes of The Blind. 2019. Available online: https://www.pressreleasepoint.com/new-way-see-looking-museums-through-eyes-blind (accessed on 30 November 2020).
  7. Vaz, R.; Freitas, D.; Coelho, A. Blind and Visually Impaired Visitors’ Experiences in Museums: Increasing Accessibility through Assistive Technologies. Int. J. Incl. Mus. 2020, 13, 57–80. [Google Scholar] [CrossRef]
  8. Jadyn, L. Multisensory Met: The Development of Multisensory Art Exhibits. Available online: http://www.fondazionemarch.org/multisensory-met-the-development-of-multisensory-art-exhibits.php (accessed on 30 November 2020).
  9. Brule, E.; Bailly, G.; Brock, A.; Valentin, F.; Denis, G.; Jouffrais, C. MapSense: Multi-Sensory Interactive Maps for Children Living with Visual Impairments. In Proceedings of the 2016 CHI Conference on Human Factors in Computing Systems, San Jose, CA, USA, 7–12 May 2016; pp. 445–457. [Google Scholar]
  10. Hayhoe, S. Blind Visitor Experiences st Art Museums; Rowman & Littlefield: Lanham, MD, USA, 2017. [Google Scholar]
  11. San Diego Museum of Art Talking Tactile Exhibit Panels. Available online: http://touchgraphics.com/portfolio/sdma-exhibit-panel/ (accessed on 23 April 2021).
  12. Dobbelstein, D.; Herrdum, S.; Rukzio, E. Inscent: A Wearable Olfactory Display as An Amplification for Mobile Notifica-Tions. In Proceedings of the 2017 ACM international Symposium on Wearable Computers, Maui, HI, USA, 11–15 September 2017. [Google Scholar]
  13. Anagnostakis, G.; Antoniou, M.; Kardamitsi, E.; Sachinidis, T.; Koutsabasis, P.; Stavrakis, M.; Vosinakis, S.; Zissis, D. Ac-Cessible Museum Collections for the Visually Impaired: Combining Tactile Exploration, Audio Descriptions and Mobile Gestures. In Proceedings of the 18th International Conference on Human-Computer Interaction with Mobile Devices and Services Adjunct, Florence, Italy, 6–9 September 2016; pp. 1021–1025. [Google Scholar]
  14. Reichinger, A.; Fuhrmann, A.; Maierhofer, S.; Purgathofer, W. A Concept for Reuseable Interactive Tactile Reliefs. Computers Helping People with Special Needs; Miesenberger, K., Bühler, C., Penaz, P., Eds.; Springer International Publishing: Cham, Switzerland, 2016; pp. 108–115. [Google Scholar]
  15. Cavazos Quero, L.; Bartolomé, L.C.; Cho, J.D. Accessible Visual Artworks for Blind and Visually Impaired People: Comparing a Multimodal Approach with Tactile Graphics. Electronics 2021, 10, 297. [Google Scholar] [CrossRef]
  16. Hammershoi, D.; Møller, H. Methods for binaural recording and reproduction. Acta Acust. United Acust. 2002, 88, 303–311. [Google Scholar]
  17. Ranjan, R.; Gan, W.S. Natural listening over headphones in augmented reality using adaptive filtering techniques. IEEE/ACM Trans. Audio Speech Lang. Process. 2015, 23, 1988–2002. [Google Scholar] [CrossRef]
  18. Lessard, N.; Paré, M.; Lepore, F.; Lassonde, M. Early-blind human subjects localize sound sources better than sighted subjects. Nature 1998, 395, 278–280. [Google Scholar] [CrossRef]
  19. Dong, M.; Wang, H.; Guo, R. Towards understanding the differences of using 3d auditory feedback in virtual environments between people with and without visual impairments. In Proceedings of the 2017 IEEE 3rd VR Workshop on Sonic Interactions for Virtual Environments (SIVE), Los Angeles, CA, USA, 19 March 2017. [Google Scholar]
  20. Taras, C.; Ertl, T. Interaction with Colored Graphical Representations on Braille Devices. In Proceedings of the International Conference on Universal Access in Human-Computer Interaction, San Diego, CA, USA, 19–24 July 2009; pp. 164–173. [Google Scholar]
  21. Ramsamy-Iranah, S.; Rosunee, S.; Kistamah, N. Application of assistive tactile symbols in a ’Tactile book’ on color and shapes for children with visual impairments. Int. J. Arts Sci. 2017, 10, 575–590. [Google Scholar]
  22. Shin, J.; Cho, J.; Lee, S. Please Touch Color: Tactile-Color Texture Design for the Visually Impaired. In Proceedings of the Extended Abstracts of the CHI Conference on Human Factors in Computing Systems, Honolulu, HI, USA, 25–30 April 2020. [Google Scholar]
  23. Cho, J.D.; Quero, L.C.; Bartolomé, J.I.; Lee, D.W.; Oh, U.; Lee, I. Tactile colour pictogram to improve artwork appreciation of people with visual impairments. Color Res. Appl. 2021, 46, 103–116. [Google Scholar] [CrossRef]
  24. Kandinsky, V. Concerning the Spiritual in Art; Dover Publications: Mineola, NY, USA, 1977. [Google Scholar]
  25. Donnell-Kotrozo, C. Intersensory perception of music: Color me trombone. Music Educ. J. 1978, 65, 32–37. [Google Scholar] [CrossRef]
  26. Deville, B.; Deville, B.; Bologna, G.; Bologna, G.; Vinckenbosch, M.; Vinckenbosch, M.; Pun, T.; Pun, T. See color: Seeing colours with an orchestra. In Human Machine Interaction; Springer: Berlin/Heidelberg, Germany, 2009; pp. 251–279. [Google Scholar]
  27. Cho, J.D.; Jeong, J.; Kim, J.H.; Lee, H. Sound Coding Color to Improve Artwork Appreciation by People with Visual Impairments. Electronics 2020, 9, 1981. [Google Scholar] [CrossRef]
  28. Jabbar, M.S.; Lee, C.H.; Cho, J.D. ColorWatch: Color Perceptual Spatial Tactile Interface for People with Visual Impairments. Electronics 2021, 10, 596. [Google Scholar] [CrossRef]
  29. Blauert, J. Spatial Hearing: The Psychophysics of Human Sound Localization; MIT Press: Cambridge, MA, USA, 1997. [Google Scholar]
  30. Murphy, D.; Neff, F. Spatial sound for computer games and virtual reality. In Game Sound Technology and Player Interaction: Concepts and Developments; IGI Global: Hershey, PA, USA, 2011; pp. 287–312. [Google Scholar]
  31. Jenny, C.; Reuter, C. Usability of individualized head-related transfer functions in virtual reality: Empirical study with perceptual attributes in sagittal plane sound localization. JMIR Serious Games 2020, 8, e17576. [Google Scholar] [CrossRef] [PubMed]
  32. Larsen, C.H.; Lauritsen, D.S.; Larsen, J.J.; Pilgaard, M.; Madsen, J.B. Differences in human audio localization performance between a HRTF-and a non-HRTF audio system. In Proceedings of the 8th Audio Mostly Conference; 2013; Association for Computing Machinery, New York, NY, USA, 8 September 2013; Article 5. pp. 1–8. [Google Scholar] [CrossRef] [Green Version]
  33. Mendonça, C.; Campos, G.; Dias, P.; Vieira, J.; Ferreira, J.P.; Santos, J.A. On the improvement of localization accuracy with non-individualized HRTF-based sounds. J. Audio Eng. Soc. 2012, 60, 821–830. [Google Scholar]
  34. Desloge, J.; Rabinowitz, W.; Zurek, P. Microphone-array hearing aids with binaural output. I. fixed-processing systems. IEEE Trans. Speech Audio Process. 1997, 5, 529–542. [Google Scholar] [CrossRef]
  35. Jeub, M.; Vary, P. Binaural dereverberation based on a dual-channel wiener filter with optimized noise field coherence. In Proceedings of the 2010 IEEE International Conference on Acoustics, Speech and Signal Processing, Dallas, TX, USA, 14–19 March 2010. [Google Scholar]
  36. Drossos, K.; Mimilakis, S.; Floros, A.; Kanellopoulos, N. Stereo goes mobile: Spatial enhancement for short-distance loudspeaker setups. In Proceedings of the 2012 Eighth International Conference on Intelligent Information Hiding and Multimedia Signal Processing, Piraeus-Athens, Greece, 18–20 July 2012; pp. 432–435. [Google Scholar]
  37. Drossos, K.; Floros, A.; Giannakoulopoulos, A.; Kanellopoulos, N. Investigating the impact of sound angular position on the listener affective state. IEEE Trans. Affect. Comput. 2015, 6, 27–42. [Google Scholar] [CrossRef]
  38. Li, B.; Zhang, X.; Muñoz, J.P.; Xiao, J.; Rong, X.; Tian, Y. Assisting blind people to avoid obstacles: An wearable obstacle stereo feedback system based on 3D detection. In Proceedings of the 2015 IEEE International Conference on Robotics and Biomimetics (ROBIO), Zhuhai, China, 6–9 December 2015; pp. 2307–2311. [Google Scholar]
  39. Drossos, K.; Zormpas, N.; Giannakopoulos, G.; Floros, A. Accessible games for blind children, empowered by binaural sound. In Proceedings of the 8th ACM International Conference on Pervasive Technologies Related to Assistive Environments, Corfu Greece, 1–3 July 2015; pp. 1–8. [Google Scholar]
  40. Gardner, B.; Martin, K. Hrtf Measurements of a Kemar Dummy-Head Microphone; Vol. 280. Vision and Modeling Group, Media Laboratory, Massachusetts Institute of Technology. 1994. Available online: https://citeseerx.ist.psu.edu/viewdoc/download?doi=10.1.1.39.9751&rep=rep1&type=pdf (accessed on 10 February 2021).
  41. Newton, I. Opticks, or, a Treatise of the Reflections, Refractions, Inflections & Colours of Light; Courier Corporation: Chelmsford, MA, USA, 1952. [Google Scholar]
  42. Maryon, E. MARCOTONE the Science of Tone-Color; Birchard Hayes & Company: Boston, MA, USA, 1924. [Google Scholar]
  43. Peacock, K. Synesthetic perception: Alexander Scriabin’s color hearing. Music Percept. 1985, 2, 483–505. [Google Scholar] [CrossRef]
  44. Lavignac, A. Music and Musicians; Henry Holt and Company: New York, NY, USA, 1903. [Google Scholar]
  45. Anikin, A.; Johansson, N. Implicit associations between individual properties of color and sound. Atten. Percept. Psychophys. 2019, 81, 764–777. [Google Scholar] [CrossRef]
  46. Hamilton-Fletcher, G.; Witzel, C.; Reby, D.; Ward, J. Sound properties associated with equiluminant colors. Multisens. Res. 2017, 30, 337–362. [Google Scholar] [CrossRef] [PubMed]
  47. Giannakis, K. Sound Mosaics: A Graphical User Interface for Sound Synthesis Based on Audio-Visual Associations. Ph.D. Thesis, Middlesex University, London, UK, 2001. [Google Scholar]
  48. Jonas, C.; Spiller, M.J.; Hibbard, P. Summation of visual attributes in auditory–visual crossmodal correspondences. Psychon. Bull. Rev. 2017, 24, 1104–1112. [Google Scholar] [CrossRef] [PubMed]
  49. Cogan, R.D. Sonic Design: The Nature of Sound and Music; Prentice Hall: Upper Saddle River, NJ, USA, 1976. [Google Scholar]
  50. Itten., J. The Art of Color: The Subjective Experience and Objective Rationale of Color; Wiley: New York, NY, USA, 1974. [Google Scholar]
  51. Algazi, V.R.; Duda, R.O.; Thompson, D.M.; Avendano, C. The cipic hrtf database. In Proceedings of the 2001 IEEE Workshop on the Applications of Signal Processing to Audio and Acoustics (Cat. No. 01TH8575), New Platz, NY, USA, 24–24 October 2001. [Google Scholar]
  52. Listen HRTF Database. Available online: http://recherche.ircam.fr/equipes/salles/listen/index.html (accessed on 10 February 2021).
  53. HRTF Measurements of a KEMAR Dummy-Head Microphone. Available online: https://sound.media.mit.edu/resources/KEMAR.html (accessed on 10 February 2021).
  54. Bomhardt, R.; Klein, M.D.L.F.; Fels, J. A high-resolution head-related transfer function and three-dimensional ear model database. Proc. Meet. Acoust. 2016, 29, 050002. [Google Scholar]
  55. Berzborn, M.; Bomhardt, R.; Klein, J.; Richter, J.G.; Vorländer, M. The ITA-Toolbox: An open source MATLAB toolbox for acoustic measurements and signal processing. In Proceedings of the 43rd Annual German Congress on Acoustics, Kiel, Germany, 6 May 2017; Volume 6, pp. 222–225. [Google Scholar]
  56. Krygier, J.B. Sound and geographic visualization. In Visualization in modern cartography; MacEachren, A.M., Taylor, D.R.F., Eds.; Pergamon: Oxford, UK, 1994; pp. 149–166. [Google Scholar]
  57. Osgood, C.E.; Suci, G.J.; Tannenbaum, P.H. The Measurement of Meaning; University of Illinois: Urbana, IL, USA, 1957; Volume 12. [Google Scholar]
  58. NASA Task Load Index. Available online: https://humansystems.arc.nasa.gov/groups/tlx/index.php (accessed on 15 March 2021).
  59. System Usability Scale. Available online: https://www.questionpro.com/blog/system-usability-scale (accessed on 15 March 2021).
  60. Nielsen, J.; Landauer, T.K. A mathematical model of the finding of usability problems. In Proceedings of the INTERACT’93 and CHI’93 Conference on Human Factors in Computing Systems, Association for Computing Machinery, New York, NY, USA; 1993; pp. 206–213. [Google Scholar] [CrossRef]
  61. Lamontagne, C.; Sénécal, S.; Fredette, M.; Chen, S.L.; Pourchon, R.; Gaumont, Y.; Léger, P.M. User Test: How Many Users Are Needed to Find the Psychophysiological Pain Points in a Journey Map? In Human Interaction and Emerging Technologies; Springer: Cham, Switzerland, 2019; pp. 136–142. [Google Scholar]
  62. Greenwald, A.G.; Nosek, B.A.; Banaji, M.R. Understanding and using the implicit association test: I. An improved scoring algorithm. J. Personal. Soc. Psychol. 2003, 85, 197. [Google Scholar] [CrossRef] [Green Version]
  63. Schifferstein, H.N. Comparing mental imagery across the sensory modalities. Imagin. Cogn. Personal. 2009, 28, 371–388. [Google Scholar] [CrossRef]
  64. Brang, D.; Ramachandran, V.S. How do crossmodal correspondences and multisensory processes relate to synesthesia? In Multisensory Perception; Elsevier: Amsterdam, The Netherlands, 2020; pp. 259–281. [Google Scholar]
  65. Taggart, E. Synesthesia Artists Who Paint Their Multi-Sensory Experience. 2019. Available online: https://mymodernmet.com/synesthesia-art/ (accessed on 23 April 2021).
  66. Lawrence, E. Marks the Unity of the Senses/Interrelationships Among the Modalities, Series in Cognition and Perception; Academic Press: New York, NY, USA, 1978. [Google Scholar]
  67. Cho, J.D. A Study of Multi-Sensory Experience and Color Recognition in Visual Arts Appreciation of People with Visual Impairment. Electronics 2021, 10, 470. [Google Scholar] [CrossRef]
Figure 1. Illustration of a sound spatial positioning from Drossos et al. [39].
Electronics 10 01037 g001
Figure 2. (a) 6-color wheel; (b) 8-color wheel; (c) saturated (S), light (L), and dark (D) for red.
Electronics 10 01037 g002
Figure 3. (a) Sound representations of 6-color wheel codes; (b) sound representations of 8-color wheel codes.
Electronics 10 01037 g003
Figure 4. Matching results of sound variables with depth (Near~Far).
Electronics 10 01037 g004
Figure 5. Prototyping process.
Electronics 10 01037 g005
Figure 6. Application interface. (a) The Blind Girl interface; (b) The Orange Trees interface; (c) test interface.
Electronics 10 01037 g006
Figure 7. Workload assessment scores for NASA-TLX test question indicators.
Electronics 10 01037 g007
Figure 8. Scores obtained for UX test questions.
Electronics 10 01037 g008
Table 1. Existing color codes with instruments and the color codes in this paper.
Developer
(Sense Used)
Basic Patterns (Concepts)# of Colors Presented
Taras et al. 2009 [20]
(Touch)
Dots (Braille)23 (6 Hues + 2 levels of lightness for each hue + 5 levels of achromatic colors)
Ramsamy-Iranah et al. 2016 [21]
(Touch)
Polygons (Children’s Knowledge)14 (6 Hues+ 5 other colors + 3 levels of achromatic colors)
Shin et al. 2019 [22]
(Touch)
Lines (Orientation, Grating)
The first eight colors are expressed in eight different angles of directionality by dividing a rainbow-shaped semicircle at intervals of 20 degrees
90 (8 hues + 4 levels of lightness, and 5 levels of saturation for each hue + 10 levels of brown and achromatic colors)
Cho et al. 2020 [23]
(Touch)
Dots, lines, and curves (pictograms)Simplified: 29 (6 hues + 2 levels of lightness, and 2 levels of saturation for each hue + 5 levels of achromatic colors)
Extended: 53 (12 hues +2 levels of lightness, and 2 levels of saturation for each hue + 5 levels of achromatic colors)
Cho et al. 2020 [27]
(Hear)
Classical music melodies played on different instruments23 (6 Hues + 2 levels of lightness for each hue + 5 levels of achromatic colors)
Jabber et al. [28]
(Touch)
Embossed surface pattern by color wheelSimplified: 24 (6 hues + 3 levels of lightness for each hue + 6 levels of achromatic colors)
Extended: 32 (8 hues + 3 levels of lightness for each hue + 8 levels of achromatic colors)
This paper: 6-color wheel
(Hear)
Spatial sound representation using binaural recoding in virtual environment21 (6 hues + 3 levels of lightness for each hue + 3 levels of achromatic colors)
This paper: 8-color wheel
(Hear)
27 (8 hues + 3 levels of lightness for each hue + 3 levels of achromatic colors)
Table 2. Sound representations of 6-color wheel codes.
Azimuth/Pitch−303
1. Dark red2. Saturated red3. Light red
0°–90°4. Dark orange5. Saturated orange6. Light orange
90°7. Dark yellow8. Saturated yellow9. Light yellow
120°–240°10. Dark green11. Saturated green12. Light green
270°13. Dark blue14. Saturated blue15. Light blue
360°–270°16. Dark violet17. Saturated violet18. Light violet
360°–0°19. Black20. Gray21. White
The sound files developed in this research are provided separately as a Supplementary Materials.
Table 3. Sound representations of 8-color wheel codes.
Azimuth/Pitch−303
1. Dark red2. Saturated red3. Light red
0°–90°4. Dark orange5. Saturated orange6. Light orange
90°7. Dark yellow8. Saturated yellow9. Light yellow
90°–180°10. Dark yellow-green11. Saturated yellow-green12. Light yellow-green
180°13. Dark green14. Saturated green15. Light green
270°–180°16. Dark blue-green17. Saturated blue-green18. Light blue-green
270°19. Dark blue20. Saturated blue21. Light blue
360°–270°22. Dark violet23. Saturated violet24. Light violet
360°–0°25. Black26. Gray27. White
The sound files developed in this research are provided separately as a Supplementary Materials.
Table 4. The abstract sound variables [56].
Sound VariablesIntroduction
LocationThe location of a sound in a two- or three-dimensional space.
LoudnessThe magnitude of a sound.
PitchThe highness or lowness (frequency) of a sound.
RegisterThe relative location of a pitch in a given range of pitches.
TimbreThe general prevailing quality or characteristic of a sound.
DurationThe length of time a sound is (or is not) heard.
Rate of changeThe relationship between the duration of sound and silence over time.
OrderThe sequence of sounds over time.
Attack/DecayThe time it takes a sound to reach its maximum/minimum.
Table 5. Modified concept pairs of adjectives originally from Osgood [57]
EvaluationPotencyActivity
Bright~DarkStrong~WeakFast/Agile~Slow/Dull
Clear~CloudyHard~SoftNoisy~Quiet
Joyful~DepressedRough~SmoothExtroverted~Introverted
Calm~TensePointed (Kiki)~Round (Bouba)
Sharp~Dull
Centrifugal~Centripetal
Dilated~Constricted
Comfortable~AnxiousFar~NearPassionate~Depressed
Warm~CoolHigh~Low (e.g., high-pitch~low-pitch)Active~Inactive
Table 6. The adjective pairs used in the experiments.
NumberSound Attributes
1Fast/Agile~Slow/Dull
2Strong~Weak
3Warm~Cool
4Tense~Calm
5Active~Inactive
6Noisy~Quiet
7Clear~Cloudy
8Pointed (Kiki)~Round (Bouba)Sharp~Dull
9Dilated~Constricted(Centripetal~Centrifugal)
10High~Low (e.g., high-pitch~low-pitch)
11Near~Far
Table 7. Matching results of sound variables with adjective pairs.
Loudness (Small Sound~Loud Sound)Pitch (Low Sound~High Sound)Velocity (Fast Sound~Slow Sound)Length (Short Sound~Long Sound)Attack/Decay (Decay~Attack)
Fast/Agile~Slow/Dull−0.29−0.711.430.290
Strong~Weak−1.71−0.140.430−0.71
Warm-Cool−0.14−0.14−0.71−0.57−0.14
Tense~Calm−0.57−0.5711.290
Active~Inactive−0.86−1.141.140.14−1
Noisy~Quiet−1.14−0.290.570.14−0.57
Clear~ Cloudy0−0.570.290.14−0.71
Pointed (Kiki)~Round (Bouba)
Sharp~Dull
00.43−0.43−0.57−0.29
Dilated~Constricted
(Centripetal~Centrifugal)
00.140.710.86−0.57
High~Low (e.g., high-pitch~low-pitch)−0.57−1.430.14−0.14−0.71
Near~Far−1.7100.430.57−1.14
Table 8. Six-color wheel and eight-color wheel code identification test in experiment 1 (color).
Colors SoundColor Dimensions
Left: 6-Color Wheel; Right: 8-Color Wheel)
RedOrangeYellowYellow-GreenGreenBlue-GreenBlueVioletGray
Red54 1
Orange 54 1
Yellow 55
Yellow-green 14
Green 1 54
Blue-green 5
Blue 55
Violet 55
Gray 1 54
Average correct answers (%)1008010080100100801008010010010010010010080
Total (%)10086.67
Table 9. total color codes identification test in experiment 2 (color + lightness).
Color + Lightness
Colors Sound
Color Dimensions—ColorColor Dimensions—Lightness
RedYellowBlueDarkSaturatedLight
Red—Dark10 10
Red—Saturated10 10
Red—Light10 10
Yellow—Dark 10 10
Yellow—Saturated 10 10
Yellow—Light 10 10
Blue—Dark 1010
Blue—Saturated 10 10
Blue—Light 10 10
Average correct answers (%)100100100100100100
Total (%)100100
Table 10. Total color codes identification test in experiment 3 (color + lightness + depth).
Color + Lightness + Depth
Colors Sound
Color Dimensions—ColorColor Dimensions—LightnessColor Dimensions—Depth
RedYellowBlueDarkSaturatedLightNearMidFar
Red—Dark—Near9 110 91
Red—Dark—Mid8 210 91
Red—Dark—Far8 210 10
Red—Saturated—Near10 10 10
Red—Saturated—Mid10 10 10
Red—Saturated—Far9 1 10 10
Red—Light—Near10 1 910
Red—Light—Mid9 1 10 10
Red—Light—Far9 1 10 10
Yellow—Dark—Near 10 10 10
Yellow—Dark—Mid 10 10 181
Yellow—Dark—Far19 10 10
Yellow—Saturated—Near 10 10 91
Yellow—Saturated—Mid 10 10 10
Yellow—Saturated—Far 10 10 10
Yellow—Light—Near 10 1010
Yellow—Light—Mid19 10 10
Yellow—Light—Far 10 10118
Blue—Dark—Near 1010 10
Blue—Dark—Mid 1010 181
Blue—Dark—Far 1010 10
Blue—Saturated—Near 10 10 10
Blue—Saturated—Mid 10 10 10
Blue—Saturated—Far 10 10 10
Blue—Light—Near 10 1091
Blue—Light—Mid 10 10 10
Blue—Light—Far2 81 9 19
Average correct answers (%)91.1197.7897.7810010097.7896.6794.4496.67
Total (%)95.5699.2695.93
Table 11. Identification test results for each participant.
Total Tests6-Color Wheel (43 Tests)8-Color Wheel (45 Tests)
S1S2S3S4S5S6S7S8S9S10
ColorCorrect
answer
40434337424545454142
Rate (%)93.0210010086.0597.6710010010095.3597.67
LightnessCorrect answer36363634363636363636
Rate (%)10010010095.35100100100100100100
depthCorrect answer23272720272727272727
Rate (%)90.7010010083.72100100100100100100
Rate (%)94.5710010088.3799.2210010010098.4599.22
Total Rate (%)96.4399.53
97.98
Table 12. Positive and negative user feedback from the UX Test.
Positive User FeedbackNegative User Feedback
I do not think it’s too complicated. Once you get used to it, it’s easy to use.It takes a while to get used to it at first and requires frequent viewing of the photos.
The distinction between color, brightness, and depth is very clear.In some cases, sound confusion can occur.
It’s very easy to use with just a good headset.The sounds used in the experiment were too monotonous. The experience should be better with the prototype.
Expressing all three characteristics at the same time allows you to convey information efficiently.For congenitally visually impaired people, there is a lack of experience with color. Therefore, for them, this method may not make much sense.
It’s interesting to feel the depth with the sound.There is no difficulty in distinguishing, but it was a little difficult to distinguish when hearing fatigue occurred.
Table 13. Critical user feedback and future works.
Conflicted User FeedbacksConflict Resolution (Future Works)
It takes a while to get used to it at first and requires frequent viewing of the photos.The unfamiliarity of first-time use may take some time for the user to adapt. Therefore, it is necessary to provide a concise learning tutorial along with the mobile app.
In some cases, sound confusion can occur.It is possible that the sound on the right side of the HRTF sample is a bit louder than the sound on the left side, which makes the right side similar to the front sound in the case of reverberation. Early users cannot rule out the possibility that the color is difficult to recognize when adding a depth variable to the voice modulation. For this reason, firstly, the ratio and setting of the volume and reverberation variables in the depth variables will be adjusted so that the effect of the addition of the depth variable on the other variables is reduced. Secondly, individual sounds that are particularly similar will be adjusted accordingly.
The sounds used in the experiment were too monotonous. The experience should be better with the prototype.It is correct to carry out the development of mobile applications. The final version will be complete and tested with the mobile app after the audio is improved later. Additionally, the study will add more artworks for practical application.
For congenitally visually impaired people, there is a lack of experience with color. Therefore, for them, this method may not make much sense.Congenitally blind people understand colors through physical and abstract associations. Color audition means the reaction of feeling color in one sound [27]. In the future, the study will not only focus on functionality but will also add emotional things into it. Adding sensual sounds such as music to connect colors with emotions will make the color expression more vivid.
There is no difficulty in distinguishing, but it was a little difficult to distinguish when hearing fatigue occurred.Switching between the simultaneous performance of multiple variables and performance of a single variable will be added, reducing user auditory fatigue.
Publisher’s Note: MDPI stays neutral with regard to jurisdictional claims in published maps and institutional affiliations.

