Article

Human Perceptuality-Aware Tone-Mapping-Based Dynamic Voltage Scaling for an AMOLED Display Smartphone

1
Department of Electrical and Computer Engineering, Ajou University, Suwon 16499, Korea
2
Agency for Defense Development, Daejeon 34186, Korea
*
Author to whom correspondence should be addressed.
Electronics 2021, 10(9), 1015; https://doi.org/10.3390/electronics10091015
Submission received: 26 March 2021 / Revised: 15 April 2021 / Accepted: 23 April 2021 / Published: 24 April 2021
(This article belongs to the Special Issue Design and Implementation of Efficient Future Memory Systems)

Abstract

:
In recent years, people have wanted to watch high dynamic range imagery which can give high human visual satisfaction on smartphones and demand longer smartphone battery time. However, compression of dynamic range using tone-mapping operators is required in smartphones because most smartphone displays currently have a low dynamic range, and this causes loss of local contrast and details to compress dynamic range. Thus, in this paper we propose a novel dynamic voltage scaling scheme tightly coupled with a modified tone-mapping operator to achieve high power saving as well as good human perceptuality on an AMOLED display smartphone. In order to perform a human perceptuality-aware voltage control, we control display panel voltage to save power consumption and use a well-adjusted global tone-mapping operator to convert image brightness and unsharp masking to enhance local contrast and details and control. We implement the proposed scheme on the AMOLED display Android smartphone and experiment with various high dynamic range image databases. Experimental results show that not only tone-mapped images but also general images are improved in terms of human visual satisfaction and power saving, compared to conventional techniques.

1. Introduction

Recently, active matrix organic light emitting diode (AMOLED) displays have evolved into ultrahigh definition (UHD) displays [1,2]. In addition, a market research by IHS Markit predicts that the market for high dynamic range (HDR) imagery, which is one of the most important elements in UHD (or 4K) technology, will expand sharply and have a market share of over 60% by 2020 [3]. In order to better support HDR, ARM, a global chip IP company, recently launched Assertive Display (AD)-5, the next generation display system chip, which is involved in the HDR display pipeline and improved color and gamut control [4].
The HDR image should be displayed on a display that satisfies the HDR standard (HDR display), which expresses the HDR well. However, since many displays now have a low dynamic range (LDR) display of eight bits per channel (also called standard dynamic range (SDR)), preprocessing is required to show the HDR image on the LDR display. This preprocessing is called tone mapping and it is possible to display various image qualities according to the design of the tone-mapping operator (TMO).
Meanwhile, in recent years, in order to run SNS, games, videos and so on, smartphones have been designed for a close and continuous interaction with users. AMOLED displays are one of the technologies with the largest power consumption among smartphone devices, so power saving in smartphones is important. As shown in [5], AMOLED display power consumption of an AMOLED display smartphone is over 20% of noncall usage. Therefore, optimizing the power consumption of AMOLED displays is crucial to extend the battery life of smartphones and to increase the convenience and satisfaction of users. In addition, a recent report from the National Resources Defense Council (NRDC) shows that using HDR on the same UHD images consumes more than 47% more power [6]. Therefore, research on evaluating and processing image quality in terms of low power is much required when displaying HDR images on AMOLED displays.
In this paper, we propose a technique to obtain optimal human visual satisfaction and power saving by performing TMO control considering HDR image and LDR AMOLED display of smartphone and performing dynamic voltage scaling (DVS) in conjunction with it. In addition to TMO control, unsharp masking is tuned to fit the smartphone to further improve local contrast and details. The proposed technique is implemented by controlling the framebuffer and backlight device by implementing it at hardware abstract layer (HAL) level in Android smartphones equipped with AMOLED display. At this time, human visual satisfaction is reflected by making a lookup table (LUT) by performing quality evaluation by actual human vision. The contributions of this paper are summarized as follows.
  • Compared to prior work, a DVS technique which targets tone-mapped images on the smartphone is proposed for the first time.
  • In order to consider power saving as well as image quality, Reinhard TMO is modified and applied to DVS together with unsharp masking.
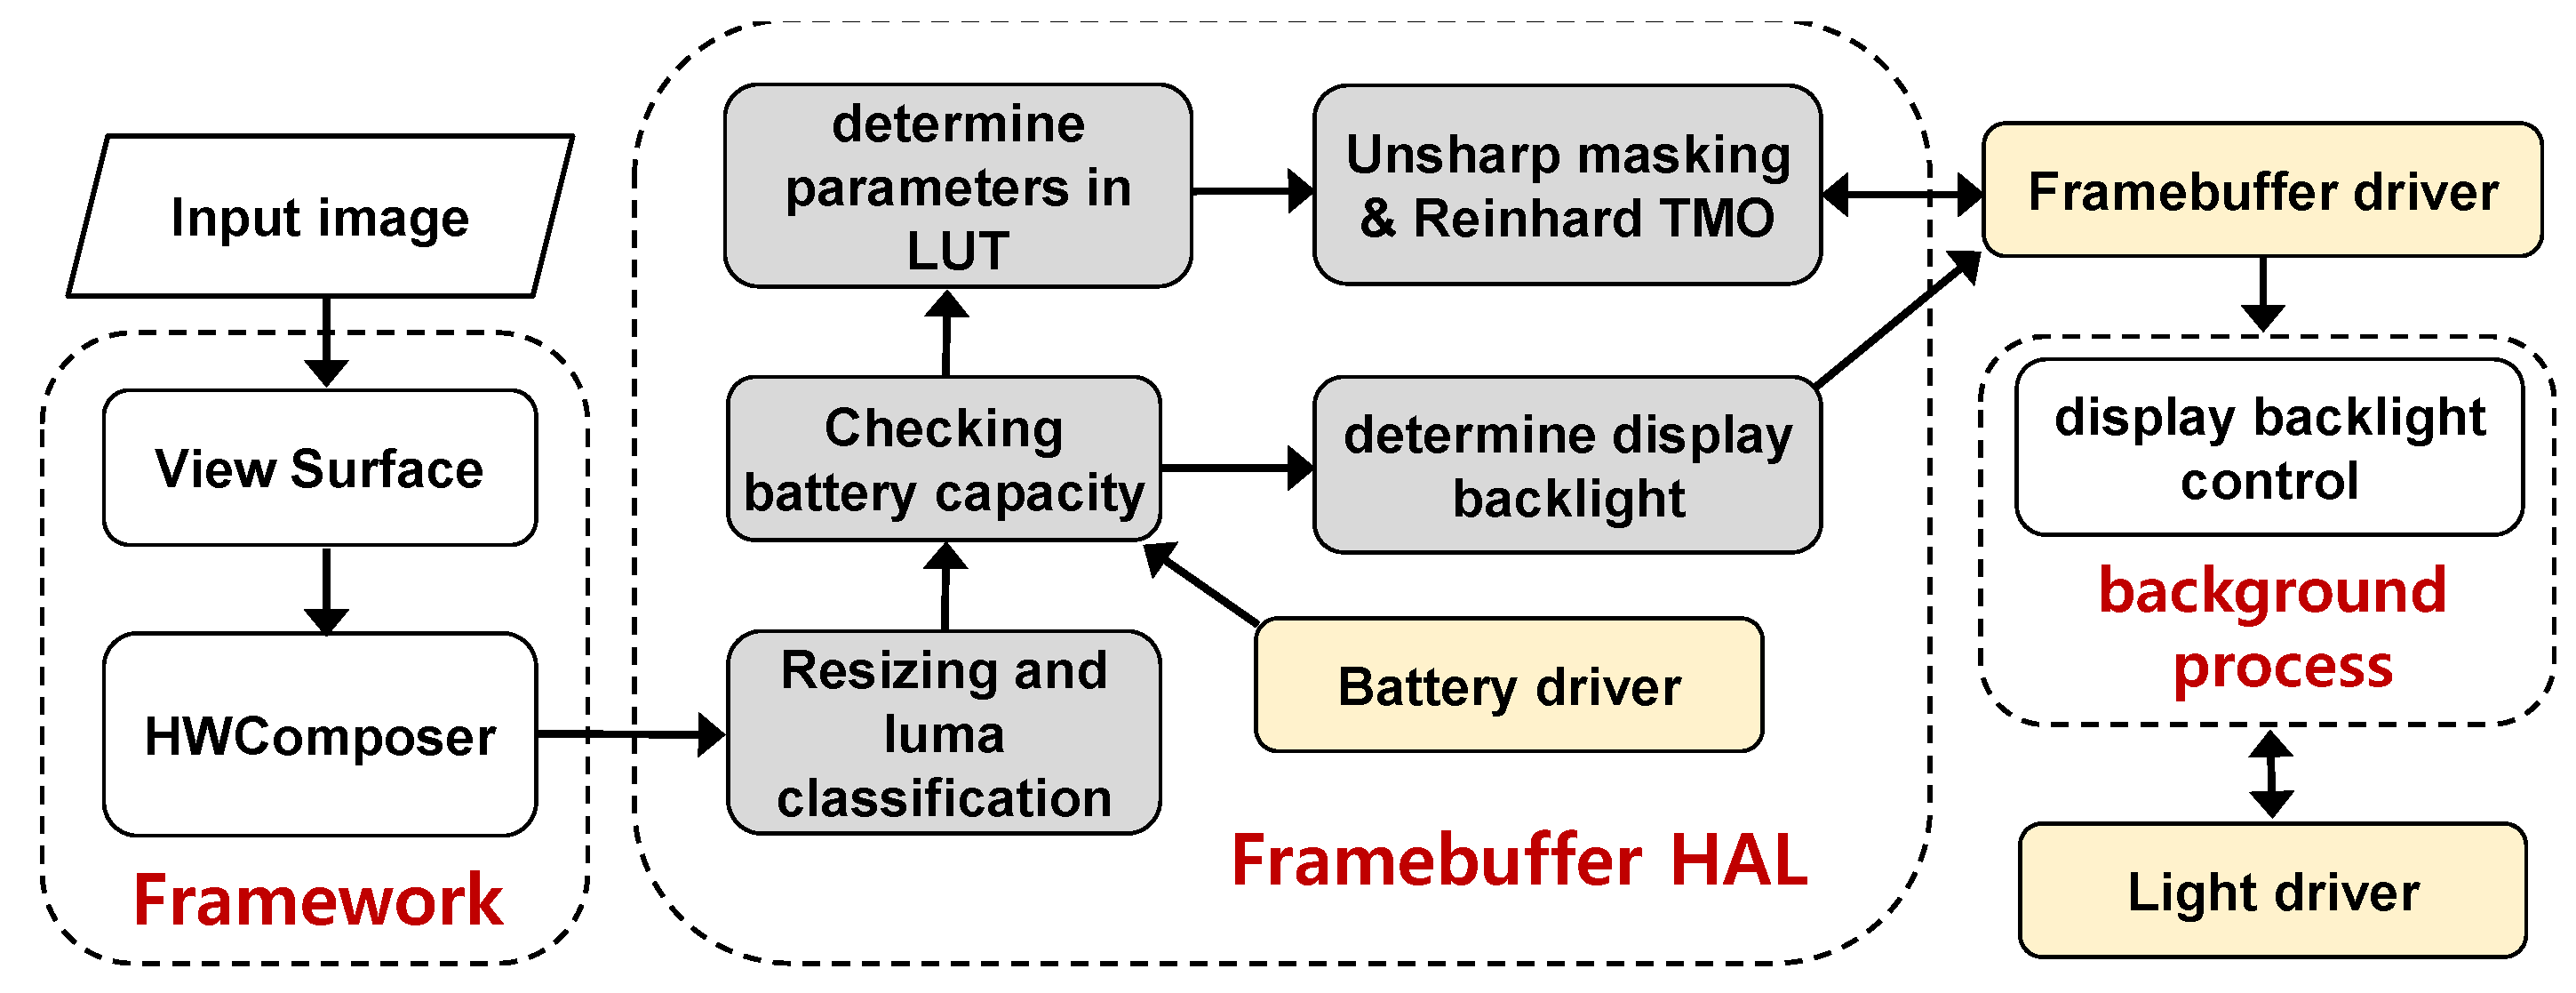
  • Runtime image quality control is performed at the HAL level of the Android platform based on the results from the user study.

2. Background and Related Work

2.1. HDR Images on LDR Displays

Among smartphones, Samsung Galaxy S3 is measured to have a maximum of 330 nits and Galaxy S7 has a maximum of 493 nits, which does not yet provide HDR [7,8]. Among smartphones, Sony Xperia XZ2 provides a HDR video mode for LCDs [9]. Since most of the AMOLED display smartphones, which are the target of this research, are equipped with LDR display devices, it is important to study HDR images on LDR displays.
TMO is an operation that performs range reduction when the range of the HDR image is larger than the dynamic range that the display can represent [10]. A lot of studies have been performed on them and they are divided into global and local TMOs [11]. Global TMO has the advantage of efficient computation time by applying the same operation to all pixels, and local TMO performs calculations based on neighboring pixel information and provides more contrast and high level of detail. Among them, Reinhard TMO [12] is basically a well-designed one [11]. Thus, in this paper, we focus on Reinhard TMO. It can be selected as global or local. Reinhard global TMO tends to saturate the bright areas too much and the local contrast of the local regions becomes larger due to local dodging and burning methods of Reinhard local one [13].

2.2. Related Work

Low-power techniques on OLED displays. The most effective low-power technique for OLED displays is DVS. DVS is a technique that performs pixel compensation to keep the luminance at the same level while varying the supply voltage applied to the AMOLED display panel. Shin et al. researched on a pioneering DVS work for OLED displays, but the target was a passive matrix OLED display [14]. Park et al. combined human visual perceptuality-aware color transformation and DVS [15]. Lee et al. proposed an entropy-based scene change detection method and combined it with DVS [16]. Hong et al. proposed a practical local gamma correction-based DVS scheme for Android smartphones [17]. These all target AMOLED displays, but only Hong et al. employed an Android smartphone. In addition, they all do not consider tone-mapped images which comes from HDR images through TMOs unlike our work (Among these works, we compared Hong’s results with ours in Section 5).
There are some remarkable low-power OLED techniques. He et al. adopted dynamic resolution scaling for power saving in AMOLED smartphones [18]. RAVEN [19] employed a frame skipping technique for both low power and human visual quality-awareness running mobile games on AMOLED smartphones. Kim et al. adjusted the refresh rate of a framebuffer according to the frame per second (FPS) for apps on AMOLED smartphones for power saving [20]. Recently, Yan et al. proposed a subpixel shutoff technique for power saving while maintaining the display quality on AMOLED smartphones [21]. These works did not fulfill a real human visual evaluation while our work did; our work focuses on combining DVS and TMOs.
Another important low-power OLED technique is color transformation. Jin et al. searched the optimal HVS-aware and low-power direction in the CIE Lab color space for general images and developed an assessment metric by combining hue, saturation, and power ratio for each direction on AMOLED display smartphones [22]. PARVAI is a grid-based low-power color transformation technique, which employs hue and saturation constraints and splits a screen into multiple grids [23]. It exploited Structural SIMilarity (SSIM) [24] and global contrast loss (GCL) to assess HVS-awareness. PARVAI is likely to cause color distortion and blocking artifacts because it minimizes only the blue channel and grid-based color transformation, respectively. Lin et al. divided a still image into several regions using a saliency model and applied different scaling to each region [25]. They employ SSIM as an image quality assessment metric. These works all did not treat the image quality control of tone-mapped images and TMOs on LDR displays. In contrast, we focus on DVS.
Tone-mapping techniques on OLED displays. Previously, Iranli et al. proposed a tone-mapping method to preserve the perceived brightness for backlight scaling in LCDs [26]. This work targeted LCDs. Chen et al. developed a low-power tone-mapping technique for OLED displays based on video classification using a power feature-based Hidden Markov Model (HMM) classifier in video stream [27]. They applied different dynamic tone-mapping schemes to each classified video category and utilized SSIM for determining the image quality. They focused on three tone-mapping techniques of color range mapping shown in [28], saturation tuning, and hue tuning. This work does not consider power-aware control of TMOs for DVS. In addition, we employed real human visual evaluations for image quality assessment through user study instead of SSIM. T. Shiga et al. [29] used the Helmholtz-Kohlraush effect, where humans perceive a high saturation image as a brighter image even if their luminance are same, to save the power consumption of OLED display while minimizing the deterioration of human visual satisfaction. They saved power by lowering the luminance of pixels and compensated for bright, which is decreased due to the luminance decrease, by increasing saturation. However, their work is not about DVS, so the display power saving ratio is only 8% when the color change is not significant. A. Bhojan [30] used Energy Efficient Color Mapping (EECM) to convert a color of each video frame to a color that consumes less power, and then used gamma correction to lower the luminance, which is closely related to power saving, of each pixel. However, their research also is not a DVS technique that controls the supply voltage of the display, so the power saving effect is not significant. As a result, there is no research combined with the DVS technique that controls the supply voltage of the display among the techniques that apply tone mapping to the OLED display. Therefore, there is a need to associate a DVS, which has more power saving effect, with a tone-mapping technique.

3. Motivational Studies

We find that an LDR image, which is obtained after a TMO is applied to a HDR image, has lowered dynamic ranges and degraded details together with human visual appearance loss (we call this image an HDR-like LDR image). Now we test HDR-like LDR images for the combinations of supply voltage control and TMOs on an AMOLED display smartphone to find the relation between image quality and power consumption. Since our work targets an LDR display and HDR-like LDR images still have much room for contrast and detail enhancement, we need to investigate how to improve their contrast and local details while reducing the power consumption of an LDR display. To this end, we utilized well-designed Reinhard TMO and controlled the brightness of the panel. We used a Galaxy S3 smartphone [31] with an AMOLED display panel of a 1280 × 720 resolution and its Android platform version is 6.0 Marshmallow. The used tone-mapped image is arbitrarily selected from among the best MOS images Yeganeh’s TMO database [32] and we treat the best MOS images as the HDR-like LDR image.
Figure 1a–d are taken for a Galaxy S3 screen using a SONY DSC-RX100 III camera with ISO200, WB5500K, shutter speed 1/30 and F-stop 3.5 under normal light. Figure 1e,i contain locally cropped enlargements of Figure 1a. Figure 1a is a HDR-like image resized by a resolution of 1280 × 720 with a brightness value of 200. In this image, the shadow is so dark that the tree and grass details in shadow are not easily discernible. In addition, the snow on the mountain is obscure. Figure 1b is the result obtained when modified Reinhard global TMO is applied to Figure 1a and the brightness is set to 100. In this case, 27.3% power saving is achieved, but when we compare Figure 1f,j with Figure 1e,i, respectively, we can see that image quality is degraded slightly.
To enhance the local contrast and details, we applied the Reinhard local TMO and Reinhard global TMO + unsharp masking [33,34]. As we can see in Figure 1g,k, which are locally cropped enlargements of Figure 1c, Reinhard local TMO improves the details of a bush, a tree, and snow to give better human visual satisfaction over Figure 1f,j as well as a big power saving of 25.9%. However, we observe that more local detail enhancement occurs in Figure 1h,l which corresponds to the case of Reinhard global TMO + unsharp masking. Figure 1h has much clearer view than Figure 1e–g. Figure 1l also has clearer than Figure 1i–k. The power saving in Figure 1d also reaches 25.1%, which is comparable to the power saving amount in Figure 1c. In addition, Reinhard local TMO requires high overhead operations such as Fast Fourier Transform (FFT) as described in [12]. This can result in high system power including high CPU power and large execution time which may be inappropriate to mobile devices like smartphones.
Based on these observations, we believe that it is necessary to find the optimum combination of TMO brightness control parameter, local detail enhancement parameter, and AMOLED display panel voltage, which results in the optimal balance of power saving and human visual satisfaction for the converted image. In addition, making the execution times of TMO and DVS appropriate for run-time applications in constrained smartphone environments needs to be considered.

4. Design of Tone-Mapping-Based DVS

4.1. Unsharp Masking for Smartphones

Unsharp masking is a technique to generate a detail-enhanced image with enhanced edges by adding the resulting image of a high pass filter to the original image [33,34]. The process of unsharp masking is shown as (1). In (1), y m ,   n , x m ,   n and z m ,   n respectively represent enhanced image, original image and high pass filtered image. Thus, we can create a detail-enhanced image using (1) and use the λ to control the detail enhancement.
y m , n = x m , n + λ z m , n
A commonly used high pass filter for high pass filtered image z m , n in (1) is the Laplacian of Gaussian (LoG) [35,36,37]. When the LoG kernel size is M × M, (M = 2h + 1), it is common to set h ≥ 4σ for the edge-detection application. However, if the application is local contrast enhancement, a smaller h is also possible [38]. Ref. [38] introduces parameter k dependent on σ and kernel radius h. If the target application is a contrast enhancement, there is no problem to reduce h to satisfy k < 1.1, and it is advantageous in view of CPU time [38]. In our study, considering the computing power of the smartphone, it is difficult to set σ more than 2, and taking σ < 0.5 has little effect on smoothing [35], a combination of h = 2σ, kernel size = 5 × 5, σ = 1 has been adopted to balance the aforementioned considerations.
Figure 2a shows x (m, n) in (1) as the result image of the modified Reinhard global TMO, which will be described in Section 4.2 and Figure 2b shows y (m, n) in (1) as the result image of the unsharp masking. The image in Figure 2b has more detail than Figure 2a to compensate for the detail loss of the global TMO. Table 1 compares the execution times of Reinhard local and global TMO and Reinhard global TMO + unsharp making using MATLAB 2014b in a desktop computer with Intel i7-3770 CPU, 16GB DRAM, and Windows 10. The image database uses HDR-like images representing the best MOS for the 15 tone-mapped images of [32] and 10 tone-mapped images of [39] as reference images. Since these images have different resolutions, we resize the images to a resolution of 1024 × 1024. Reinhard local TMO had a mean execution time of 0.94 s, whereas Reinhard global TMO had a time of 0.05 s, and local TMO required 18 times more time than global TMO. This shows that Reinhard local TMO requires much more execution time than Reinhard global TMO, although the ratio of execution time difference is less than that of [12] due to the difference of experimental environment.
Also, Reinhard local TMO enhances local detail and enhances image quality. However, its improving image quality is comparable to that from well-modified global TMO and it has no significant benefit in terms of power saving. Therefore, in this study, we aim to obtain image quality and power saving by using a combination of global TMO and unsharp masking to meet smartphone’s computing power and memory limit instead of detail and contrast enhancement by local TMO.

4.2. Modified Tone-Mapping Operator

Since we used the Reinhard global TMO as a pixel compensation method for DVS, we modified several parameters to control the brightness and contrast of a target image. In global Reinhard TMO, after a linear scaling in (2), by L w h i t e the luminance above a certain value is mapped to the output luminance by passing through the luminance mapping function which is clamped to the max luminance that the display can express as shown in (3).
L x , y   =   α L ¯ i n p u t L i n p u t x , y  
L d   x , y   =   L x , y 1 + L x , y L w h i t e 2 1 + L x , y
In (2), L i n p u t x , y means an input luminance and L ¯ i n p u t represents the log average of an input image. In (3), L d x , y means an output luminance. In this study, the user-specified parameter α used in Reinhard TMO is set as (4).
α = L ¯ i n p u t × L w h i t e  
By doing so, we can use the L w h i t e value as a parameter to control the brightness. A high L w h i t e value means that the image is much brighter after conversion, and a lower L w h i t e value means that the image is slightly brighter after conversion.

4.3. Measuring Human Perceptuality

We employed a user study instead of objective image assessment metrics to evaluate the image quality correctly, focusing on the enhancement of local contrast and details. The user study was conducted for 27 subjects consisting of 20 undergraduates and 7 graduates with normal or corrected visions in the university campus. The test methodology was adopted from that proposed in [17]. In a darkroom, a subject evaluated two images displayed on individual Galaxy S3 smartphones concurrently by scoring the image similarity against the reference image on a centered smartphone. Twenty images with different average brightness are selected from [32,39,40] and adjusted to have different TMO parameters and different brightness (i.e., supply voltage) values for evaluations.
We used Reinhard global TMO as our main pixel compensation method to improve the image quality degraded due to DVS. For the Reinhard global TMO, L w h i t e was adjusted to 2, 3, and 4. To enhance the local contrast and details, unsharp masking described in Section 4.1 was also used by changing λ to 4 and 7 in (1). The brightness was changed to 50, 100, 150, and 200. We found that the highest possible brightness on Galaxy S3 indoors was 198 and thus we limited the largest brightness value to 200.
Considering the battery capacity of the smartphone, we divided it into low-power mode and Optimal HVS mode. When the battery capacity is sufficient (≥20), it operates in Optimal HVS mode and choose one of the two highest MOS score with the highest power savings. When battery capacity is low (≤20), it operates in low-power mode and chooses one of the two highest power saving ratios with the highest MOS score.

4.4. Tone-Mapping-Based DVS Scheme

The overall flow of the proposed tone-mapping-aware DVS scheme is shown in Figure 3. First, when an input image comes, the view surface of the Android framework is executed for screen composition. Through the Surfaceflinger and HWComposer, the processed image is transferred to the Framebuffer HAL in the form of a buffer containing pixel values, and the R, G and B pixel values can be read by accessing this buffer. The proposed method computes the luma value using the read RGB values and reads the battery information from the battery driver to access the LUT of the power mode. Once the optimal parameters ( L w h i t e , λ) and brightness values are determined in the LUT, pixel conversion and display backlight value scaling are performed. The proposed pixel compensation technique, combination of Reinhard TMO and unsharp masking is applied to the image and it is transferred to the framebuffer driver. Then, the resultant image is shown on the AMOLED display.
Display backlight scaling uses the background process of the Android operating system using a native app. The variable brightness value in the HAL is passed to the framebuffer driver and the background process reads the information of the framebuffer driver to recognize the variable brightness value to synchronize the brightness values. Then, backlight scaling is performed by controlling the supply voltage of the AMOLED display by transmitting variable brightness information to the light driver.

5. Experiments and Results

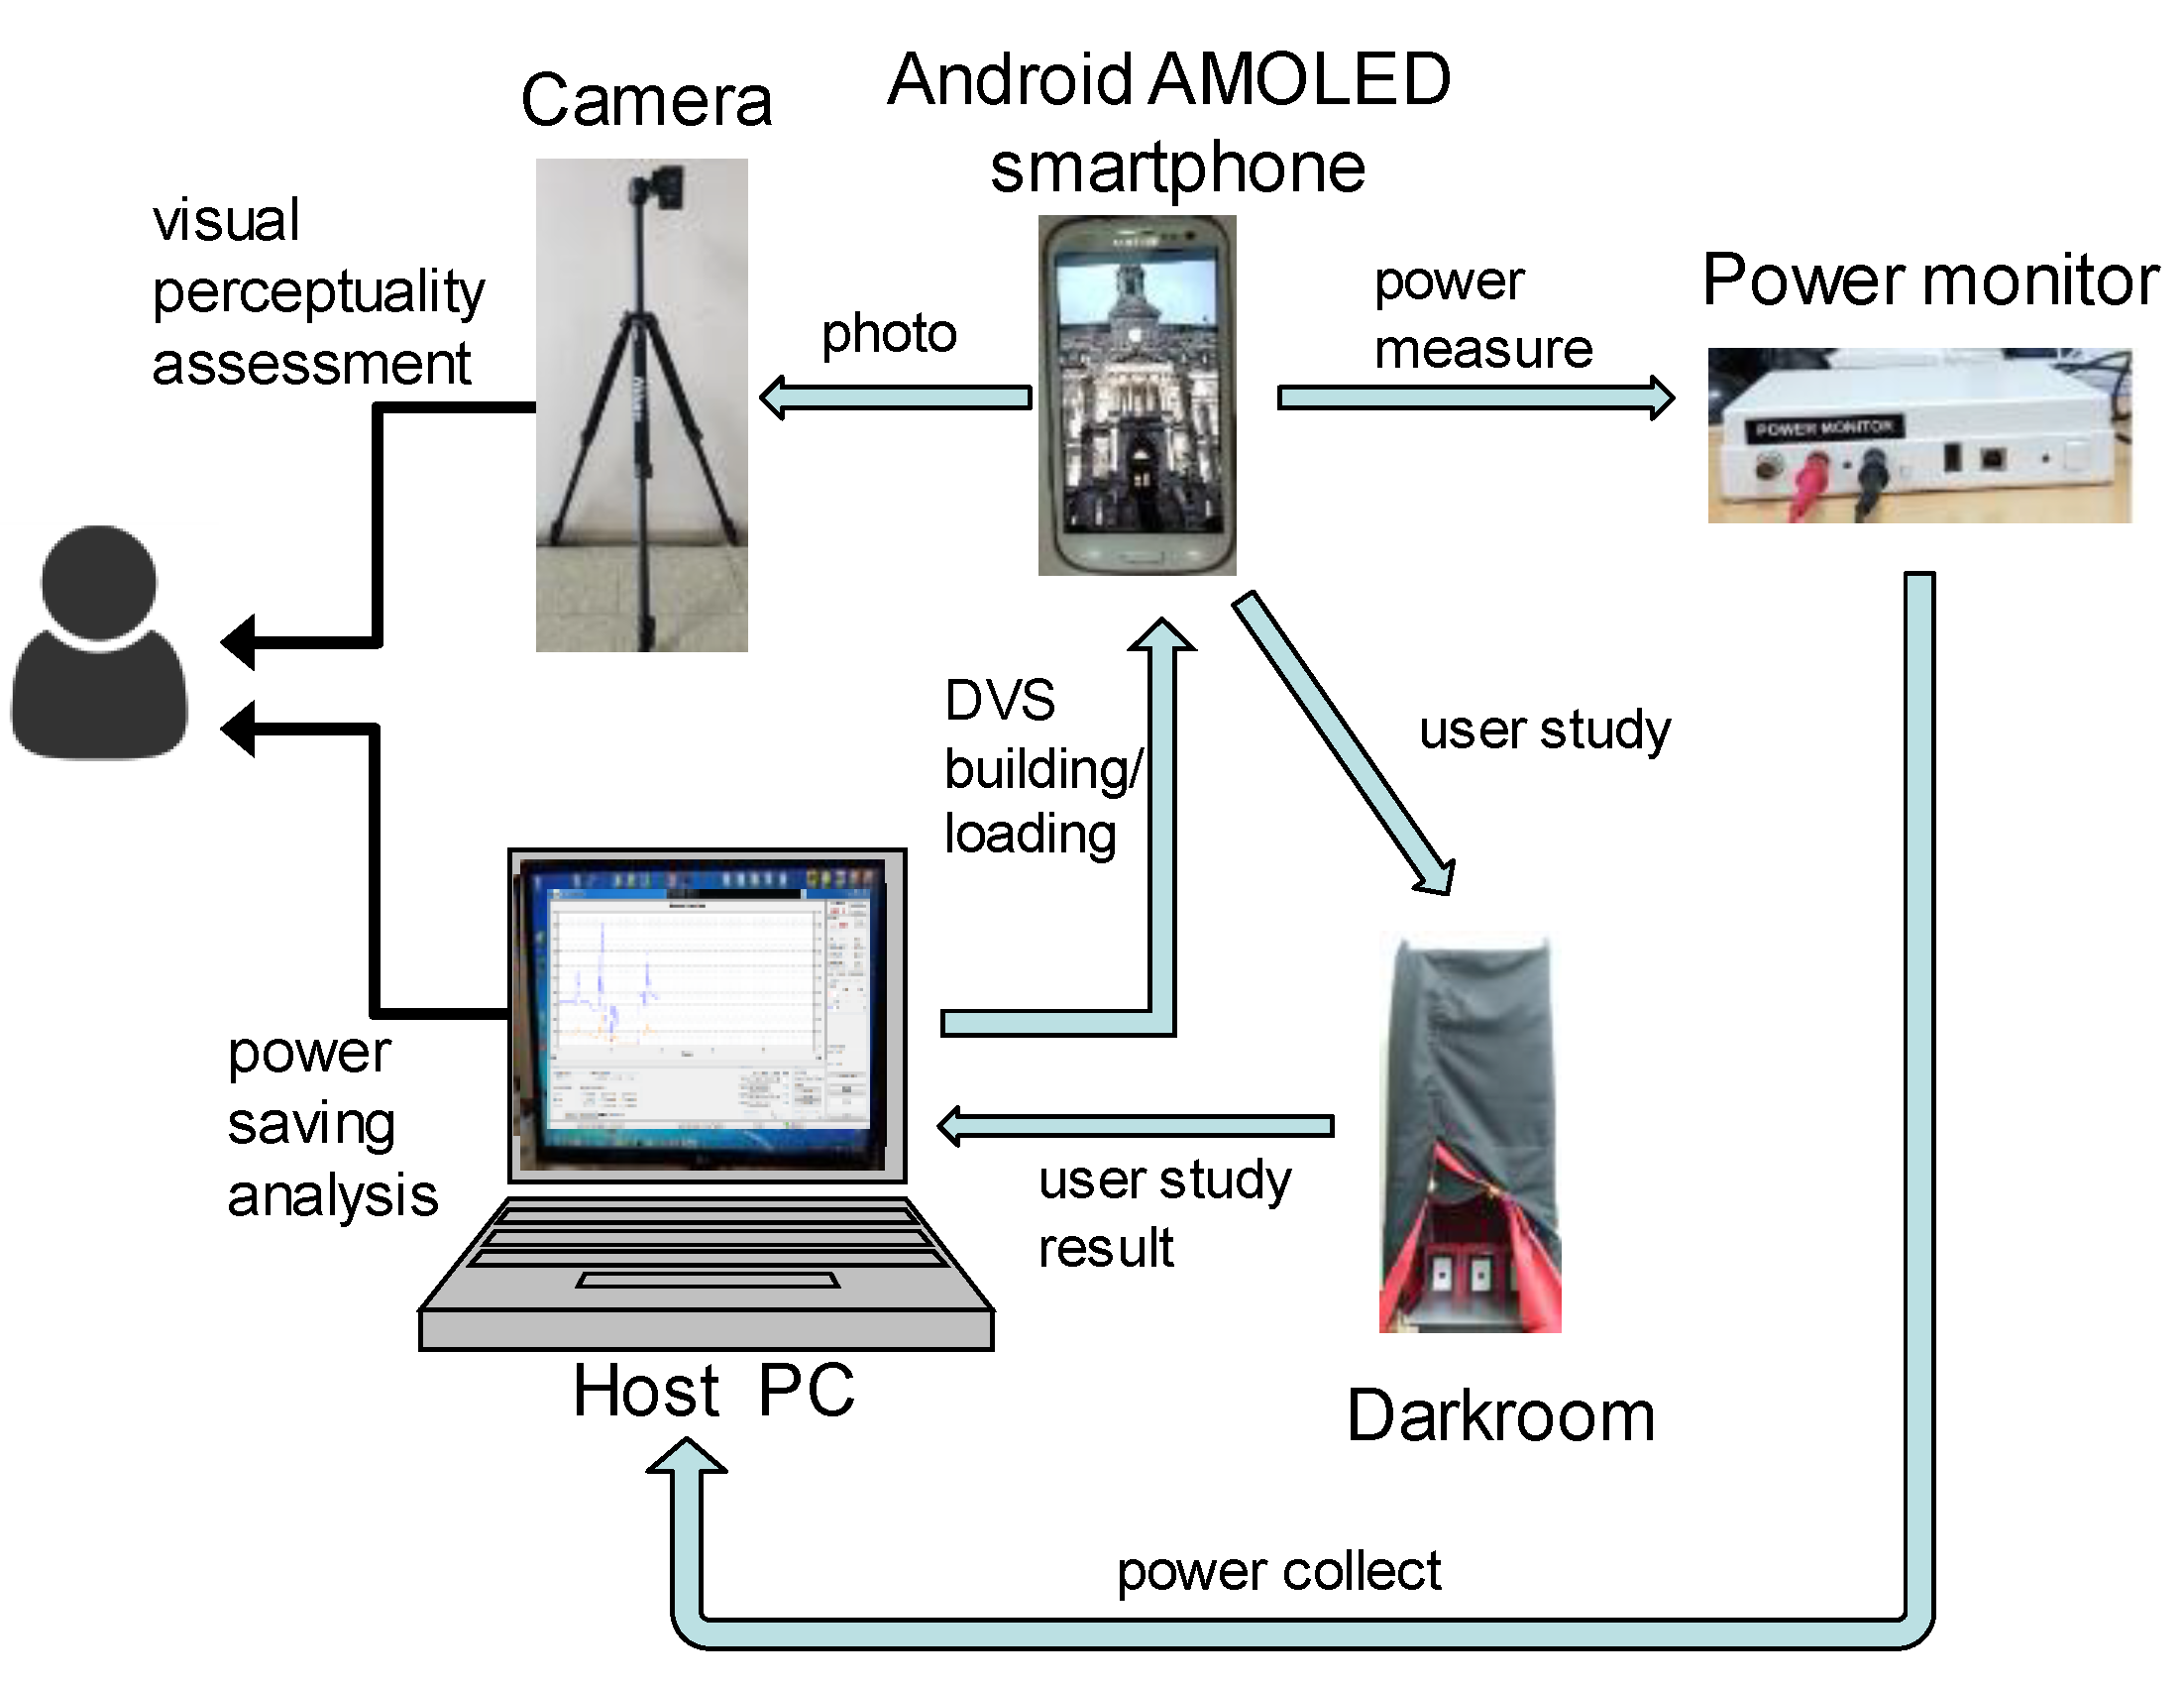
5.1. Experimental Setup

Our experimental setup is shown in Figure 4. HDR-like images used in the experiments were selected as images not used in the user study among images existing in [32,39] and also included the normal LDR images. The proposed method is compared with the normal mode of the smartphone and LGC-DVS [17]. The target device was a Galaxy S3 equipped with a 4.8-inch HD super AMOLED display panel. We implemented our proposed method with LGC-DVS at Android HAL level. We also use the Monsoon power monitor [41] as a tool for the power measurement. The experimental images were selected from 20 different luma values selected for the TMO databases [32,39,40] and LIVE database [42], and the techniques were applied to these images and power measurements were performed. We put the smartphone to airplane mode for accurate measurement. A camera was used to shoot the AMOLED display screen displaying the results of the proposed method and other methods.
The power consumed in the smartphone display for each image is calculated as shown in (5).
P d i s p l a y i m a g e   m W = P s m a r t p h o n e i m a g e P s m a r t p h o n e R , G , B = 0
In (5), P s m a r t p h o n e i m a g e represents the power consumed by all components of smartphone when an image is displayed, and P s m a r t p h o n e R , G , B = 0 represents the power consumed by all components of smartphone when an image with R, G, and B values of all pixels is displayed. Since AMOLED displays have independent light-emitting elements for each pixel, if true black image (R, G, B = 0) is displayed, the dynamic power consumed by the display is zero. Therefore, P s m a r t p h o n e i m a g e P s m a r t p h o n e R , G , B = 0 means the dynamic power consumed by the AMOLED display when the image is displayed.
D i s p l a y   p o w e r   s a v i n g   % = P d i s p l a y n o r m a l   m o d e P d i s p l a y m e t h o d   P d i s p l a y n o m a l   m o d e × 100
The power saving ratio used in this paper is the ratio of saved power caused by DVS technique to normal mode power. The power-saving ratio is calculated as shown in (6). In (6), P d i s p l a y m e t h o d   represents the dynamic power consumed by smartphone display when the technique is applied, and P d i s p l a y n o r m a l   m o d e represents the dynamic power consumed by the smartphone display when the technique is not applied.

5.2. Experimental Results

Figure 5a–l are taken for a Galaxy S3 screen using a SONY DSC-RX100 III camera with ISO 200, WB 5500K, shutter speed 1/30 and F-stop 3.5 under normal light environment. Figure 5a,d,g,j are reference images and the used smartphone was set with the default setting (display backlight value = 200). Figure 5b,e,h,k are the results of LGC-DVS and the display backlight was set by LGC-DVS. Figure 5c,f,i,l are the results of the proposed method and the display backlight was set by the proposed method. In Figure 5, the average luma means the average of the RGB values of the corresponding image, and the display power saving means the percentage of display power saving against the reference images when LGC-DVS and the proposed method are applied. Although the average luma determines the image brightness, the brightness we actually see is heavily influenced by the display backlight value. The backlight value achieves power saving, but the visual perceptuality may be harmed. Thus, image compensation is required for the decreased visual satisfaction. Figure 5c shows a 37.13% decrease in display power against Figure 5a by lowering the backlight value although its average luma is higher than that of Figure 5a. Looking at the sky between the central trees of the image, we can see that Figure 5a is clearly a brighter image. However, we can see that the visual satisfaction in Figure 5c is higher because the dark objects are well visible and the detail of the objects is alive. This phenomenon can also be observed when comparing Figure 5d and Figure 5f. We notice that Figure 5d is much brighter than Figure 5f (see sky brightness outside the window), but visual satisfaction is higher in Figure 5f. This is because the boundaries between objects are clearly distinguished and the details of objects are improved. Therefore, we can know that the parameters ( L w h i t e , λ, display brightness value) found through the user study is both efficient in terms of human visual satisfaction and power saving.
Figure 5b,e shows that the image compensation is quite passive. Comparing them, the average luma value of the converted image is not higher than that of the original image, so pixel compensation rarely occurs, which may not compensate enough the visual loss due to the decreased backlight value. The same phenomenon occurs when comparing Figure 5e,d. Since the decreased backlight is not compensated, the bottom area where a person, chairs, and drawers exist in Figure 5e is not well distinguished, so human visual satisfaction is considerably reduced. However, as shown in Figure 5f, the proposed method appropriately increases the average luma using the parameters found through the user study. Thus, the objects are well distinguished in the dark part. At the same time, due to sharpening which makes details better, the human visual satisfaction is high. Though not as much as LGC-DVS, the display power reduction of the proposed method is fairly significant.
Table 2 shows the average power consumption values of LGC-DVS and the proposed method, and their power saving ratios compared to the normal mode for 20 images, respectively. Twenty images were selected from 12 images in the TMO image database [32,39,40], and 8 images from the LIVE database [42]. The brightness of the image was selected from various images ranging from 0 to 200. LGC-DVS [17] and the proposed method show that power is lower than the normal mode in almost all cases. Both of these techniques reduce power consumption compared to the normal mode when the backlight is 200 because the display backlight value is decreased enough.
In terms of the power consumption, LGC-DVS shows very good performance. However, LGC-DVS has a very low increase of pixel values for compensation and thus the total visual quality is degraded. In contrast, the proposed method has a large luma value (Avg. 139.01) compared to the normal mode. Such proper pixel compensation can improve visual satisfaction that has been reduced due to AMOLED display dimming. In addition, the proposed method shows a sufficient power saving rate of more than 35% against the normal mode in both TMO and LDR images.
In this technique, the color of image must be changed compared to color of the original image since the modified tone-mapping operator is used to change all pixel values of original image. In order to satisfy human visual satisfaction despite color change as much as possible, we selected a parameter combination of high MOS scores among all parameter combinations through a user study in Section 4. However, it is necessary to accurately analyze degree of color change caused by pixel conversion and display DVS techniques. To do this, we conducted an experiment on how much color error the proposed technique had compared to normal mode. The experiment of color error was conducted using the Macbeth chart [43], which consists of 24 colors which emulate common natural colors such as skin colors, sky and foliage. These standard colors can be used to measure color error. We displayed images with the standard colors on the smartphone display and measured the color using KONICA MINOLTA’s CA-P410 [44]. The color coordinate values in the CIE Lab color space with and without the proposed technique are shown in Figure 6. We calculated the Euclidian distance between these two coordinates because the distance between two different colors in the L * a * b * space is proportional to the difference in color perceived by humans. As a result, the average Euclidian distance between results with and without this technique was 2.34, which is close to just noticeable difference (JND).

6. Conclusions

In this paper, we have presented a novel DVS scheme based on TMO control for tone-mapped images on an AMOLED LDR display smartphone to achieve both power saving and human perceptuality optimally. We conducted power-aware image quality control using a modified well-designed TMO and also apply unsharp masking to enhance local contrast and details. In extensive experiments, the proposed method saved on average 37.38% of display power for tone-mapped images maintaining the human visual satisfaction by enhancing local contrast and details effectively. Compared to a prior well-designed technique, it showed better human perceptuality for tone-mapped images and general images. Consideration of system power remains future work, including performance acceleration in executing TMOs.

Author Contributions

Conceptualization, Y.-J.K.; Investigation, S.S., S.M.H., Y.-J.K.; Software, S.S., S.M.H.; Writing—original draft, S.S., S.M.H.; Visualization, S.S.; Supervision, Funding acquisition, Y.-J.K.; Writing—review & editing, Validation, Y.-J.K., J.S.P.; Project administration, J.S.P. All authors have read and agreed to the published version of the manuscript.

Funding

This work has been supported by the Future Combat System Network Technology Research Center program of Defense Acquisition Program Administration and Agency for Defense Development. (UD190033ED).

Informed Consent Statement

Informed consent was obtained from all subjects involved in the study.

Conflicts of Interest

The authors declare no conflict of interest.

References

  1. BCC: UHD Display Market Worth $132bn by 2022. Available online: https://advanced-television.com/2018/02/21/bcc-uhd-display-market-worth-132bn-by-2022/Powerguru (accessed on 12 February 2020).
  2. The Biggest “Emerging” Tech Product of 2018? 4K TVs. Available online: https://www.flatpanelshd.com/news.php?subaction=showfull&id=1516272294 (accessed on 12 February 2020).
  3. IHS Study: 4K Ultra HD HDR To Take Major TV Market Share By 2020. Available online: https://hdguru.com/ihs-study-4k-ultra-hd-hdr-to-take-major-tv-market-share-by-2020/ (accessed on 12 February 2020).
  4. Arm Announces Mali-D71 for 4K/120 Hz Displays, Assertive Display 5 with HDR. Available online: https://www.cnx-software.com/2017/11/01/arm-announces-mali-d71-for-4k120-hz-displays-assertive-display-5-with-hdr/ (accessed on 12 February 2020).
  5. Chen, X.; Chen, Y.; Ma, Z.; Felix, C.A.F. How is energy consumed in smartphone display applications? In Proceedings of the 14th Workshop on Mobile Computing Systems and Applications (HotMobile ’13); ACM: New York, NY, USA, 2013. [Google Scholar]
  6. UHD TVs Consume 3x More Power Than HD. Available online: http://advanced-television.com/2015/11/20/uhd-tvs-consume-3x-more-power-than-hd/ (accessed on 12 February 2020).
  7. Available online: https://www.gsmarena.com/samsung_galaxy_s_iii_vs_galaxy_note_ii-review-830p2.php (accessed on 12 February 2020).
  8. Available online: https://www.phonearena.com/news/Outdoor-display-comparison-iPhone-6s-vs-S7-edge-vs-10-vs-G5_id81070 (accessed on 12 February 2020).
  9. Sony’s Latest Flagship Smartphone Shoots 4K HDR Video. Available online: http://fortune.com/2018/02/26/sonys-xperia-xz2-4k-hdr-mobile-world-congress-barcelona/ (accessed on 12 February 2020).
  10. Reinhard, E.; Valenzise, G.; Dufaux, F. “High Dynamic Range Video”, Tutorial. In Proceedings of the Eusipco2016, Budapest, Hungary, 29 August–2 September 2016. [Google Scholar]
  11. Cerda-Company, X.; Parraga, C.A.; Otazu, X. Which tone-mapping operator is the best? A comparative study of perceptual quality. J. Opt. Soc. Am. A 2018, 35, 626–638. [Google Scholar] [CrossRef] [PubMed]
  12. Reinhard, E.; Stark, M.; Shirley, P.; Ferwerda, J. Photographic tone reproduction for digital images. ACM Trans. Graph. 2002, 21, 267–276. [Google Scholar] [CrossRef] [Green Version]
  13. Aydin, T.O.; Mantiuk, R.; Myszkowski, K.; Seidel, H.-P. Dynamic range independent image quality assessment. In ACM SIGGRAPH 2008 Papers (SIGGRAPH ’08); ACM: New York, NY, USA, 2008; 10p. [Google Scholar] [CrossRef] [Green Version]
  14. Shin, D.; Kim, Y.; Chang, N.; Pedram, M. Dynamic Driver Supply Voltage Scaling for Organic Light Emitting Diode Displays. IEEE Trans. Comput. Des. Integr. Circuits Syst. 2013, 32, 1017–1030. [Google Scholar] [CrossRef] [Green Version]
  15. Park, J.-H.; Maregn, Z.; Kim, Y.-J. Color transformation-based dynamic voltage scaling for mobile AMOLED displays. IEICE Electron. Express 2015, 12, 20150239. [Google Scholar] [CrossRef] [Green Version]
  16. Lee, B.-H.; Kim, Y.-J. Dynamic Voltage Scaling Using Scene Change Detection for Video Playback on Mobile AMOLED Displays. In Proceedings of the 2016 IEEE/ACM International Symposium on Low Power Electronics and Design (ISLPED), San Francisco, CA, USA, 8–10 August 2016. [Google Scholar]
  17. Hong, S.; Kim, S.-W.; Kim, Y.-J. LGC-DVS: Local Gamma Correction-Based Dynamic Voltage Scaling for Android Smartphones with AMOLED Displays. IEEE J. Electron Devices Soc. 2017, 5, 432–444. [Google Scholar] [CrossRef]
  18. He, S.; Liu, Y.; Zhou, H. Optimizing Smartphone Power Consumption through Dynamic Resolution Scaling. In Proceedings of the 21st Annual International Conference on Mobile Computing and Networking (MobiCom ’15); ACM: New York, NY, USA, 2015; pp. 27–39. [Google Scholar] [CrossRef]
  19. Hwang, C.; Pushp, S.; Koh, C.; Yoon, J.; Liu, Y.; Choi, S.; Song, J. RAVEN: Perception-aware Optimization of Power Consumption for Mobile Games (MobiCom ’17). In Proceedings of the 23rd Annual International Conference on Mobile Computing and Networking, Snowbird, UT, USA, 16–20 October 2017; pp. 422–434. [Google Scholar] [CrossRef]
  20. Kim, D.; Jung, N.; Chon, Y.; Cha, H. Content-Centric Energy Management of Mobile Displays. IEEE Trans. Mob. Comput. 2015, 15, 1925–1938. [Google Scholar] [CrossRef]
  21. Yan, Z.; Chen, C.W. Too Many Pixels to Perceive: Subpixel Shutoff for Display Energy Reduction on OLED Smartphones. In Proceedings of the 2017 ACM on Multimedia Conference (MM ’17); ACM: New York, NY, USA, 2017; pp. 717–725. [Google Scholar]
  22. Jin, J.-C.; Lee, J.-H.; Kim, E.-S.; Kim, Y.-J. OPT: Optimal human visual system-aware and power-saving color transformation for mobile AMOLED displays. Multimedia Tools Appl. 2017, 77, 16699–16720. [Google Scholar] [CrossRef]
  23. Anand, B.; Kecen, L.; Ananda, A.L. PARVAI—HVS aware adaptive display power management for mobile games. In Proceedings of the IEEE International Conference on Mobile Computing and Ubiquitous Networking, Singapore, 6–8 January 2014; pp. 21–26. [Google Scholar]
  24. Wang, Z.; Bovik, A.C.; Sheikh, H.R.; Simoncelli, E.P. Image quality assessment: From error visibility to structural similarity. IEEE Trans. Image Process. 2004, 13, 600–612. [Google Scholar] [CrossRef] [PubMed] [Green Version]
  25. Lin, C.-H.; Kang, C.-K.; Hsiu, P.-C. Catch your attention: Quality-retaining power saving on mobile OLED displays. In Proceedings of the 2014 51st DAC/IEEE Design Automation Conference (DAC), San Francisco, CA, USA, 1–5 June 2014; pp. 1–6. [Google Scholar]
  26. Iranli, A.; Pedram, M. DTM: Dynamic tone mapping for backlight scaling. In Proceedings of the 42nd annual Design Automation Conference (DAC ’05); ACM: New York, NY, USA, 2005; pp. 612–617. [Google Scholar] [CrossRef]
  27. Chen, X.; Chen, Y.; Xue, C.J. DaTuM: Dynamic tone mapping technique for OLED display power saving based on video classification. In Proceedings of the 2015 52nd ACM/EDAC/IEEE Design Automation Conference (DAC), San Francisco, CA, USA, 8–12 June 2015; pp. 1–6. [Google Scholar]
  28. Drago, F.; Myszkowski, K.; Annen, T.; Chiba, N. Adaptive Logarithmic Mapping for Displaying High Contrast Scenes. Comput. Graph. Forum 2003, 22, 419–426. [Google Scholar] [CrossRef]
  29. Shiga, T.; Kitahara, S. Power Reduction of OLED Displays by Tone Mapping Based on Helmholtz-Kohlrausch Effect. IEICE Trans. Electron. 2017, E100.C, 1026–1030. [Google Scholar] [CrossRef]
  30. Anand, B. Adaptive Video Content Manipulation for OLED Display Power Management. In Proceedings of the 15th EAI In-ternational Conference on Mobile and Ubiquitous Systems: Computing, Networking and Services, New York, NY, USA, 5–7 November 2018; pp. 236–245. [Google Scholar]
  31. Samsung Galaxy S3. Available online: http://www.gsmarena.com/sam-sung_i9305_galaxy_s_iii-5001.php (accessed on 30 August 2017).
  32. Yeganeh, H.; Wang, Z. Objective Quality Assessment of Tone-Mapped Images. IEEE Trans. Image Process. 2012, 22, 657–667. [Google Scholar] [CrossRef] [PubMed]
  33. Badamchizadeh, M.A.; Aghagolzadeh, A. Comparative study of unsharp masking methods for image enhancement. In Proceedings of the Third International Conference on Image and Graphics, Hong Kong, China, 18–20 December 2004; pp. 27–30. [Google Scholar]
  34. Gill, J.; Girdhar, A.; Singh, T. A Review of Enhancement and Segmentation Techniques for Digital Images. Int. J. Image Graph. 2019, 19. [Google Scholar] [CrossRef]
  35. Fisher, B.; Perkins, S.; Walker, A.; Wolfart, E. Laplacian/Laplacian of Gaussian. In Hypermedia Image Processing Reference; Department of Artificial Intelligence, University of Edinburgh: Edinburgh, UK, 2001. [Google Scholar]
  36. Marr, D.; Hildreth, E. Theory of edge detection. Proc. R. Soc. Lond. Ser. B 1980, 207, 187–217. [Google Scholar]
  37. Ansari, M.A.; Kurchaniya, D.; Dixit, M. A Comprehensive Analysis of Image Edge Detection Techniques. Int. J. Multimedia Ubiquitous Eng. 2017, 12, 1–12. [Google Scholar] [CrossRef]
  38. Neycenssac, F. Contrast Enhancement using the Laplacian-of-a-GaussianFilter. CVGIP Graph. Models Image Process. 1993, 55, 447–463. [Google Scholar] [CrossRef]
  39. Krasula, L.; Narwaria, M.; Fliegel, K.; Le Callet, P. Influence of HDR reference on observers preference in tone-mapped images evaluation. In Proceedings of the 2015 Seventh International Workshop on Quality of Multimedia Experience (QoMEX), Messinia, Greece, 26–29 May 2015; pp. 1–6. [Google Scholar] [CrossRef]
  40. Hiromi, N. Visual attention in LDR and HDR images. In Proceedings of the 9th International Workshop on Video Processing and Quality Metrics for Consumer Electronics (VPQM), Chandler, AZ, USA, 5–6 February 2015. [Google Scholar]
  41. Monsoon Solutions Inc. Available online: http://www.msoon.com/LabEquipment/PowerMonitor/ (accessed on 30 August 2017).
  42. Sheikh, L.C.H.R.; Wang, Z.; Bovik, A.C. Live Image Quality Assessment Database Release 2. Available online: http://live.ece.utexas.edu/ (accessed on 12 February 2020).
  43. McCamy, C.S.; Marcus, H.; Davidson, J.G. A Color-Rendition Chart. J. Appl. Photogr. Eng. 1976, 2, 95–99. [Google Scholar]
  44. Display Color Analyzer CA-410—Konica Minolta. Available online: https://www.konicaminolta.com/instruments/download/instruction_manual/display/pdf/ca-410_instruction_probe-software_eng.pdf (accessed on 24 April 2021).
Figure 1. Comparison of different tone-mapped images with different supply voltages (brightness) of an AMOLED panel: (a) original tone-mapped image with the best MOS value, avg. luma = 117.3, brightness = 200; (b) Reinhard global TMO, avg. luma = 142.9, brightness = 100, power saving = 27.3%; (c) Reinhard local TMO, avg. luma = 144.3, brightness = 100, power saving = 25.9%; (d) Reinhard global TMO + unsharp masking, avg. luma = 143.1, brightness = 100, power saving = 25.1%; (el) are locally cropped enlargements of (ad).
Electronics 10 01015 g001
Figure 2. Comparison of before and after unsharp masking. (a) Modified Reinhard TMO; (b) modified Reinhard TMO + unsharp masking.
Electronics 10 01015 g002
Figure 3. Overall flow of the tone-mapping-aware DVS scheme.
Electronics 10 01015 g003
Figure 4. Overview of experimental setup.
Electronics 10 01015 g004
Figure 5. Comparison of normal mode, LGC-DVS and proposed method: (a,d,g,j) normal mode (display backlight = 200); (b,e,h,k) LGC-DVS; (c,f,i,l) proposed method. (a) Average luma: 86.97; (b) average luma: 87.89 display power saving: 36.21%; (c) average luma: 114.11, display power saving: 37.13%; (d) average luma: 125.78; (e) average luma: 125.13, display power saving: 54.70%; (f) average luma: 148.20, display power saving: 46.32%; (g) average luma: 150.6; (h) average luma: 151.23, display power saving: 52.33%; (i) average luma: 175.32, display power saving: 45.19%; (j) average luma: 133.98; (k) average luma: 134.58, display power saving: 53.52%; (l) average luma: 162.61, display power saving: 42.73%.
Electronics 10 01015 g005
Figure 6. Macbeth chart for color distance between colors of normal mode and colors of proposed method.
Electronics 10 01015 g006
Table 1. Comparison of execution times of Reinhard TMOs without and with UM (unsharp masking) (unit: s).
Image
Database
Reinhard Local TMOReinhard
Global TMO
Reinhard Global TMO + UM
15 images [30]14.360.831.40
10 images [35]9.080.540.97
Avg.0.940.050.09
Table 2. Comparison of power consumption and power-saving ratio.
NormalLGC-DVSProposed Method
Power (mW)Power (mW)Power
Saving (%)
Power (mW)Power
Saving (%)
TMO images295.89151.8445.51174.2937.66
LDR images251.69134.7544.21148.9137.20
Avg.269.38141.5944.73159.0737.38
Publisher’s Note: MDPI stays neutral with regard to jurisdictional claims in published maps and institutional affiliations.

