Article

Surveillance System in Smart Cities: A Dependability Evaluation Based on Stochastic Models

1
Computer Science Department, Ponto Focal Universidade Federal do Piauí (UFPI), Teresina, PI 64049-550, Brazil
2
Konkuk Aerospace Design-Airworthiness Research Institute (KADA), Konkuk University, Seoul 05029, Korea
3
Department of Computer Science and Engineering, College of Engineering, Konkuk University, Seoul 05029, Korea
4
Department of Aerospace Engineering, Konkuk University, Seoul 05029, Korea
*
Author to whom correspondence should be addressed.
Electronics 2021, 10(8), 876; https://doi.org/10.3390/electronics10080876
Submission received: 10 February 2021 / Revised: 22 March 2021 / Accepted: 29 March 2021 / Published: 7 April 2021
(This article belongs to the Special Issue Dependable Internet of Things and Detection)

Abstract

:
Surveillance monitoring systems are highly necessary, aiming to prevent many social problems in smart cities. The internet of things (IoT) nowadays offers a variety of technologies to capture and process massive and heterogeneous data. Due to the fact that (i) advanced analyses of video streams are performed on powerful recording devices; while (ii) surveillance monitoring services require high availability levels in the way that the service must remain connected, for example, to a connection network that offers higher speed than conventional connections; and that (iii) the trust-worthy dependability of a surveillance system depends on various factors, it is not easy to identify which components/devices in a system architecture have the most impact on the dependability for a specific surveillance system in smart cities. In this paper, we developed stochastic Petri net models for a surveillance monitoring system with regard to varying several parameters to obtain the highest dependability. Two main metrics of interest in the dependability of a surveillance system including reliability and availability were analyzed in a comprehensive manner. The analysis results show that the variation in the number of long-term evolution (LTE)-based stations contributes to a number of nines (#9s) increase in availability. The obtained results show that the variation of the mean time to failure (MTTF) of surveillance cameras exposes a high impact on the reliability of the system. The findings of this work have the potential of assisting system architects in planning more optimized systems in this field based on the proposed models.

1. Introduction

The Internet of Things (IoT) is a communication paradigm that aims to make day-to-day technologies even more immersive and widespread. IoT facilitates access and interaction with several devices, such as surveillance cameras, monitoring sensors, vehicles, and smartphones. IoT seeks to provide new services to citizens, companies, and public administrations by analyzing large masses of data. Cities are becoming increasingly responsive and intelligent [1]. IoT is present in large cities, making them more automated and technological, the so-called smart cities. The smart city is committed to investing in the quality of life and economic development of people [2]. Amsterdam is an example of a well-connected smart city reaping the rewards of opening the data vault. The city shares traffic and transportation data with interested parties, such as developers, who then create mapping apps that connect to the city’s transport systems [3]. In Palo Alto, there are several projects in health, Vehicular ad hoc networks (VANETs) and surveillance monitoring systems.
Smart cities adopt CCTV-based surveillance monitoring systems to provide public services and ensure the safety and security of citizens, e.g., crime prevention and response, forensic evidence. These applications are key drivers when running smart city projects, helping authorities to proactively spot and react to potential incidents across the city. Specifically, surveillance monitoring systems have several important features for a smart city. These features include facial recognition, motion detection, and activities monitoring that minimize the chances of disasters. However, the integration of automated analysis in video surveillance is an area that can be further explored [4], especially concerning the connectivity of equipment in the security sector. In the security sector, there is still a reliance on the traditional manual monitoring of CCTV (closed circuit television) images [4].
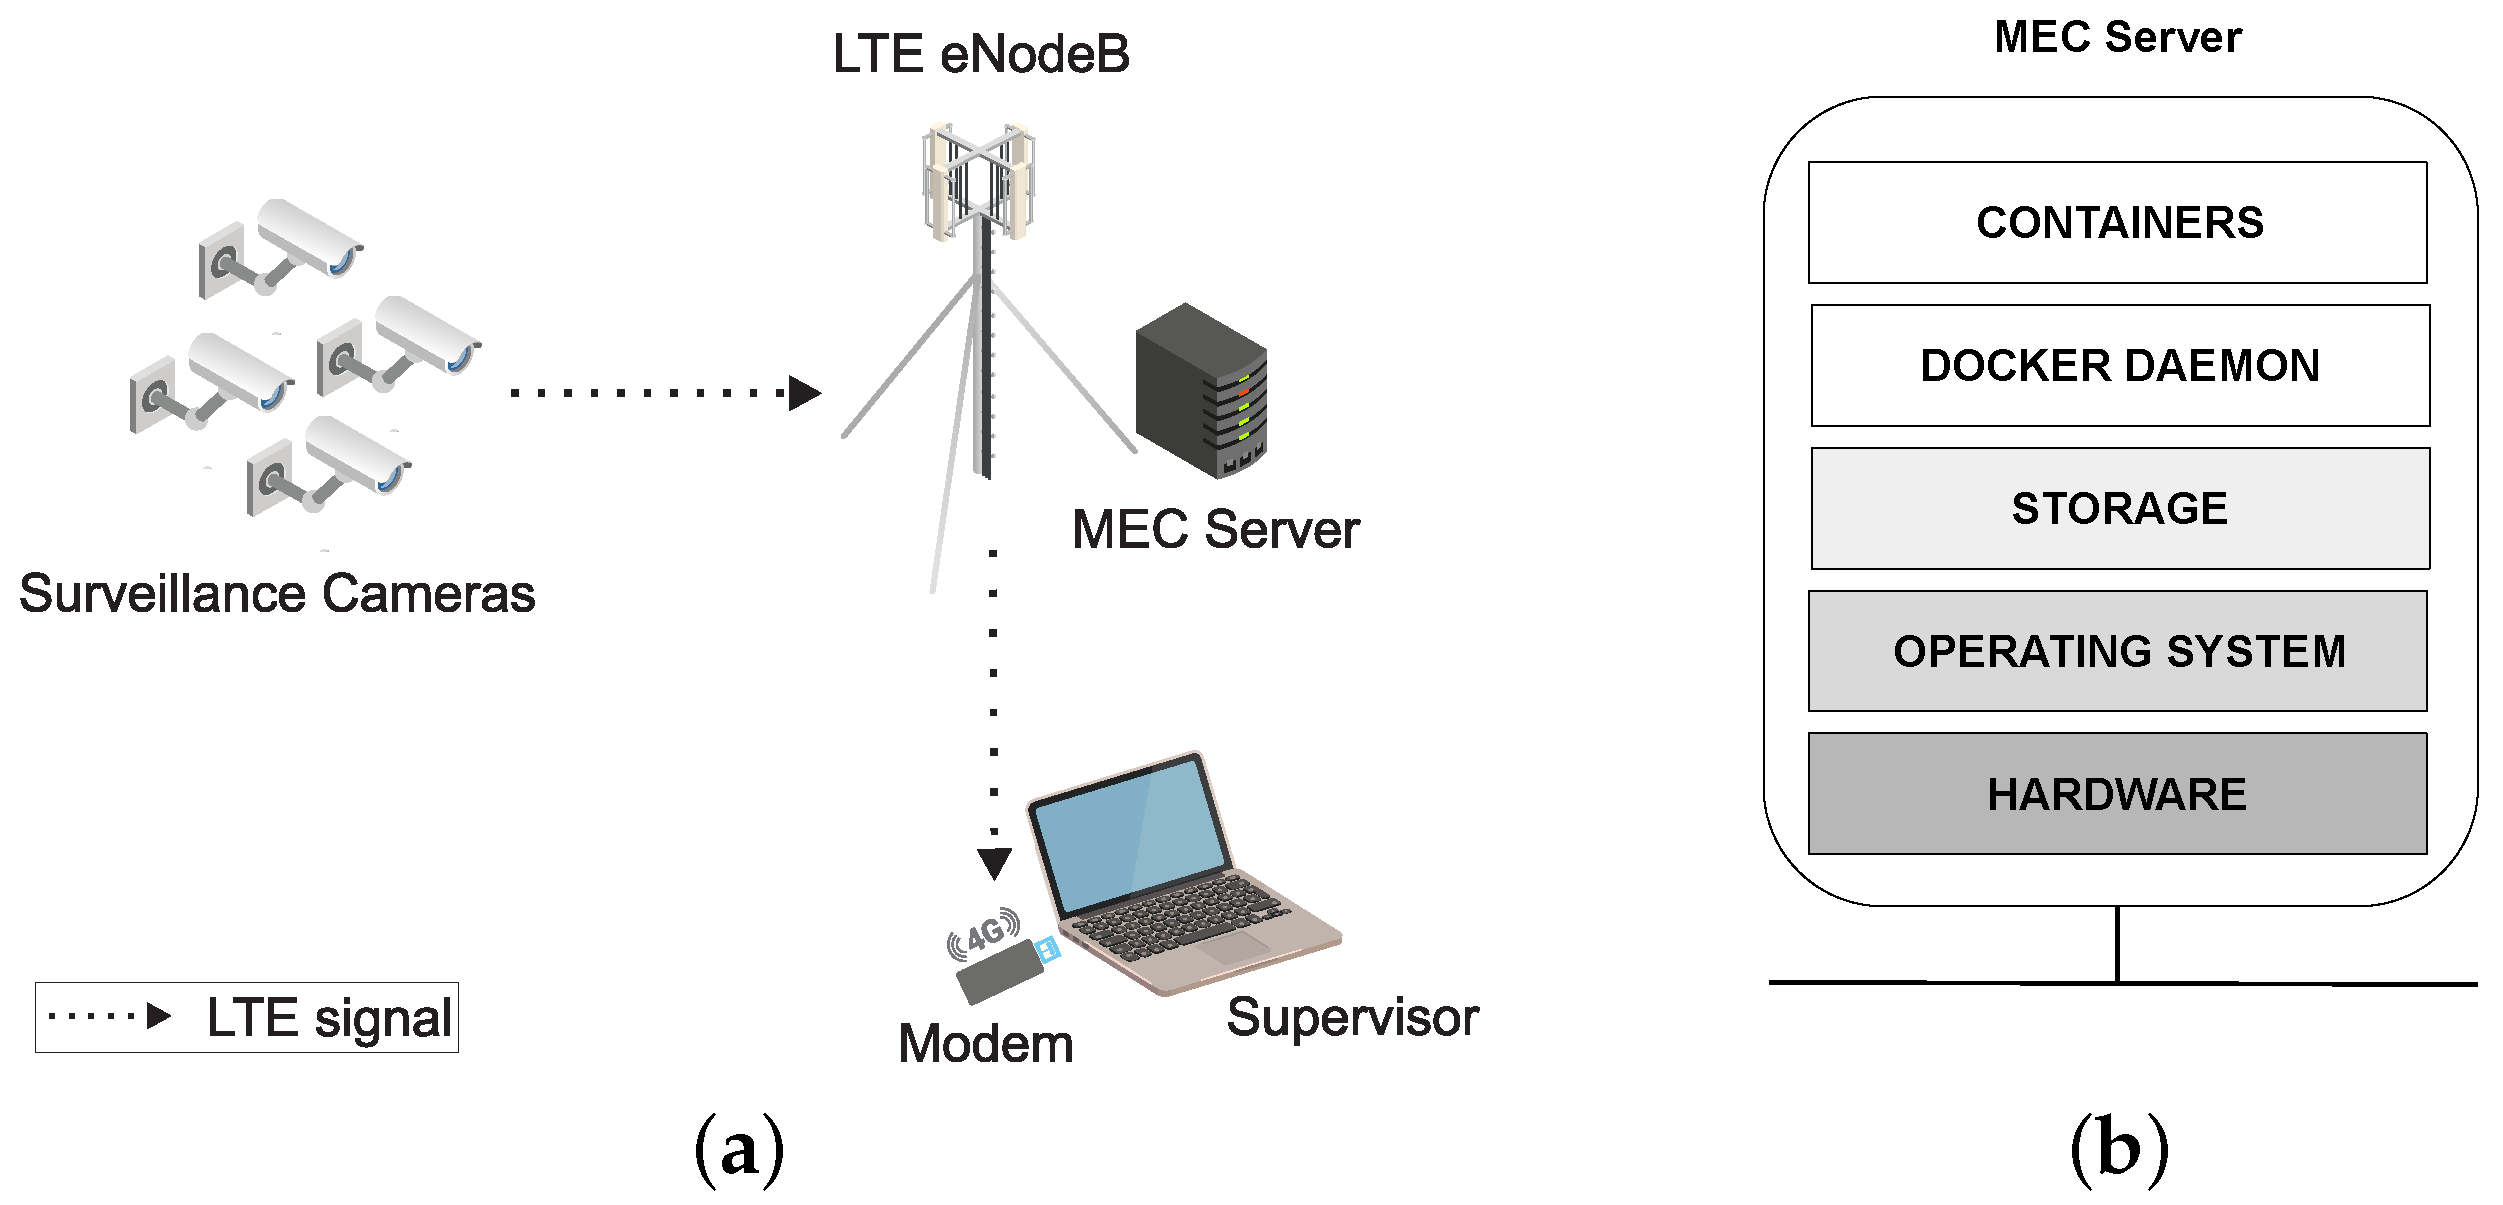
CCTV consists of cameras distributed and connected to a central system, which makes images available through monitors. The connection of the CCTV components is carried out by cabling. The cable connection may make it impossible to monitor a specific area of smart cities. This way, as solutions to bandwidth and quality of service (QoS) problems, the connection between CCTV components can be wireless, reducing costs and expanding monitoring sectors with high quality. Long-term evolution (LTE) technology is an alternative to providing wireless communication. 5G technology has been gaining ground in telecommunications for the same purpose, but it is still not widespread worldwide. With LTE technology, the CCTV system may have inaccuracies that compromise the service that must be provided in real time. Therefore, evaluating these applications becomes relevant even before a practical implementation in many aspects. In this context, analytical models can be used to evaluate systems during design stages [5,6]. Most of the previous work that adopted analytical models have only focused on the assessment of performance metrics [7,8,9,10,11,12,13,14]. However, availability and reliability metrics are essential system requirements in this scenario to guarantee a certain level of quality of service (QoS). Wahab et al. in [15] proposed a three-fold solution to improve the dependability of multi-cloud systems. The authors proposed a trust establishment framework that is resilient to collusion attacks that occur to mislead trust results. A bootstrapping mechanism was also proposed, which capitalizes on the endorsement concept in online social networks to assign initial trust values. The authors also proposed a trust-based hedonic coalition game that enabled services to distributively form trustworthy multi-cloud communities. Experiments conducted on a real-life dataset demonstrated that their model minimizes the number of malicious services compared to three state-of-the-art cloud federations and service communities models. Lockl et al. in [16] have developed and evaluated a block-chain-based IoT sensor data logging and monitoring system, employing a design science research (DSR) approach. The authors have shown that such systems should provide modality, data parsimony, and availability in addition to domain-specific principles. The proposed prototype improved data integrity and availability but uncovered challenges like high operating costs through smart contract computation fees. Although these are important papers in the fields of cloud computing and IoT, respectively, these studies present a different focus compared to our work (surveillance was not taken into consideration) in terms of architecture and goals. In addition, the authors did not consider reliability as a major metric. Furthermore, designing a surveillance system with uncompromising constraints of high reliability/availability and high processing capacity is challenging in planning for the development of smart cities. Due to the partial failures of several components, the operational services of a surveillance system are probably not offered perfectly even when the system is available in terms of physical resources. In this context, capacity-oriented availability (COA) was used to estimate the information [17] of system availability based on its capacity of available components.
In this paper, we proposed stochastic Petri net (SPN) models [18,19] to represent and evaluate the dependability (availability and reliability) of surveillance monitoring systems in smart cities. SPN models were proposed by researchers active in the applied stochastic modeling field, with the goal of developing a tool which allowed the integration of formal description, proof of correctness, and performance evaluation. For what concerns the last aspect, the proposals aimed at an equivalence between SPN and continuous time Markov chain (CTMC) models. This way, SPN is superior compared to CTMC in terms of intuitive representation capabilities. SPN can be used to model any complex systems because it can model, for example, process synchronization and parallelism. The SPN models are based on a CCTV architecture, using LTE connection, and a server at the edge of the network (mobile edge computing—MEC).
Therefore, the main contributions of this paper are:
  • An SPN model to assess the availability of a CCTV monitoring system in smart cities. The proposed model enables the configuration of a significant number of parameters, including 16 transitions corresponding to mean times to failure (MTTFs) and repair (MTTRs).In addition, the model is highly scalable in terms of the number of cameras and radio stations.
  • An SPN model to assess the reliability of a CCTV system. The reliability model, in turn, presents nine configurable transitions, with the aforementioned advantages of the availability model, but also the capability of calculating the reliability in different scenarios over time.
  • A set of sensitivity analyses on the model’s components to identify those that most impact the metrics of interest. Sensitivity analysis showed that specific components have a more significant impact on availability. To reinforce the sensitivity analysis results, we used the design of experiment (DoE) method. The DoE made it possible to visualize more precisely the impact of the MTTF and MTTR values of each component on the availability of the system.
  • Case studies that serve as guides for how evaluators can use the proposed models, adopting the COA metric, for example. Capacity-oriented availability (COA) assesses how the system is delivered, therefore, it does not consider only the states of availability or unavailability, but the real impact of these factors in service delivery.
The rest of the paper is organized as follows. We mention some related works in Section 2. The overall architecture of a surveillance monitoring system in smart cities is detailed in Section 3. Reliability modeling and assessment is presented in Section 4. In Section 5, we develop availability models and perform various availability analyses. Case-studies of the surveillance monitoring system are presented for availability assessment in Section 6. The paper is concluded in Section 7.

2. Related Work

This section presents some related works. These works include an evaluation of a system that uses the idea of a base station with 4G or 5G and developed analytical models for such evaluation. Table 1 summarizes a comparison of related works under four aspects: model type; metrics; communication type; and sensitivity analysis.
The first criterion refers to the type of model. All previous works in consideration used Markov chains as a common analytical modeling approach to evaluate their proposals. In [20], the Markov chain was used in modeling to meet the best up-link while in [10], a Markov chain model was used in a proposal to perform evaluations on different performance metrics, in which the sizing of the system elements can be analyzed. The papers [7,8] used the Markov chain to evaluate the femtocells connections aiming to reduce latency and improve performance in wireless networks. However, no papers have used Petri nets. Instead of SPN, the use of Markov chains is not a limitation, since both models are equivalent, but SPN has a higher power of abstraction.
Concerning the metrics, the majority of works opted for performance evaluation. Some papers [12,14,20] presented innovative proposals for 5G. In [13], for example, the 5G network was studied in a compensation strategy between energy consumption and the additional delay incurred for user traffic. Markkula and Haapola in [11] addressed a performance evaluation using 4G. Only the work [20] used the reliability metric to investigate the problem of cooperative re-transmission and the ideal number of devices directly connected to the LTE base station. However, none of the studies explored the metrics of availability and downtime.
Type of communication corresponds to the use of which generation of communication technology was adopted. More recent articles show studies focused on 5G. The less recent articles show studies focused on 4G. In [12], 5G communication was used for the study of cell failure detection in base stations, in which users could obtain mobile services that met their requirements. Cartney et al. [14] used 5G communication to describe a base station placement optimization, providing a detailed analysis of the performance. Markkulai et al. [11] used 4G communication to overcome problems related to the lack of connectivity of the base station. Our work used 4G technology since 5G technology has paradigms that are still being studied to be implemented in the future in many countries. However, it is important to highlight that our models are configurable enabling the use 5G parameters without issues. Finally, regarding sensitivity analysis, none of the related works explored such a strategy.

3. A Surveillance System in Smart Cities

3.1. System Architecture

Figure 1a presents the overall architecture of a surveillance system in smart cities that use an IoT-based video monitoring system. The videos were recorded by CCTV cameras installed in sensitive and/or pre-specified locations of the city. Each recording was stored together with the date, time, and place, making information essential for a real-time or future inspection. The supervision of these places allows us to identify individuals and unusual factors in the environment.
The architecture consists of an LTE network with cameras, a wireless base station, a MEC server, and a supervisor. The cameras were installed at strategic locations in the city based on prior planning by security professionals. Each camera had 4G transmission connected to a wireless base station. The wireless base station was responsible for collecting the images transmitted by the cameras and sent to the MEC server. The MEC allowed the storage of recordings and the management of live images and the facial recognition feature. A connection was made between the 4G modem and the wireless base station to gain access to the MEC. Any computer or notebook can be used as a supervisor to configure this LTE connection.
This architecture only had one wireless base station, however, using more cameras may require more wireless base stations. This wireless base station centralization may cause a bottleneck, as all transmissions pass through them. During peak data transmissions, negative impacts on system availability and reliability can be observed. The purpose of availability was to keep the system services available for as long as possible, being susceptible to failure. Reliability refers to the system’s ability to function correctly over time t.
As the MEC server has significant processing responsibility, it was studied in detail in terms of software layers. Figure 1b presents the layered architecture of the MEC server, comprising: hardware; operating system; storage; docker daemon; and containers. The top layer components depend on the bottom ones. The storage component is responsible for storing recordings. The docker daemon and container software components are responsible for managing live images.

3.2. Assessment Metrics

To comprehend and secure continuous operations of the safe and smart surveillance system in consideration, we performed various stochastic model-driven reliability and availability along with sensitivity analyses:
  • Reliability is the probability that a system, including all hardware, firmware, and software, will satisfactorily perform the task for which it was designed or intended, for a specified time and in a specified environment;
  • System availability (also known as equipment availability or asset availability) is a metric that measures the probability that a system is not failed or undergoing a repair action when it needs to be used;
  • Sensitivity analysis is a measure of the local effect of a given input data about the output data, aiming to outline the weak links of the computer systems, and from there on, seek to adopt a set of techniques that aim to improve these systems in different scenarios. In a way, the sensitivity analysis can provide the necessary security and forward the results within the perspective established by the system administrators. In this study, we adopted DoE for the sensitivity analysis. The DoE corresponds to a collection of statistical techniques that deepen the knowledge about the product or process under study [21]. It can also be defined by a series of tests in which the researcher changes the set of variables or input factors in order to observe and identify the reasons for changes in the output response. The parameters to be changed are defined using an experiment plan. The goal was to generate the most significant amount of information with the least possible experiments. The behavior of the system based on parameter changes can be observed using sets of outputs.

4. Reliability Assessment

This section presents an SPN model to assess the reliability of the surveillance system in smart cities.
Petri nets are a formal model of quantitative properties of concurrent and synchronized systems. Petri nets with random firing delays are considered as stochastic Petri nets (SPNs) [22,23,24,25,26]. Since the last decade, SPN has been enticing the researchers’ attention in the modeling and performance analysis of discrete event systems. SPNs are modeling tools for the performance analysis of parallel, concurrent, dynamic and distributed systems. The nature of temporal specification can be deterministic or probabilistic. Variable X as a stochastic process can be considered as a family of functions of time as sample paths of the events of process, formally defined as X ( t ) , t T , where T = [ 0 , ) . Each sample path denotes a particular trajectory over the state space and consists of a possible observed behavior of the process events.

4.1. Reliability SPN Model

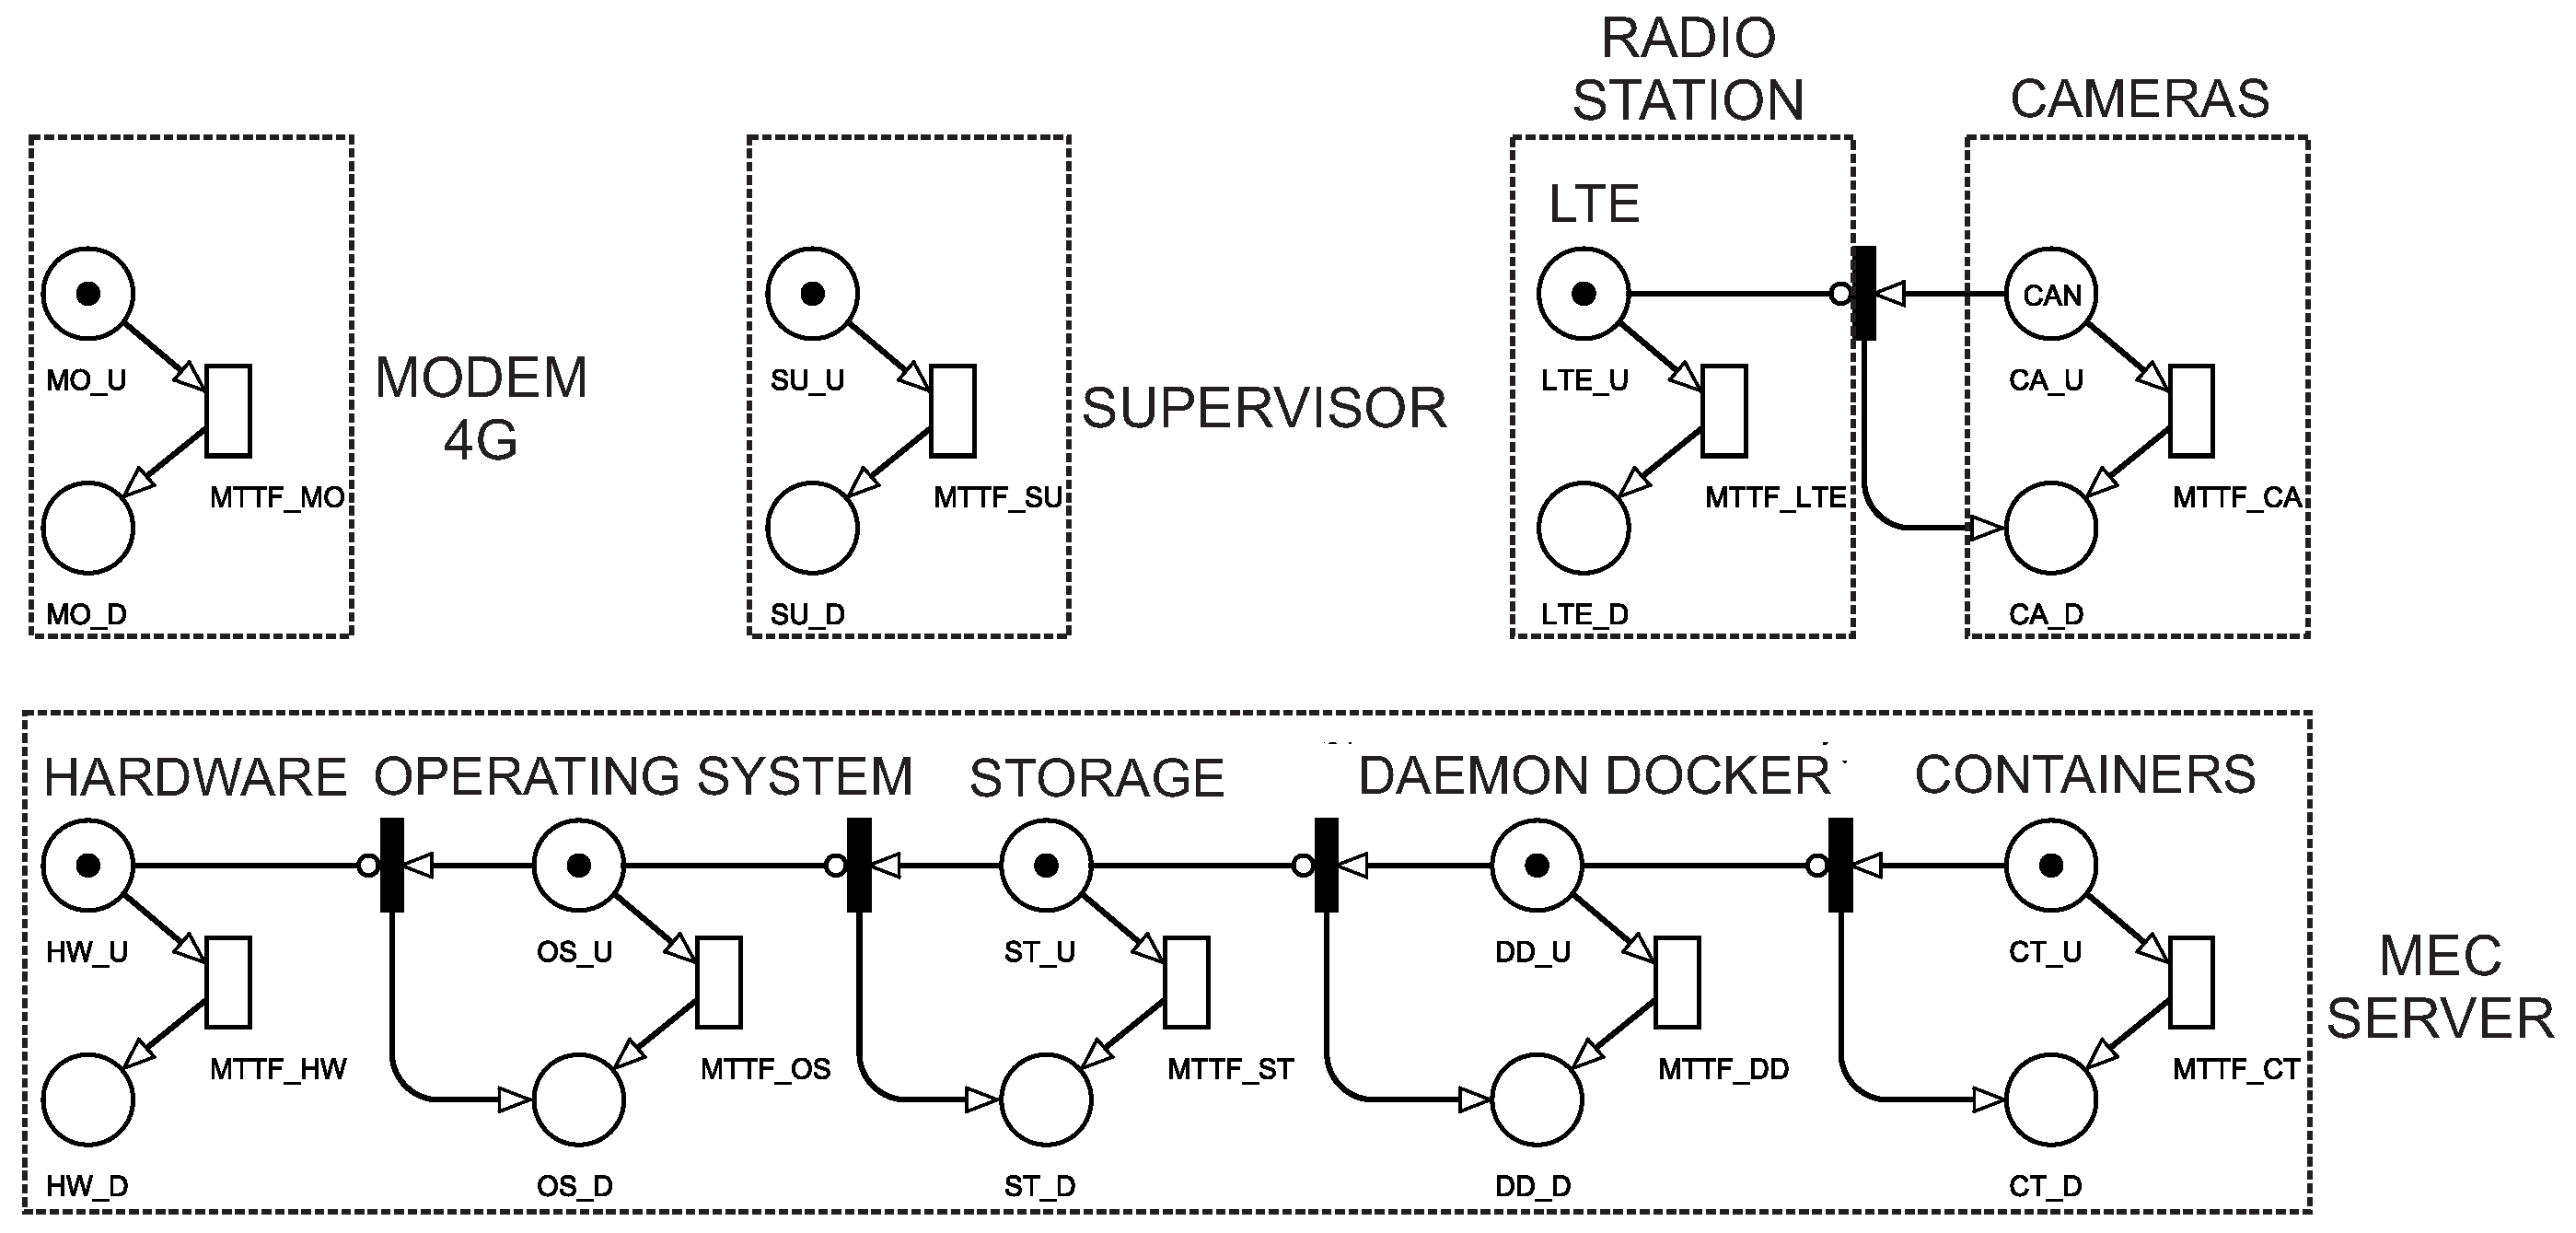
Figure 2 presents an SPN model that was used to assess the reliability of a surveillance system in smart cities. The SPN model was composed of supervisor (SU), 4G modem (MO), wireless based station (LTE), cameras (CA), and an MEC server. The MEC server has components with dependence; when a component fails, the immediate transitions will make the next components that depend on it fail as well. The MEC server is composed of: hardware (HW); operating system (OS); storage (ST); docker daemon (DD); and containers (CT). Each component has a MTTF. As reliability only considers system services until a failure occurs, it is not necessary to use MTTR. We will only estimate the time for which the system is up and running.
The 4G modem will be working when it has a token in place MO_U. The 4G modem is not working when it has a token in place MO_D. The modem goes into the inactive state by triggering the transition MTTF_MO. The supervisor is working when it has a token in place SU_U. The supervisor is not working when it has a token in place SU_D. The modem goes into the inactive state by triggering the transition MTTF_SU.
The MEC is composed of several components that depend on each other. When the hardware (HW) fails, all other components will also fail. The MEC is working when it has a token in CT_U (active container). If the container is working, all other components that make up the MEC will be working. We consider that the MEC is not working when it has a token in CT_D (inactive container).
For example, we consider that a wireless base station will be functioning when it has 10 tokens in the location CA_U (active cameras). We consider that a wireless base station is not working when it has one or more tokens at CA_D (cameras disabled). The equation for calculating the reliability of the system is given by
R = 1 P ( # M O _ D > 0 ) OR ( # S U _ D > 0 ) OR ( # C T _ D > 0 ) OR ( # C A _ D > 0 )
where P stands for probability and # stands for the number of tokens in a given location.
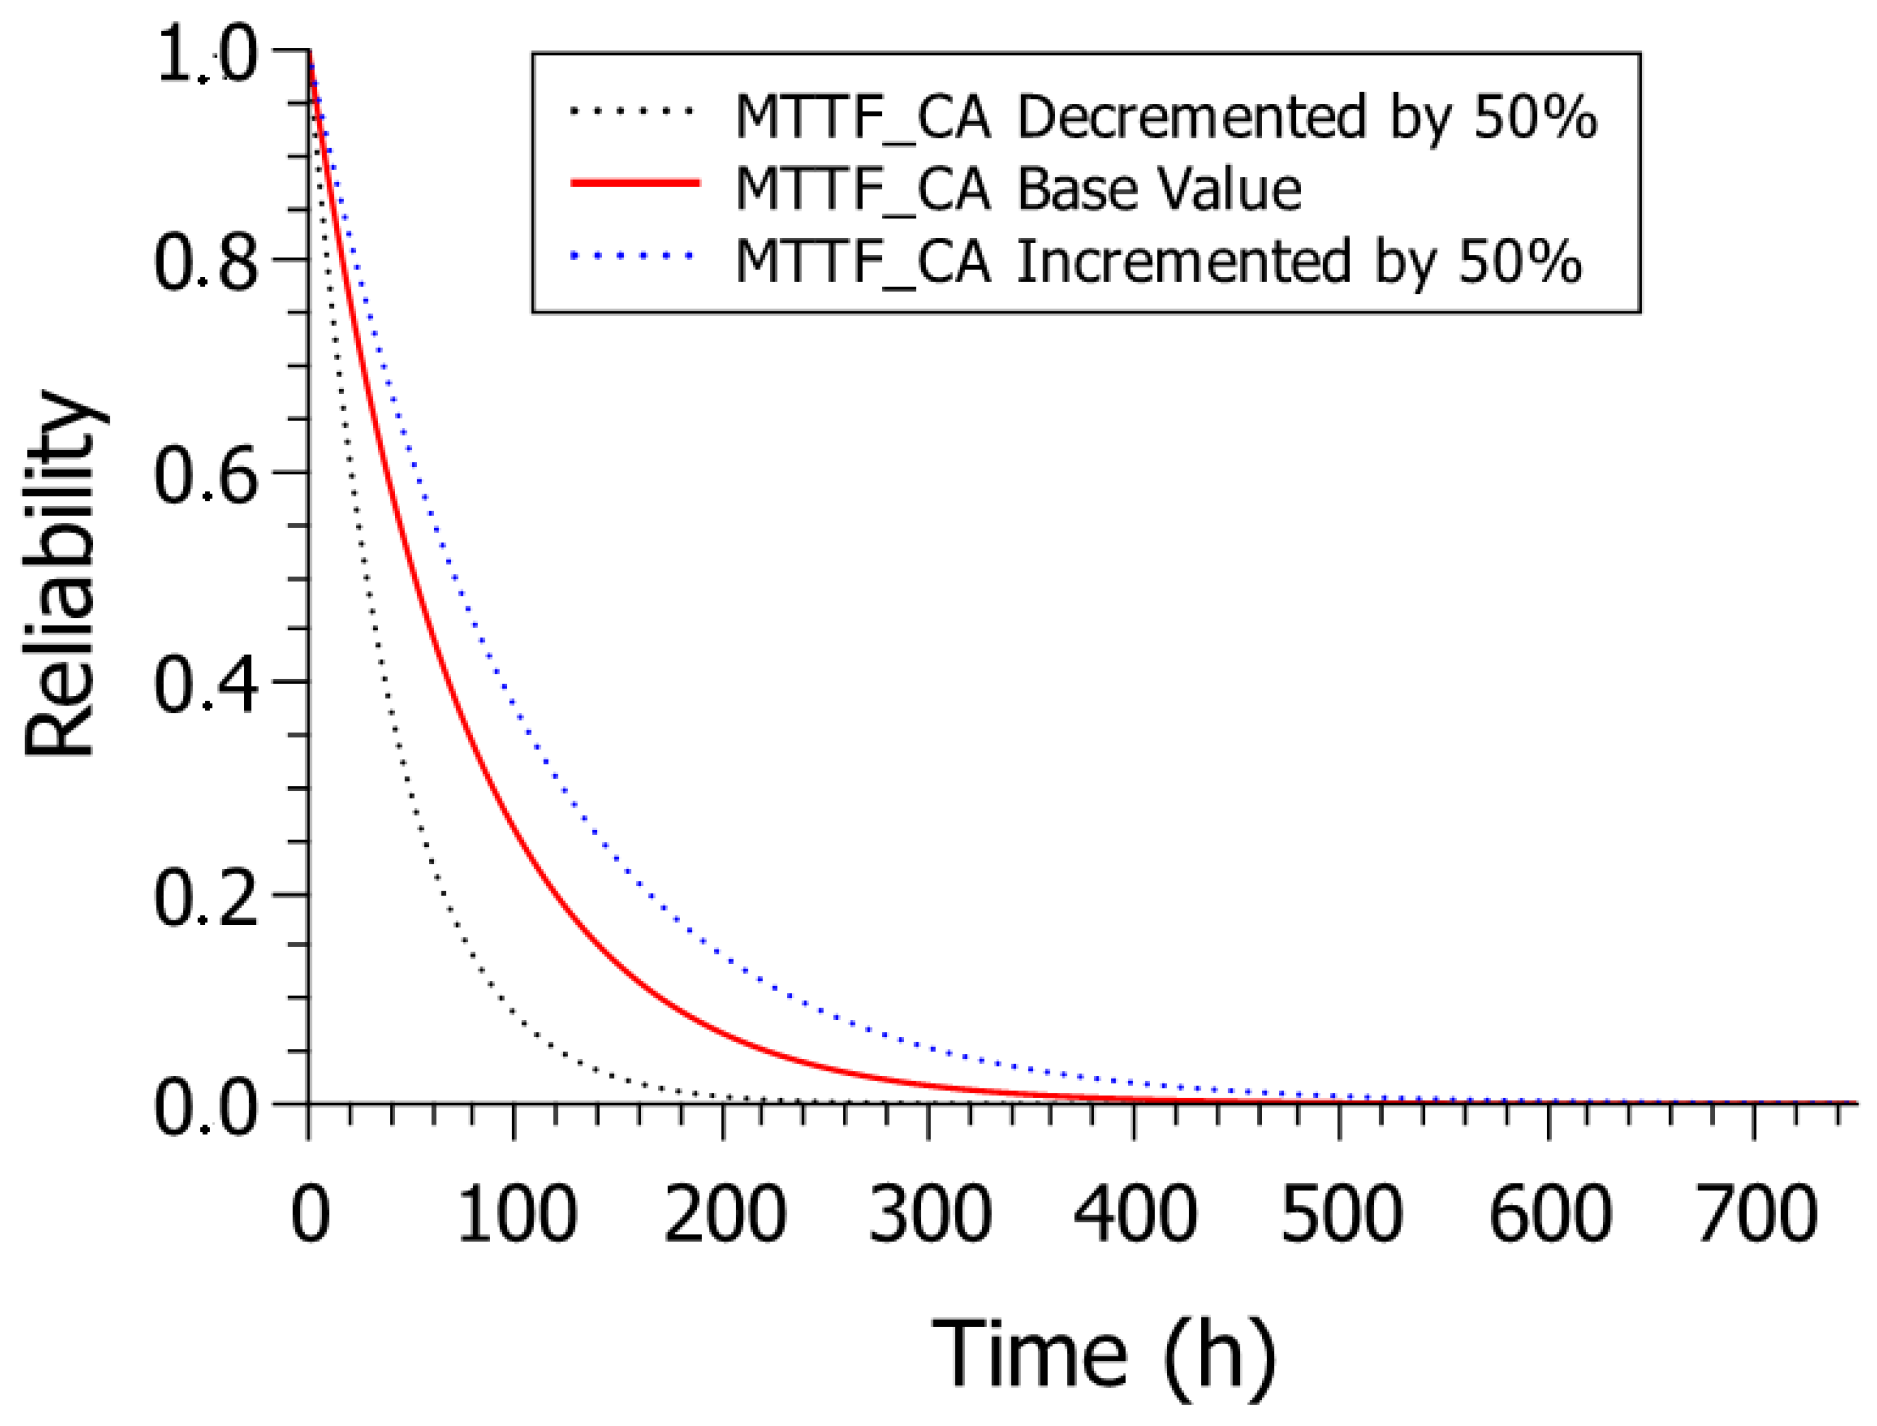
In DoE, the camera was the most critical component of the system. Therefore, the reliability assessment was performed by exploring the MTTF of the cameras.Three scenarios were explored using the base value for the cameras MTTF and two more variations—50% more and 50% less than the base value.

4.2. Reliability Evaluation Results

Some input parameters are needed to evaluate the proposed model. The values are the same as those used for the availability assessment listed in Table 7. However, a variation of the cameras MTTF is used to explore different scenarios. Table 2 shows the input parameters.
Figure 3 presents the result of the reliability analysis for the different scenarios explored. Initially, for a low service time, the reliability of the system is 100%. However, as time increases, the reliability decreases. With the value of MTTF_CA using less 50% of the base value, the model obtained the lowest reliability, which presents approximately 0% reliability after 250 h of service. With the base value of MTTF_CA, the model showed more excellent reliability than the scenario with MTTF_CA using less than 50% of the base value, presenting approximately 0% reliability just after 390 h of operation. The most satisfactory result was obtained by MTTF_CA using an additional 50% of the base value, where the model showed approximately 0% reliability only after 540 h of service.

5. Availability Assessment

This section presents an SPN model to assess the availability of a surveillance system in smart cities. The model was developed when considering the recovery of system components in the reliability model in Figure 2 as a solution to improve the quality of service for the surveillance monitoring system.

5.1. Availability SPN Model

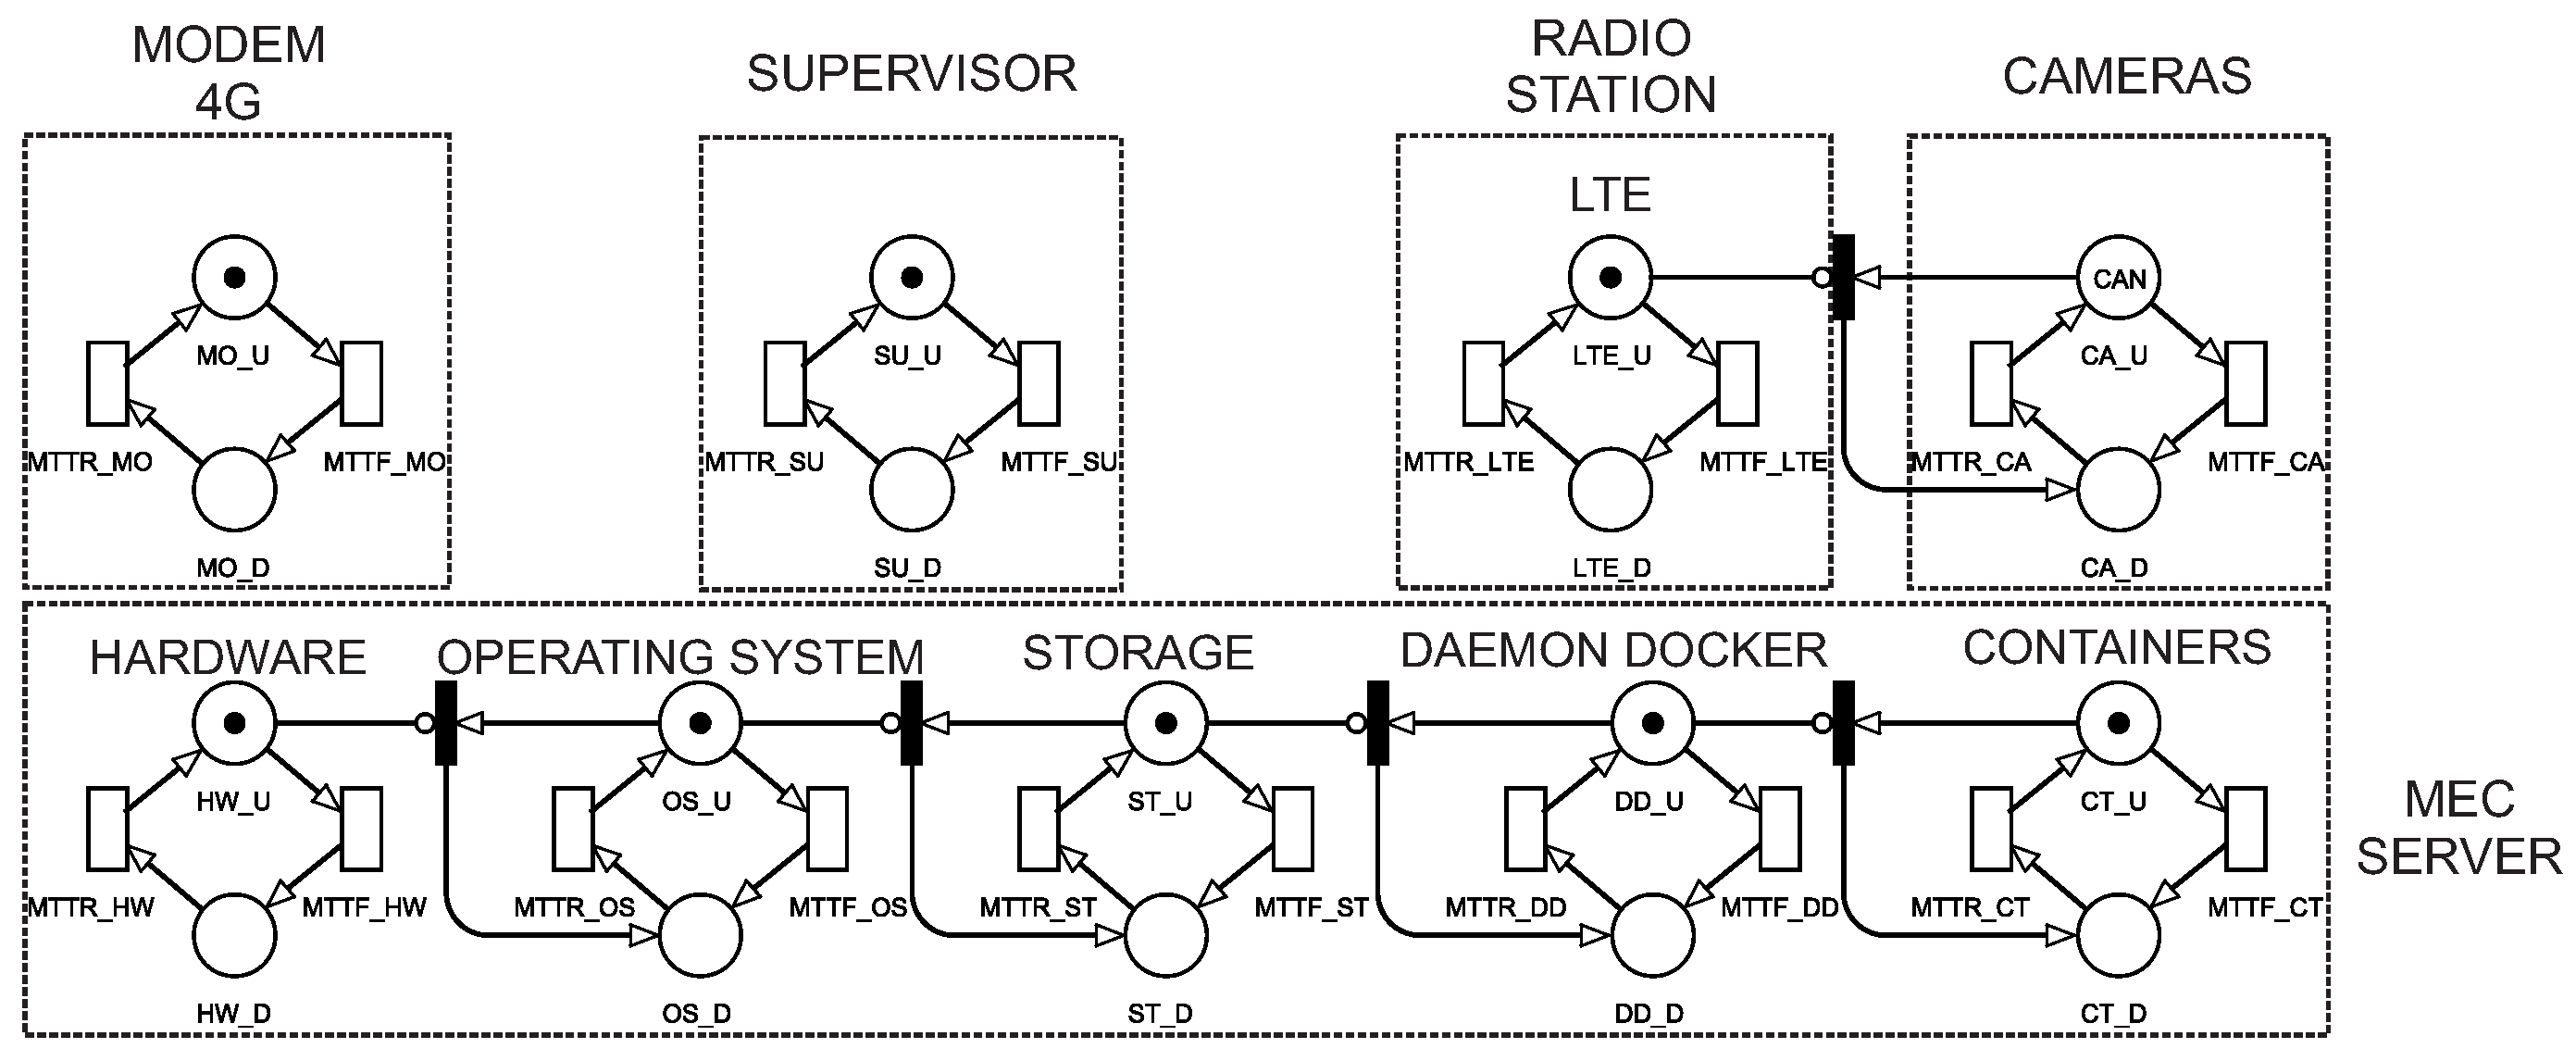
Figure 4 presents a model consisting of a supervisor (S), 4G modem (MO), a wireless base station (LTE), cameras (CA), and an MEC server. The MEC server is composed of several components that depend on each other. When a component fails, the immediate transitions will cause the next components that directly or indirectly depend on it to fail as well. The components that make up the MEC are the hardware (HW); operating system (OS); storage (ST); docker daemon (DD); and containers (CT). The wireless base station, with its proper cameras, also established a dependency. If the wireless base station fails, the cameras will also stop working.
Each component has an MTTF (mean time to failure) and a MTTR (mean time to repair). The 4G modem will be working when it has a token in place MO_U (4G modem up). We considered that the 4G modem was not working, when it had a token in place MO_D (4G modem down). The active/inactive changes were caused by the transitions triggering: MTTF_MO and MTTR_MO. The supervisor was working when it had a token in place SU_U (supervisor up). We considered that the supervisor was not working when it had a token in SU_D (supervisor down). The active/inactive changes were caused by the triggering of the transitions MTTF_SU and MTTR_SU.
The MEC server will be working when it has a token in CT_U (container up). We considered that the MEC was not working when it had a token in one of the following places: HW_D (hardware down); OS_D (operating system down); ST_D (storage down); DD_D (docker daemon down); CT_D (container down). Only one component of the MEC server needs to fail for it to stop working; this is due to the dependency already mentioned. The change between the active and inactive state is caused by the transitions: MTTF_HW, MTTF_OS, MTTF_ST, MTTF_DD and MTTF_CT—for mean time to failure—and MTTR_HW, MTTR_OS, MTTR_ST, MTTR_DD and MTTR_CT—for mean time to repair.
We considered that a wireless base station was working when it had a token in place CA_U (cameras up). We considered that a wireless base station was not working when it had a token in the locations: LTE_D (wireless base station down) and CA_D (cameras down). The change between the active and inactive state was caused by the transitions: MTTF_LTE, MTTF_CA—for mean time to failure—and MTTR_LTE, MTTR_CA—for mean time to repair.
Table 3 shows the guard conditions used for the system’s operation. Guard conditions are used in transitions to ensure that they are only triggered with a specific condition, preserving behaviors that occur in real life. For example, the transition MTTR_OS has the following guard condition: P { # H W _ U > 0 } , meaning that to trigger the recovery transition of the operating system, the hardware must be active. In other words, the solution to a failure in an operating system can only occur if the hardware is turned on. However, the guard condition ensures that the model retains behaviors that occur in real contexts.
The availability metric was explored for this model. The availability equation represents all the probabilities of the number of tokens in the system’s constituent components’ upstate. Thus, P stands for probability, and # stands for the number of tokens in a given location. Some components depend on others being active, so we only used the last components of the dependency sequences in the availability metric. For the availability metric, we only used the container (CT) of the MEC Server because for the container to be working, all the MEC server components must be active. For a radio station to be working, all that is required is for its own cameras (CA) to be active. Equation (2) represents the condition described above:
A = P { ( # C T _ U > 0 ) A N D ( # S _ U > 0 ) A N D ( # M O _ U > 0 ) A N D ( # C A _ U = C A N 1 ) }

5.2. Sensitivity Analysis

This section presents two sensitivity analyses on the model’s factors. The objective was to identify the factors that most impact the availability of the system. First, an analysis based on the percentage difference technique was performed [27,28]. Then, we present a second complementary analysis based on the DoE technique [29].

5.2.1. Sensitivity Analysis of Transitions with Percent Difference

For the sensitivity analysis, the model’s MTTF and MTTR times were used as parameters varying them 50% more and less over the base value. Thus, Table 4 presents, in decreasing order, the transitions with the highest sensitivity indices—that is, those that have the most significant impact on the availability of the system.
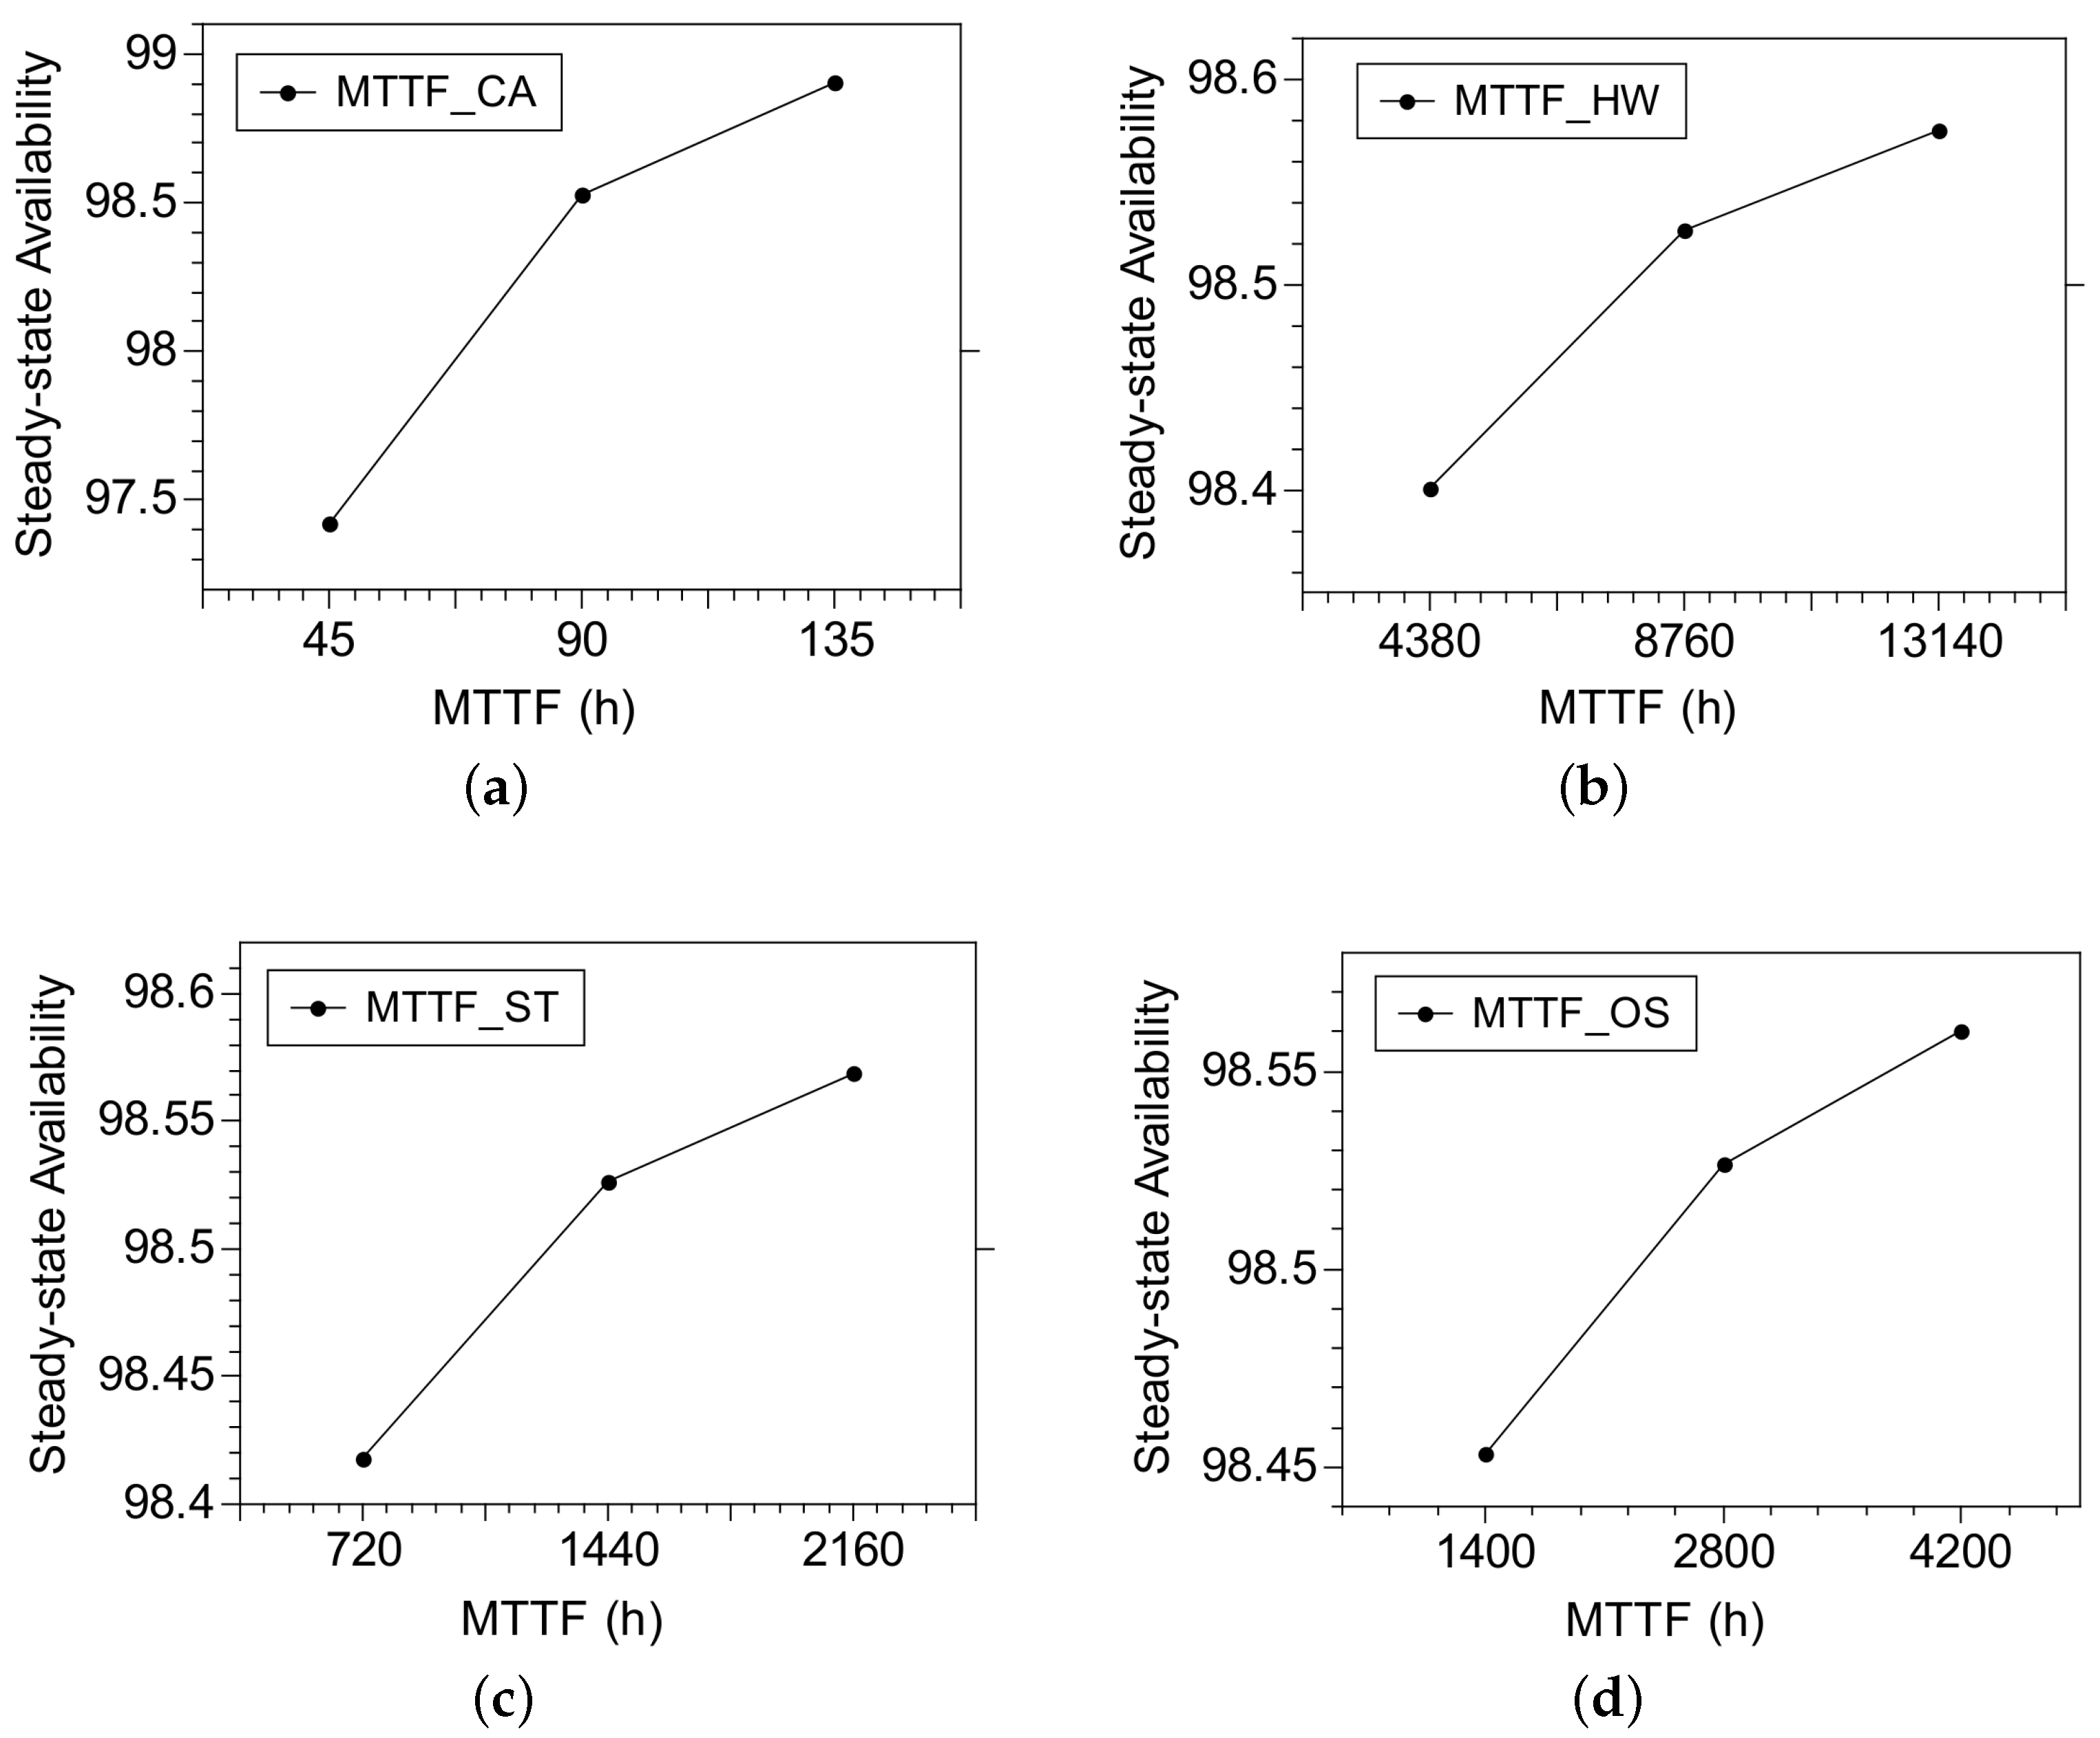
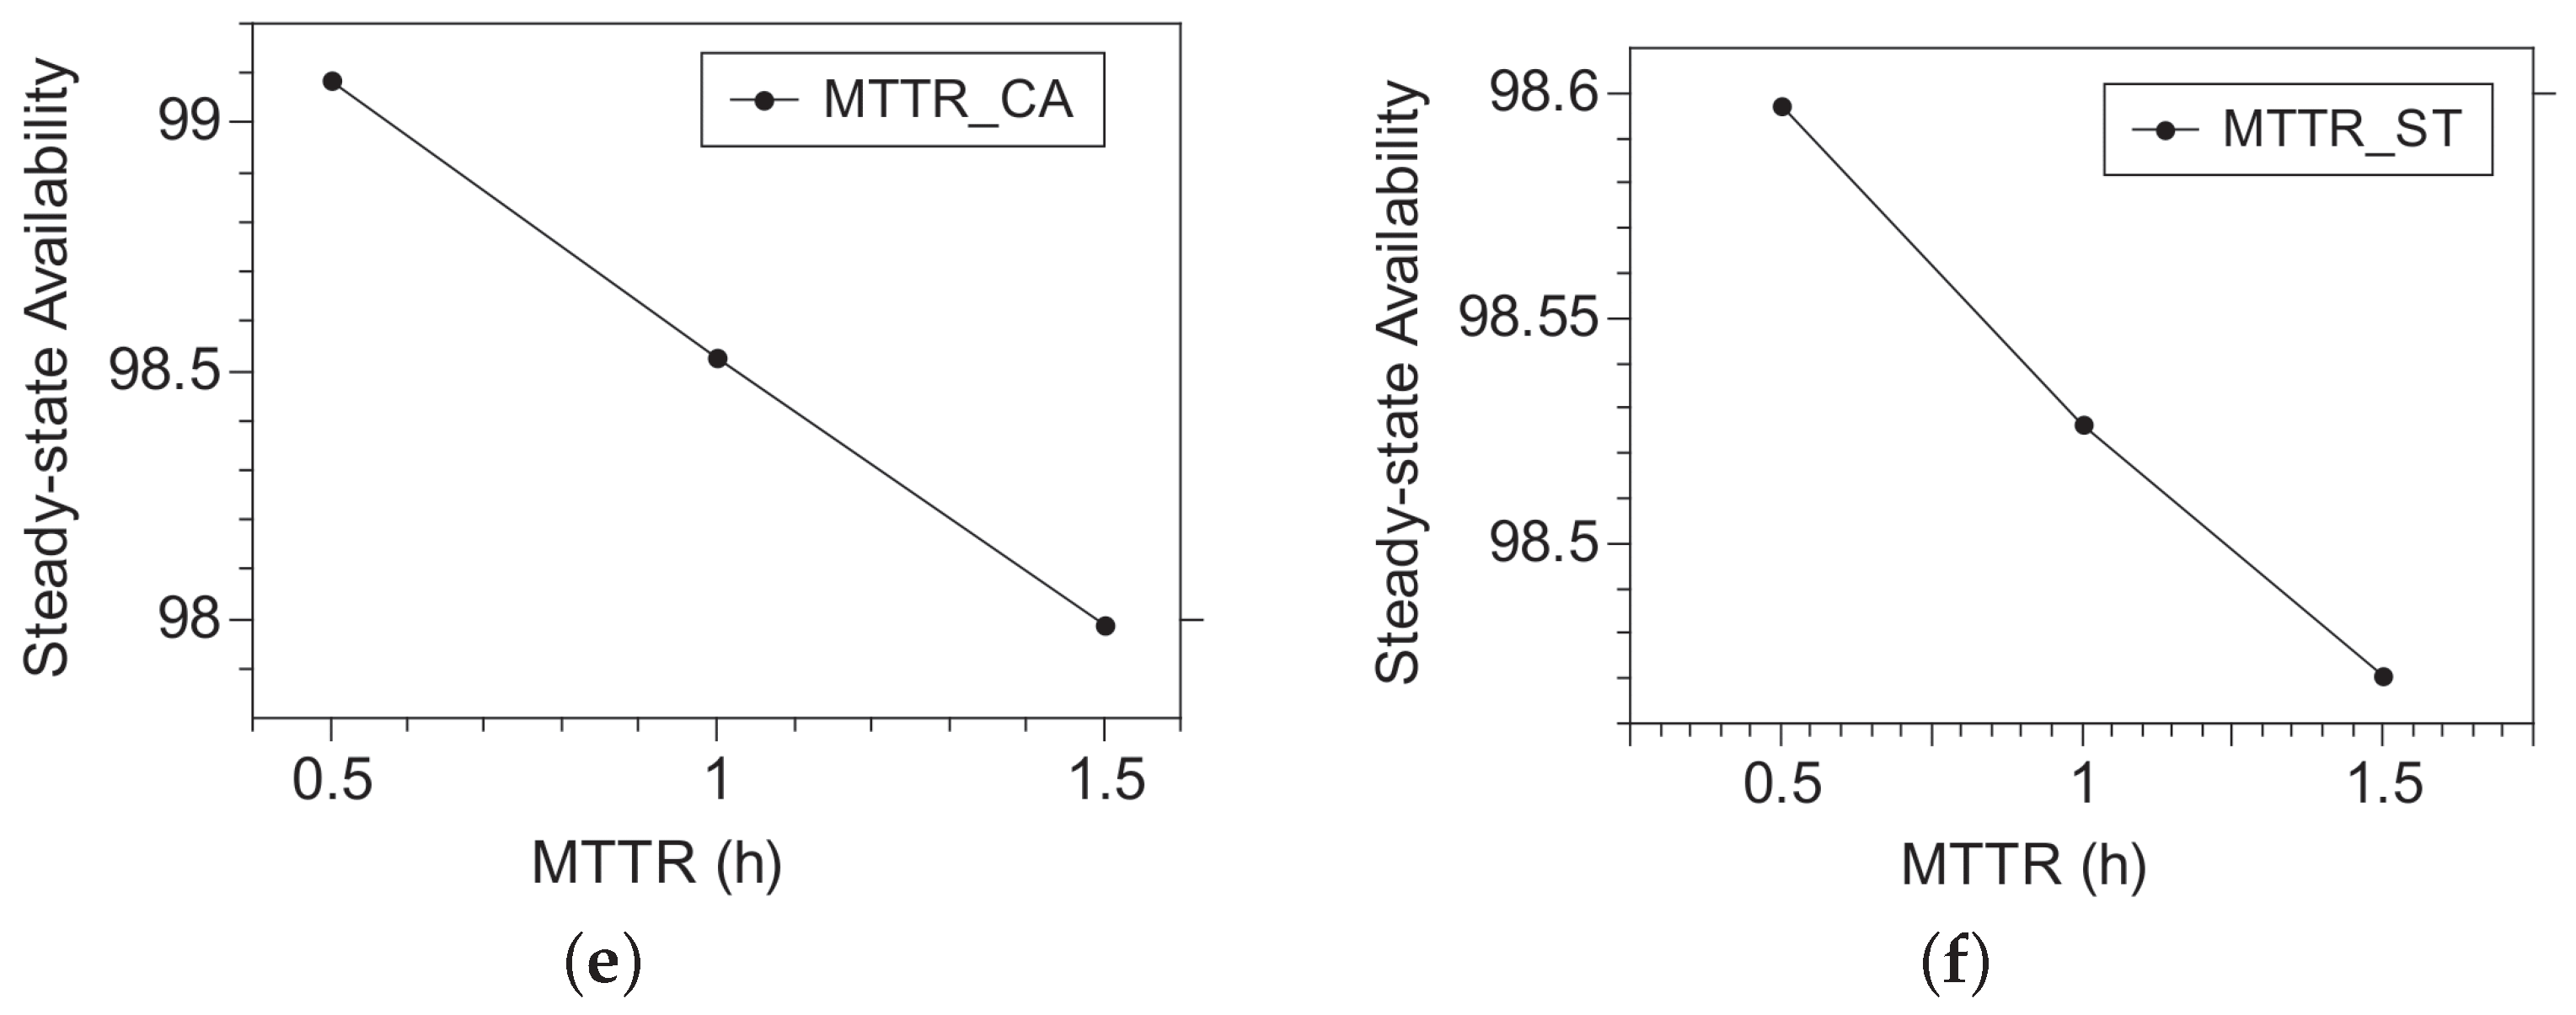
To better illustrate the influence of the parameters, Figure 5 represents the variation in the availability of the main parameters. Figure 5a–d show the MTTF parameters where availability tends to increase with the increase in MTTF. Figure 5e,f show that increasing MTTR reduces availability. The variation in the model parameters provides an overview of the system’s behavior.

5.2.2. Sensitivity Analysis

This section presents the sensitivity analysis with DoE [29]. The established factors were the MTTF and the MTTR of each constituent component of the system. We used two levels for the factors of the experiment. The first level refers to a decrement of 50% under the base value shown in Table 7. The second level refers to an increment of 50% under the base value. Table 5 presented the factors and levels used to perform the DoE based on the availability metric.
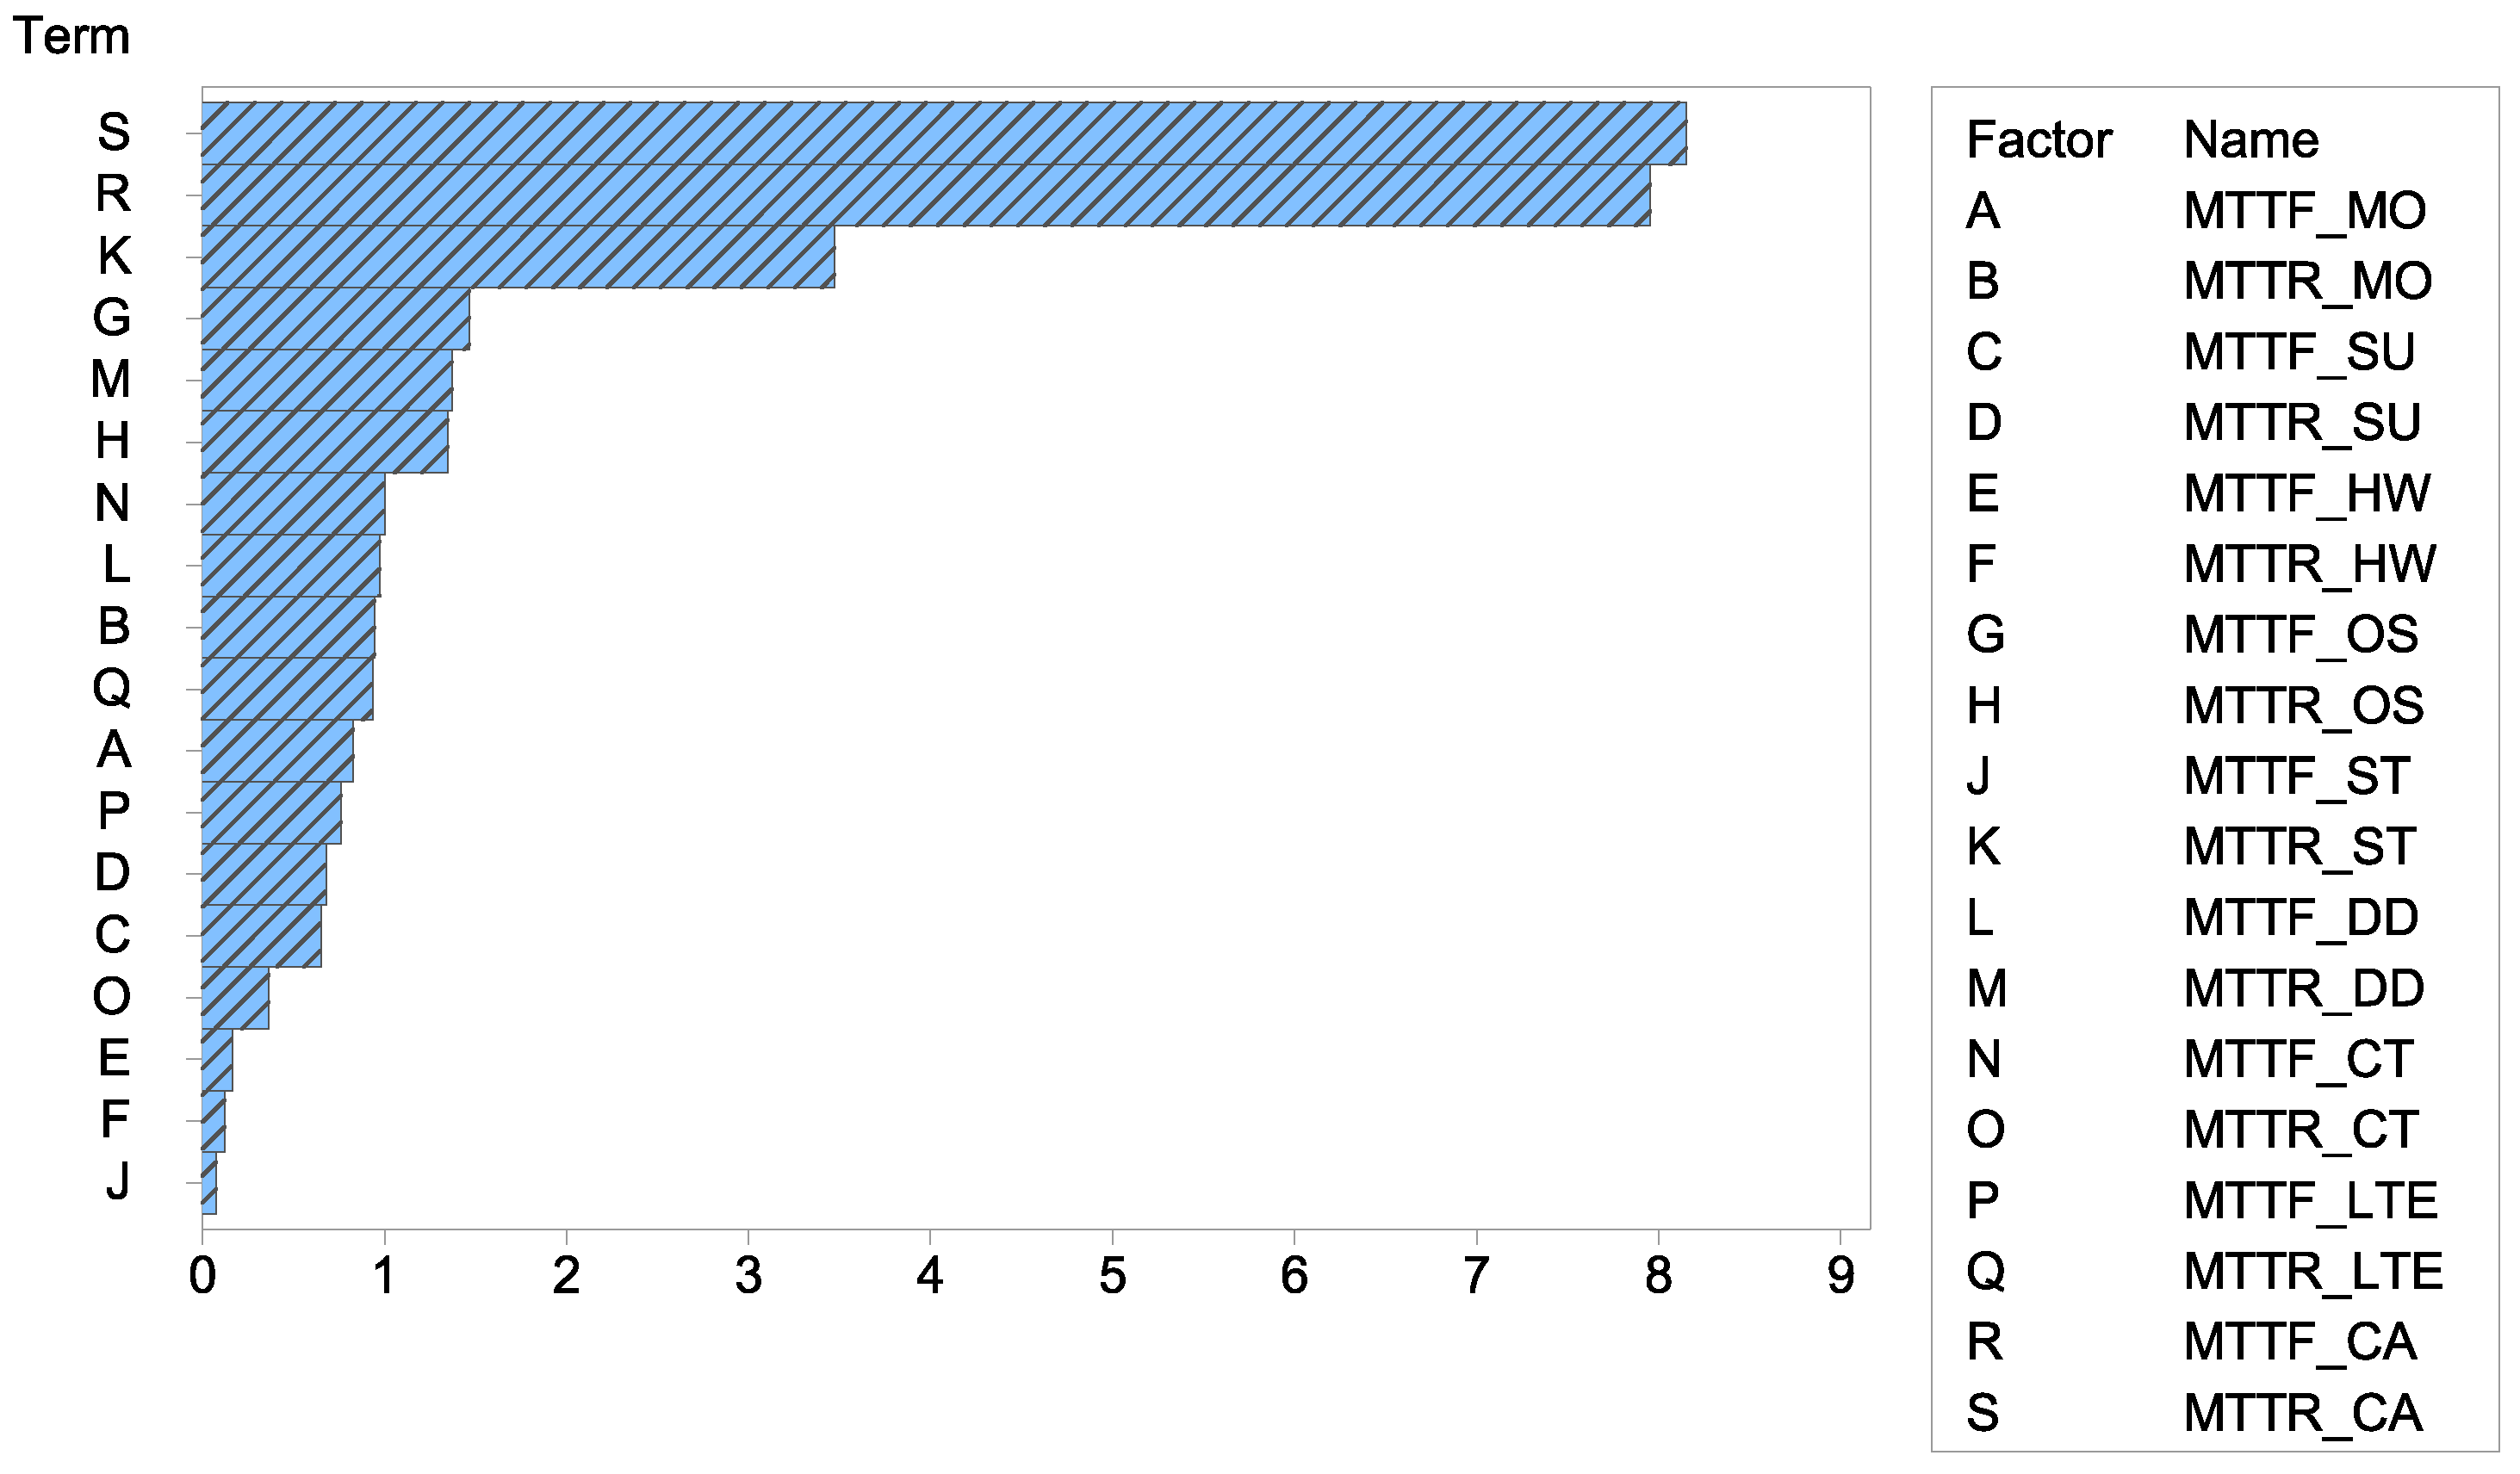
Figure 6 shows the Pareto graph for factors related to the availability metric. The effects of the MTTR_CA factor and the MTTF_CA factor have more significant influence under availability. Therefore, changing the mean repair time’s values and the mean failure time of the cameras is decisive in the efficiency of the surveillance system.
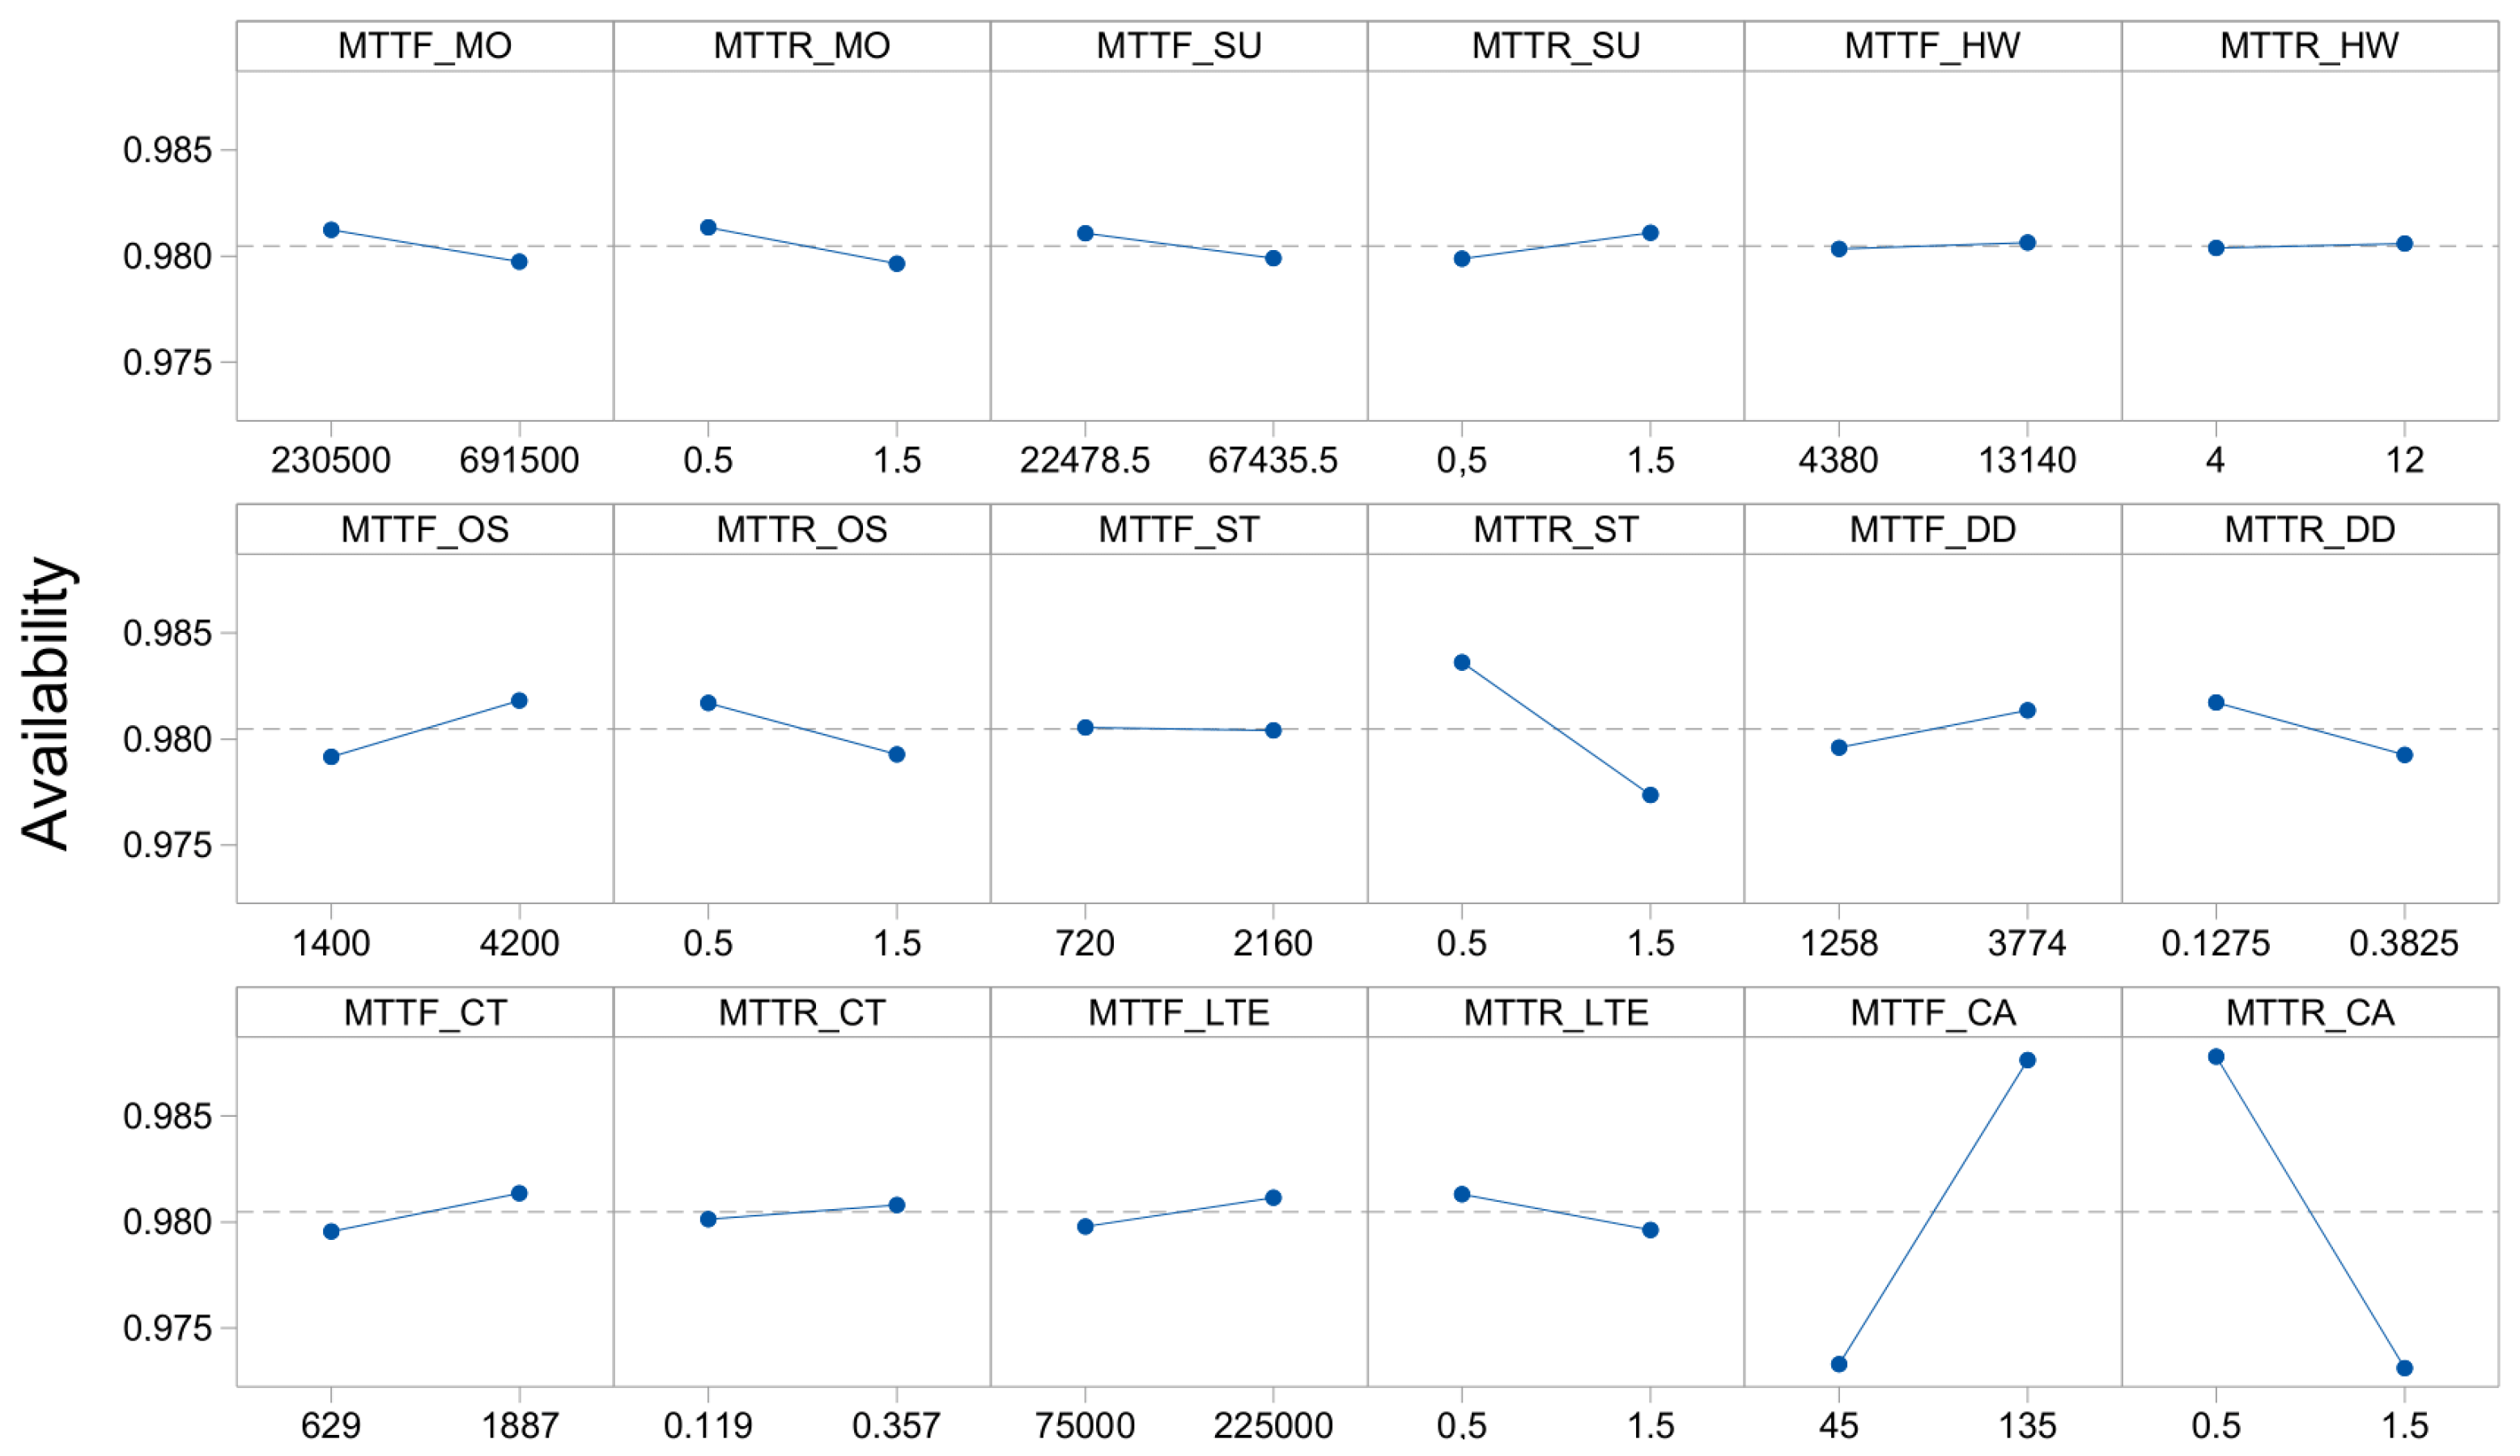
Figure 7 shows the main effects graph for the availability metric. The graph represents the availability to perform the tests at each level for each of the defined factors. In this graph, the more vertical the line, the more significant influence that factor has on system availability. As shown in the Pareto graph, in this main effect graph, the MTTF_CA factor and the MTTR_CA factor are the factors that have the most significant effect on availability. MTTF_CA, in its first level, has an availability of 97.3%, and in its second level, it has an availability of 98.7%; therefore, it was a significant increase in availability. In its first level of MTTR_CA, it has an availability of 98.7%, and in its second level, it has an availability of 97.3%; therefore, it was a significant reduction in availability. MTTR _ST, in its first level, has an availability of 98.3%, and in its second level, it has an availability of 97.7%; therefore, it was also a significant reduction in availability. The remaining factors are not relevant to availability.
As shown in the previous graph, the three factors that most influence system availability were highlighted, the MTTR_ST, the MTTR_CA, and the MTTF_CA. 
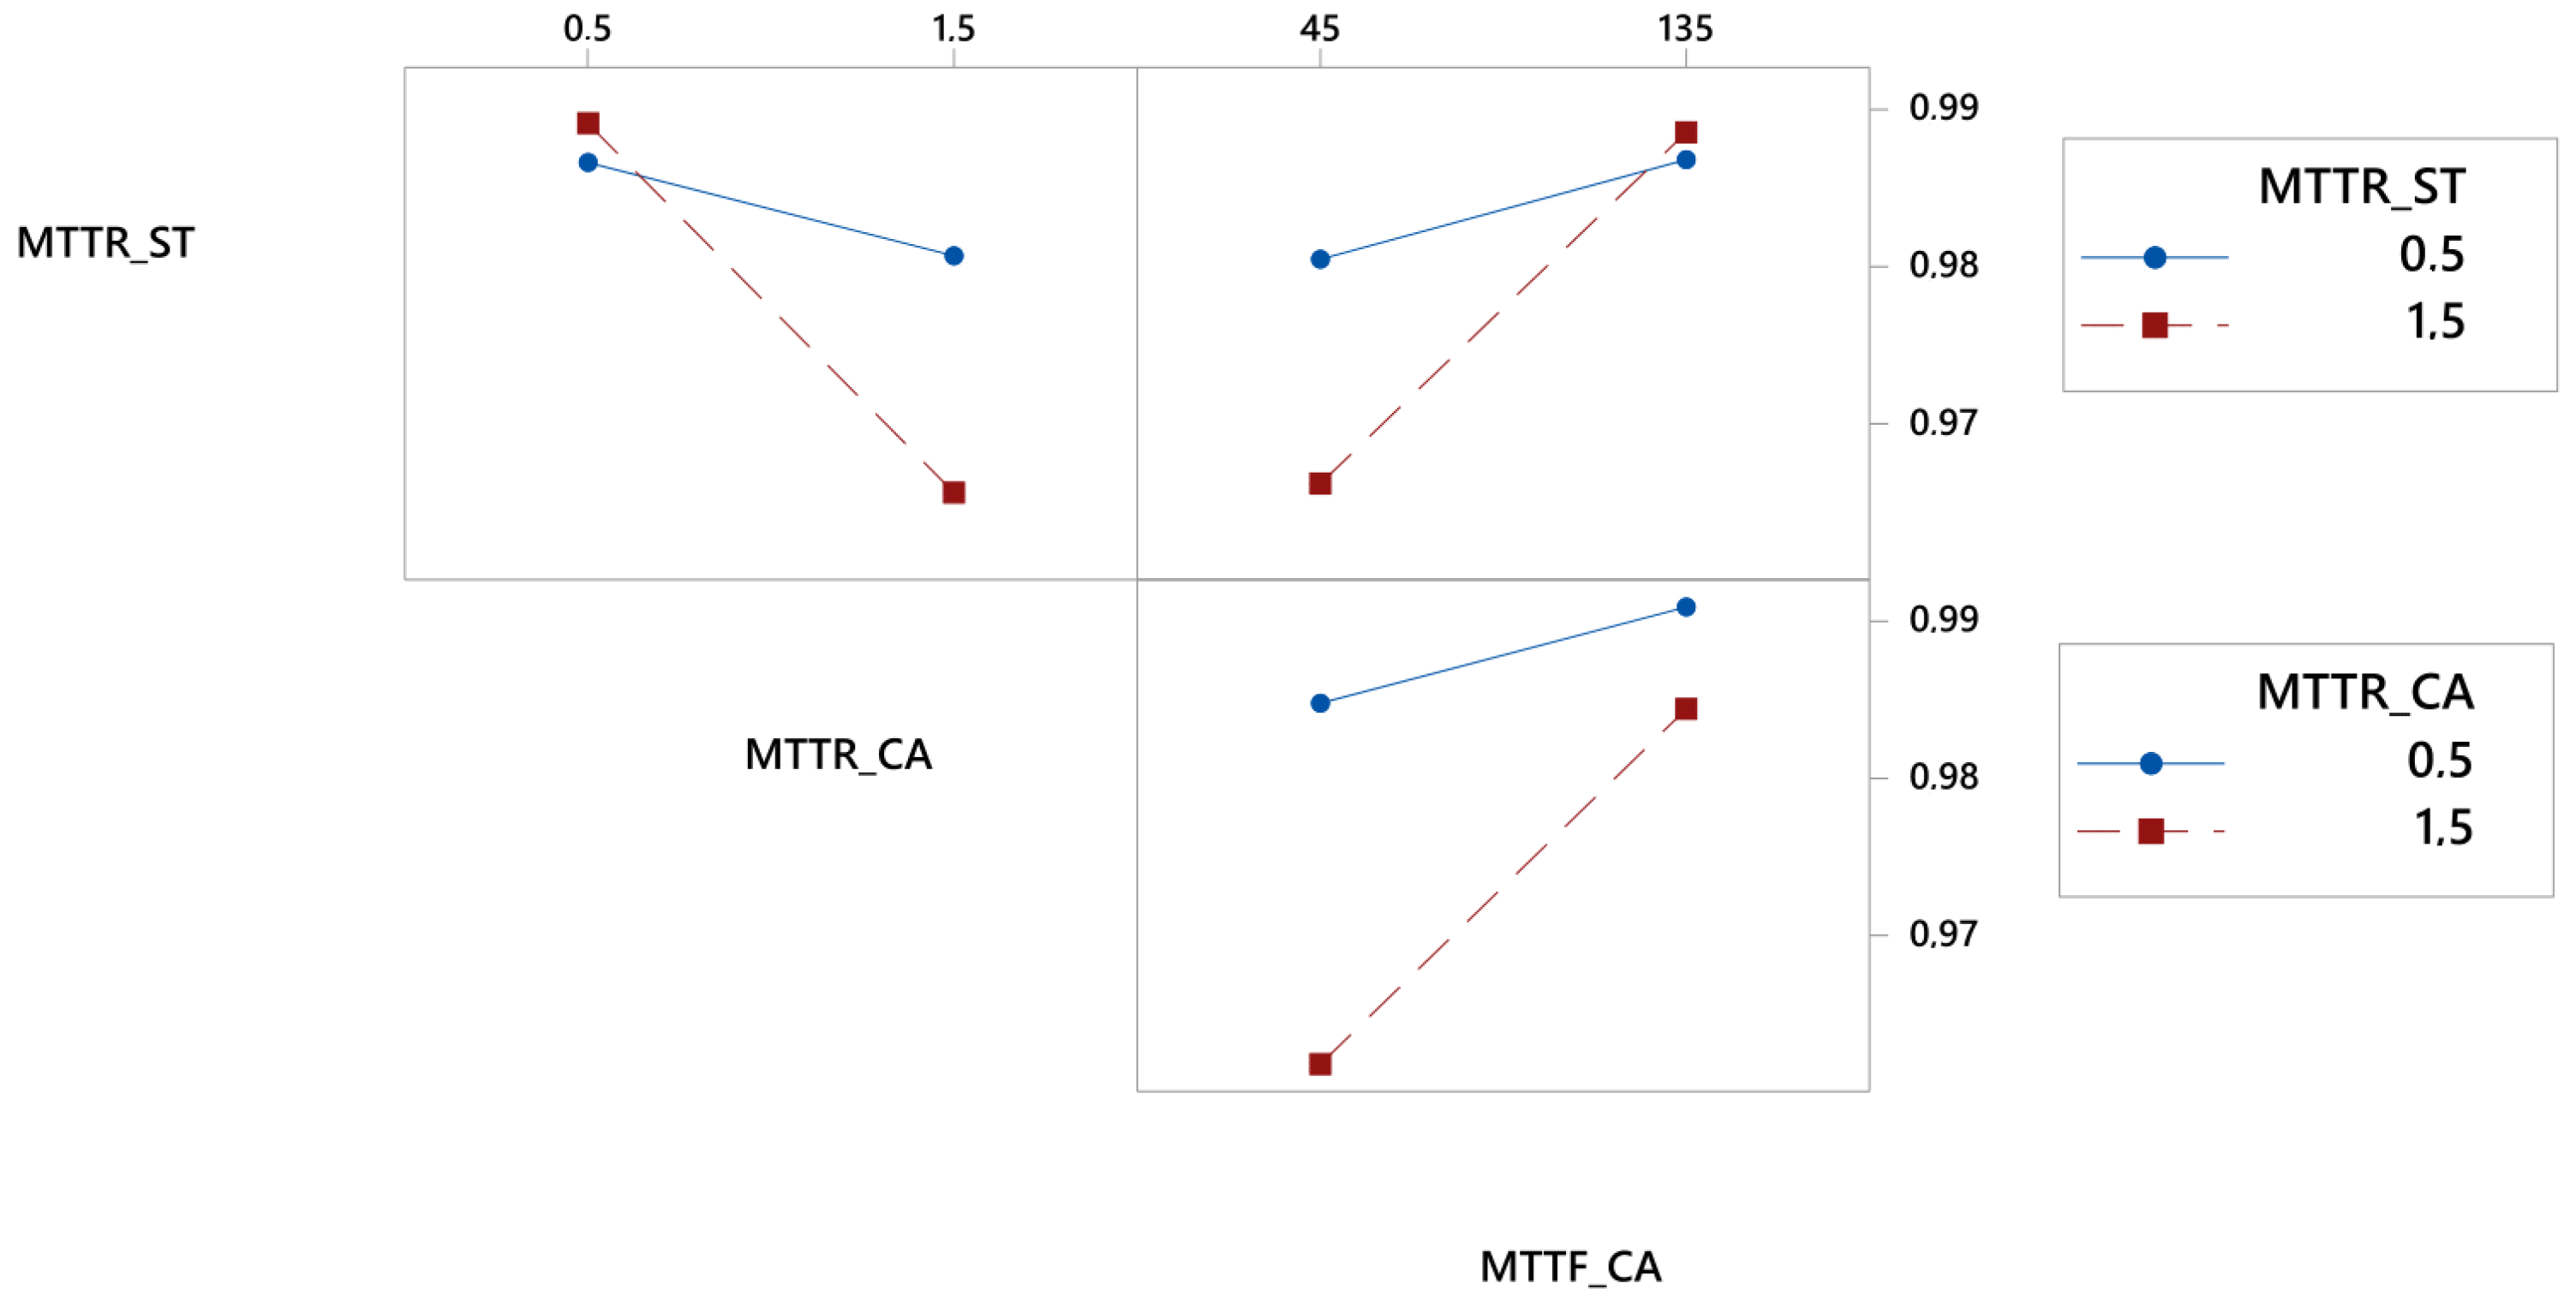
Figure 8 shows the interaction graph for these three factors. With this graph, it is possible to analyze which levels have more significant interference in the experiments’ final result. In other words, we can say that the higher the intersection of the lines, the greater the interaction between the factors. In the first interaction, MTTR_ST has a significant impact on availability when there are changes in its levels, at the moment when MTTR_CA is at its second level. In the second interaction, MTTR_ST has a relevant impact on availability when there are changes in its levels, at the moment when MTTF_CA is at its first level. Finally, in the last interaction, the change in MTTR_CA levels has no significant impact on availability at the time that MTTF_CA assumes its two levels.

6. A Case Study of Surveillance Monitoring Systems

This section presents a case study of the surveillance monitoring system when varying the number of wireless base stations since the number of cameras was the most impacting factor in the sensitivity analyses.

6.1. Scenarios and Metrics

Cameras are the components that have the most significant effect on the availability of the surveillance system. The cameras are operational when the radio station is operational. When we increase the number of wireless base stations; as a result, we increase the number of cameras in the surveillance system. Thus, three different scenarios were used to assess the availability of the system: A, B, and C. The scenarios explored the impact of using redundancy on wireless base stations. Figure 9 shows the states of wireless base stations in the three scenarios with one, two, and three wireless base stations in operation, respectively.
Two evaluations were adopted at this stage: availability and downtime, considering hours per year. Table 6 presents the metrics for calculating the system availability in each scenario. The downtime (D) can be obtained by D = ( 1 A ) × 8760 , where A represents the system availability and 8760 represents the number of hours in a year.

6.2. Numerical Analysis Results

Some input parameters are needed to evaluate the proposed model. Failure and repair times were taken from the manuals and manufacturing datasheets for each component. Table 7 shows all MTTF and MTTR values used in this case study.
Figure 10 shows the results of the availability and downtime of the surveillance system in smart cities. The results were obtained by simulation using the Mercury tool [30]. Scenario C has the highest availability (99.6533%), followed by scenario B (99.6340%) and scenario A (98.5264%). These results reveal that scenario C presents 30.36 h/year of inactivity, while scenario B has 32.05 h/year, and scenario C, 129.08 h/year. Scenario C has the highest availability because it has a greater redundancy in wireless base stations regarding the other scenarios. Thus, if two towers do not work, the system will still work.
The addition of a redundancy (two wireless base stations) had a significant impact on the system’s availability. However, the use of three wireless base stations did not have such a high impact than two wireless base stations. When adding redundancy, the system does not stop working when one of the wireless base stations fails.

6.3. Capacity-Oiented Availability Assessment

Capacity-oriented availability (COA) assesses how the system is delivered, therefore, it does not consider only states of availability or unavailability, but the real impact of these factors in service delivery. The COA calculation considers p c i as the operational processing capacity or the amount of resources available at any state s i , while π i describes the steady state availability for the π i state, a set with all available states know as US it is also considered and the maximum processing capacity of the system M P C . Thus, we can calculate the capacity-oriented availability by Equation (3) [31]:
C O A = s i U S p c i × π i M P C
The analyses of the COA of the case-studied surveillance system are shown in Figure 11. Figure 11a depicts the difference of COA in three scenarios A, B, and C, while, Figure 11b shows the sensitivity of COA with respect to the variation of the number of cameras in the scenarios. Figure 11c,d present the sensitivity of COA with respect to the mean time to failure and repair of cameras in the scenarios, respectively.
As shown in Figure 11a, the analysis results of the surveillance system’s COA also agree with the analysis results of the resources’ SSA in Figure 11a in the way that (i) the solution of double redundancy in scenario B obtains a significant impact on COA of the system; (ii) while triple redundancy in scenario C gains the highest value of COA in comparison to other cases. This indicates that the redundancy of wireless base stations does not only improve the availability of physical systems but also increases the availability of service capacity that the system can maintain.
In Figure 11b, we can see the common characteristics of the COA’s sensitivity with respect to the number of cameras in each scenario, in which the value of COA increases as soon as the number of surveillance cameras connected to each wireless base station increases. We also observed that when the number of cameras was big enough, the improvement in COA was marginal. Since the number of failed cameras at a time in the redundant scenarios B and C can be much bigger than that in the case of scenario A within the total amount of cameras, COA in scenario A shows a higher sensitivity with respect to the number of cameras in comparison with scenarios B and C.
In Figure 11c, the sensitivity of the surveillance system’s COA also confirms with that the resource availability in Figure 5a of the original system architecture. More specifically, when the cameras have a higher value of a mean time to failure, the system also gains a higher COA. In contrast to the sensitivity of COA with respect to to the number of cameras, the sensitivity of COA with respect to the MTTF of cameras in the scenario A was apparently lower than that in scenarios B and C. This was due to the fact that higher values of the cameras’ MTTF roughly meant a lower amount of cameras may encounter with uncertain failures at a time; therefore, the system can maintain the highest capacity of cameras in the scenario C, and the lower one in scenario B and the lowest one in scenario A.
In Figure 11d, the system’s COA rapidly decreases when it takes a longer time to recover a failed camera in all scenarios A, B, and C. The COA values in scenario A are also lower compared to those in the scenarios B and C when the MTTR of cameras varies. This is to say that if the recovery of cameras takes longer time, it may cause a higher amount of failed cameras at a time and therefore the system in scenario A with the lowest number of cameras can maintain the lowest value of COA for operational services.
As of the above analyses, since the wireless base stations play an important role in the system architecture (Figure 1) for uninterrupted data transactions from surveillance cameras to the centered MEC server and remote supervisors, the redundancy of wireless base stations apparently improves the system availability for service capacity. Furthermore, while increasing the number of surveillance cameras can apparently enhance the COA of the system, choosing cameras with better quality to guarantee higher values of a mean time to failure and also improving maintenance services to reduce the mean time to recovery of failed cameras are the feasible approaches to obtain higher availability of service capacity.

6.4. Discussions

6.4.1. Dependability Analogy

As we investigated carefully in literature, there has clearly not been a comprehensive study on the dependability assessment of a camera surveillance system in smart cities in the similar manner as in this work. To the best of our knowledge, our work can be distinguished as one of the first studies in the research area of dependability assessment for camera surveillance systems. Therefore, we would like to provide a slight analogy between our work and one of previous works which adopted a similar methodology and/or analysis metrics on slightly similar systems. Matos et al. presented in [32] sensitivity analyses for availability metrics of a mobile cloud computing system. The system architecture consisted of a cloud station providing computing services for a mobile client through a wireless communication channel. The system was assessed using a hierarchy of reliability block diagram (RBD) and continuous-time Markov chain (CTMC) models; thus, it failed to explicitly incorporate dependencies between the system components. Moreover, the work did not consider the reliability of the system without recovery. However, the sensitivity of parameters were performed in a comprehensive manner using a similar methodology to our work. Since, the system architecture consisted of similar parts as our considered surveillance system (a server domain, a communication channel, and remote devices), the availability analysis results of the mobile cloud computing system in the reference paper are at the same level as our availability results (two to three #9s). Based on the sensitivity analyses in our works as compared to the previous work, we also found that (i) the system availability can be enhanced upon a shorter/reduced set of impacting parameters that cause sensitive variation of steady state availability (thus, an analyst should focus on these parameters), (ii) parameters at the highest positions in the sensitivity ranking list are literally related to critical parts in the system architecture, such as remote devices (surveillance cameras in our work, and mobile devices in the previous work) and the computing server and storage at server domains.

6.4.2. Feasible Modeling Extension

The system architecture presented in Figure 1 is slightly simplified only to show the main illustration of a general surveillance system in smart cities. We tried to keep the system architecture design simple due to the generality desired in the model. We formulated a model capable of representing surveillance systems with any specific requirements. The designer can adapt the model after while if needed.

6.4.3. Surveillance Test-Bed

The most credible findings of this study can be obtained through the synthesis and evaluation of theoretical studies with experimental and realistic test-bed implementations in real-world circumstances. Nevertheless, our study in this work provided a preliminary and theoretical basis for future practical experiments on real-world surveillance systems. It is therefore important to develop a real-world surveillance test-bed with different configurations of software/hardware components to compare and highlight the model-driven analysis results obtained in this work. We considered this a feasible extension in future work.

7. Conclusions

In this paper, we proposed SPN models for dependability modeling and the evaluation of a typical surveillance monitoring system in smart cities. Reliability and availability attributes, as essential dependability representatives for high quality of service, were investigated in a comprehensive manner. The reliability assessment was performed by varying surveillance cameras’ MTTF, showed an increase in reliability when increasing their respective MTTF. Furthermore, various scenarios for availability evaluation were investigated, making it possible to observe each component’s impact. The best results were indicated in the scenarios with a high level of redundancy for wireless base stations. Sensitivity analysis was applied to identify the components that have the most significant impact on availability. In this way, the impact of different MTTF and MTTR values for each component was measured. Sensitivity analysis showed that specific components have a more significant impact on availability. To reinforce the sensitivity analysis results, we used the DoE method to precisely visualize the impact of the MTTF and MTTR values of each component on the availability of the system. On the other hand, system availability can be enhanced in different ways, such as selecting components with a better MTTF. Furthermore, this study also pointed out that the camera is apparently the most critical component of the system that sensitively causes either a positive or negative impact on reliability/availability for the high quality of the service of the surveillance system. Last but not least, the combination of performance and availability models can be a proper future extension to investigate performability issues in surveillance monitoring systems.

Author Contributions

Conceptualization, F.A.S.; Formal analysis, I.G. and L.R.; Funding acquisition, D.M. and J.-W.L.; Investigation, F.A.S., D.M. and J.-W.L.; Methodology, F.A.S.; Project administration, F.A.S. and J.-W.L.; Resources, J.-W.L.; Software, I.G. and T.A.N.; Supervision, F.A.S.; Validation, I.G., L.R. and T.A.N.; Visualization, I.G. and L.R.; Writing—original draft, I.G.; Writing—review & editing, L.R., T.A.N., D.M. and J.-W.L. All authors have read and agreed to the published version of the manuscript.

Funding

This research was also partially funded by the National Council for Scientific and Technological Development—CNPq, Brazil, through the universal call for tenders (Process 431715/2018-1) This research was partially supported by Basic Science Research Program through the National Research Foundation of Korea (NRF) funded by the Ministry of Education (No. 2020R1A6A1A03046811). This research was partially supported by the MSIT (Ministry of Science, ICT), Korea, under the ITRC (Information Technology Research Center) support program (IITP-2020-2016-0-00465) supervised by the IITP (Institute for Information & communications Technology Planning & Evaluation) This paper was written as part of Konkuk University’s research support program for its faculty on sabbatical leave in 2020.

Conflicts of Interest

The authors declare no conflict of interest. The funders had no role in the design of the study; in the collection, analyses, or interpretation of data; in the writing of the manuscript, or in the decision to publish the results.

References

  1. Araujo, E.; Dantas, J.; Matos, R.; Pereira, P.; Maciel, P. Dependability Evaluation of an IoT System: A Hierarchical Modelling Approach. In Proceedings of the 2019 IEEE International Conference on Systems, Man and Cybernetics (SMC), Bari, Italy, 6–9 October 2019. [Google Scholar]
  2. Cocchia, A. Smart and Digital City: A Systematic Literature Review. In Smart City: How to Create Public and Economic Value with High Technology in Urban Space; Dameri, R.P., Rosenthal-Sabroux, C., Eds.; Springer: Berlin, Germany, 2014; pp. 13–43. [Google Scholar] [CrossRef]
  3. Monachesi, P. Shaping an alternative smart city discourse through Twitter: Amsterdam and the role of creative migrants. Cities 2020, 100, 102664. [Google Scholar] [CrossRef]
  4. Cheong, K.; Poeschmann, S.; Lai, J.; Koh, J.; Acharya, U.; Yu, S.; Tang, K. Practical Automated Video Analytics for Crowd Monitoring and Counting. IEEE Access 2019, 7, 183252–183261. [Google Scholar] [CrossRef]
  5. Nguyen, T.A.; Min, D.K.; Choi, E.M.; Tran, D.T. Reliability and Availability Evaluation for Cloud Data Center Networks using Hierarchical Models. IEEE Access 2019, 9273–9313. [Google Scholar] [CrossRef]
  6. Nguyen, T.A.; Min, D.; Choi, E. Stochastic Reward Net-based Modeling Approach for Availability Quantification of Data Center Systems. In Dependability Engineering; García Márquez, F.P., Ed.; InTech: Rijeka, Croatia, 2018. [Google Scholar] [CrossRef] [Green Version]
  7. Amirrudin, N.; Ariffin, S.; Malik, A.; Ghazali, E. User’s Mobility History-based Mobility Prediction in LTE Femtocells Network. In Proceedings of the 2013 IEEE International RF and Microwave Conference (RFM), Penang, Malaysia, 9–11 December 2013; pp. 105–110. [Google Scholar] [CrossRef]
  8. Amirrudin, N.; Ariffin, S.; Malik, A.; Ghazali, E. Mobility Prediction via Markov Model in LTE Femtocell. Int. J. Comput. Appl. Technol. 2014, 65, 40–44. [Google Scholar]
  9. Qiao, J.; He, Y.; Xuemin, S.S. Proactive Caching for Mobile Video Streaming in Millimeter Wave 5G Networks. IEEE Trans. Wireless Commun. 2016, 15, 7187–7198. [Google Scholar] [CrossRef]
  10. Leonardi, G.; Meo, M.; Marsan, M. Markovian Models of Solar Power Supply for a LTE Macro BS. In Proceedings of the 2016 IEEE International Conference on Communications (ICC), Kuala Lumpur, Malaysia, 22–27 May 2016; pp. 1–7. [Google Scholar] [CrossRef] [Green Version]
  11. Markkula, J.; Haapola, J. Ad Hoc LTE Method for Resilient Smart Grid Communications. Wireless Pers. Commun. 2018, 98, 3355–3375. [Google Scholar] [CrossRef] [Green Version]
  12. Lin, P. Large-Scale and High-Dimensional Cell Outage Detection in 5G Self-Organizing Networks. In Proceedings of the 2019 Asia-Pacific Signal and Information Processing Association Annual Summit and Conference (APSIPA ASC), Lanzhou, China, 18–21 November 2019; pp. 8–12. [Google Scholar] [CrossRef]
  13. Salem, F.; Chahed, T.; Altman, E.; Gati, A.; Altman, Z. Optimal Policies of Advanced Sleep Modes for Energy-Efficient 5G networks. In Proceedings of the 2019 IEEE 18th International Symposium on Network Computing and Applications (NCA), Cambridge, MA, USA, 26–28 September 2019; pp. 1–7. [Google Scholar]
  14. MacCartney, G.; Rappapor, T. Millimeter-Wave Base Station Diversity for 5G Coordinated Multipoint (CoMP) Applications. IEEE Trans. Wireless Commun. 2019, 18, 3395–3410. [Google Scholar] [CrossRef]
  15. Wahab, O.A.; Bentahar, J.; Otrok, H.; Mourad, A. Towards Trustworthy Multi-Cloud Services Communities: A Trust-Based Hedonic Coalitional Game. IEEE Trans. Serv. Comput. 2018, 11, 184–201. [Google Scholar] [CrossRef]
  16. Lockl, J.; Schlatt, V.; Schweizer, A.; Urbach, N.; Harth, N. Toward Trust in Internet of Things Ecosystems: Design Principles for Blockchain-Based IoT Applications. IEEE Trans. Eng. Manag. 2020, 67, 1256–1270. [Google Scholar] [CrossRef]
  17. Heimann, D.; Mittal, N.; Trivedi, K. Dependability modeling for computer systems. In Proceedings of the 1999 Annual Reliability and Maintainability Symposium, Orlando, FL, USA, 29–31 January 1991; pp. 120–128. [Google Scholar] [CrossRef]
  18. Silva, F.A.; Kosta, S.; Rodrigues, M.; Oliveira, D.; Maciel, T.; Mei, A.; Maciel, P. Mobile cloud performance evaluation using stochastic models. IEEE Trans. Mob. Comput. 2017, 17, 1134–1147. [Google Scholar] [CrossRef]
  19. Silva, F.A.; Rodrigues, M.; Maciel, P.; Kosta, S.; Mei, A. Planning mobile cloud infrastructures using stochastic petri nets and graphic processing units. In Proceedings of the 2015 IEEE 7th International Conference on Cloud Computing Technology and Science (CloudCom), Vancouver, BC, Canada, 30 November–3 December 2015; pp. 471–474. [Google Scholar]
  20. Driouech, S.; Sabir, E.; Bennis, M. D2D Mobile Relaying for Efficient Throughput-Reliability Delivering in 5G. In Proceedings of the ICC 2020–2020 IEEE International Conference on Communications (ICC), Dublin, Ireland, 7–11 June 2020. [Google Scholar]
  21. Kleijnen, J. Sensitivity analysis and optimization in simulation: Design of experiments and case studies. In Proceedings of the 1995 Winter Simulation Conference Proceedings, Arlington, VA, USA, 3–6 December 1995; pp. 133–140. [Google Scholar] [CrossRef] [Green Version]
  22. Carvalho, D.; Rodrigues, L.; Endo, P.T.; Kosta, S.; Silva, F.A. Mobile Edge Computing Performance Evaluation using Stochastic Petri Nets. In Proceedings of the 2020 IEEE Symposium on Computers and Communications (ISCC), Rennes, France, 7–10 July 2020; pp. 1–6. [Google Scholar]
  23. Silva, F.A.; Fé, I.; Gonçalves, G. Stochastic models for performance and cost analysis of a hybrid cloud and fog architecture. J. Supercomput. 2020, 77, 1537–1561. [Google Scholar] [CrossRef]
  24. Santos, G.L.; Gomes, D.; Kelner, J.; Sadok, D.; Silva, F.A.; Endo, P.T.; Lynn, T. The internet of things for healthcare: Optimising e-health system availability in the fog and cloud. Int. J. Comput. Sci. Eng. 2020, 21, 615–628. [Google Scholar] [CrossRef]
  25. Ferreira, L.; da Silva Rocha, E.; Monteiro, K.H.C.; Santos, G.L.; Silva, F.A.; Kelner, J.; Sadok, D.; Bastos Filho, C.J.; Rosati, P.; Lynn, T.; et al. Optimizing Resource Availability in Composable Data Center Infrastructures. In Proceedings of the 2019 9th Latin-American Symposium on Dependable Computing (LADC), Natal, Brazil, 19–21 November 2019; pp. 1–10. [Google Scholar]
  26. Rodrigues, L.; Endo, P.T.; Silva, F.A. Stochastic Model for Evaluating Smart Hospitals Performance. In Proceedings of the 2019 IEEE Latin-American Conference on Communications (LATINCOM), Salvador, Brazil, 11–13 November 2019. [Google Scholar]
  27. Campolongo, F.; Tarantola, S.; Saltelli, A.; Ratto, M. Sensitivity Analysis in Practice: A Guide to Assessing Scientific Models; Wiley: New York, NY, USA, 2004. [Google Scholar]
  28. Pianosi, F.; Beven, K.; Freer, J.; Hall, J.; Rougier, J.; Stephenson, D.; Wagener, T. Sensitivity analysis of environmental models: A systematic review with practical workflow. Environ. Modell. Softw. 2016, 79, 214–232. [Google Scholar] [CrossRef]
  29. Santos, B.; Endo, P.; Silva, F.A. Uma Avaliação de Desempenho de Contêineres Docker Executando Diferentes SGBDs Relacionais. In Proceedings of the 18th Workshop on Performance of Computer and Communication Systems, Belem, Brazil, 15–16 July 2019. [Google Scholar]
  30. Silva, B.; Matos, R.; Callou, G.; Figueiredo, J.; Oliveira, D.; Ferreira, J.; Dantas, J.; Lobo, A.; Alves, V.; Maciel, P. Mercury: An integrated environment for performance and dependability evaluation of general systems. In Proceedings of the IEEE 45th Dependable Systems and Networks Conference, Rio de Janeiro, Rio de Janeiro, Brazil, 22–25 June 2015. [Google Scholar]
  31. Maciel, P.; Trivedi, K.; Kim, D. Dependability Modeling In: Performance and Dependability in Service Computing: Concepts, Techniques and Research Directions; Hershey; IGI Global: Pennsylvania, PA, USA, 2010; p. 13. [Google Scholar]
  32. Matos, R.; Araujo, J.; Oliveira, D.; Maciel, P.; Trivedi, K. Sensitivity analysis of a hierarchical model of mobile cloud computing. Simul. Model. Pract. Theory 2015, 50, 151–164. [Google Scholar] [CrossRef]
Figure 1. Overview of the evaluated architecture: (a) base architecture with all macro elements; and (b) layered architecture of the mobile edge computing (MEC) server.
Electronics 10 00876 g001
Figure 2. Stochastic Petri net (SPN) model to assess the reliability of a smart city surveillance architecture.
Electronics 10 00876 g002
Figure 3. Reliability analysis.
Electronics 10 00876 g003
Figure 4. SPN model for surveillance architecture in smart cities.
Electronics 10 00876 g004
Figure 5. Availability results varying the mean time to repair (MTTR)/MTTF: (a) MTTF_CA (camera); (b) MTTF_HW (hardware); (c) MTTF_ST (storage); (d) MTTF_OS (operating system); (e) MTTR_CA (camera); and (f) MTTR_ST (storage).
Electronics 10 00876 g005aElectronics 10 00876 g005b
Figure 6. Influence of factors on the availability metric.
Electronics 10 00876 g006
Figure 7. Main effects for availability.
Electronics 10 00876 g007
Figure 8. Factor interactions for availability.
Electronics 10 00876 g008
Figure 9. LTE Number.
Electronics 10 00876 g009
Figure 10. Levels of availability (a) and downtime (b) in relation to the surveillance system in smart cities for the proposed scenarios.
Electronics 10 00876 g010
Figure 11. Capacity-oriented availability of a surveillance system: (a) COA under default parameters; (b) COA with respect to the number of cameras; (c) COA with respect to MTTF_CA; and (d) COA with respect to MTTR_CA.
Electronics 10 00876 g011
Table 1. Comparison with related work.
WorkMetricsContextContribution
[7]Handover latencyUser’s mobility history-based mobility prediction in Long Term Evolution (LTE) femtocells networkThe results show that the proposed method predicts better when random data is 50% and above compared to the existing method.
[8]Handover latencyMobility prediction via Markov model in LTE femtocellsThe results show the prediction of users’ direction after several movements.
[9]Connection latencyProactive caching for mobile video streaming in millimeters Wave 5G NetworksThey model the proposed system as a cache management problem and attain optimal video streaming quality by using Markov decision process.
[10]Solar powerMarkovian models of solar power supply for an LTE MacroThey described two DTMC models that can be used for dimensioning the solar power supply of an LTE macro base station (BS).
[11]Packets trasmission successAd hoc LTE method for resilient smart grid communicationsBoth the disjoint analysis and simulations show that all packets are successfully transmitted at most by the fourth transmission attempt.
[12]Cell outage detectionLarge-scale and high-dimensional cell outage detection in 460 5G self-organizing networksThe proposed method can automatically detect the cell outage in complicated and time-varying mobile wireless communication environments.
[13]Trade-off between saved power consumption versus additional incurred delay for user trafficOptimal policies of advanced sleep modes for energy-efficient 5G networksThey presented optimal control strategies enabling them to implement the Advanced Sleep Modes (ASMs) in 5G non-standalone (NSA).
[14]Effectiveness of downlink precoding techniquesMillimeter-wave base station diversity for 5G coordinated multipoint (CoMP) applicationsResults show that the coordination can improve network performance by suppressing interference when it exists.
[20]Outage probabilityD2D mobile relaying for efficient throughput-reliability delivering in 5GSimulation results show that offloading the network by means of D2D-relaying improves per device throughput.
This WorkAvailability, reliability, downtimeSurveillance system in smart cities: a dependability evaluation based on stochastic modelsTwo main metrics of interest in dependability of a surveillance system including reliability and availability are analyzed in a comprehensive manner.
Table 2. Parameters variation of camera’s mean time to failure (MTTF).
ScenarioMTTF (h)
Minus 50%45.0
Base Value90.0
Plus 50%135.0
Table 3. Guard conditions that restrict the triggering of transitions.
ComponentsTransitionCondition
MTTR_OSHW_U > 0
MECMTTR_STOS_U > 0
ServerMTTR_DDST_U > 0
MTTR_CTDD_U > 0
Wireless base stationsMTTR_CALTE_U>0
Table 4. Sensitivity indices.
Base Model
VariableIndex
MTTF_CA1.49 × 10 2
MTTR_CA1.10 × 10 2
MTTF_HW1.79 × 10 3
MTTF_ST1.52 × 10 3
MTTR_ST1.28 × 10 3
MTTF_OS1.08 × 10 3
MTTR_HW8.36 × 10 4
MTTR_CT5.68 × 10 4
MTTR_OS5.13 × 10 4
MTTR_DD4.41 × 10 4
MTTF_CT2.69 × 10 4
MTTF_DD2.62 × 10 4
MTTF_LTE2.26 × 10 4
MTTF_MO7.99 × 10 5
MTTF_SU6.32 × 10 5
MTTR_MO4.98 × 10 5
MTTR_SU4.11 × 10 5
MTTR_LTE3.70 × 10 5
Table 5. Factors (in hours) and design of experiment (DoE) levels for the availability metric.
FactorsLevel 1Level 2
MTTF_MO230,500691,500
MTTR_MO0.51.5
MTTF_SU22,478.567,435.5
MTTR_SU0.51.5
MTTF_HW438013,140
MTTR_HW412
MTTF_OS14004200
MTTR_OS0.51.5
MTTF_ST7202160
MTTR_ST0.51.5
MTTF_DD12583774
MTTR_DD0.12750.3825
MTTF_CT6291887
MTTR_CT0.1190.357
MTTF_LTE75,000225,000
MTTR_LTE0.51.5
MTTF_CA45135
MTTR_CA0.51.5
Table 6. Reward definitions of availability metric.
ScenarioAvailability Metric
AA = P{(#CT_U>0)AND(#S_U>0)AND(#MO_U>0)AND
(#CA_U=CAN1)}
BB = P{(#CT_U>0)AND(#S_U>0)AND(#MO_U>0)AND
((#CA_U=CAN1)OR(#CA2_U=CAN2))}
CC = P{(#CT_U>0)AND(#S_U>0)AND(#MO_U>0)AND
((#CA_U=CAN1)OR(#CA2_U=CAN2)OR(#CA3_U=CAN3))}
Table 7. Model input parameters.
ComponentMTTF (h)MTTR (h)
Modem 4G461,0001
Supervisor44,9571
Radio stations (1, 2, and 3)150,0001
Camera (1, 2, and 3)901
Hardware (MEC server)87608
Operational system (MEC server)28001
Storage (MEC server)14401
Daemon docker (MEC server)25160.255
Containers (MEC server)12580.238
Publisher’s Note: MDPI stays neutral with regard to jurisdictional claims in published maps and institutional affiliations.

