
Facial Emotion Recognition from an Unmanned Flying Social Robot for Home Care of Dependent People

 ,
,  ,
,  and
and 
Abstract
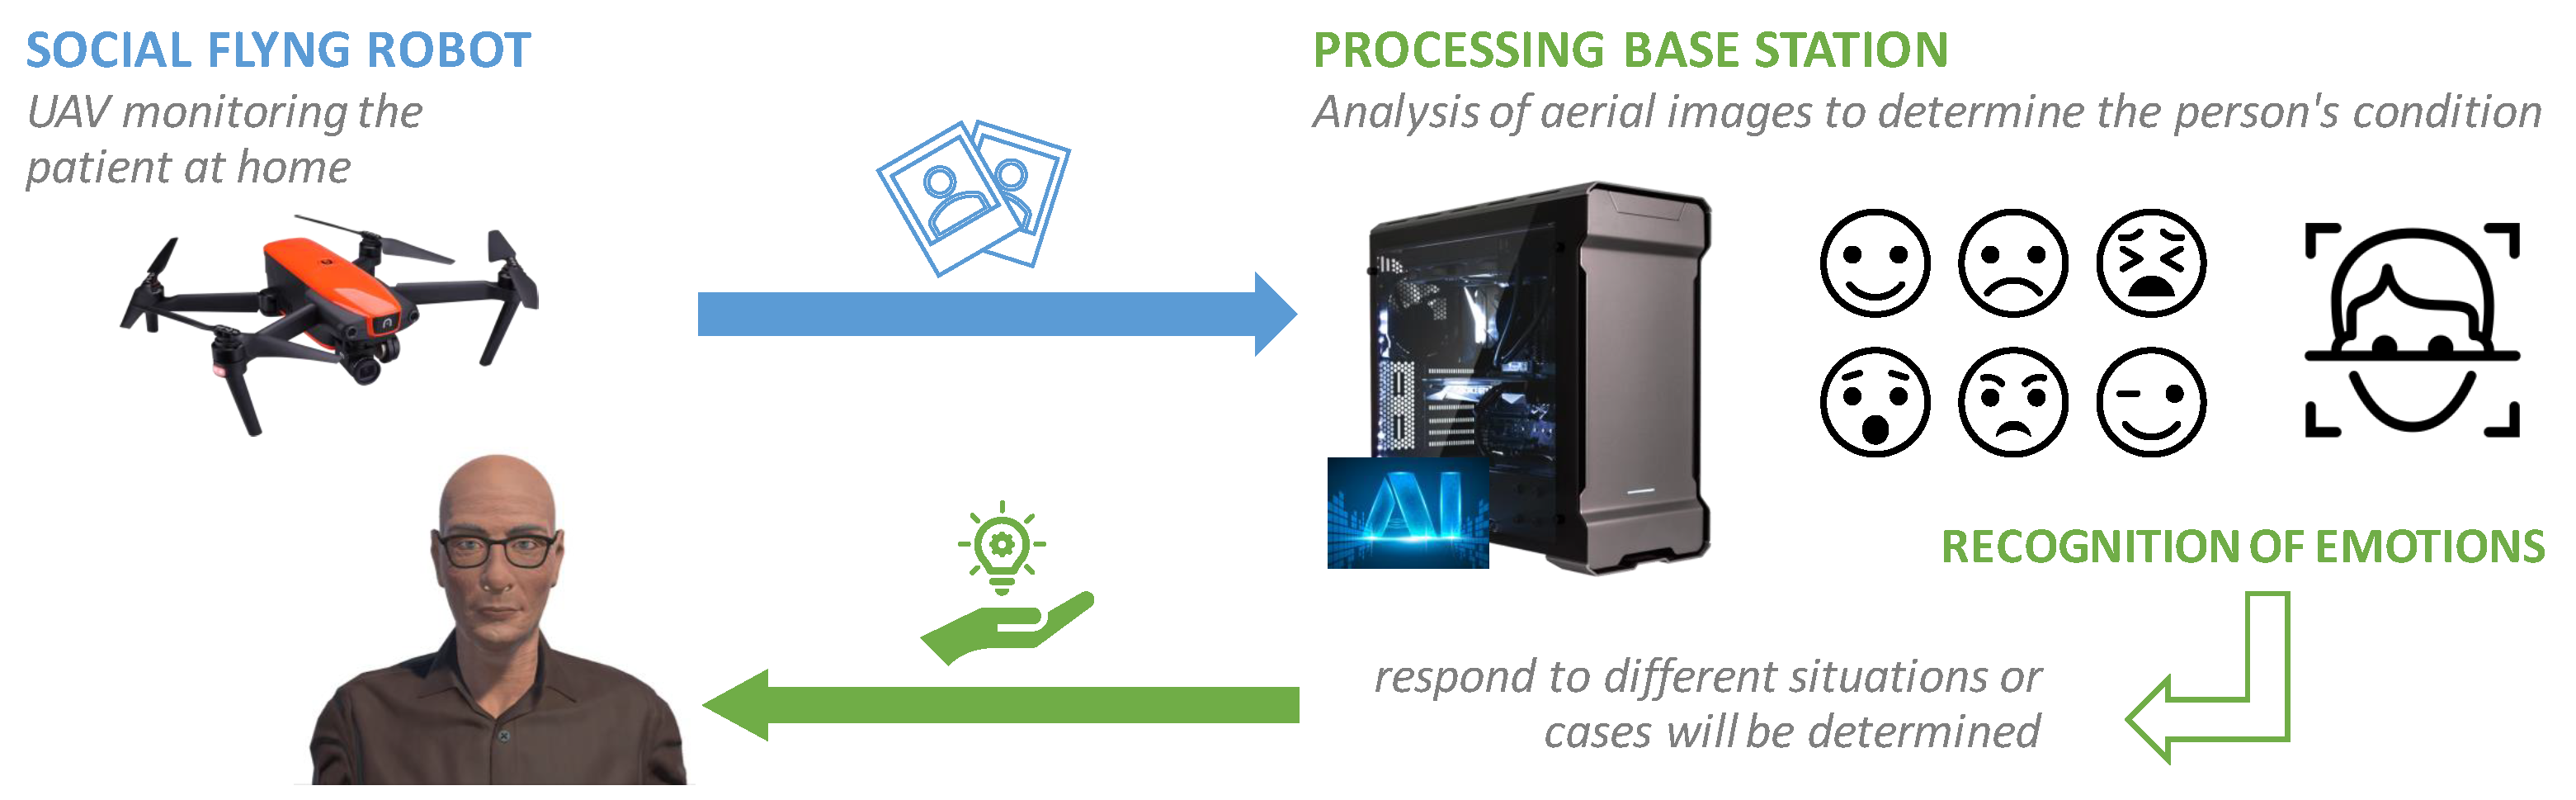
1. Introduction
2. General Description of the VR Platform
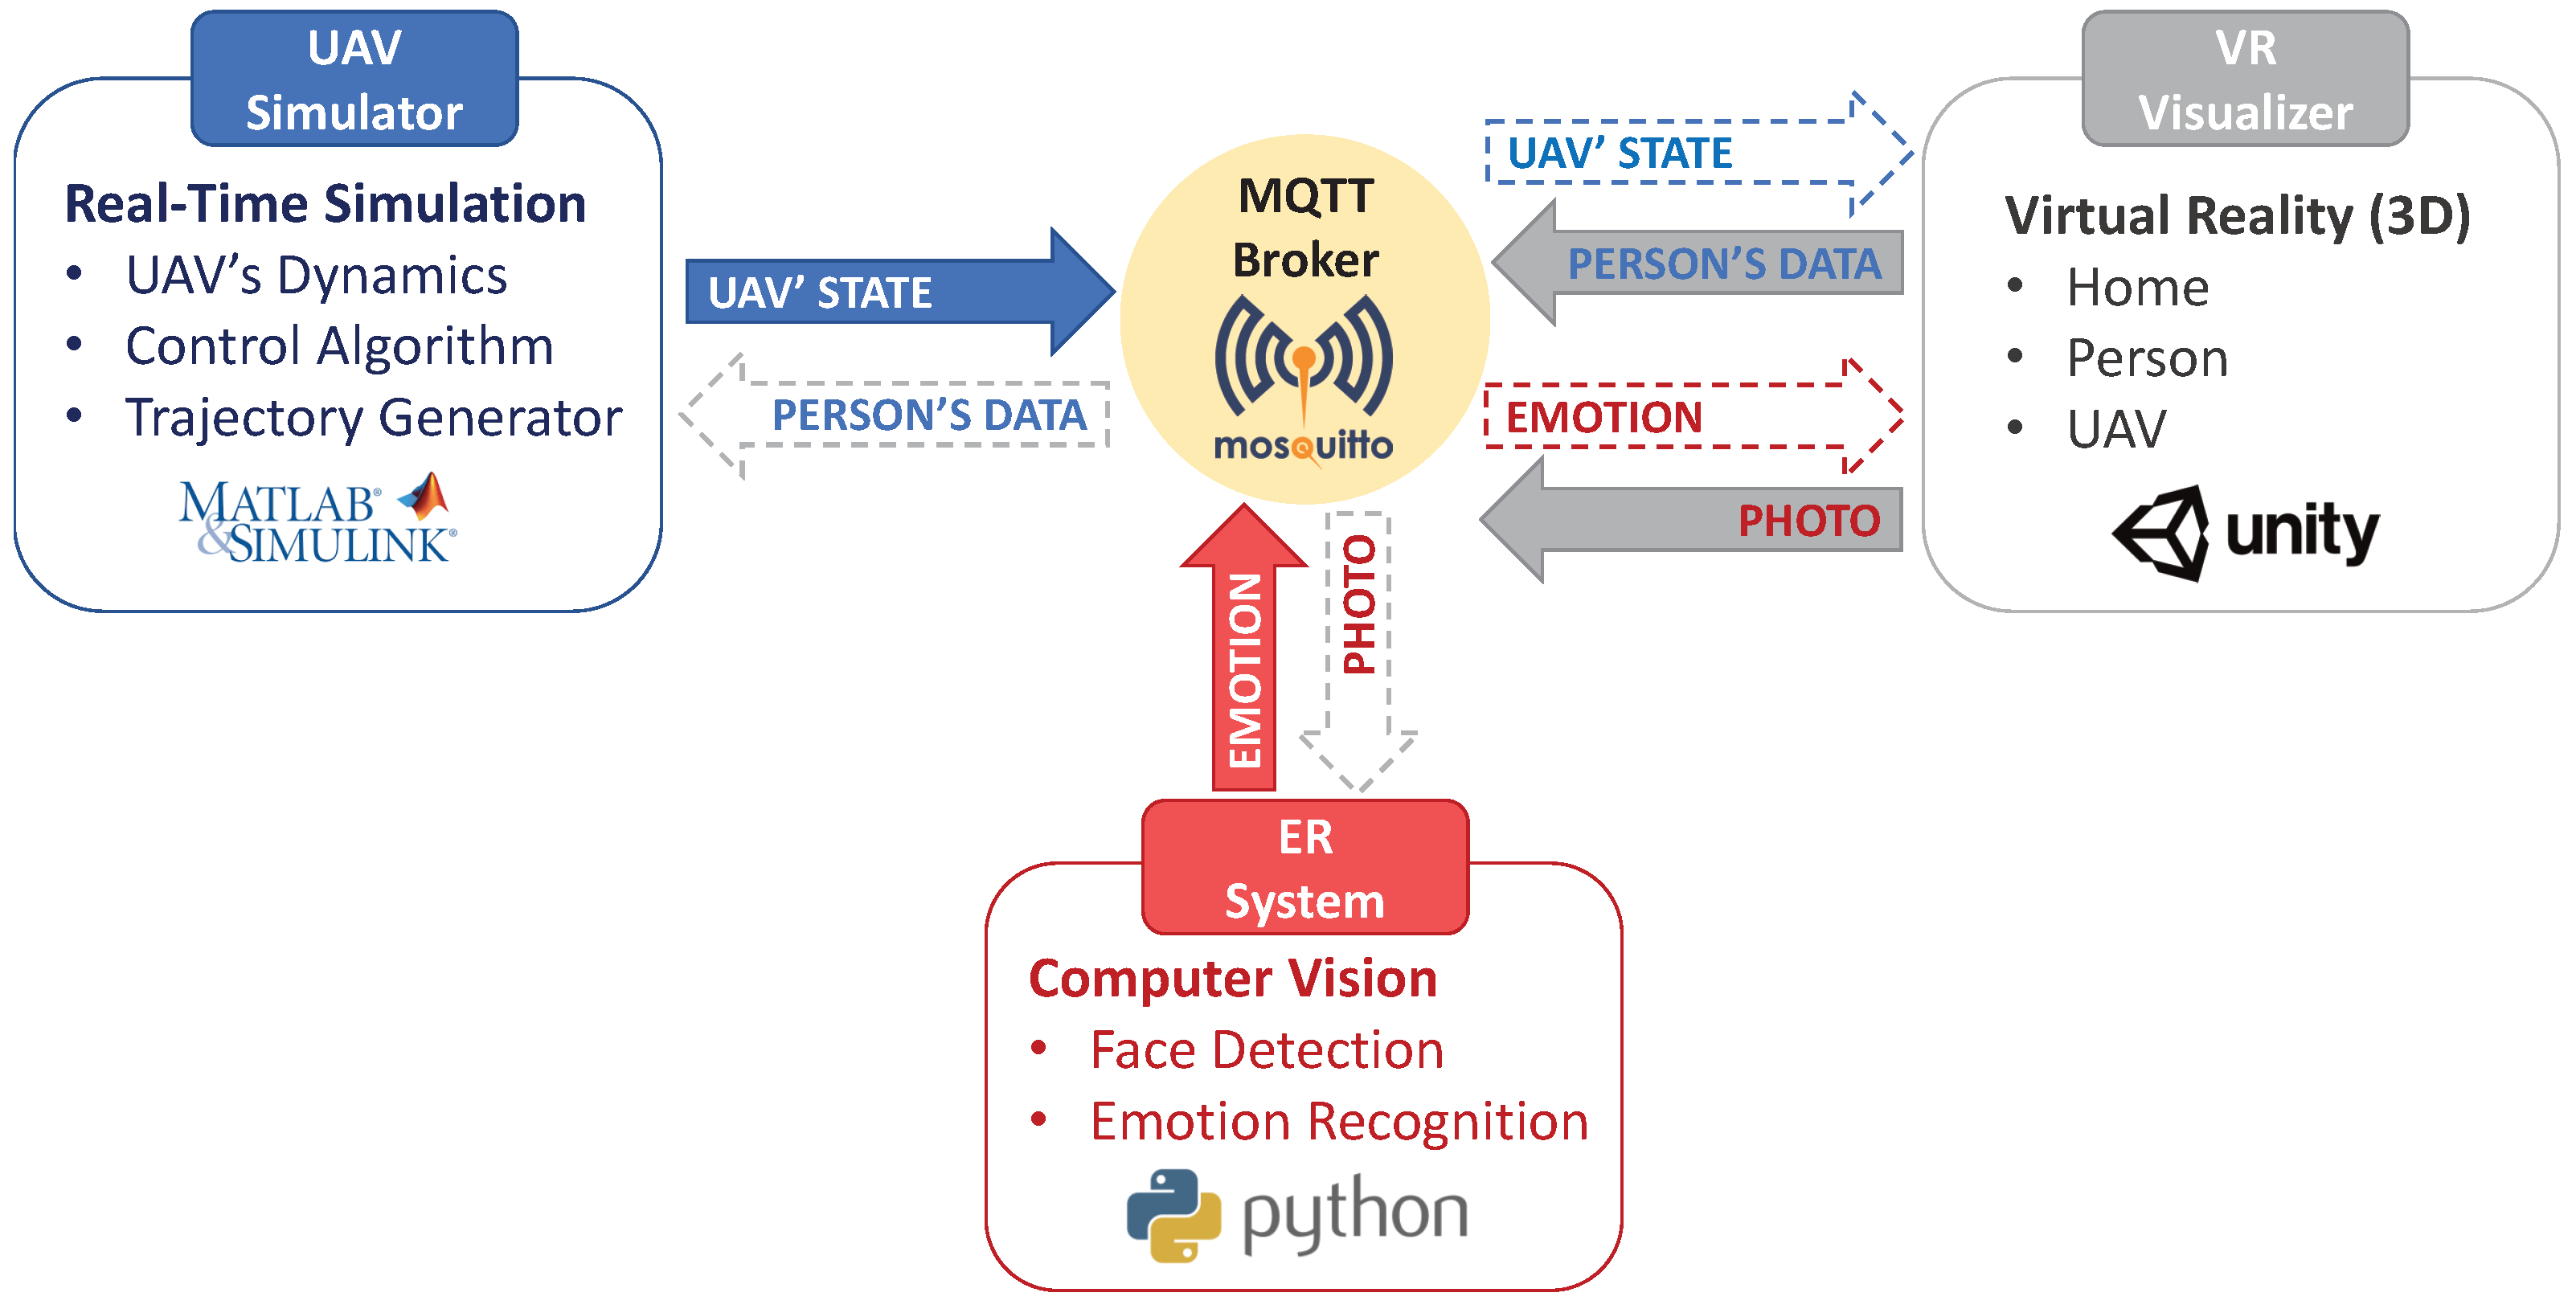
2.1. High-Level Architecture
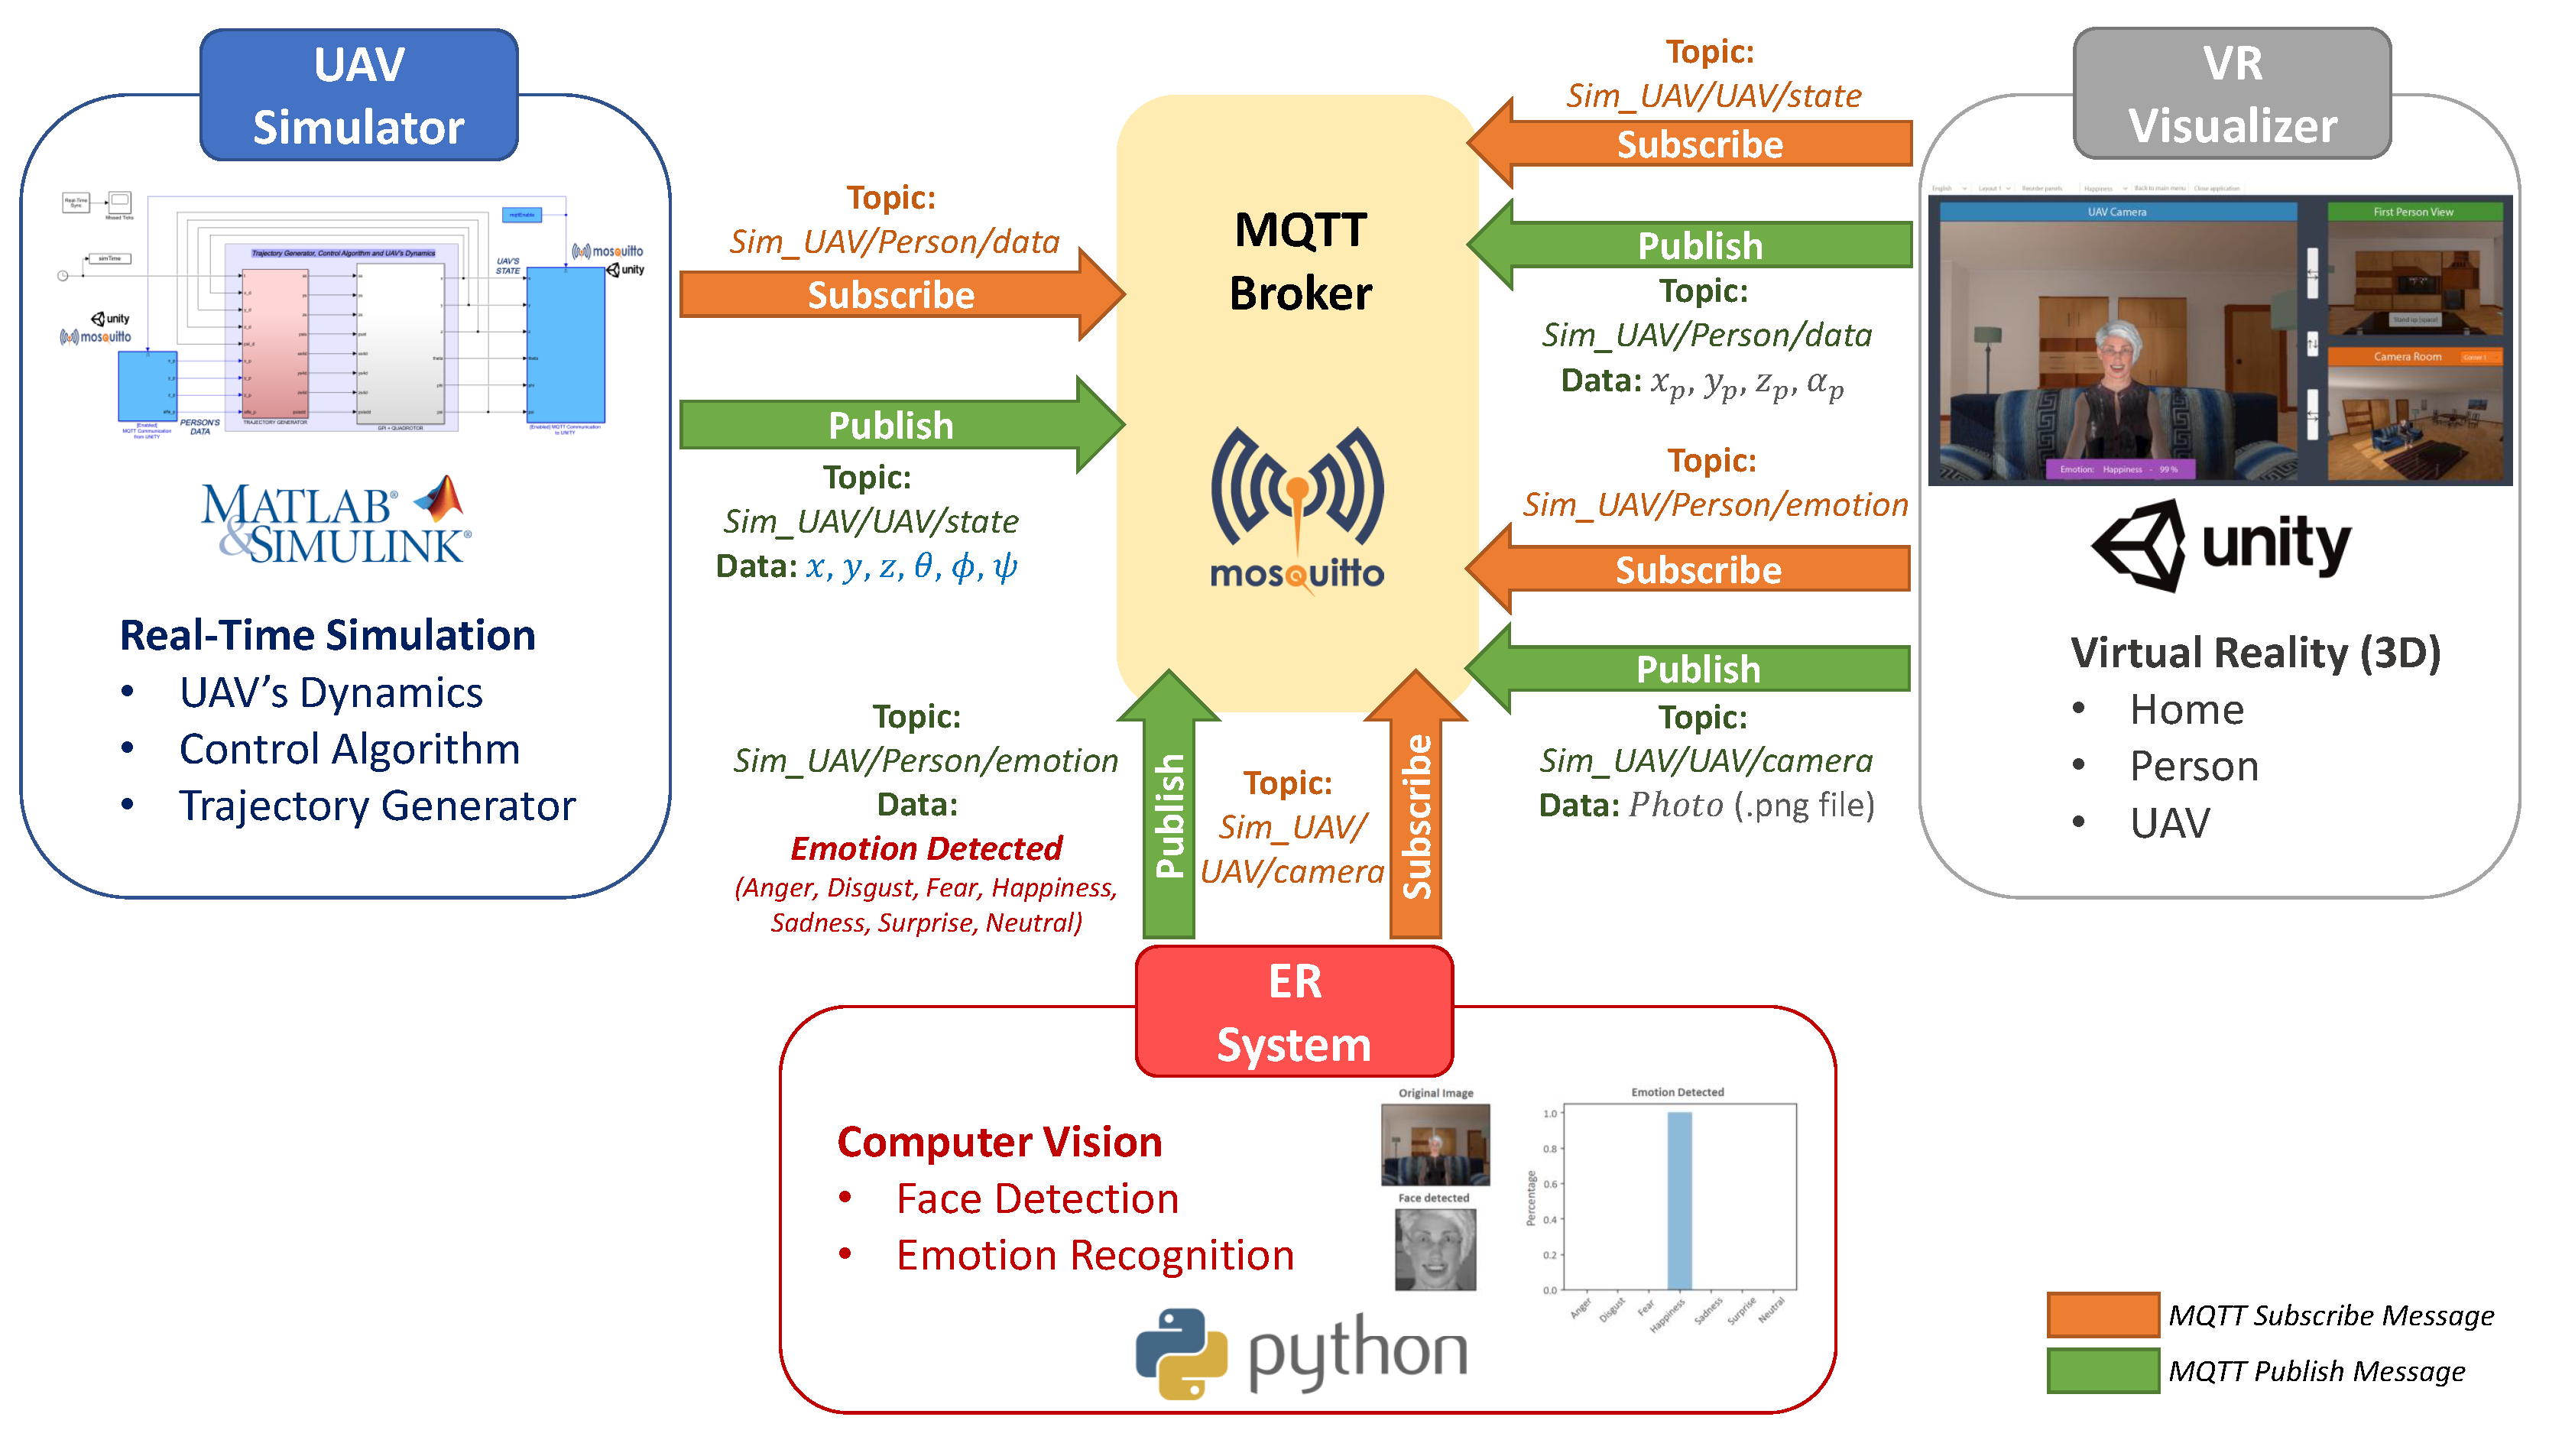
2.2. Communication
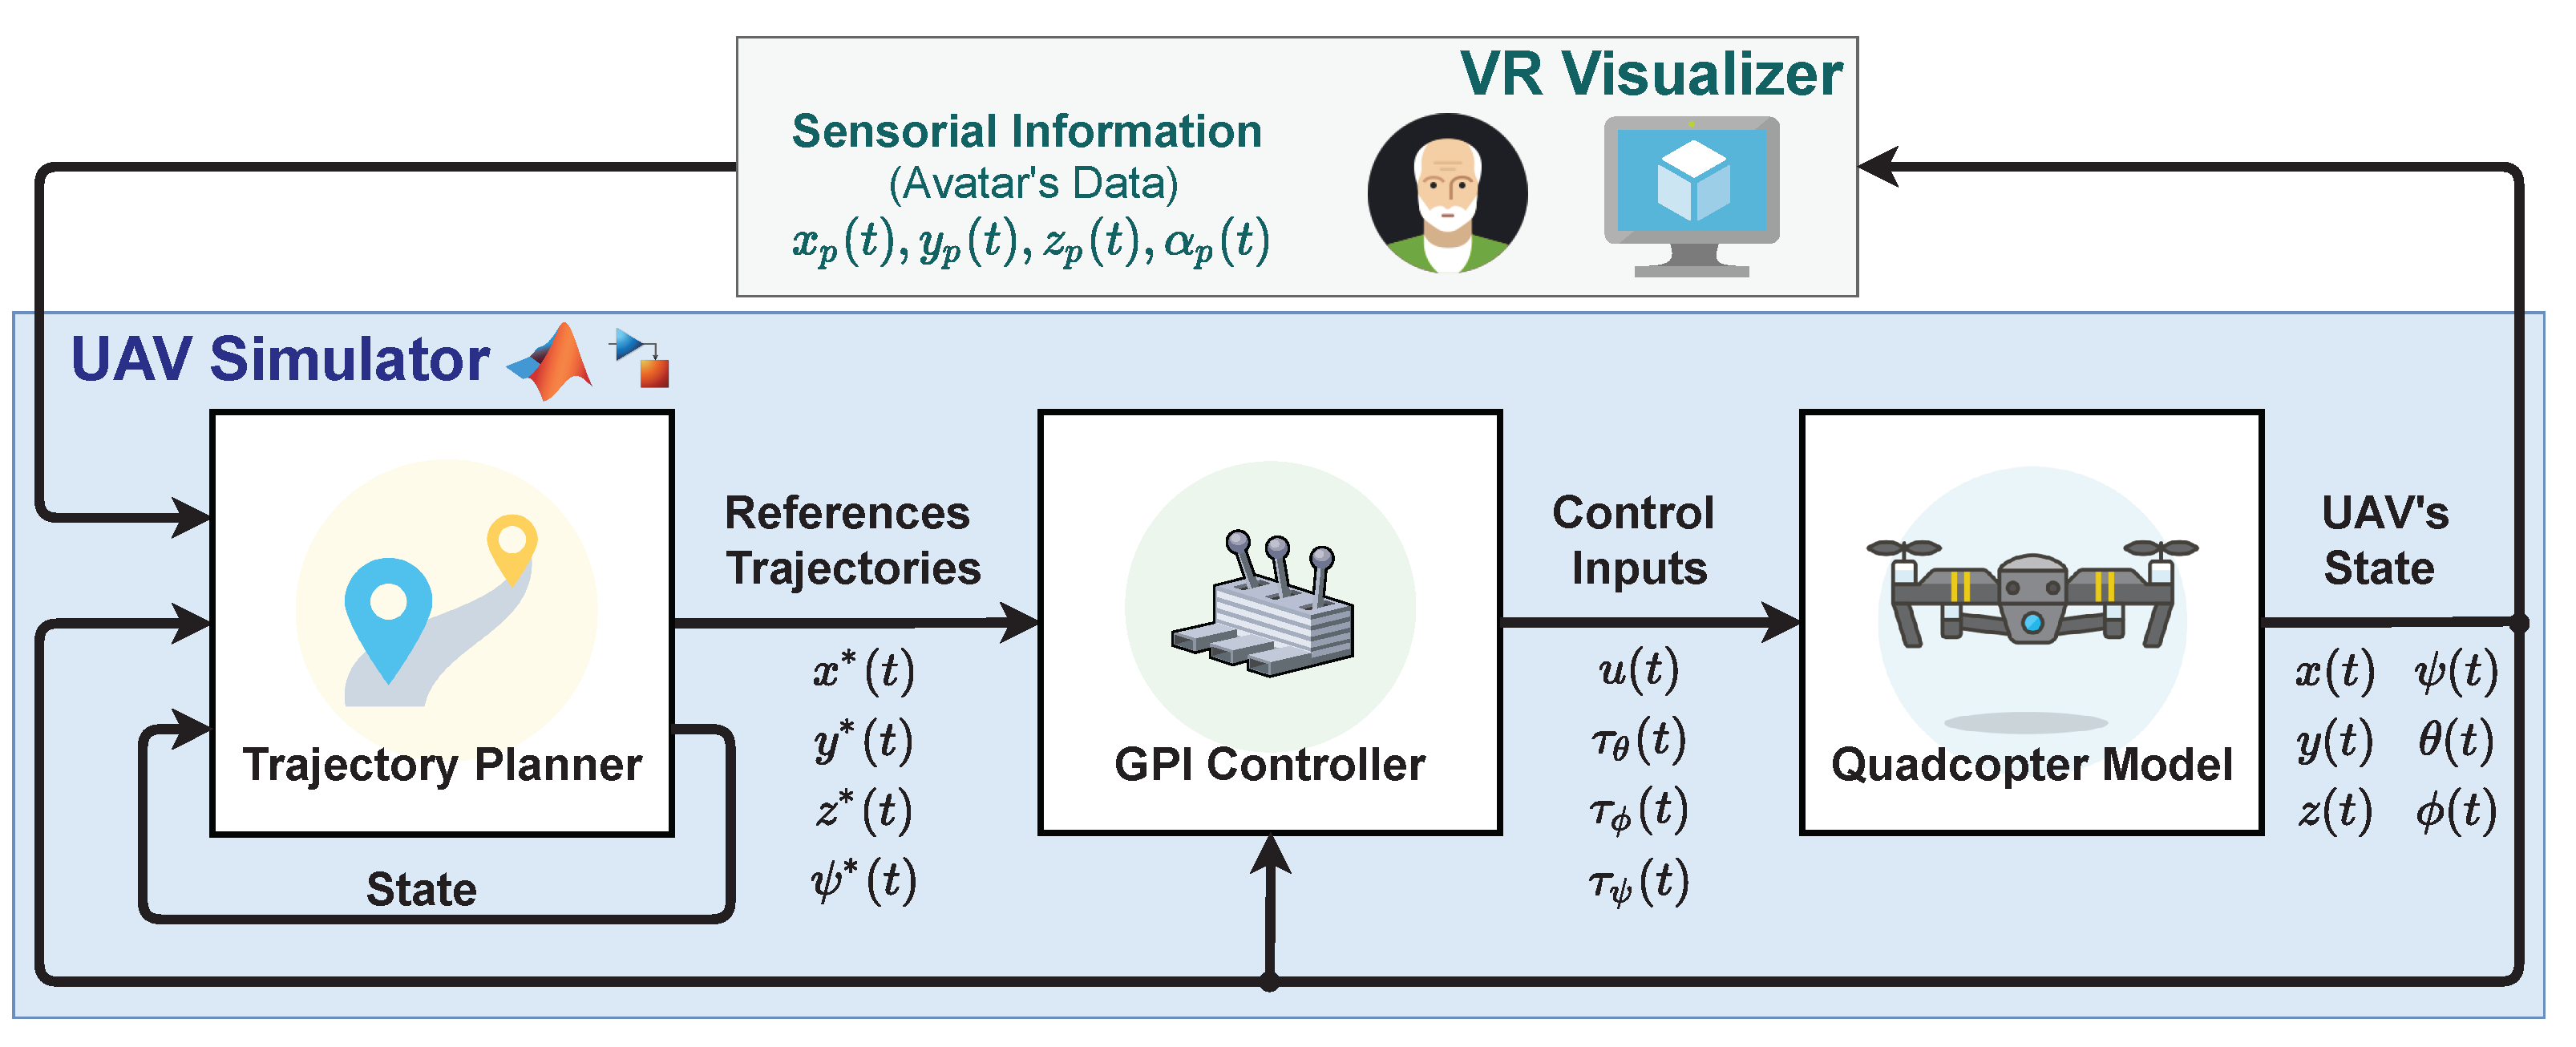
3. UAV Simulator
- Quadrotor’s Dynamic Model: It mathematically represents how the lift forces of the quadrotor change when the rotational speed of its four propellers are modified, thus achieving the three possible motions; pitch, roll and yaw. It was obtained following the Euler–Lagrange formulation according to [14] and can be consulted in [13,15]. Please note that the output of this component is the state of the UAV, its position and orientation, information that is sent to the VR Visualiser in order to reproduce the flight of the UAV by updating the position and orientation of a 3D virtual quadrotor.
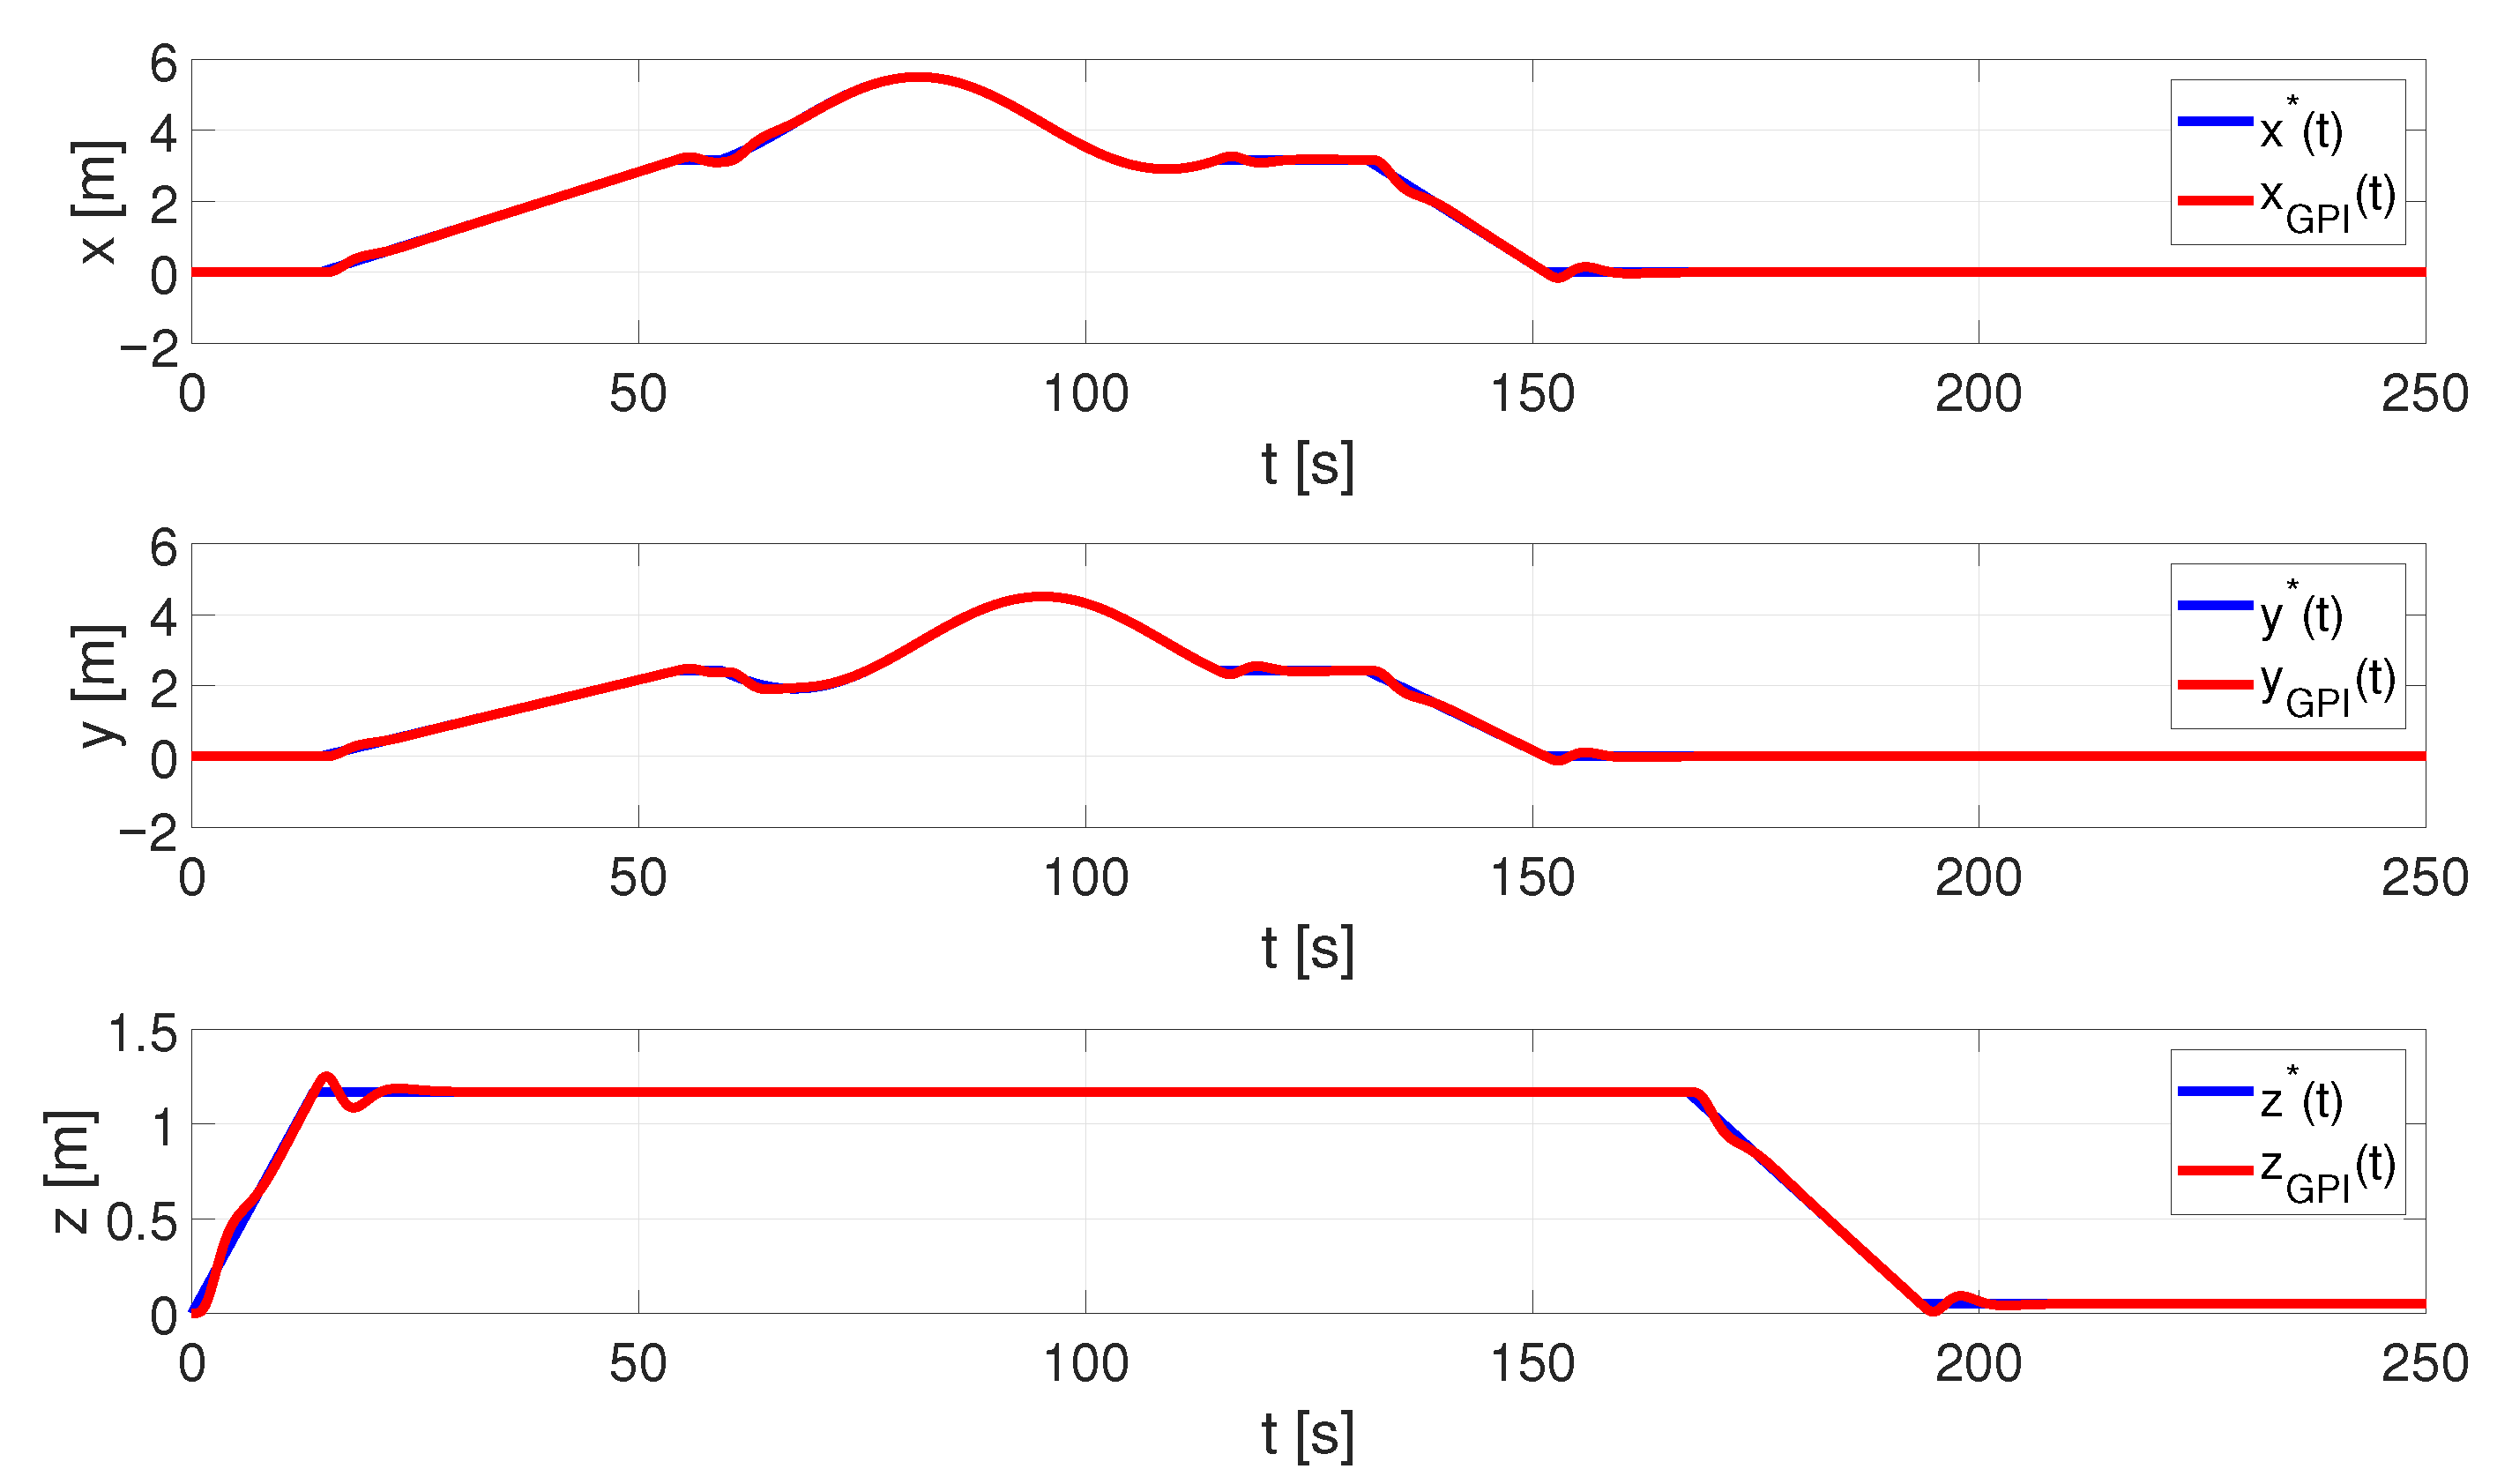
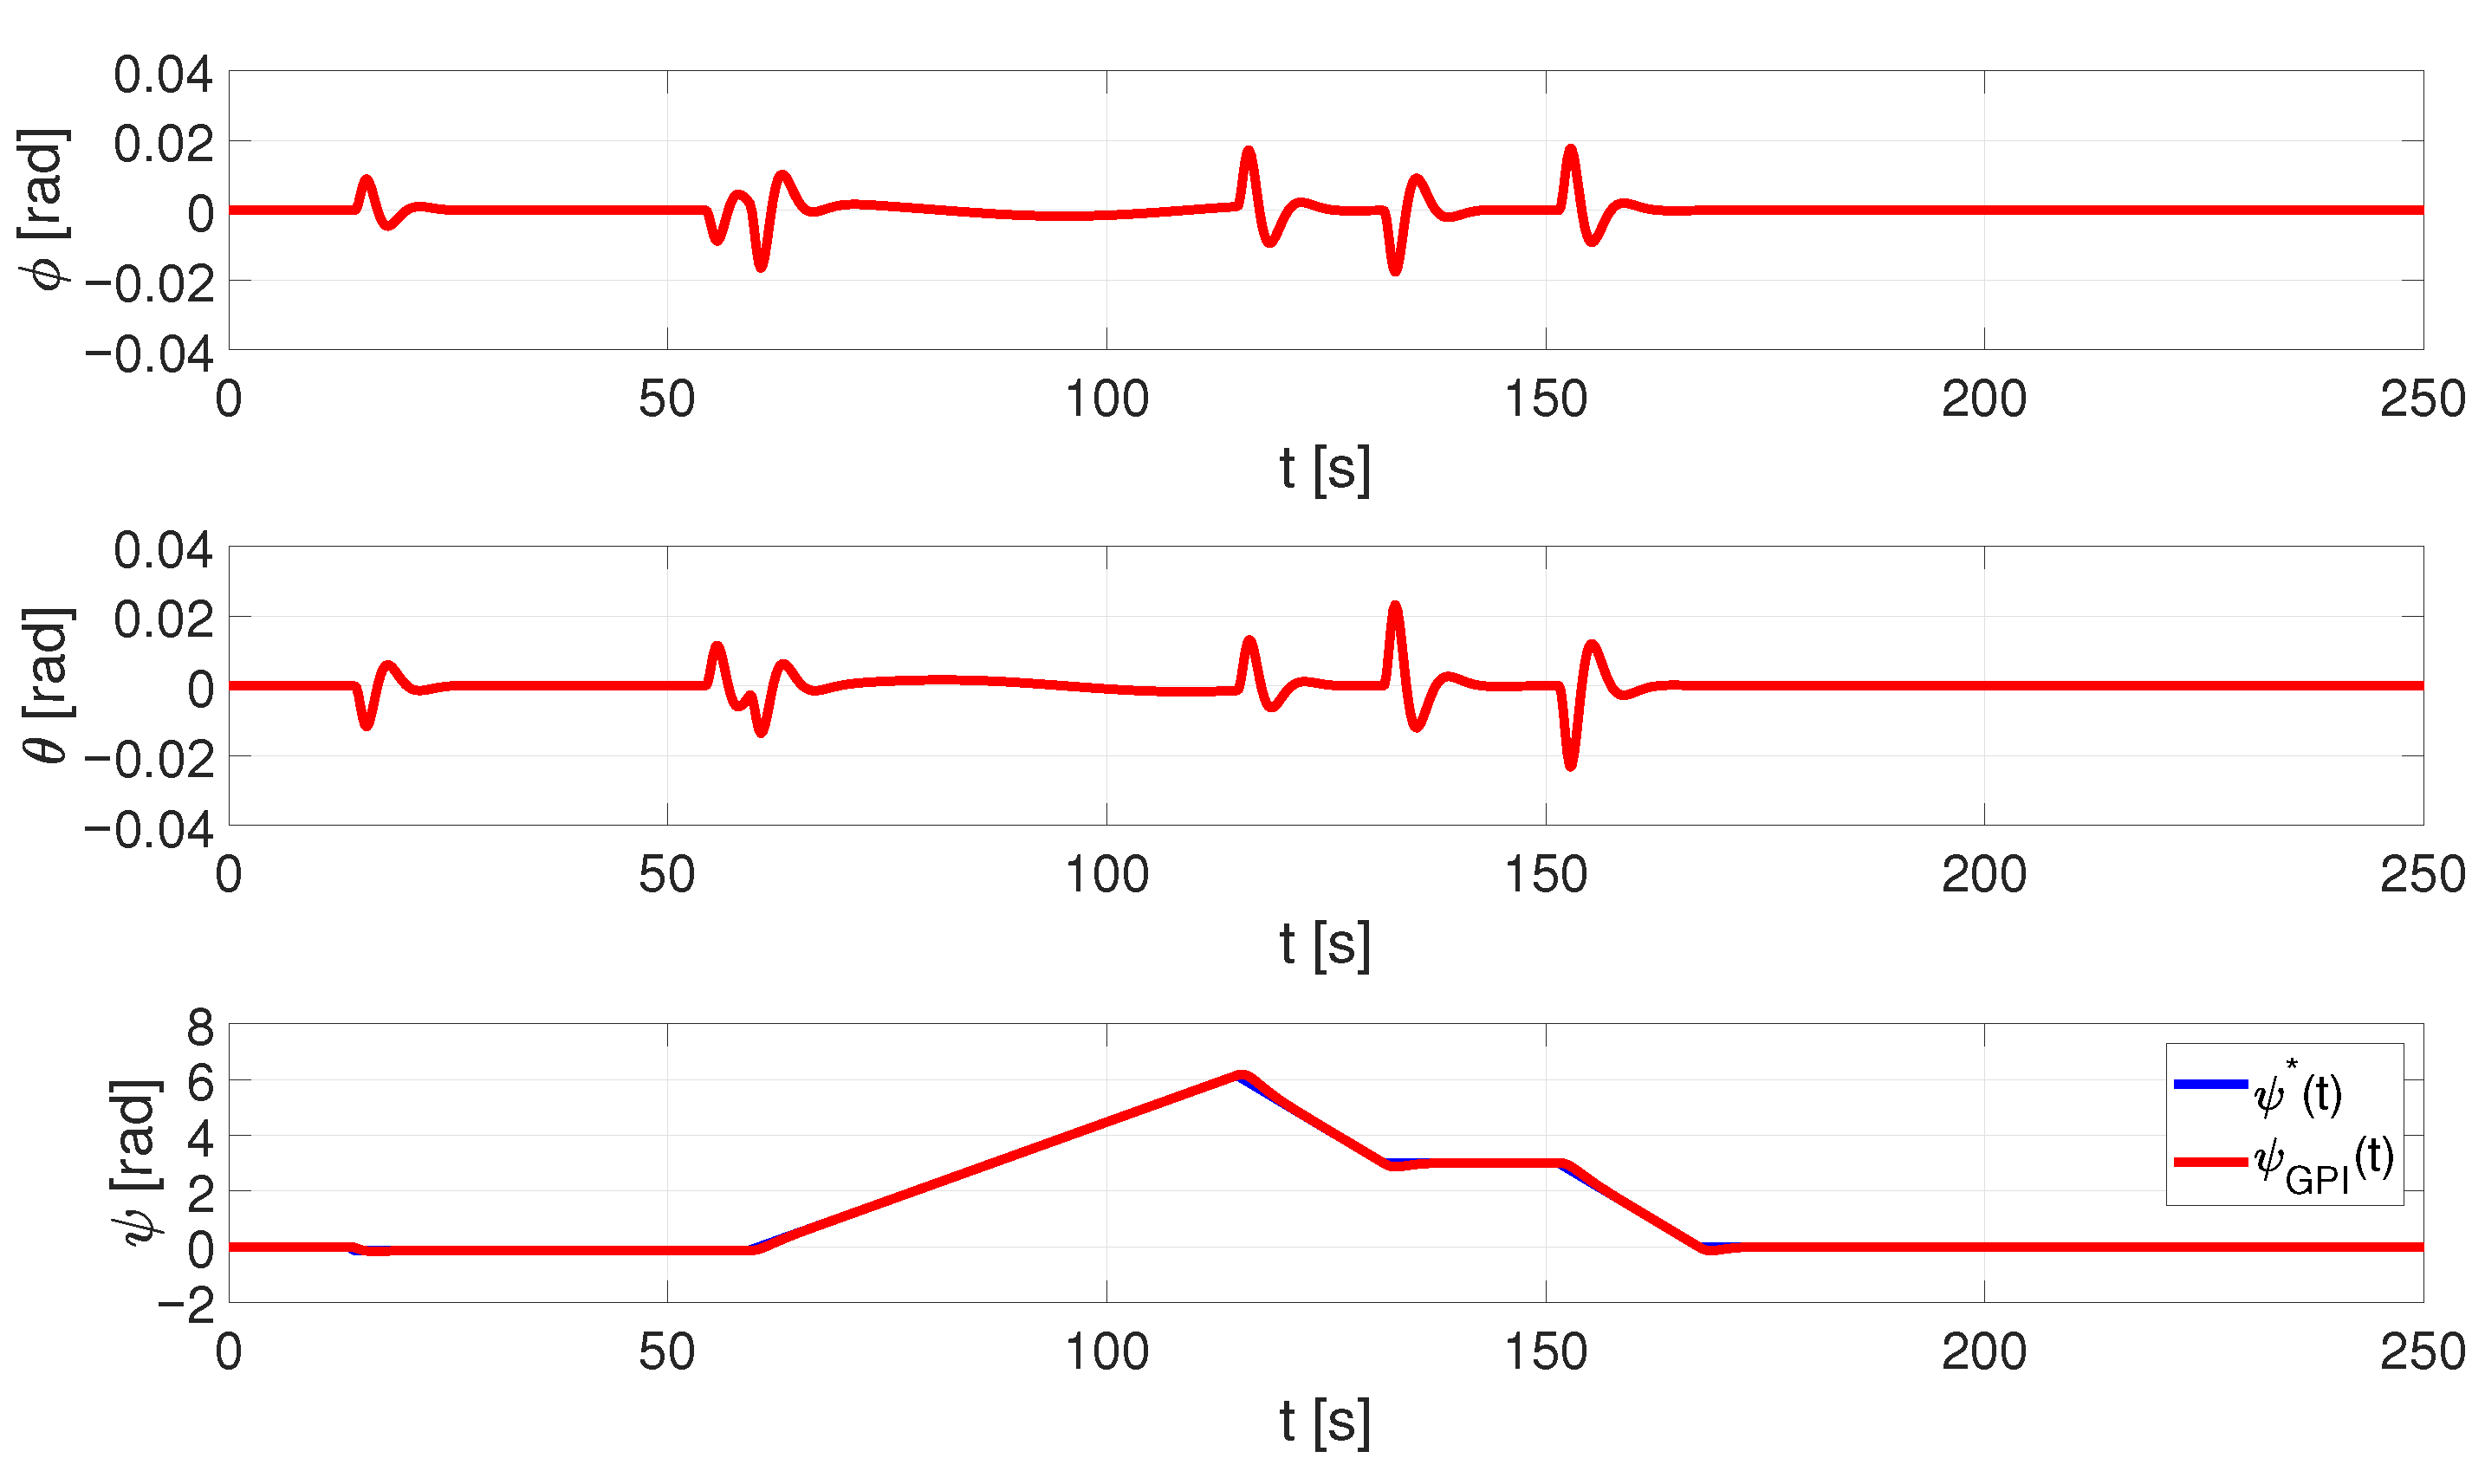
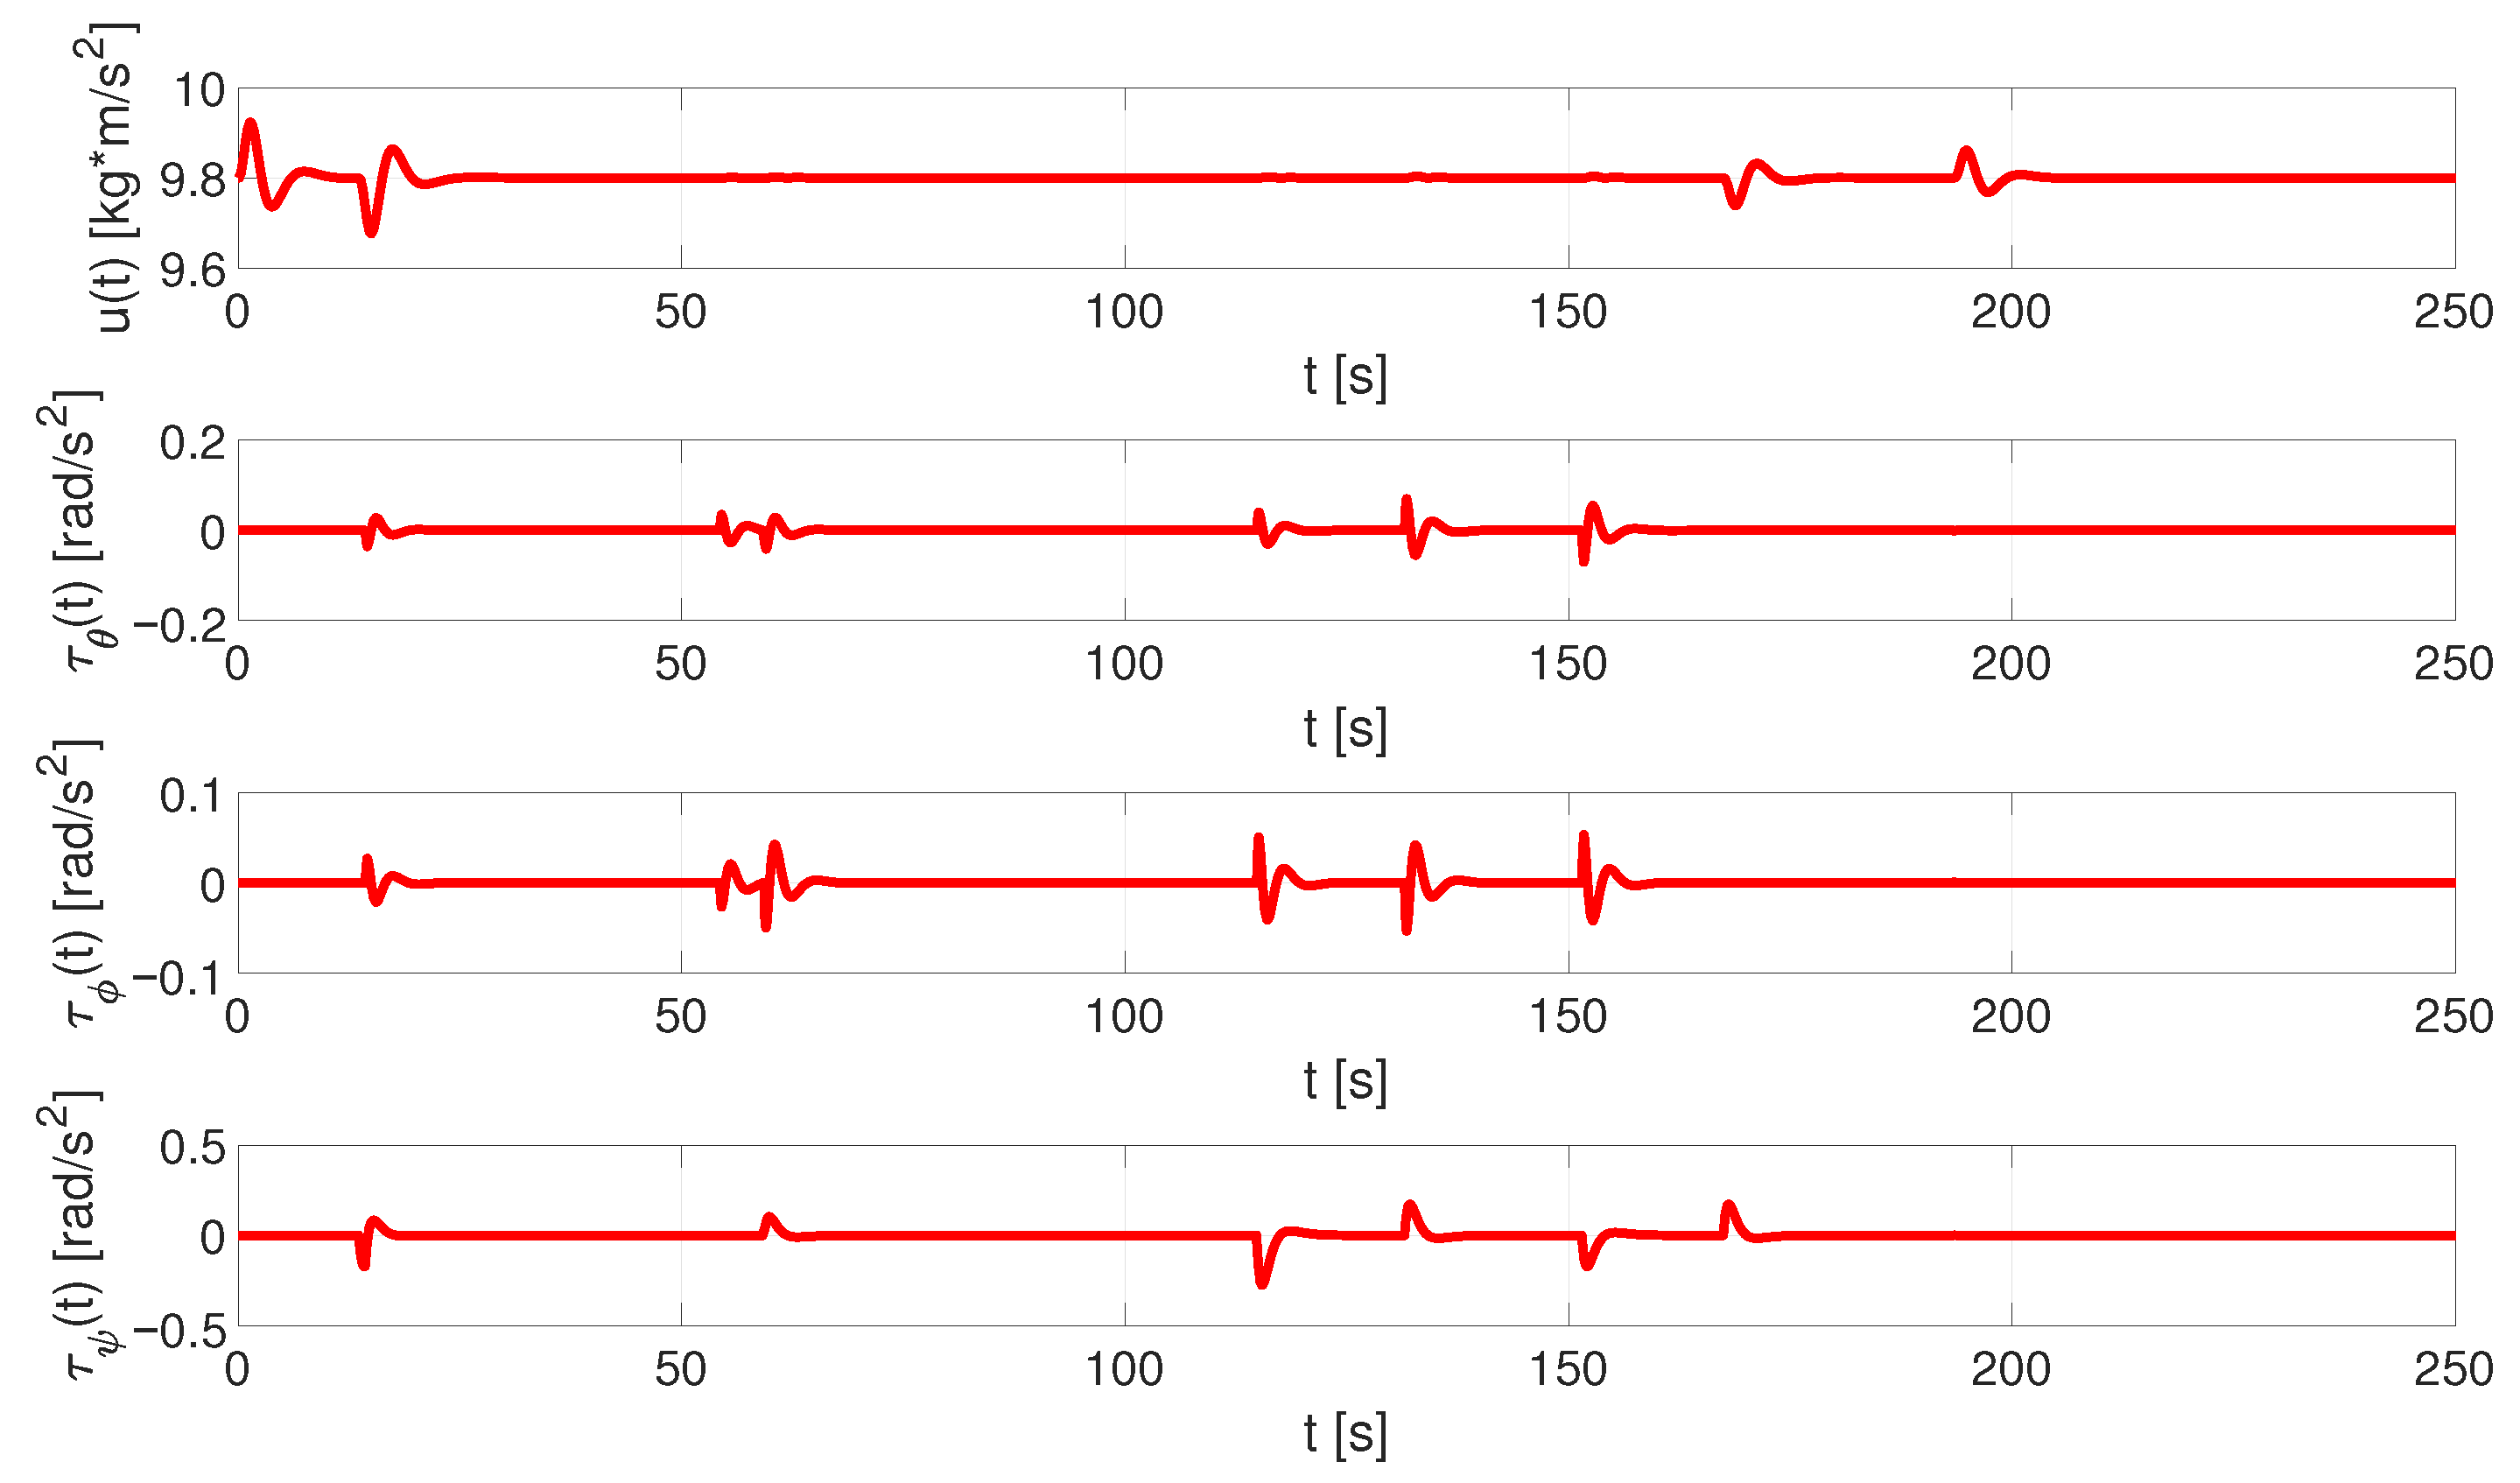
- Control Algorithm: It is used to calculate what inputs should be applied to the quadrotor model in order to follow a specific trajectory reference, thereby ensuring that the UAV is correctly positioned and oriented during the monitoring flight. For this component, we designed a generalised proportional integral (GPI) controller based on the flatness theory that demonstrated good results in both stabilisation and tracking tasks, even in the presence of atmospheric disturbances and noise measurements, improving the performance of a traditional PID controller [16,17,18,19,20,21,22,23]. The theoretical details of the GPI control scheme are described in [15].
- Trajectory Planner: On the basis of the person’s position and orientation, which are received from the avatar in the VR Visualiser, a state-machine-based planner generates the references for the position and yaw angle of the UAV for each of the manoeuvres that make up the monitoring process. In the current implementation of the planner, it is possible to configure the tracking trajectory to define the height at which the UAV flies, as well as the trajectory (circular or elliptical) it describes around the person, to suit the user’s preferences. Details of this planner can be found in [24].
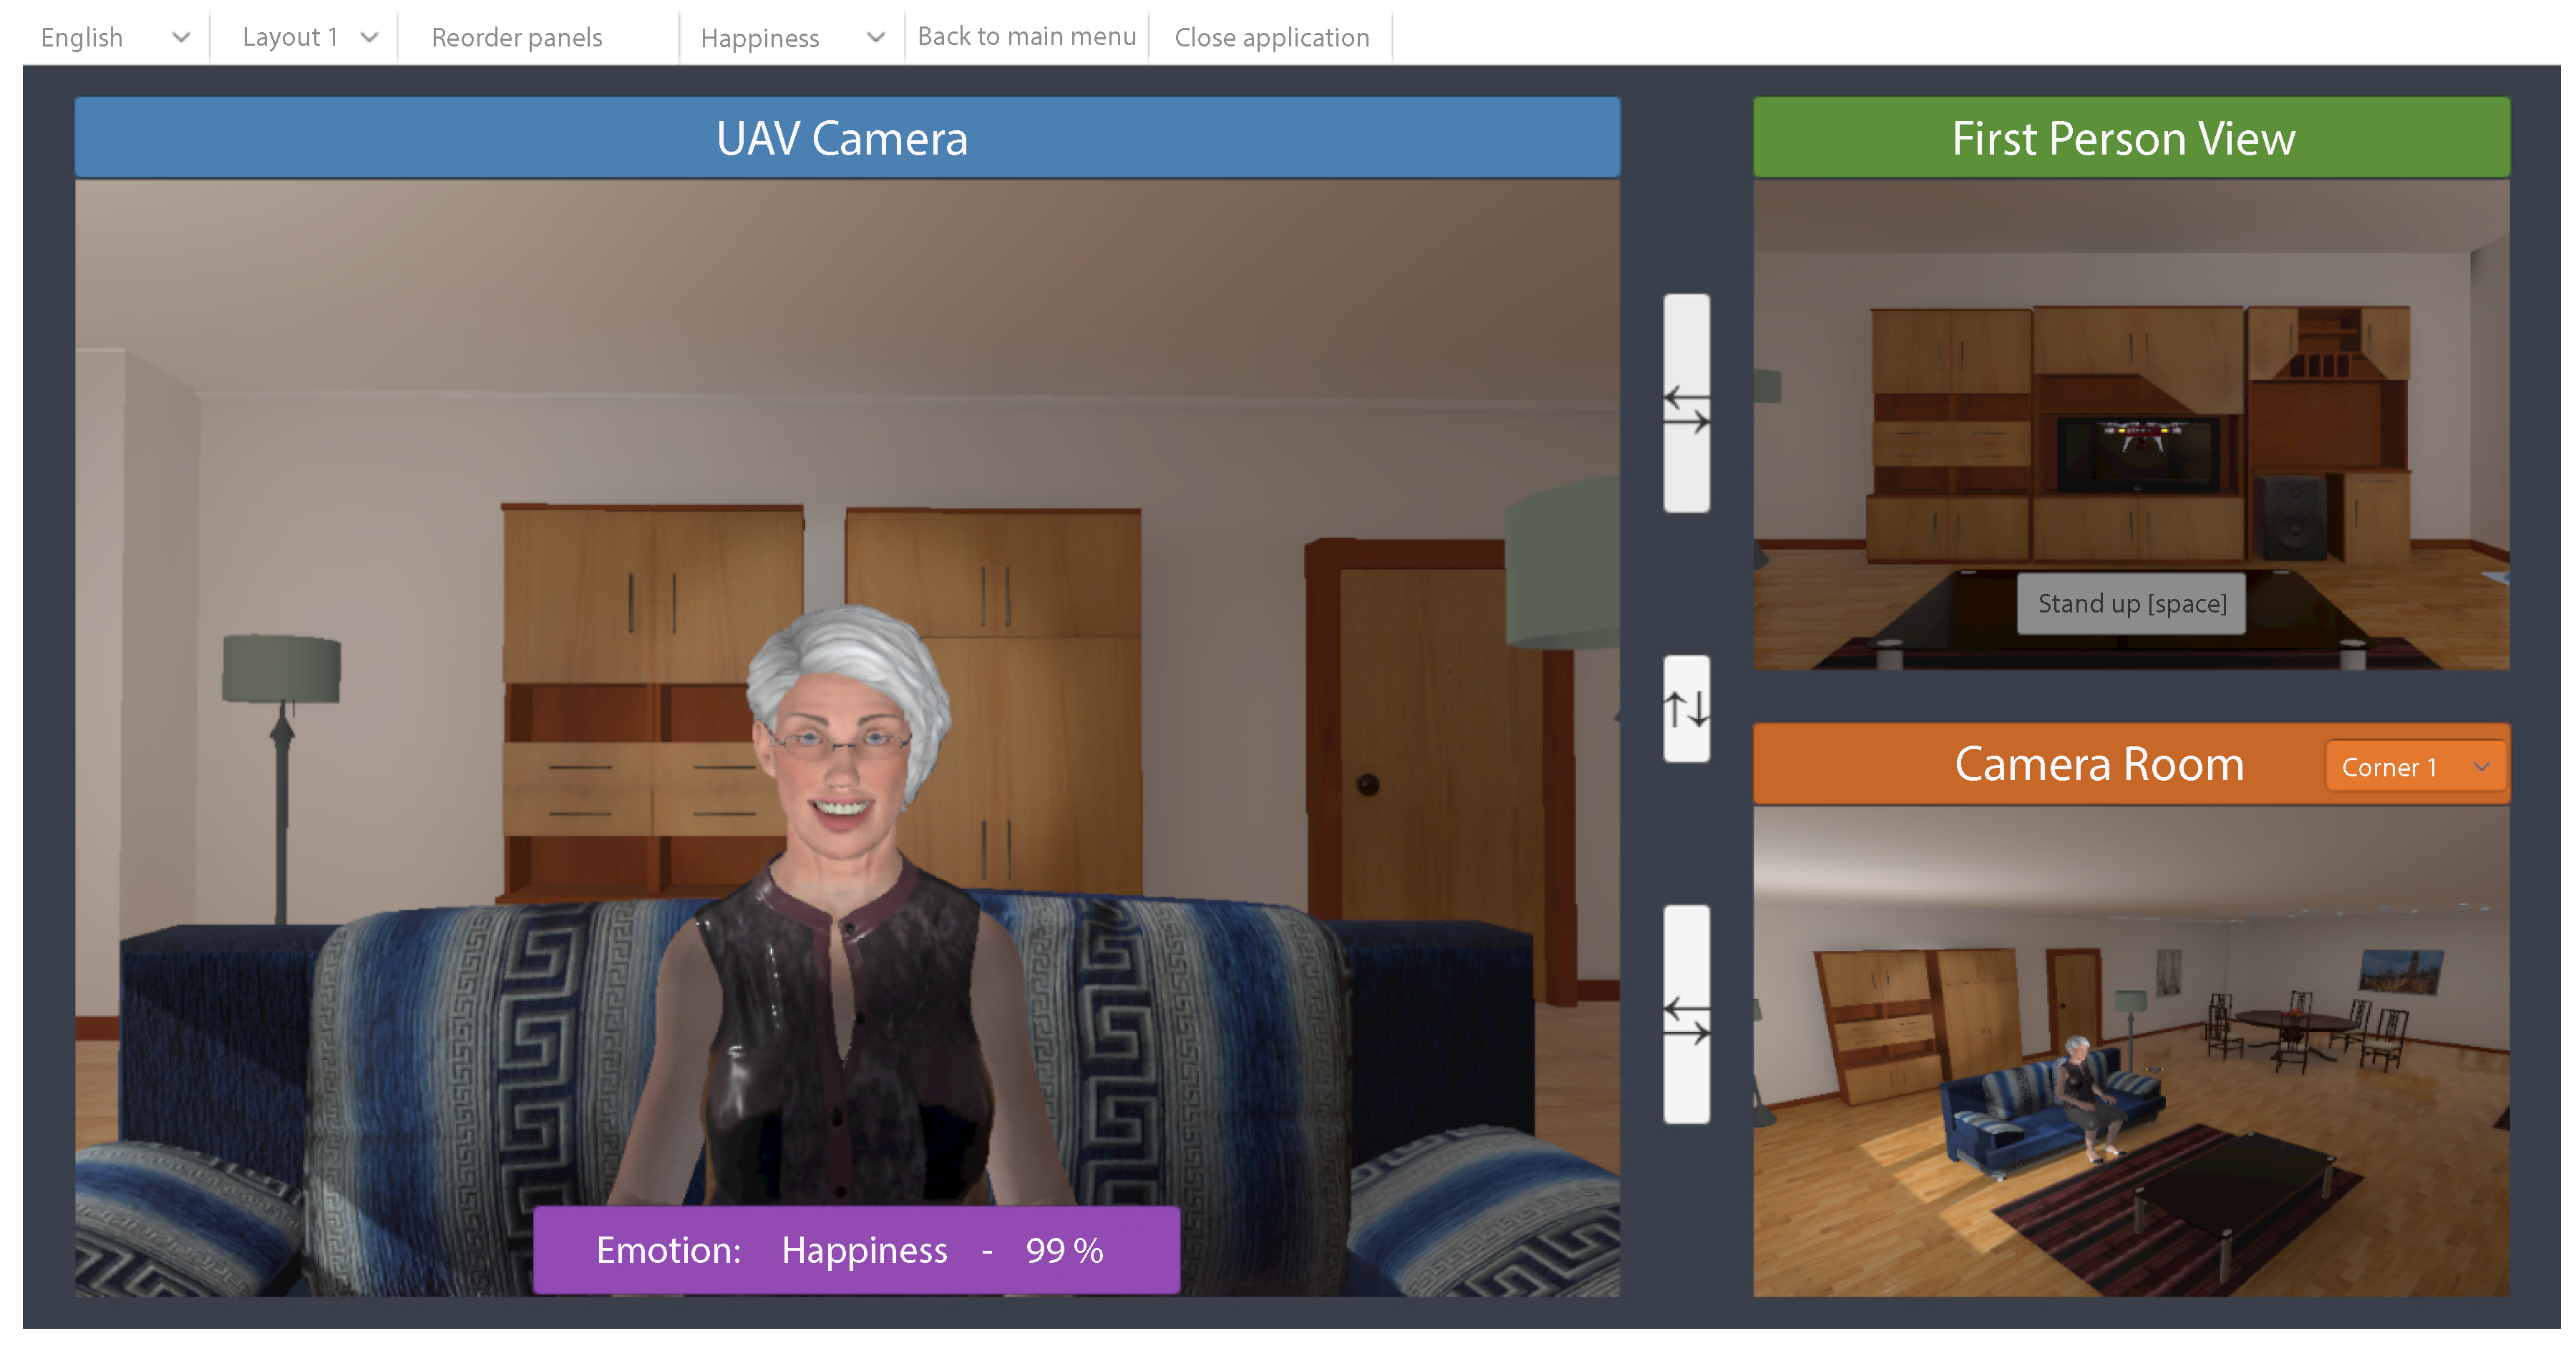
4. VR Visualiser
5. ER System
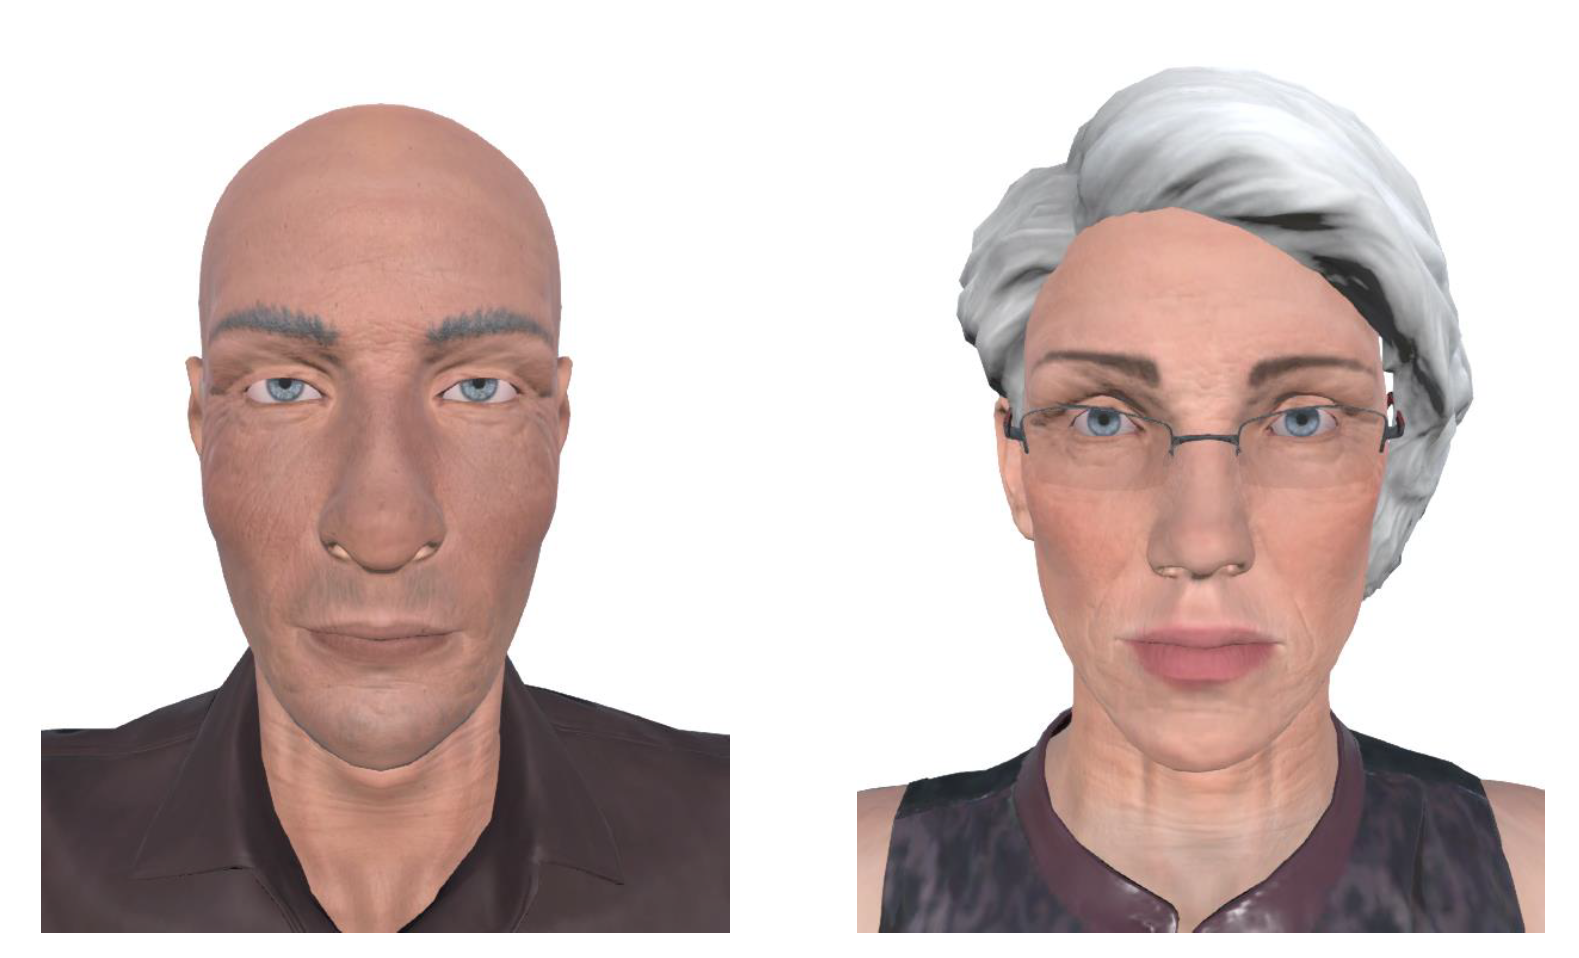
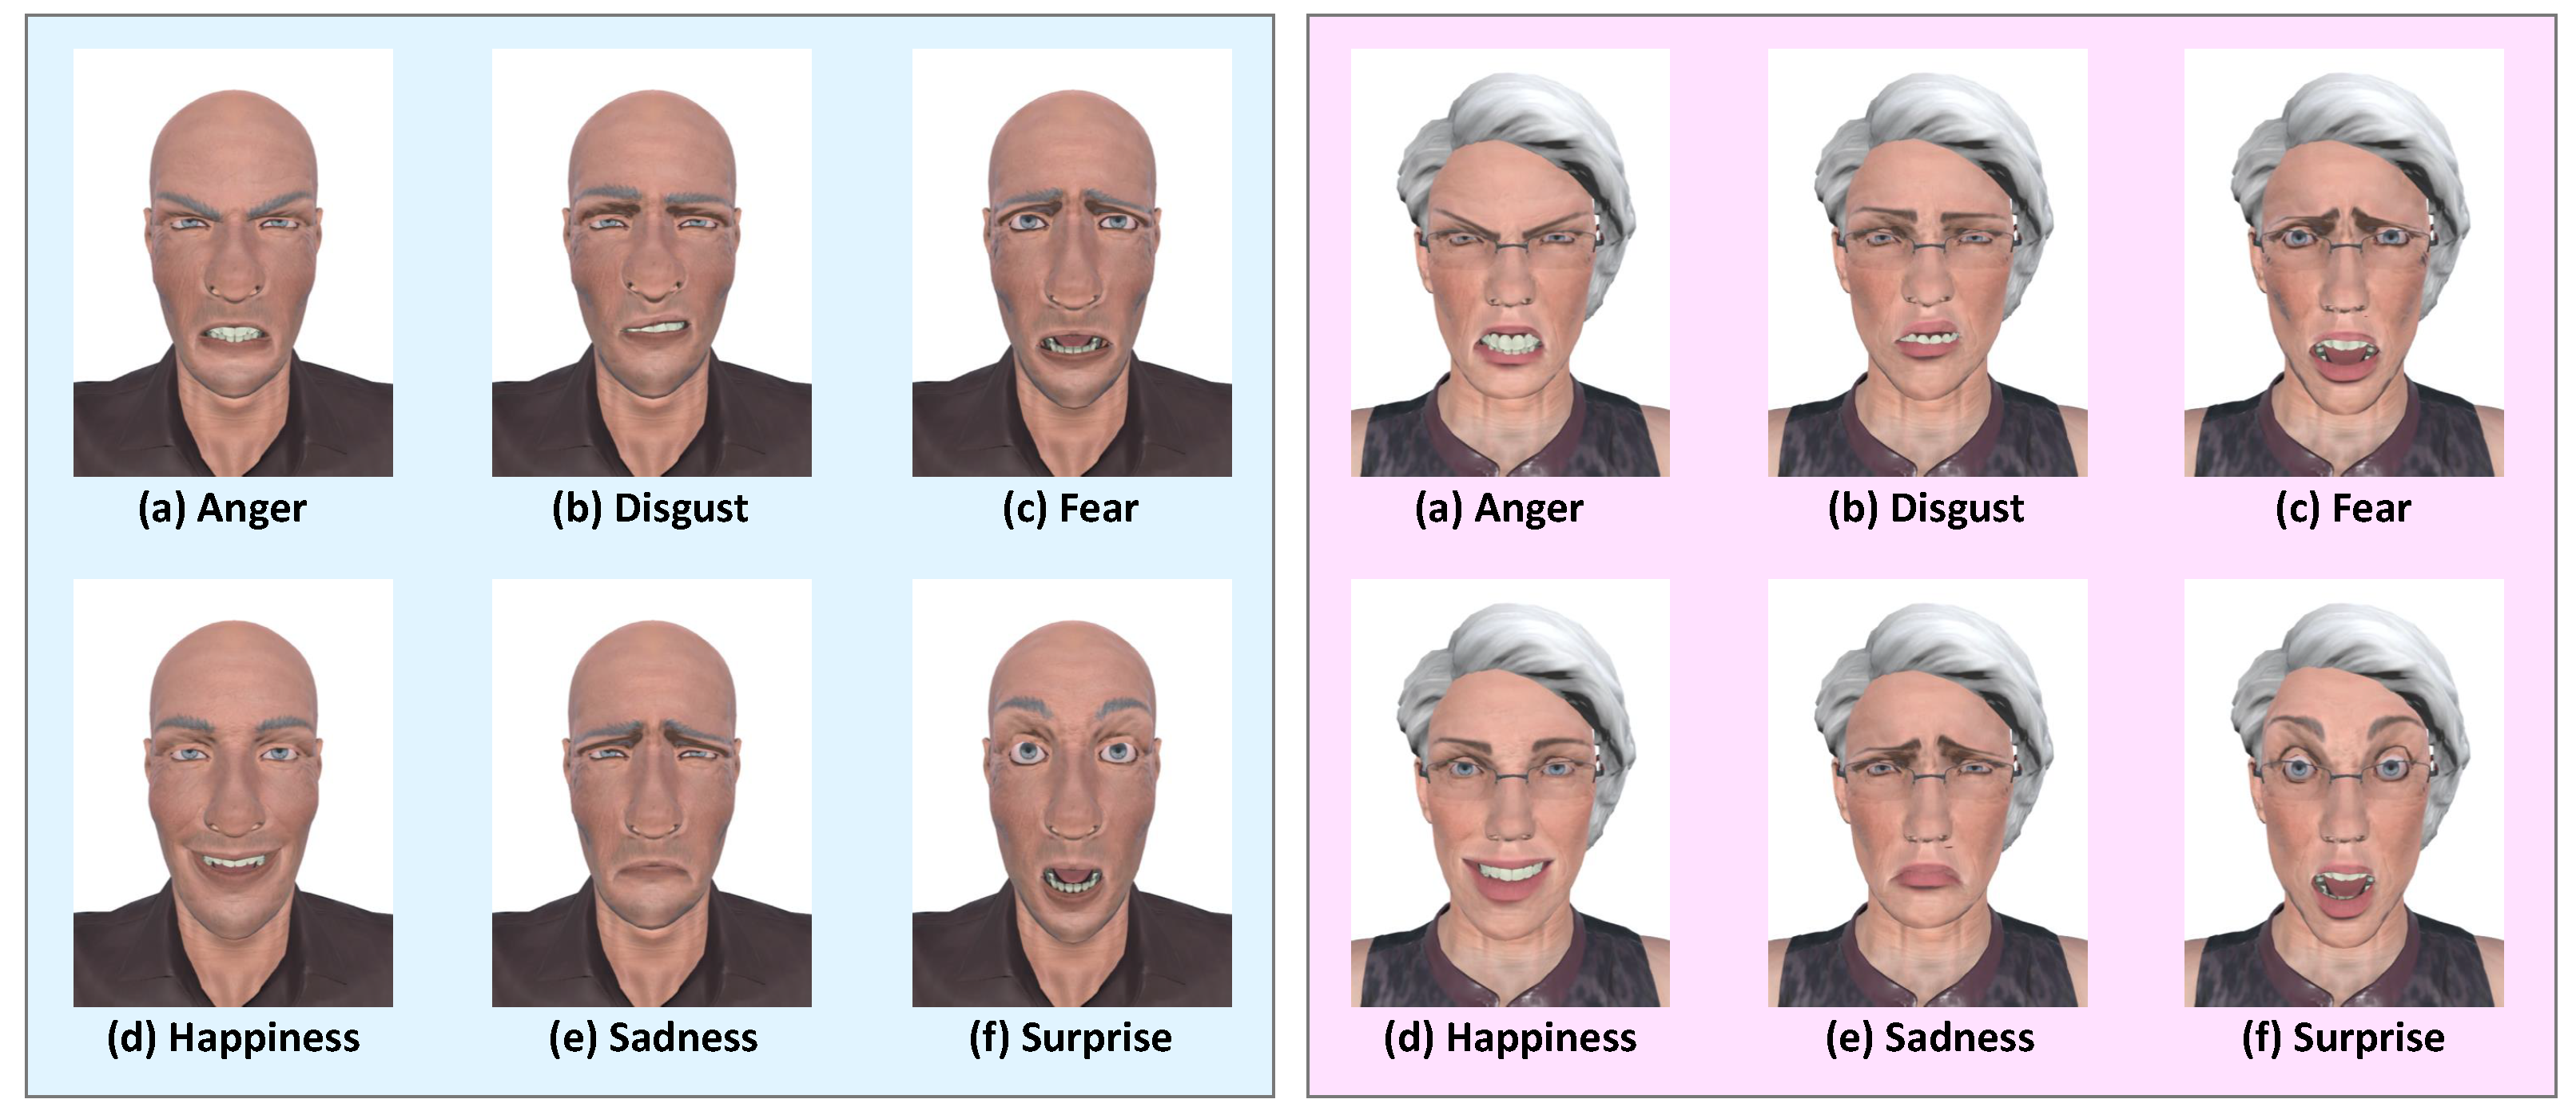
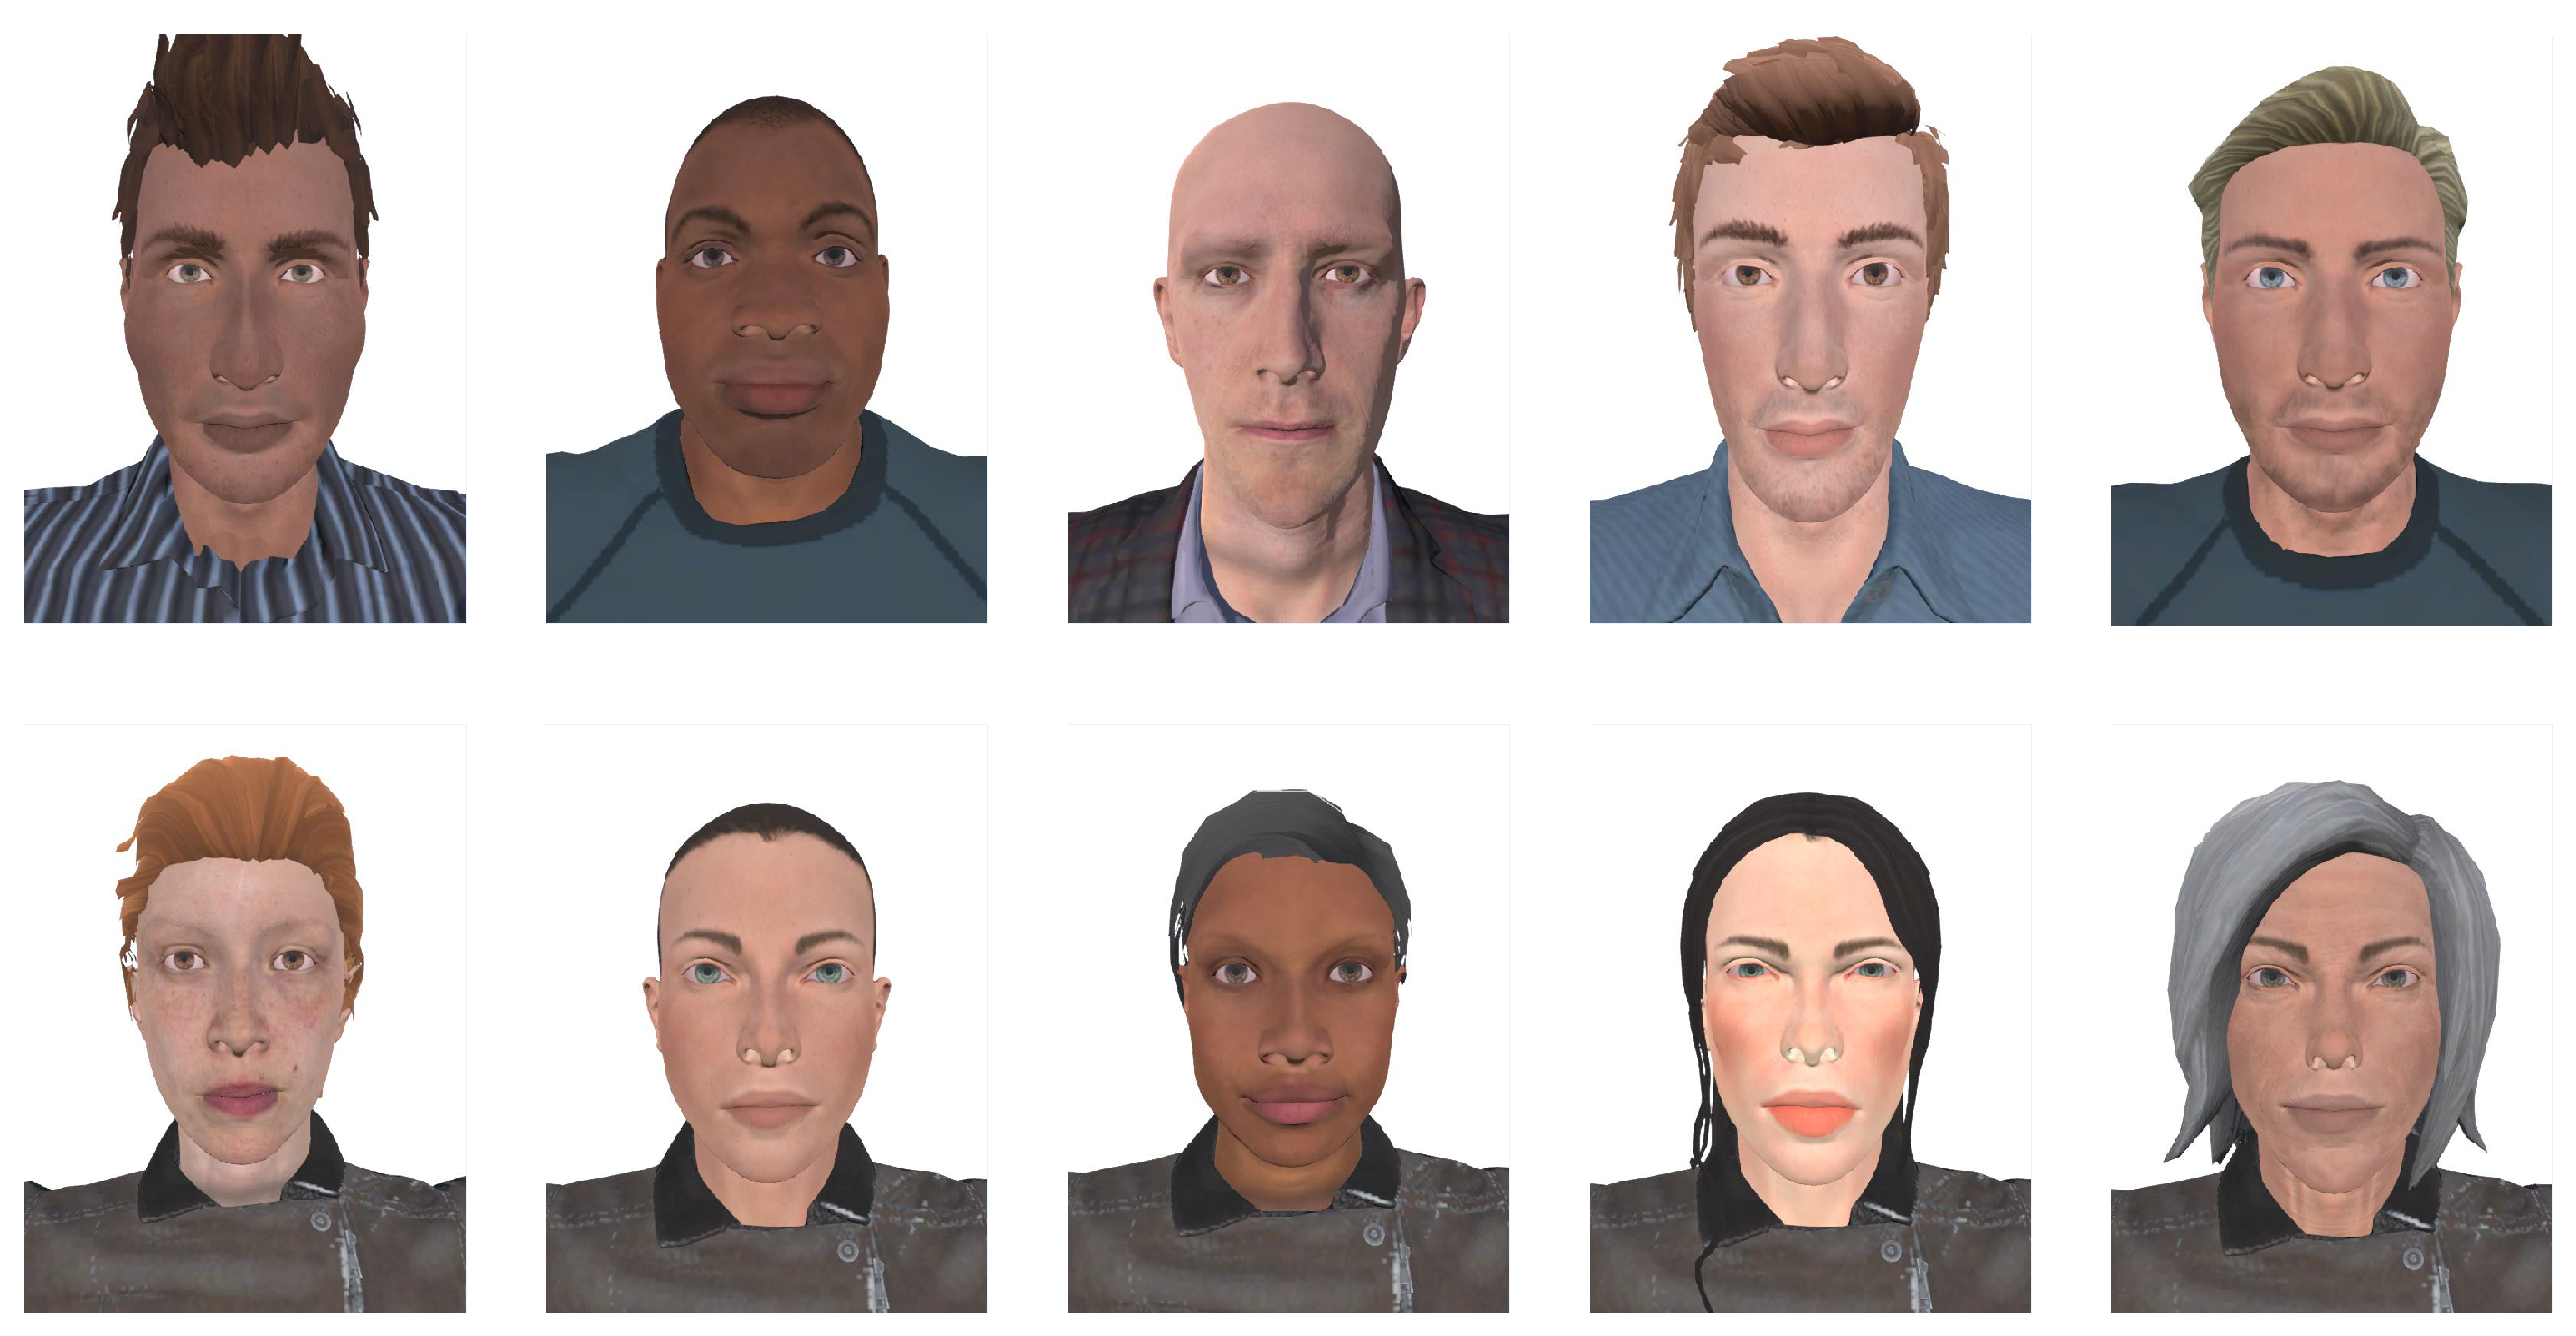
5.1. Design of Emotions in Avatars
5.2. Transitions Between Emotions
5.3. Face Detection Algorithm
5.3.1. Cascade Classifiers
Description
Functioning
5.3.2. Implemented Solution
5.4. Design of the Convolutional Neural Network (CNN)
5.4.1. Convolutional Neural Network
Description
Functioning
5.4.2. Implemented Solution
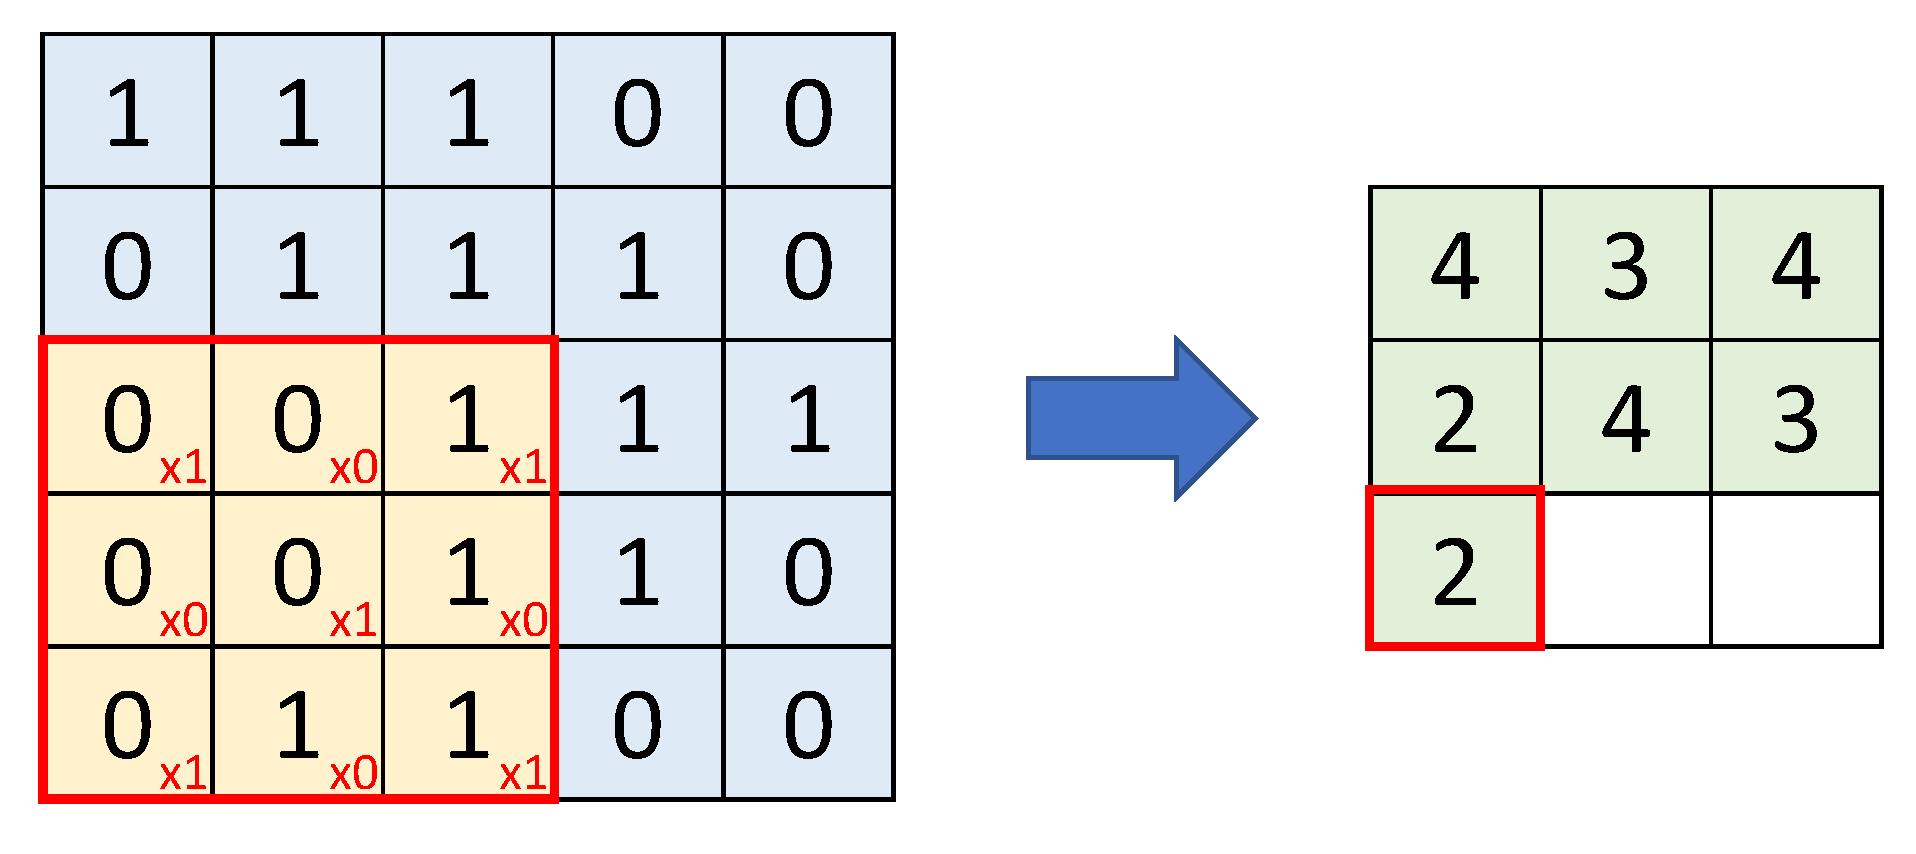
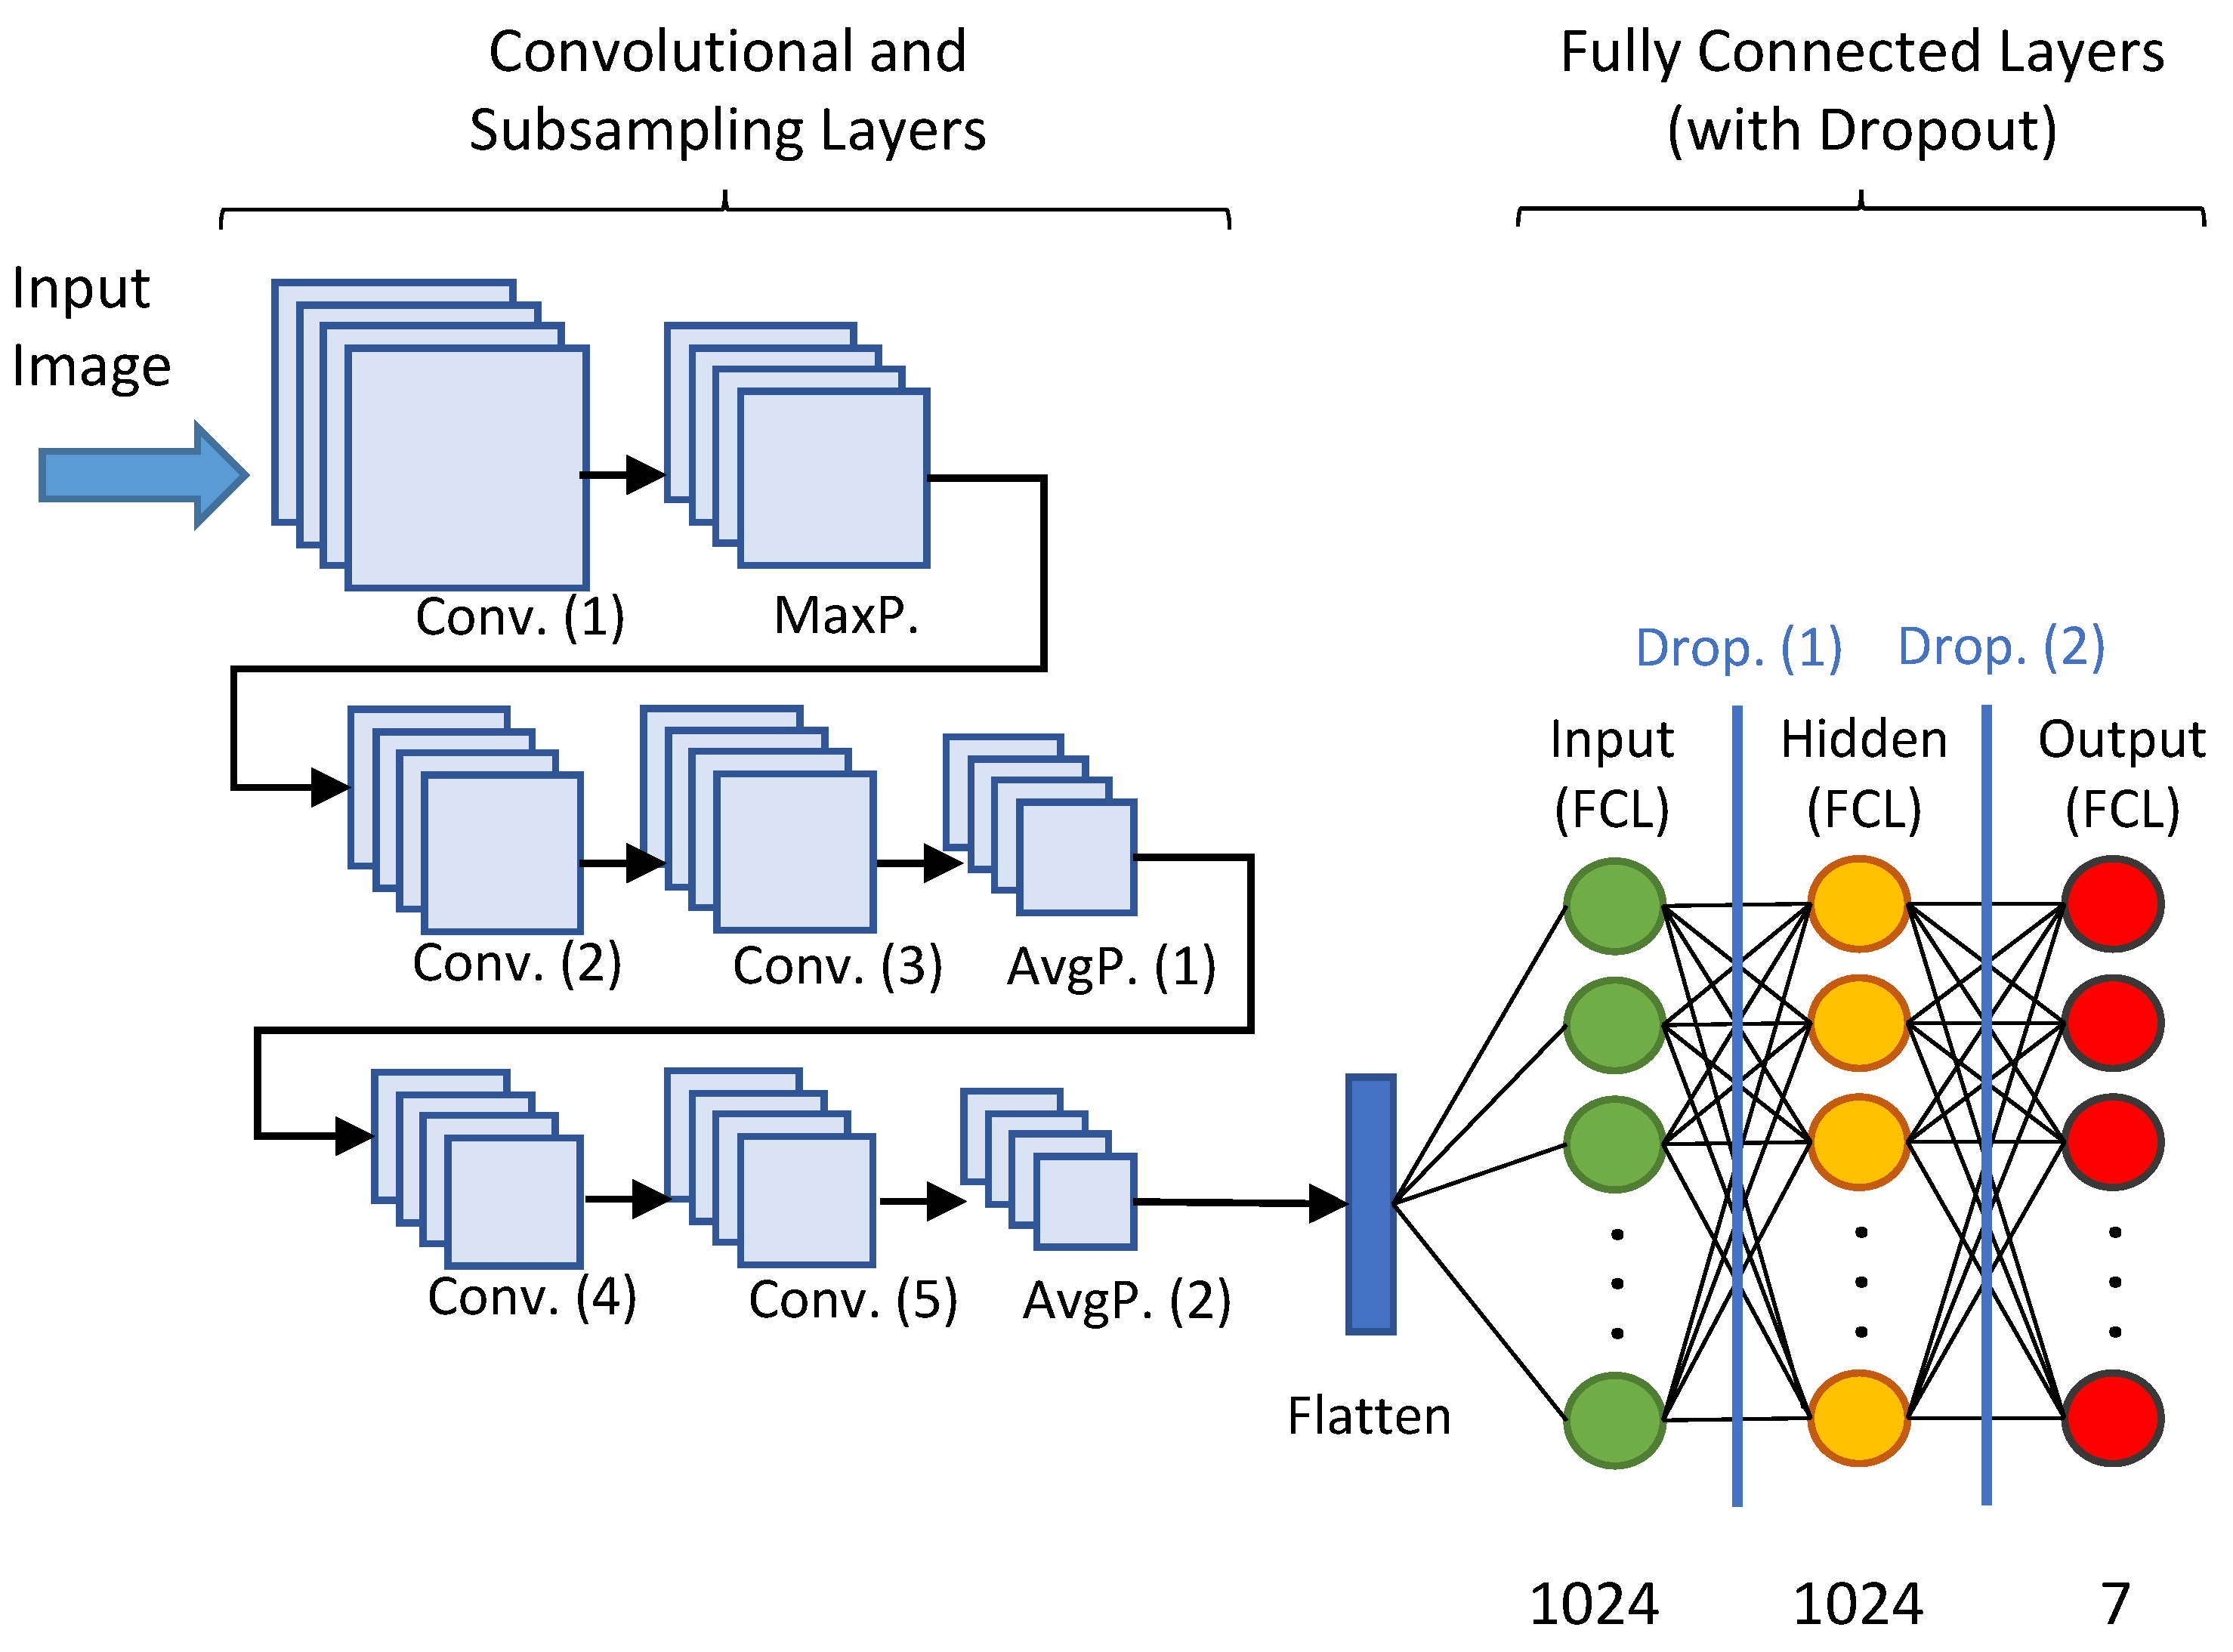
- Convolutional Layers: These are responsible for deriving features from the spatial dependencies between pixels in the image, generating multiple filters that produce a feature map. Several of these layers are usually included (sometimes back to back) to capture as much information as possible. The first layers detect simple shapes such as lines and curves while the later layers are more specialised and can recognise complex shapes. However, it is not advisable to add too many layers because, at some point, they do not significantly improve the model and only increase its complexity and computational time.
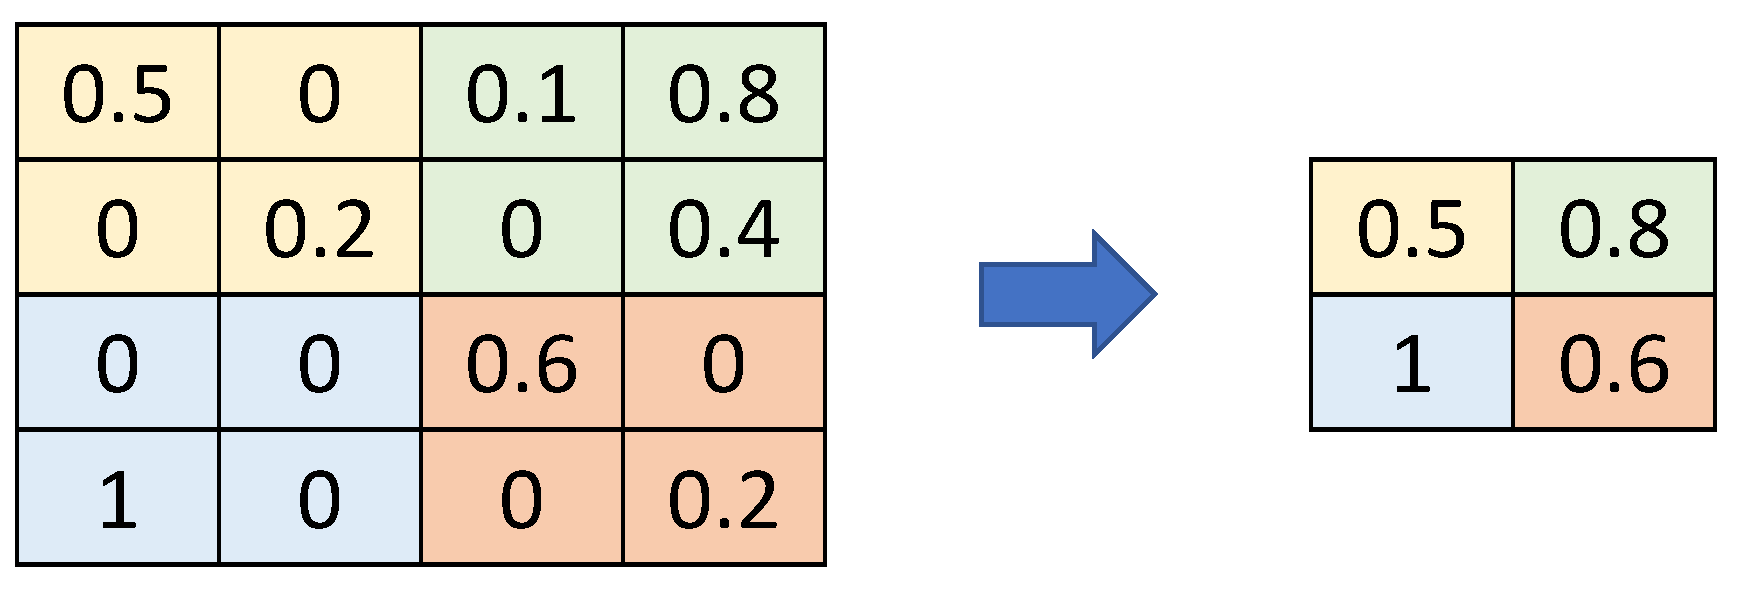
- Subsampling Layers (such as MaxPooling or AveragePooling): These are included after the convolutional layers to reduce the number of parameters generated and subsequently reduce the overfitting of the model.
- Flatten Layer: It converts the output of the convolutions into a vector used as the input of the final stage of the network, the fully connected layers.
- Fully Connected Layers (FCL): These are typically used to calculate probabilities and have an input layer, one or more hidden layers and an output layer.
- Dropout Layers: These are placed between the fully connected layers to remove a percentage of their neurons and reduce overfitting.
- “Conv (1)”: The first convolutional layer has 64 kernels and uses ReLU as an activation function. Its input size is 48 × 48 × 1 as the input images are 48 pixels wide by 48 pixels high with only one colour channel (black and white).
- “MaxP”: A MaxPooling layer with two displacement units.
- “Conv (2)”: A second convolutional layer with 64 kernels and ReLU as activation function.
- “Conv (3)”: A third convolutional layer just like the previous one.
- “AvgP (1)”: A first AveragePooling layer with two displacement units.
- “Conv (4)”: A fourth convolutional layer with 128 kernels and ReLU as activation function.
- “Conv (5)”: A fifth convolutional layer identical to the previous one.
- “AvgP (2)”: A second AveragePooling layer with two displacement units
- “Flatten”: A layer which takes the output from the convolutional layers and converts it to an input vector for the fully connected layers where the classification is finished.
- “Input (FCL)”: The first fully connected layer with 1024 neurons which takes the inputs from the feature analysis and applies the weights to predict the correct label.
- “Drop (1)”: A first Dropout layer to get rid of 20% of the neurons and reduce overfitting.
- “Hidden (FCL)”: A hidden fully connected layer with the same number of neurons as the input.
- “Drop (2)”: A second layer of Dropout with the same characteristics as the previous one.
- “Output (FCL) ”: The output layer where a Softmax function is run to convert the output into a probability distribution of size 7 (equal to the number of classes to be classified, i.e., the six basic emotions plus neutral).
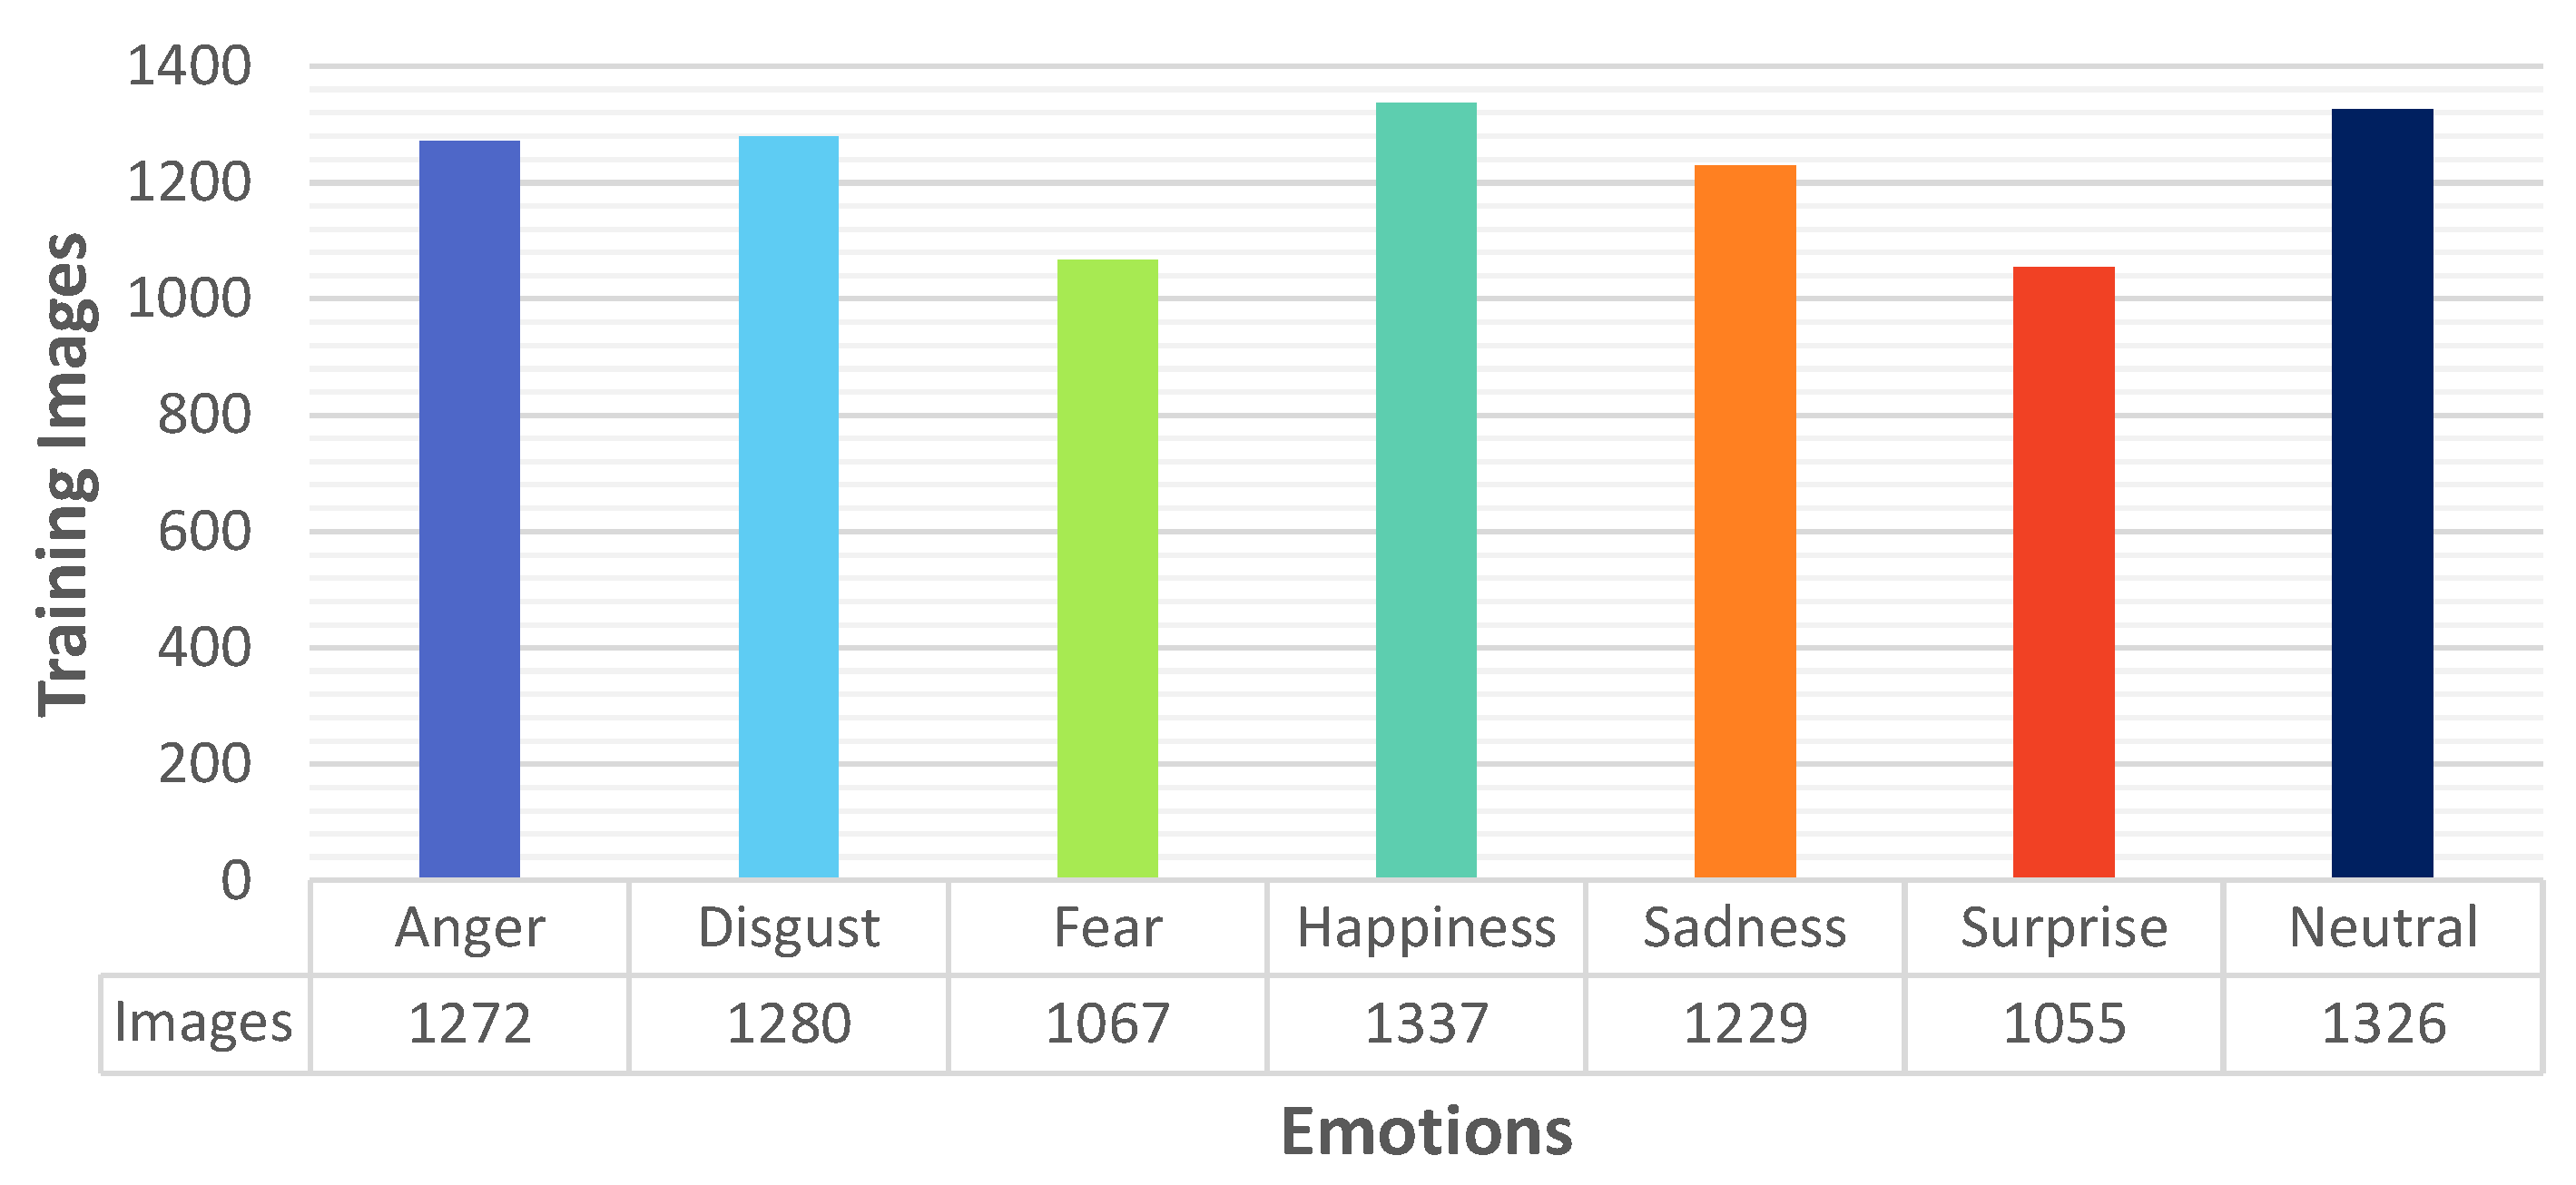
5.5. Definition of Neural Network Training
6. Experimental Results
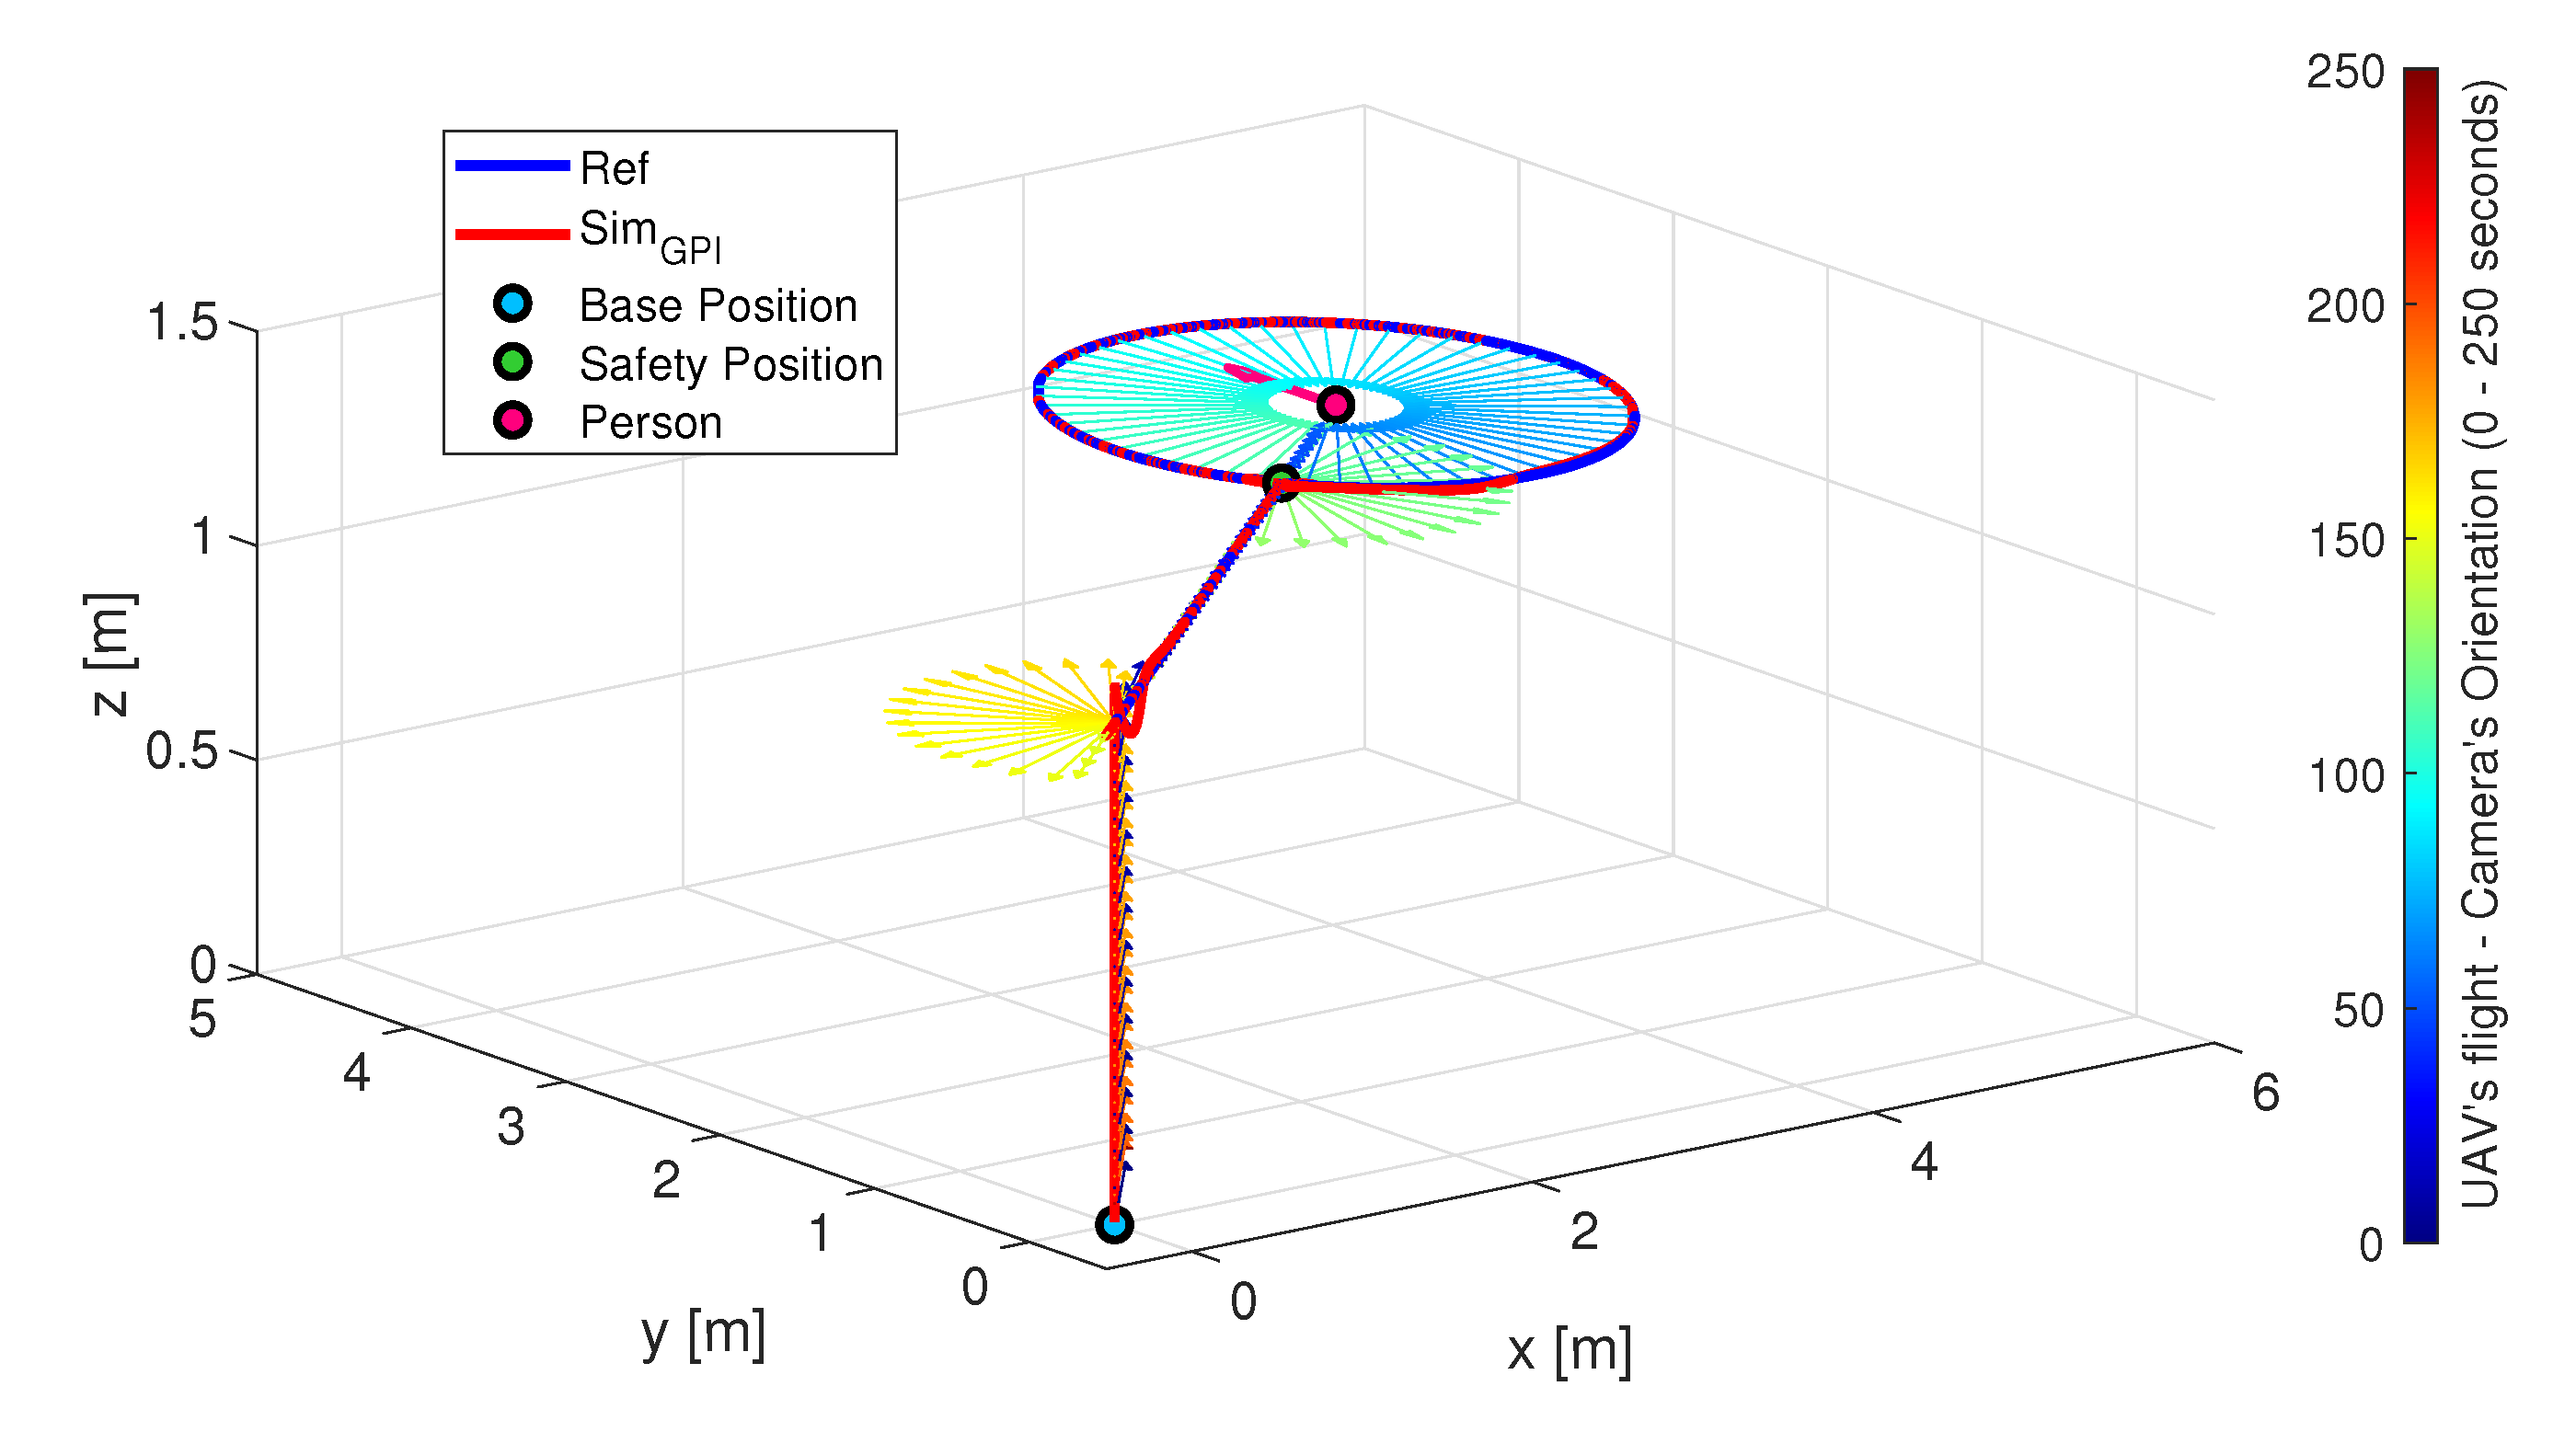
6.1. UAV Simulator Data
6.2. Integration of the ER System into the VR Platform
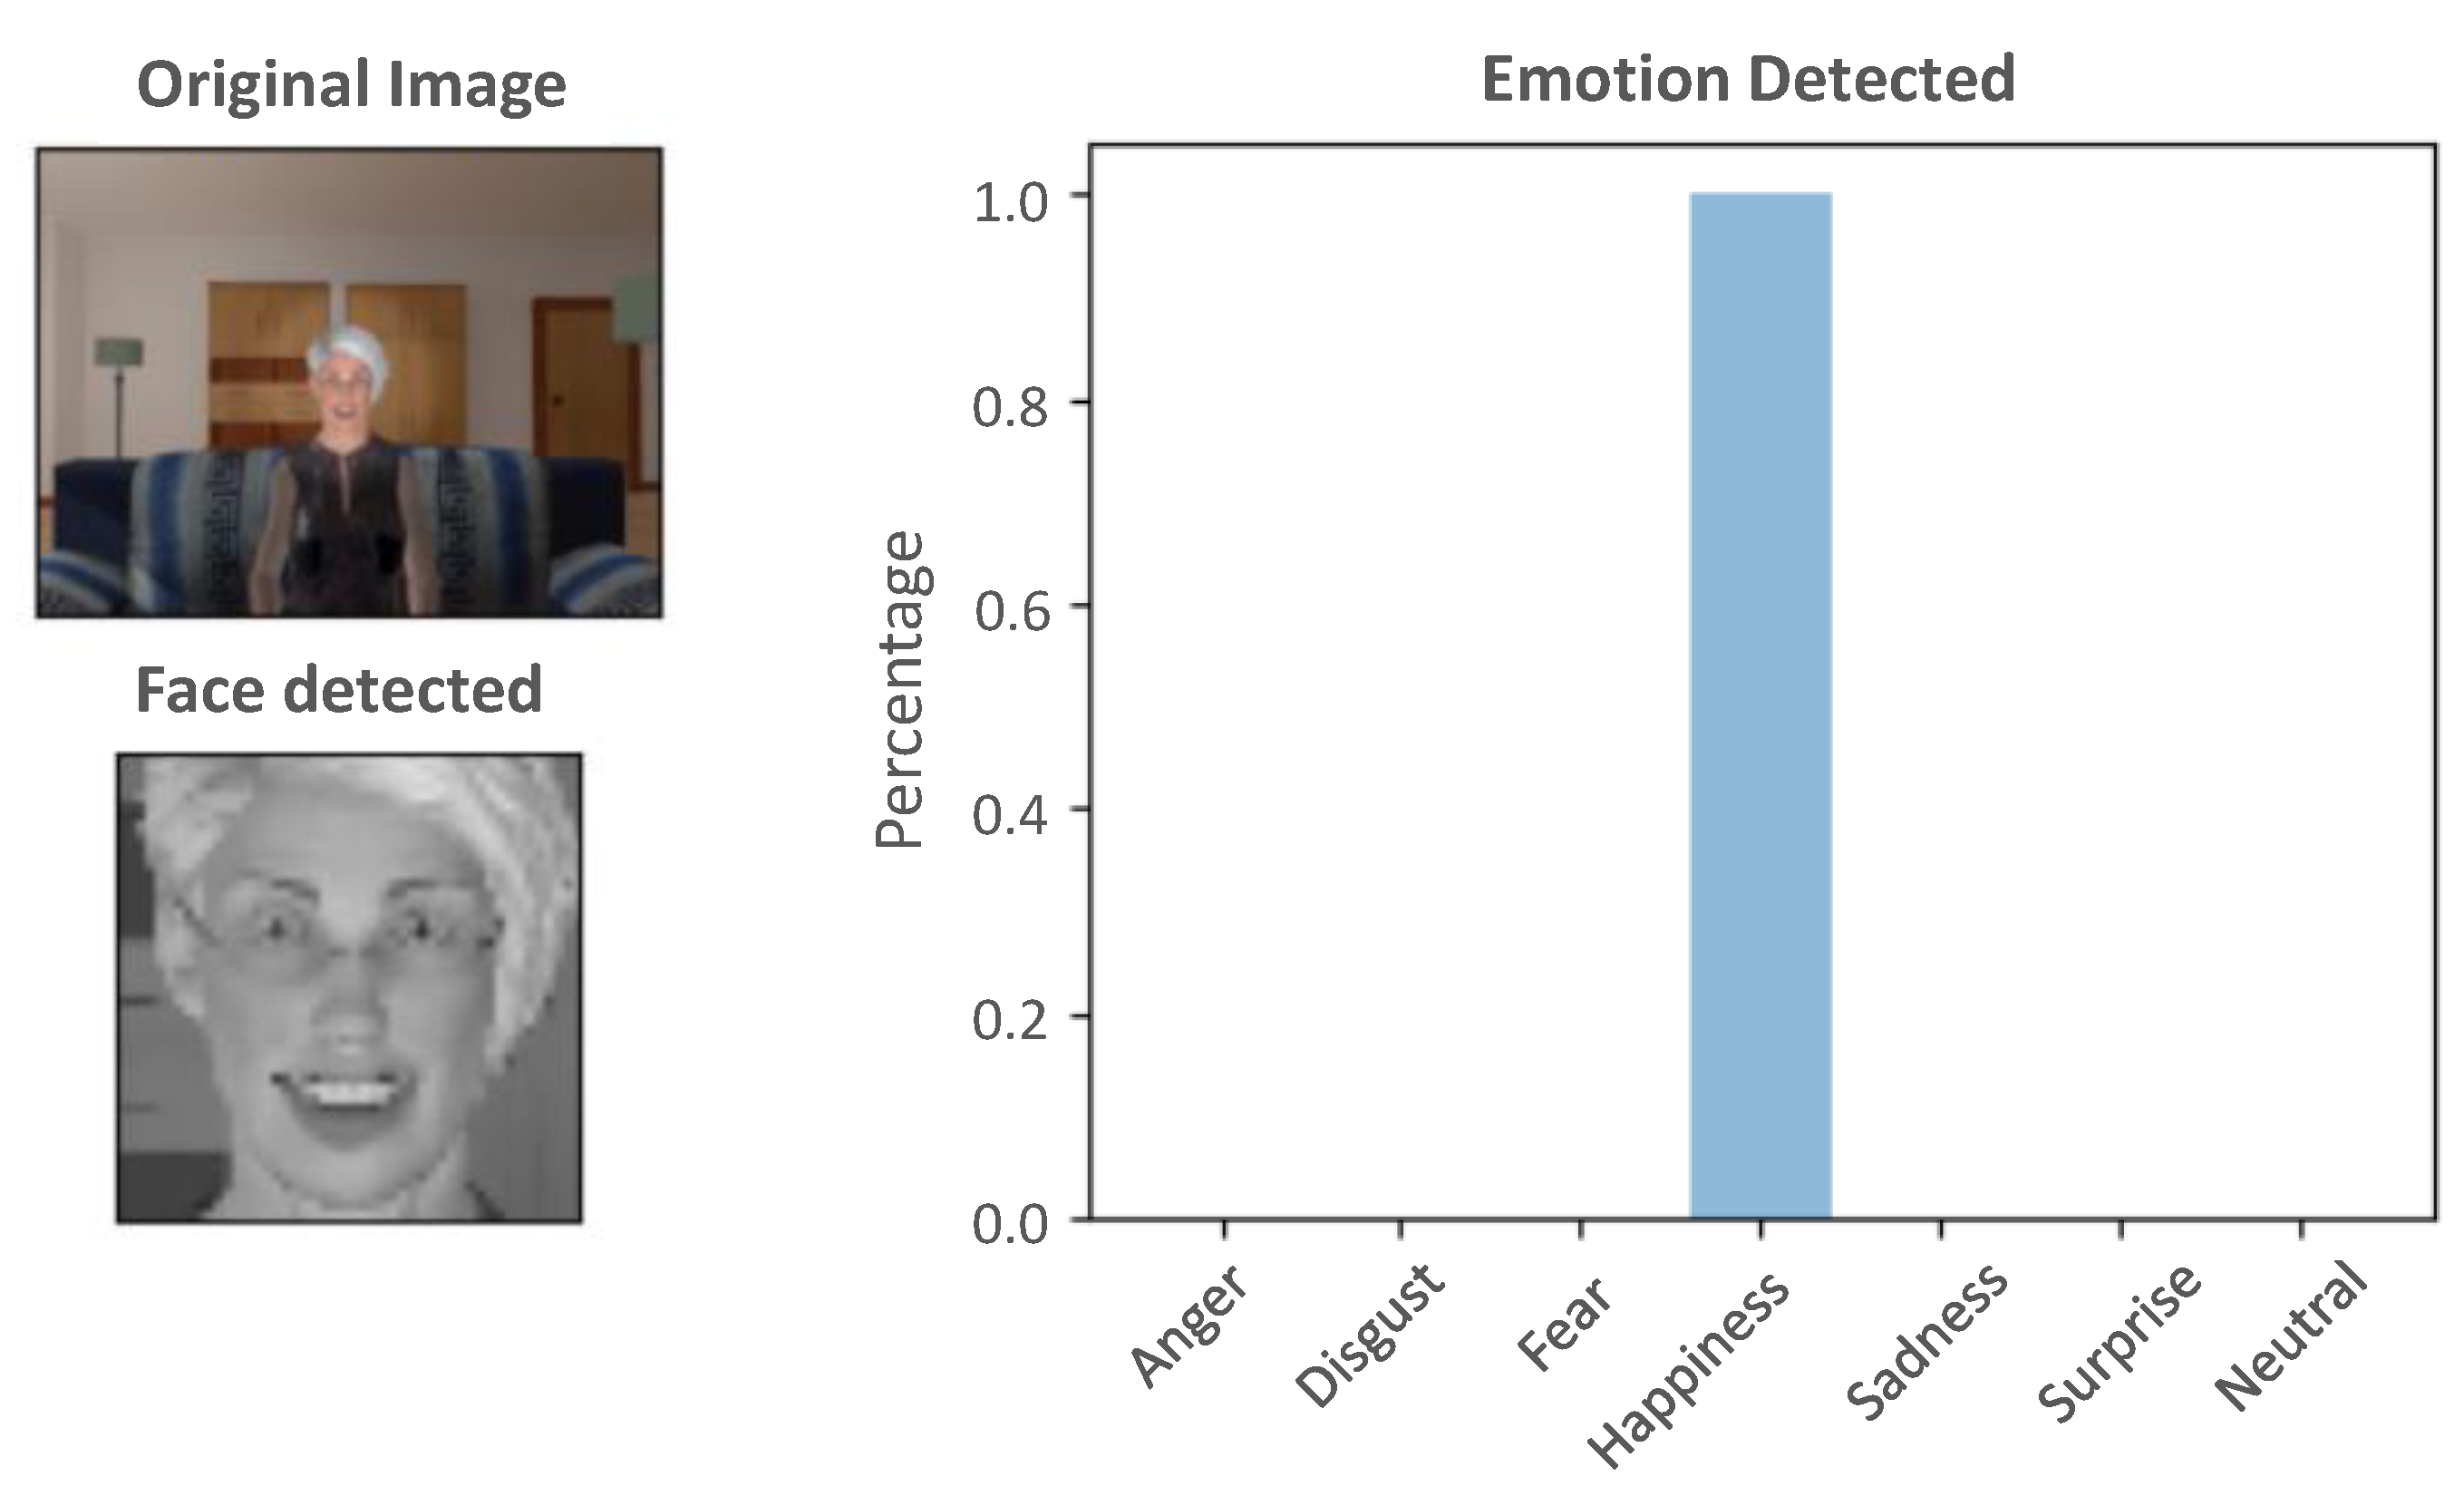
6.3. Performance Test of the Emotion Detector
7. Conclusions and Future Work
Author Contributions
Funding
Conflicts of Interest
Abbreviations
| ACC | Accuracy |
| CNN | Convolutional Neural Network |
| ER | Emotion Recognition |
| FCL | Fully Connected Layer |
| FDR | False Discovery Rate |
| FN | False Negative |
| FNR | False Negative Rate |
| FP | False Positive |
| GPI | Generalised Proportional Integral |
| MLP | Multilayer Perceptron |
| MQTT | Message Queue Telemetry Transport |
| PPV | Positive Predictive Value (or Precision) |
| TN | True Negative |
| TNR | True Negative Rate (or Specificity) |
| TP | True Positive |
| TPR | True Positive Rate (or Recall) |
| UAV | Unmanned Aerial Vehicle |
| VR | Virtual Reality |
References
- Fong, T.; Nourbakhsh, I.; Dautenhahn, K. A survey of socially interactive robots. Robot. Auton. Syst. 2003, 42, 143–166. [Google Scholar] [CrossRef]
- Calderita, L.V.; Vega, A.; Barroso-Ramírez, S.; Bustos, P.; Núñez, P. Designing a Cyber-Physical System for Ambient Assisted Living: A Use-Case Analysis for Social Robot Navigation in Caregiving Centers. Sensors 2020, 20, 4005. [Google Scholar] [CrossRef] [PubMed]
- Loza-Matovelle, D.; Verdugo, A.; Zalama, E.; Gómez-García-Bermejo, J. An Architecture for the Integration of Robots and Sensors for the Care of the Elderly in an Ambient Assisted Living Environment. Robotics 2019, 8, 76. [Google Scholar] [CrossRef]
- Sokullu, R.; Balcı, A.; Demir, E. The Role of Drones in Ambient Assisted Living Systems for the Elderly. In Enhanced Living Environments: Algorithms, Architectures, Platforms, and Systems; Ganchev, I., Garcia, N.M., Dobre, C., Mavromoustakis, C.X., Goleva, R., Eds.; Springer International Publishing: Cham, Switzerland, 2019; pp. 295–321. [Google Scholar] [CrossRef]
- Wang, J.; Spicher, N.; Warnecke, J.M.; Haghi, M.; Schwartze, J.; Deserno, T.M. Unobtrusive Health Monitoring in Private Spaces: The Smart Home. Sensors 2021, 21, 864. [Google Scholar] [CrossRef] [PubMed]
- Lee, W.; Kim, J.H. Social Relationship Development between Human and Robot through Real-Time Face Identification and Emotional Interaction. In Proceedings of the Companion of the 2018 ACM/IEEE International Conference on Human-Robot Interaction (HRI’18), Chicago, IL, USA, 5–8 March 2018; Association for Computing Machinery: New York, NY, USA, 2018; p. 379. [Google Scholar] [CrossRef]
- Malliaraki, E. Social Interaction with Drones Using Human Emotion Recognition. In Proceedings of the Companion of the 2018 ACM/IEEE International Conference on Human-Robot Interaction (HRI’18), Chicago, IL, USA, 5–8 March 2018; Association for Computing Machinery: New York, NY, USA, 2018; pp. 187–188. [Google Scholar] [CrossRef]
- Liu, S.; Watterson, M.; Mohta, K.; Sun, K.; Bhattacharya, S.; Taylor, C.J.; Kumar, V. Planning Dynamically Feasible Trajectories for Quadrotors Using Safe Flight Corridors in 3-D Complex Environments. IEEE Robot. Autom. Lett. 2017, 2, 1688–1695. [Google Scholar] [CrossRef]
- Giansanti, D. The Social Robot in Rehabilitation and Assistance: What Is the Future? Healthcare 2021, 9, 244. [Google Scholar] [CrossRef] [PubMed]
- Belmonte, L.M.; Morales, R.; García, A.S.; Segura, E.; Novais, P.; Fernández-Caballero, A. Assisting Dependent People at Home through Autonomous Unmanned Aerial Vehicles. In Proceedings of the International Symposium on Ambient Intelligence, Ávila, Spain, 26–28 June 2019; Advances in Intelligent Systems and Computing. Springer International Publishing: Cham, Switzerland, 2019; pp. 216–223. [Google Scholar] [CrossRef]
- Berni, A.; Borgianni, Y. Applications of Virtual Reality in Engineering and Product Design: Why, What, How, When and Where. Electronics 2020, 9, 1064. [Google Scholar] [CrossRef]
- De la Cruz, M.; Casañ, G.; Sanz, P.; Marín, R. Preliminary Work on a Virtual Reality Interface for the Guidance of Underwater Robots. Robotics 2020, 9, 81. [Google Scholar] [CrossRef]
- Belmonte, L.; Garcia, A.S.; Segura, E.; Novais, P.J.; Morales, R.; Fernandez-Caballero, A. Virtual Reality Simulation of a Quadrotor to Monitor Dependent People at Home. IEEE Trans. Emerg. Top. Comput. 2020. [Google Scholar] [CrossRef]
- Castillo, P.; Dzul, A.; Lozano, R. Real-time stabilization and tracking of a four-rotor mini rotorcraft. IEEE Trans. Control Syst. Technol. 2004, 12, 510–516. [Google Scholar] [CrossRef]
- Fernández-Caballero, A.; Belmonte, L.M.; Morales, R.; Somolinos, J.A. Generalized Proportional Integral Control for an Unmanned Quadrotor System. Int. J. Adv. Robot. Syst. 2015, 12, 85. [Google Scholar] [CrossRef]
- Morales, R.; Sira-Ramírez, H. Trajectory tracking for the magnetic ball levitation system via exact feedforward linearisation and GPI control. Int. J. Control 2010, 83, 1155–1166. [Google Scholar] [CrossRef]
- Morales, R.; Feliu, V.; Jaramillo, V. Position control of very lightweight single-link flexible arms with large payload variations by using disturbance observers. Robot. Auton. Syst. 2012, 60, 532–547. [Google Scholar] [CrossRef]
- Morales, R.; Sira-Ramírez, H.; Feliu, V. Adaptive control based on fast online algebraic identification and GPI control for magnetic levitation systems with time-varying input gain. Int. J. Control 2014, 87, 1604–1621. [Google Scholar] [CrossRef]
- Morales, R.; Feliu, V.; Sira-Ramirez, H. Nonlinear Control for Magnetic Levitation Systems Based on Fast Online Algebraic Identification of the Input Gain. IEEE Trans. Control Syst. Technol. 2011, 19, 757–771. [Google Scholar] [CrossRef]
- Belmonte, L.M.; Morales, R.; Fernández-Caballero, A.; Somolinos, J.A. Robust Linear Longitudinal Feedback Control of a Flapping Wing Micro Air Vehicle. In Artificial Computation in Biology and Medicine; Ferrández Vicente, J.M., Álvarez-Sánchez, J.R., de la Paz López, F., Toledo-Moreo, F.J., Adeli, H., Eds.; Springer International Publishing: Cham, Switzerland, 2015; pp. 449–458. [Google Scholar]
- Belmonte, L.M.; Morales, R.; Fernández-Caballero, A.; Somolinos, J.A. A tandem active disturbance rejection control for a laboratory helicopter with variable-speed rotors. IEEE Trans. Ind. Electron. 2016, 63, 6395–6406. [Google Scholar] [CrossRef]
- Belmonte, L.M.; Morales, R.; Fernández-Caballero, A.; Somolinos, J.A. Robust decentralized nonlinear control for a twin rotor MIMO system. Sensors 2016, 16, 1160. [Google Scholar] [CrossRef]
- Panduro, R.; Segura, E.; Belmonte, L.M.; Fernández-Caballero, A.; Novais, P.; Benet, J.; Morales, R. Intelligent trajectory planner and generalised proportional integral control for two carts equipped with a red-green-blue depth sensor on a circular rail. Integr. Comput. Aided Eng. 2020, 27, 267–285. [Google Scholar] [CrossRef]
- Belmonte, L.M.; García, A.S.; Morales, R.; de la Vara, J.L.; López de la Rosa, F.; Fernández-Caballero, A. Feeling of Safety and Comfort towards a Socially Assistive Unmanned Aerial Vehicle That Monitors People in a Virtual Home. Sensors 2021, 21, 908. [Google Scholar] [CrossRef] [PubMed]
- Ekman, P.; Friesen, W. Facial Action Coding System: A Technique for the Measurement of Facial Movement; Consulting Psychologists Press: Palo Alto, CA, USA, 1978. [Google Scholar]
- García, A.S.; Fernández-Sotos, P.; Vicente-Querol, M.A.; Lahera, G.; Rodriguez-Jimenez, R.; Fernández-Caballero, A. Design of reliable virtual human facial expressions and validation by healthy people. Integr. Comput. Aided Eng. 2020, 27, 287–299. [Google Scholar] [CrossRef]
- Viola, P.; Jones, M. Rapid object detection using a boosted cascade of simple features. In Proceedings of the 2001 IEEE Computer Society Conference on Computer Vision and Pattern Recognition (CVPR 2001), Kauai, HI, USA, 8–14 December 2001; Volume 1, p. I. [Google Scholar] [CrossRef]
- Bradski, G. The OpenCV Library. Dr. Dobb’S J. Softw. Tools 2000, 120, 122–125. [Google Scholar]
- Kaehler, A. Learning OpenCV 3: Computer Vision in C++ with the OpenCV Library; O’Reilly Media: Sebastopol, CA, USA, 2016. [Google Scholar]
- OpenCV—GitHub Page. 2021. Available online: https://github.com/opencv/opencv (accessed on 4 March 2021).
- Chollet, F. Keras. 2015. Available online: https://keras.io (accessed on 4 March 2021).
- Abadi, M.; Agarwal, A.; Barham, P.; Brevdo, E.; Chen, Z.; Citro, C.; Corrado, G.S.; Davis, A.; Dean, J.; Devin, M.; et al. TensorFlow: Large-Scale Machine Learning on Heterogeneous Systems. 2015. Available online: https:/www.tensorflow.org (accessed on 4 March 2021).
- Nair, A.; Mansoori, S.; Moghe, R.; Shah, P.; Talele, K. Driver assistant system using Haar cascade and convolution neural networks (CNN). In Proceedings of the 2019 3rd International Conference on Trends in Electronics and Informatics, Tirunelveli, India, 23–25 April 2019; pp. 1261–1263. [Google Scholar] [CrossRef]
- Parchami, M.; Bashbaghi, S.; Granger, E. Video-based face recognition using ensemble of Haar-like deep convolutional neural networks. In Proceedings of the 2017 International Joint Conference on Neural Networks, Anchorage, AK, USA, 14–19 May 2017; pp. 4625–4632. [Google Scholar] [CrossRef]
- Feng, Q.; Yang, J.; Liu, Y.; Ou, C.; Zhu, D.; Niu, B.; Liu, J.; Li, B. Multi-temporal unmanned aerial vehicle remote sensing for vegetable mapping using an attention-based recurrent convolutional neural network. Remote Sens. 2020, 12, 1668. [Google Scholar] [CrossRef]
- Kumar, A.; Vashishtha, G.; Gandhi, C.P.; Zhou, Y.; Glowacz, A.; Xiang, J. Novel convolutional neural network (NCNN) for the diagnosis of bearing defects in rotary machinery. IEEE Trans. Instrum. Meas. 2021, 70, 1–10. [Google Scholar] [CrossRef]


| Label | Type | Output Size | Params |
|---|---|---|---|
| Conv (1) | Convolutional | 44 × 44 × 64 | 1664 |
| MaxP | MaxPooling | 20 × 20 × 64 | 0 |
| Conv (2) | Convolutional | 18 × 18 × 64 | 36,928 |
| Conv (3) | Convolutional | 16 × 16 × 64 | 36,928 |
| AvgP (1) | AveragePooling | 7 × 7 × 64 | 0 |
| Conv (4) | Convolutional | 5 × 5 × 128 | 73,856 |
| Conv (5) | Convolutional | 3 × 3 × 128 | 147,584 |
| AvgP (1) | AveragePooling | 1 × 1 × 128 | 0 |
| Flatten | Flatten | 128 | 0 |
| Input (FCL) | Fully Connected | 1024 | 132,096 |
| Drop (1) | Dropout | 1024 | 0 |
| Hidden (FCL) | Fully Connected | 1024 | 1,049,600 |
| Drop (2) | Dropout | 1024 | 0 |
| Output (FCL) | Fully Connected | 7 | 7175 |
| Class | Images | Accuracy, ACC | Recall, TPR | Precision, PPV | Specificity, TNR | F1 Score |
|---|---|---|---|---|---|---|
| 0-Anger | 52 | 96.22% | 100.00% | 73.24% | 95.78% | 84.55% |
| 1-Disgust | 70 | 93.82% | 84.29% | 74.68% | 95.37% | 79.19% |
| 2-Fear | 83 | 92.03% | 53.01% | 97.78% | 99.76% | 68.75% |
| 3-Happiness | 77 | 98.01% | 93.51% | 93.51% | 98.82% | 93.51% |
| 4-Sadness | 77 | 96.81% | 94.81% | 85.88% | 97.18% | 90.12% |
| 5-Surprise | 60 | 98.21% | 86.67% | 98.11% | 99.77% | 92.04% |
| 6-Neutral | 83 | 94.62% | 89.16% | 80.43% | 95.70% | 84.57% |
| Total | 502 | - | - | - | - | - |
| Average (AVG) | - | 95.67% | 85.92% | 86.23% | 97.48% | 84.68% |
| Weighted AVG | - | 95.53% | 84.86% | 86.71% | 97.53% | 84.32% |
Publisher’s Note: MDPI stays neutral with regard to jurisdictional claims in published maps and institutional affiliations. |
© 2021 by the authors. Licensee MDPI, Basel, Switzerland. This article is an open access article distributed under the terms and conditions of the Creative Commons Attribution (CC BY) license (https://creativecommons.org/licenses/by/4.0/).
Share and Cite
Martínez, A.; Belmonte, L.M.; García, A.S.; Fernández-Caballero, A.; Morales, R. Facial Emotion Recognition from an Unmanned Flying Social Robot for Home Care of Dependent People. Electronics 2021, 10, 868. https://doi.org/10.3390/electronics10070868
Martínez A, Belmonte LM, García AS, Fernández-Caballero A, Morales R. Facial Emotion Recognition from an Unmanned Flying Social Robot for Home Care of Dependent People. Electronics. 2021; 10(7):868. https://doi.org/10.3390/electronics10070868
Chicago/Turabian StyleMartínez, Anselmo, Lidia M. Belmonte, Arturo S. García, Antonio Fernández-Caballero, and Rafael Morales. 2021. "Facial Emotion Recognition from an Unmanned Flying Social Robot for Home Care of Dependent People" Electronics 10, no. 7: 868. https://doi.org/10.3390/electronics10070868
APA StyleMartínez, A., Belmonte, L. M., García, A. S., Fernández-Caballero, A., & Morales, R. (2021). Facial Emotion Recognition from an Unmanned Flying Social Robot for Home Care of Dependent People. Electronics, 10(7), 868. https://doi.org/10.3390/electronics10070868