Article

Facial Emotion Recognition from an Unmanned Flying Social Robot for Home Care of Dependent People

by
Anselmo Martínez
1,
Lidia M. Belmonte
1,2,
Arturo S. García
1,3,
Antonio Fernández-Caballero
1,3,4,* and
Rafael Morales
1,2
1
Instituto de Investigación en Informática de Albacete, Universidad de Castilla-La Mancha, 02071 Albacete, Spain
2
Departamento de Ingeniería Eléctrica, Electrónica, Automática y Comunicaciones, Universidad de Castilla-La Mancha, 02071 Albacete, Spain
3
Departamento de Sistemas Informáticos, Universidad de Castilla-La Mancha, 02071 Albacete, Spain
4
Biomedical Research Networking Center in Mental Health (CIBERSAM), 28016 Madrid, Spain
*
Author to whom correspondence should be addressed.
Electronics 2021, 10(7), 868; https://doi.org/10.3390/electronics10070868
Submission received: 4 March 2021 / Revised: 29 March 2021 / Accepted: 31 March 2021 / Published: 6 April 2021
(This article belongs to the Special Issue Applications and Trends in Social Robotics)

Abstract

:
This work is part of an ongoing research project to develop an unmanned flying social robot to monitor dependants at home in order to detect the person’s state and bring the necessary assistance. In this sense, this paper focuses on the description of a virtual reality (VR) simulation platform for the monitoring process of an avatar in a virtual home by a rotatory-wing autonomous unmanned aerial vehicle (UAV). This platform is based on a distributed architecture composed of three modules communicated through the message queue telemetry transport (MQTT) protocol: the UAV Simulator implemented in MATLAB/Simulink, the VR Visualiser developed in Unity, and the new emotion recognition (ER) system developed in Python. Using a face detection algorithm and a convolutional neural network (CNN), the ER System is able to detect the person’s face in the image captured by the UAV’s on-board camera and classify the emotion among seven possible ones (surprise; fear; happiness; sadness; disgust; anger; or neutral expression). The experimental results demonstrate the correct integration of this new computer vision module within the VR platform, as well as the good performance of the designed CNN, with around 85% in the F1-score, a mean of the precision and recall of the model. The developed emotion detection system can be used in the future implementation of the assistance UAV that monitors dependent people in a real environment, since the methodology used is valid for images of real people.

1. Introduction

According to a now classic definition of social robots [1], these are robots that exhibit human social features including expressing and/or perceiving emotions; communicating with high-level dialogue; learning/recognising models of other agents; establishing/maintaining social relationships; using natural cues (gaze, gestures, etc.); exhibiting distinctive personality and character; land earning/developing social competencies.
Within the field of social robots, our research group has opted for the use of autonomous unmanned aerial vehicles (UAVs) as a promising alternative for the home care of dependent people, mainly elderly people living alone. The role of UAVs in ambient assisted living for the elderly is a hot topic [2,3,4]. Such UAVs, equipped with an on-board camera, provide a novel solution for navigating around the inhabitant and monitoring them. The aim is to take images for analysis using computer vision techniques to determine the state of the person and thus, to decide on the possible assistance or help required at any given moment [5]. For this, we consider emotion analysis as a fundamental tool. This is a non-invasive technique, in which computer vision algorithms are used to analyse facial images and possibly determine the mood of the person or the robot’s intent as a social signal.
In this way, our UAVs can be considered flying social robots that must incorporate the capacity of people detection and tracking through perceiving human features, in addition to the perception required for the localisation, navigation and obstacle avoidance functions. Moreover, the recognition of facial expressions is also present in these flying social robots [6,7,8]. It is our intention to incorporate more human social features in the near future. For the development of such vision-based assistance UAVs for the monitoring of dependent people, it is necessary to solve all the technical challenges for the safe navigation of the UAV in a house, as well as to implement the computer vision algorithms for the emotion analysis (or other algorithms to add new features or services in the future, such as a fall detection alarm), in the presence of occlusions; variable illumination; moving camera; and varying background [1].
Apart from this, to provide a solution that is accepted by the dependent person and can thus be of real use to them, it is also necessary to approach the design of the assistant UAV from the point of view of the assisted person [9,10]. Therefore, we have decided to design a virtual reality (VR) simulation platform that provides a safe and realistic environment to develop and test the different engineering solutions [11,12], and also allows us to conduct studies with potential end-users and people who know the problem of care for dependent people in order to adapt the design to their preferences.
This article focuses on the description of the new implementation of the VR platform, which initially had two modules [13], the UAV Simulator implemented in MATLAB/Simulink® and the VR Visualiser developed in Unity, to which a new emotion recognition (ER) system programmed in Python was added. This computer vision module is the most important novelty of this work and its objective was to analyse the aerial images received from the UAV camera in order to determine the emotion of the person. It is worth mentioning that the VR Visualiser has also been updated to add new functionalities during the monitoring process so that the integration of the ER System is complete. In this way, through the message queue telemetry transport (MQTT) protocol, the three modules communicate to exchange the necessary information for the correct operation of each one, thus emulating the behaviour of an assistant UAV monitoring an avatar in a virtual home.
The structure of the article is as follows: Section 2 presents an overview of the VR platform, detailing the architecture and the MQTT communication used. Section 3 and Section 4 briefly describe the UAV Simulator and the VR Visualiser, respectively. The new ER System is detailed in Section 5, while the experimental results are discussed in Section 6. Finally, Section 7 presents the conclusions and future work.

2. General Description of the VR Platform

This work is framed in an ongoing research project aimed to improve the quality of life of dependent persons by means of the design of a social flying robot for the home care of dependants. The main task of the UAV is to monitor the patient at home, that is, to carry out flights to capture images of the person from the on-board camera. These photographs will be sent to a base station for analysis in order to determine the person’s condition and based on this, be able to provide the necessary assistance in each case or situation. The operation of this proposed assistance system is illustrated in Figure 1.
In this context, we developed a VR platform, of which the initial version has already been presented [13], capable of providing a realistic simulation environment for the validation of the different algorithms required for the operation of the assistance UAV, both at the level of navigation and control of the aircraft itself during the monitoring of the patient, as well as those related to image processing to determine the person’s state. These computer vision features added by means of the new ER System are the main novelty of this work. In addition, this platform allows us to carry out studies with participants who realistically experience the monitoring task performed by the assistance UAV. This means that it is possible to carry out studies to evaluate different options and adjust the operation of the UAV to the preferences of the users, thus moving towards total user acceptance, which is fundamental in any social robot.

2.1. High-Level Architecture

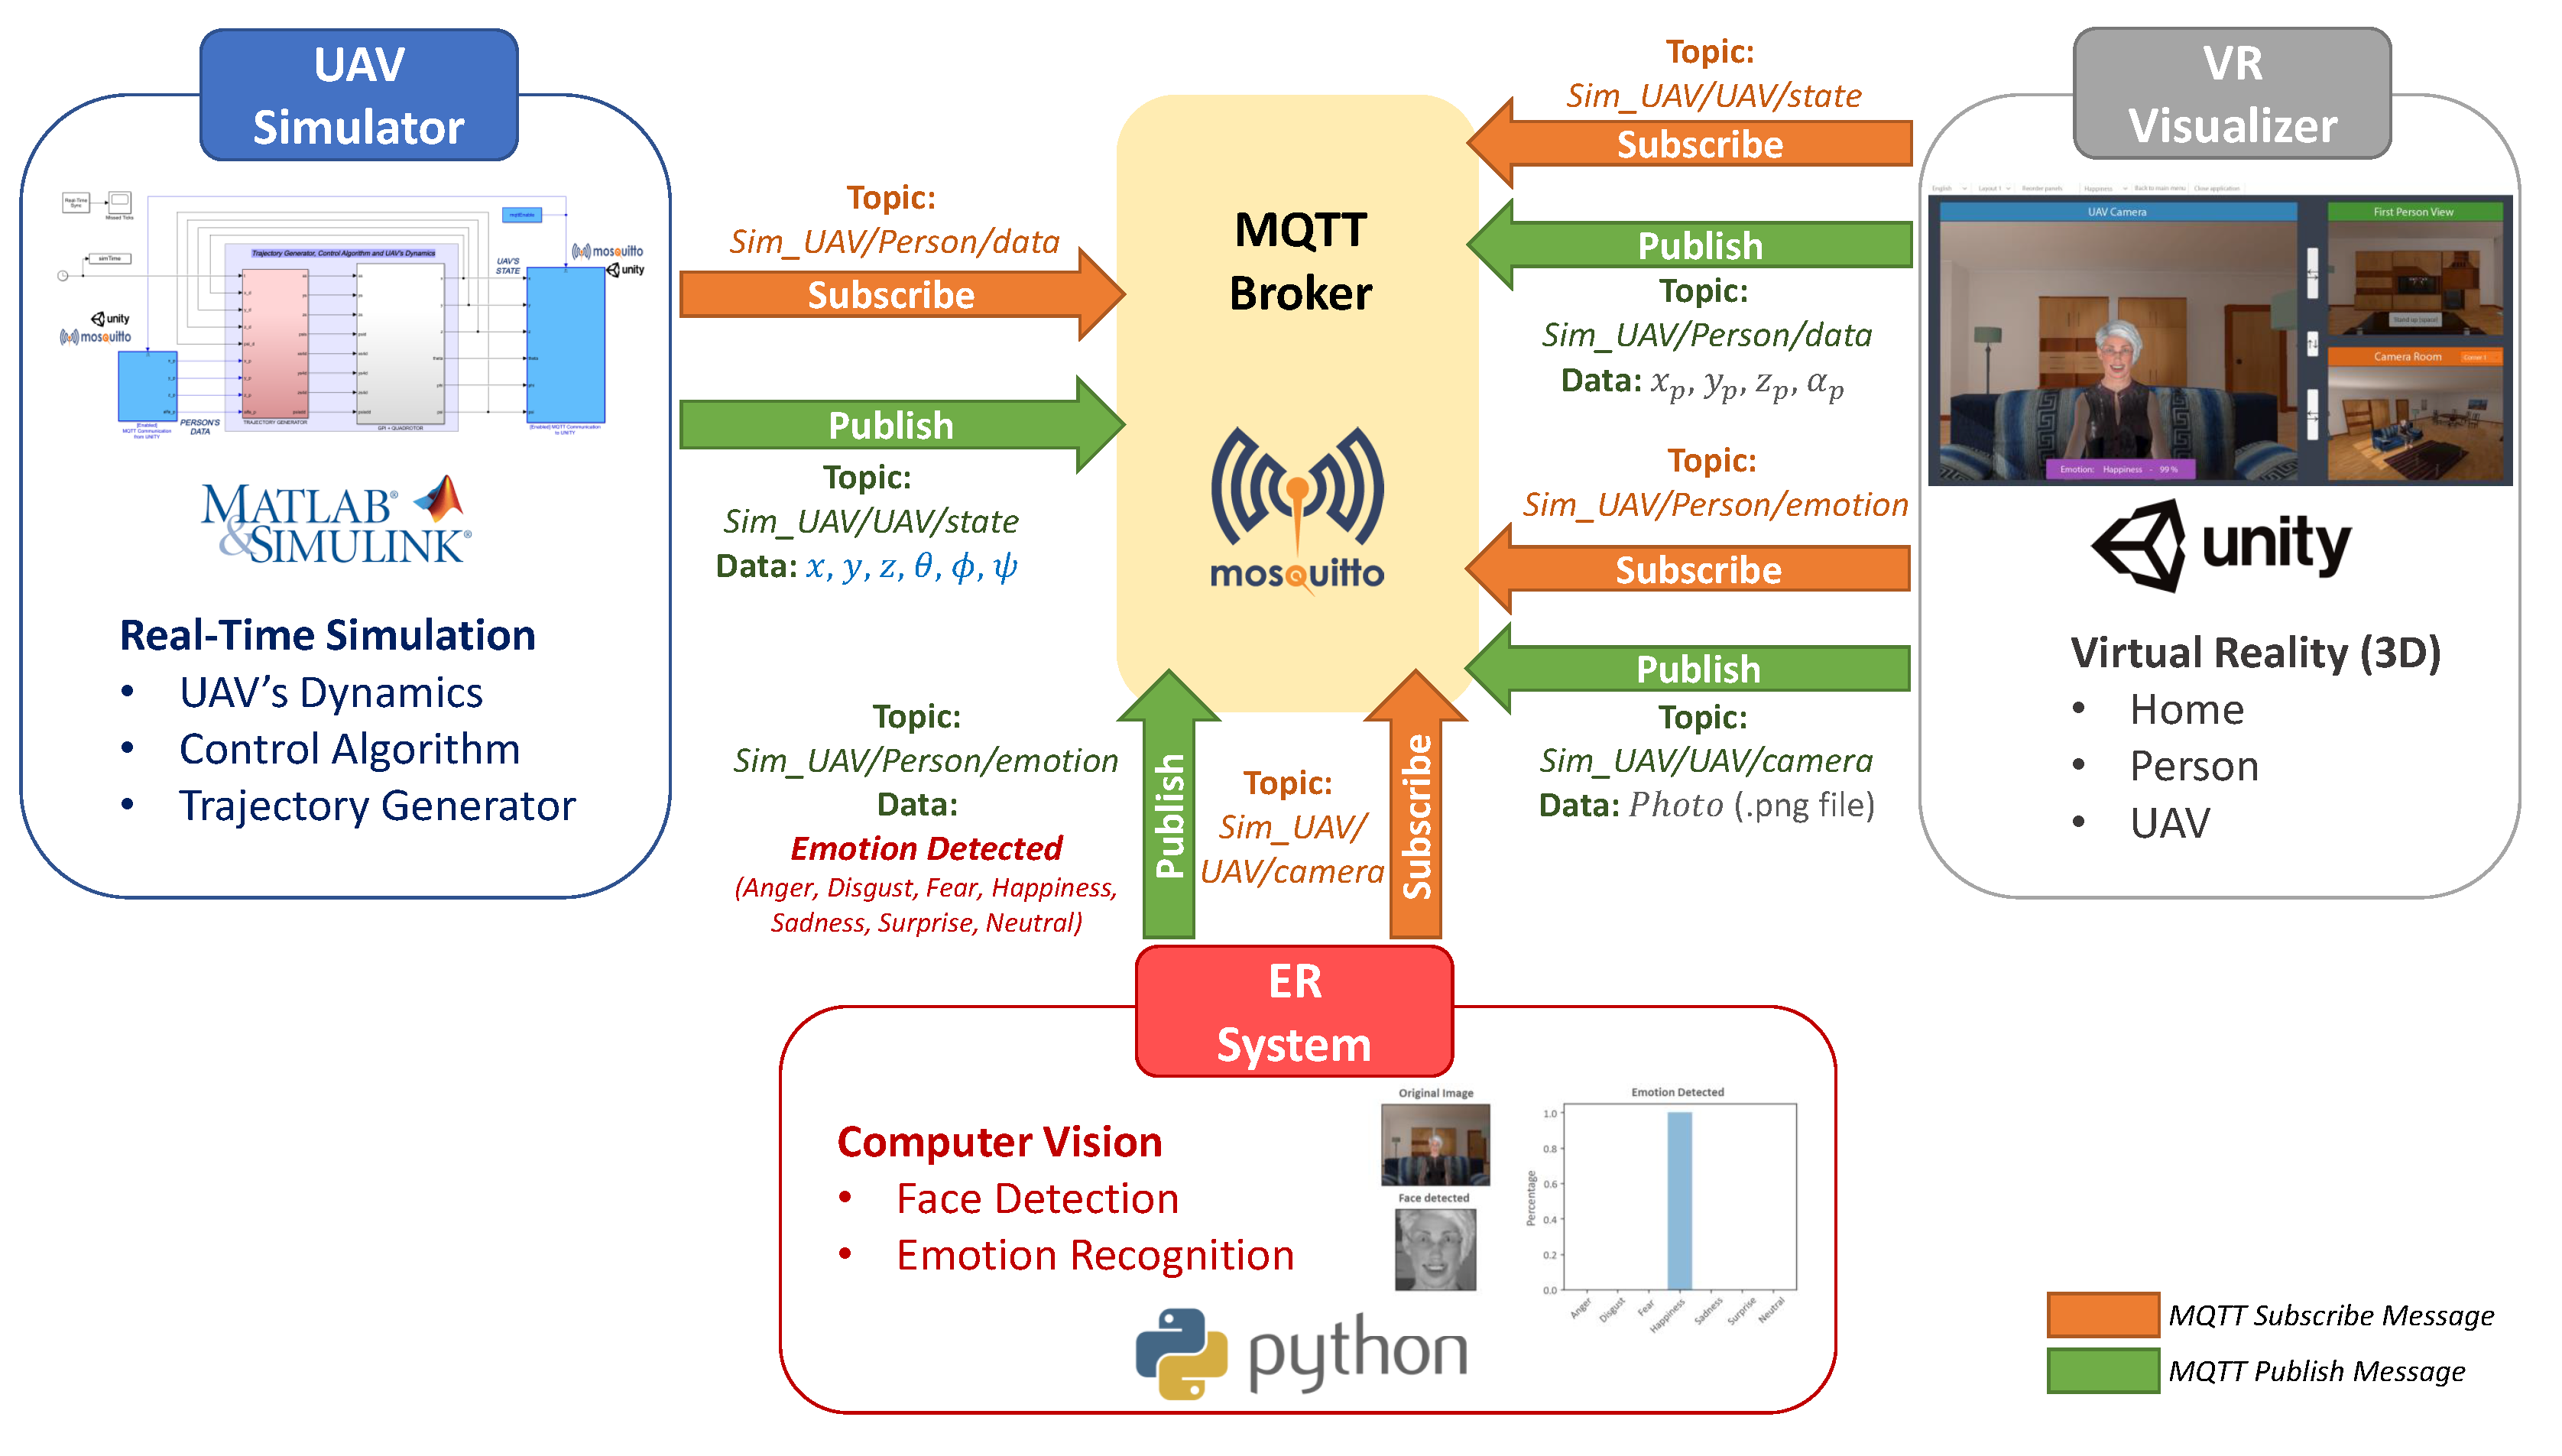
The VR simulation platform is based on the distributed architecture detailed in Figure 2. In its current implementation, this platform is composed of three modules; UAV Simulator; VR Visualizer; and the ER System, which are, respectively, in charge of: (i) simulating the UAV’s dynamics, including its control algorithm and the monitoring trajectory planner; (ii) recreating the virtual environment where the UAV monitors the dependent person; and (iii) processing the images grabbed by the UAV’s on-board camera to determine the person’s mood.
These modules were developed using different software programs according to the requirements of each one, and they can be executed on the same PC or on different ones, since all communicate with each other by means of the MQTT protocol as detailed subsequently. Finally, it is worth mentioning that the distributed architecture used provides us with versatility during the design phases, and will make it easier in the future to replace the software modules with the hardware systems that will be developed for the final implementation of the assistance UAV in real environments.

2.2. Communication

As mentioned above, the message queuing telemetry transport (MQTT)) message protocol is used to communicate the different modules that make up the VR platform. It consists of a simple and light communication protocol based on TCP/IP with a system of publication and subscription of messages in topics. These topics are essential because the receivers need to be subscribed to one so that the MQTT server (also called broker) can send them the information published by the senders. As shown in Figure 2, the Mosquitto open source server was used for this purpose. Inside the VR platform, there are two main communication paths (see Figure 2): the first one was used to exchange information between the UAV Simulator and the VR Visualiser, and the second one between the latter and the vision-based ER System used in facial emotion analysis.
The UAV Simulator implemented in MATLAB/Simulink® models the dynamic behaviour of a quadrotor, including the trajectory planner and the control algorithm. The UAV will perform the process of monitoring the person, in this case the avatar in the VR application in Unity, for which it needs to know the information relating to their pose. This information is published from Unity in a topic called “Sim_UAV/Person/Data” at which the MATLAB/Simulink® client is subscribed. Based on this information, the planner calculates the reference path for the position and orientation of the quadrotor. These data are used by the control algorithm to determine the input to be applied to the UAV’s model to minimise the error in tracking the trajectories, and thus be able to guide the UAV as expected in the monitoring process. On the other hand, the information of the state of the UAV (position and orientation) is used to represent the flight of the UAV in the virtual environment, which is published from the MATLAB/Simulink® in the topic “Sim_UAV/UAV/State”. This way, the Unity client (subscribed to the previous topic) periodically receives the information published by the UAV Simulator, and updates the pose of the 3D model of the UAV inside the virtual home.
Regarding the image processing and emotion recognition, it has been established that the UAV’s camera (within the VR application in Unity) will be taking pictures of the avatar at one-second intervals. These images are automatically sent to a specific topic (called “Sim_UAV/UAV/Camera”) to which the ER System is subscribed, so it can receive them at the moment of their publication. When the ER System finishes classifying the emotion, it publishes the results in a different topic (called “Sim_UAV/Person/Emotion”) to which the Unity application is subscribed, receiving the data and showing them.
Finally, the MQTT communication in the VR platform is schematically summarised in Figure 3.

3. UAV Simulator

This section briefly describes the UAV Simulator module, whose main objective is to represent the dynamic behaviour of the assistant UAV, a rotatory-wing aircraft of type quadrotor which is in charge of flying at home to monitor the person. This way, the UAV Simulator has to calculate at each moment the state of the aircraft, i.e., the position and orientation, considering its dynamics, the action of the controller and the trajectory planner, which in the end determine the reference trajectories for the position and orientation of the UAV in order to perform the monitoring process. To do this, the following three components were implemented in MATLAB/Simulink software [13]:
  • Quadrotor’s Dynamic Model: It mathematically represents how the lift forces of the quadrotor change when the rotational speed of its four propellers are modified, thus achieving the three possible motions; pitch, roll and yaw. It was obtained following the Euler–Lagrange formulation according to [14] and can be consulted in [13,15]. Please note that the output of this component is the state of the UAV, its position and orientation, information that is sent to the VR Visualiser in order to reproduce the flight of the UAV by updating the position and orientation of a 3D virtual quadrotor.
  • Control Algorithm: It is used to calculate what inputs should be applied to the quadrotor model in order to follow a specific trajectory reference, thereby ensuring that the UAV is correctly positioned and oriented during the monitoring flight. For this component, we designed a generalised proportional integral (GPI) controller based on the flatness theory that demonstrated good results in both stabilisation and tracking tasks, even in the presence of atmospheric disturbances and noise measurements, improving the performance of a traditional PID controller [16,17,18,19,20,21,22,23]. The theoretical details of the GPI control scheme are described in [15].
  • Trajectory Planner: On the basis of the person’s position and orientation, which are received from the avatar in the VR Visualiser, a state-machine-based planner generates the references for the position and yaw angle of the UAV for each of the manoeuvres that make up the monitoring process. In the current implementation of the planner, it is possible to configure the tracking trajectory to define the height at which the UAV flies, as well as the trajectory (circular or elliptical) it describes around the person, to suit the user’s preferences. Details of this planner can be found in [24].
Figure 4 shows the block diagram of the UAV simulator, composed of the three blocks described above. This diagram also integrates the information exchanged with the VR visualiser for the correct operation of the VR platform (transmission of the UAV state, to recreate the flight in the virtual home, and reception of the avatar’s position and orientation for the calculation of the monitoring trajectory). To complete the description of the UAV simulator module, we refer the reader to the experimental results (see Section 6.2) where we present the data provided by this module during the monitoring process to obtain the images that will be analysed by the new ER system (described in detail in Section 5).

4. VR Visualiser

The game engine Unity (also referred as Unity 3D) was used to develop the VR Visualiser in which the virtual home, the quadrotor UAV and the user’s representation (avatar) are rendered. This module was initially included in the VR platform [13] to reproduce the flight of the assistant UAV by updating the position and orientation of the quadrotor 3D model according to the information received from the UAV Simulator, which in turn determines the monitoring trajectory based on the avatar’s information received from the Unity application.
As described in [13], two main user interfaces were implemented for non-immersive and immersive VR setups. The former makes use of a keyboard and mouse control mode. This mode is useful to assess the behaviour of the assistant UAV, since it is easier to visualise the UAV trajectory on a PC screen and using a third-person perspective with free-camera movements. The latter uses the HTC VIVE headset and its controllers, so the user can walk and look inside the virtual house, while the assistant UAV performs the monitoring process. This mode enables immersive studies with participants to be conducted while they experiment the labour of the social flying robot in first person.
The traditional interface is divided into three interchangeably frames to display different camera views the first-person view of the avatar, the on-board UAV camera view, and a selection of camera positions placed around the room. Other features or options added were: (i) two main selectable characters (avatar of an elderly male or an elderly female); (ii) the colour representation of the path followed by the quadrotor within the virtual environment to assess the correct functioning of the system (as this can be compared with the monitoring trajectory calculated by the UAV Simulator); and (iii) spatial sound to simulate the buzzing sounds of the UAV, thus increasing the realism of the platform.
Now, with the integration of the new ER System into the VR platform, the VR Visualiser was updated. Dynamic facial expressions were added to the avatars, as will be described below (Section 5.1 and Section 5.2). In addition, it was established that the UAV’s on-board camera regularly captures images during the monitoring process. These images are sent to the ER System for analysis. Once the image processing is finished, the avatar’s emotion is displayed in the Unity app’s user interface. More details about the bidirectional communication of these two modules are provided in the experimental results (Section 6.2).

5. ER System

The Emotion Recognition (ER) System is the new computer vision module of the VR platform that simulates the operation of the assistant UAV for the home care of dependent persons. This module is responsible for analysing the images received from the camera on board the UAV to determine the mood of the person by analysing their facial expression. It is mainly composed of two elements: the set of cascade classifiers that analyse the image to detect the person’s face (or the avatar’s in this case), and the convolutional neural network (CNN) that analyses the facial expression to detect the person’s emotion.
This way, the ER System analyses the images captured by the camera on board the UAV. This has made it necessary to update the application developed in Unity in order to provide the characters with the ability to express emotions during the simulation. Therefore, we began by describing the design of the emotions in the avatars, as well as the implementation of the transition between the different emotions. This is followed by a description of the face detection algorithm, based on the aforementioned cascade classifiers, and then a description of the design of the convolutional neural network which classifies the avatar’s emotion. This section ends with a description of the neural network training process.

5.1. Design of Emotions in Avatars

Two models were designed to represent a male and a female avatar. Figure 5 shows the faces of the two virtual characters. They initially show a neutral expression.
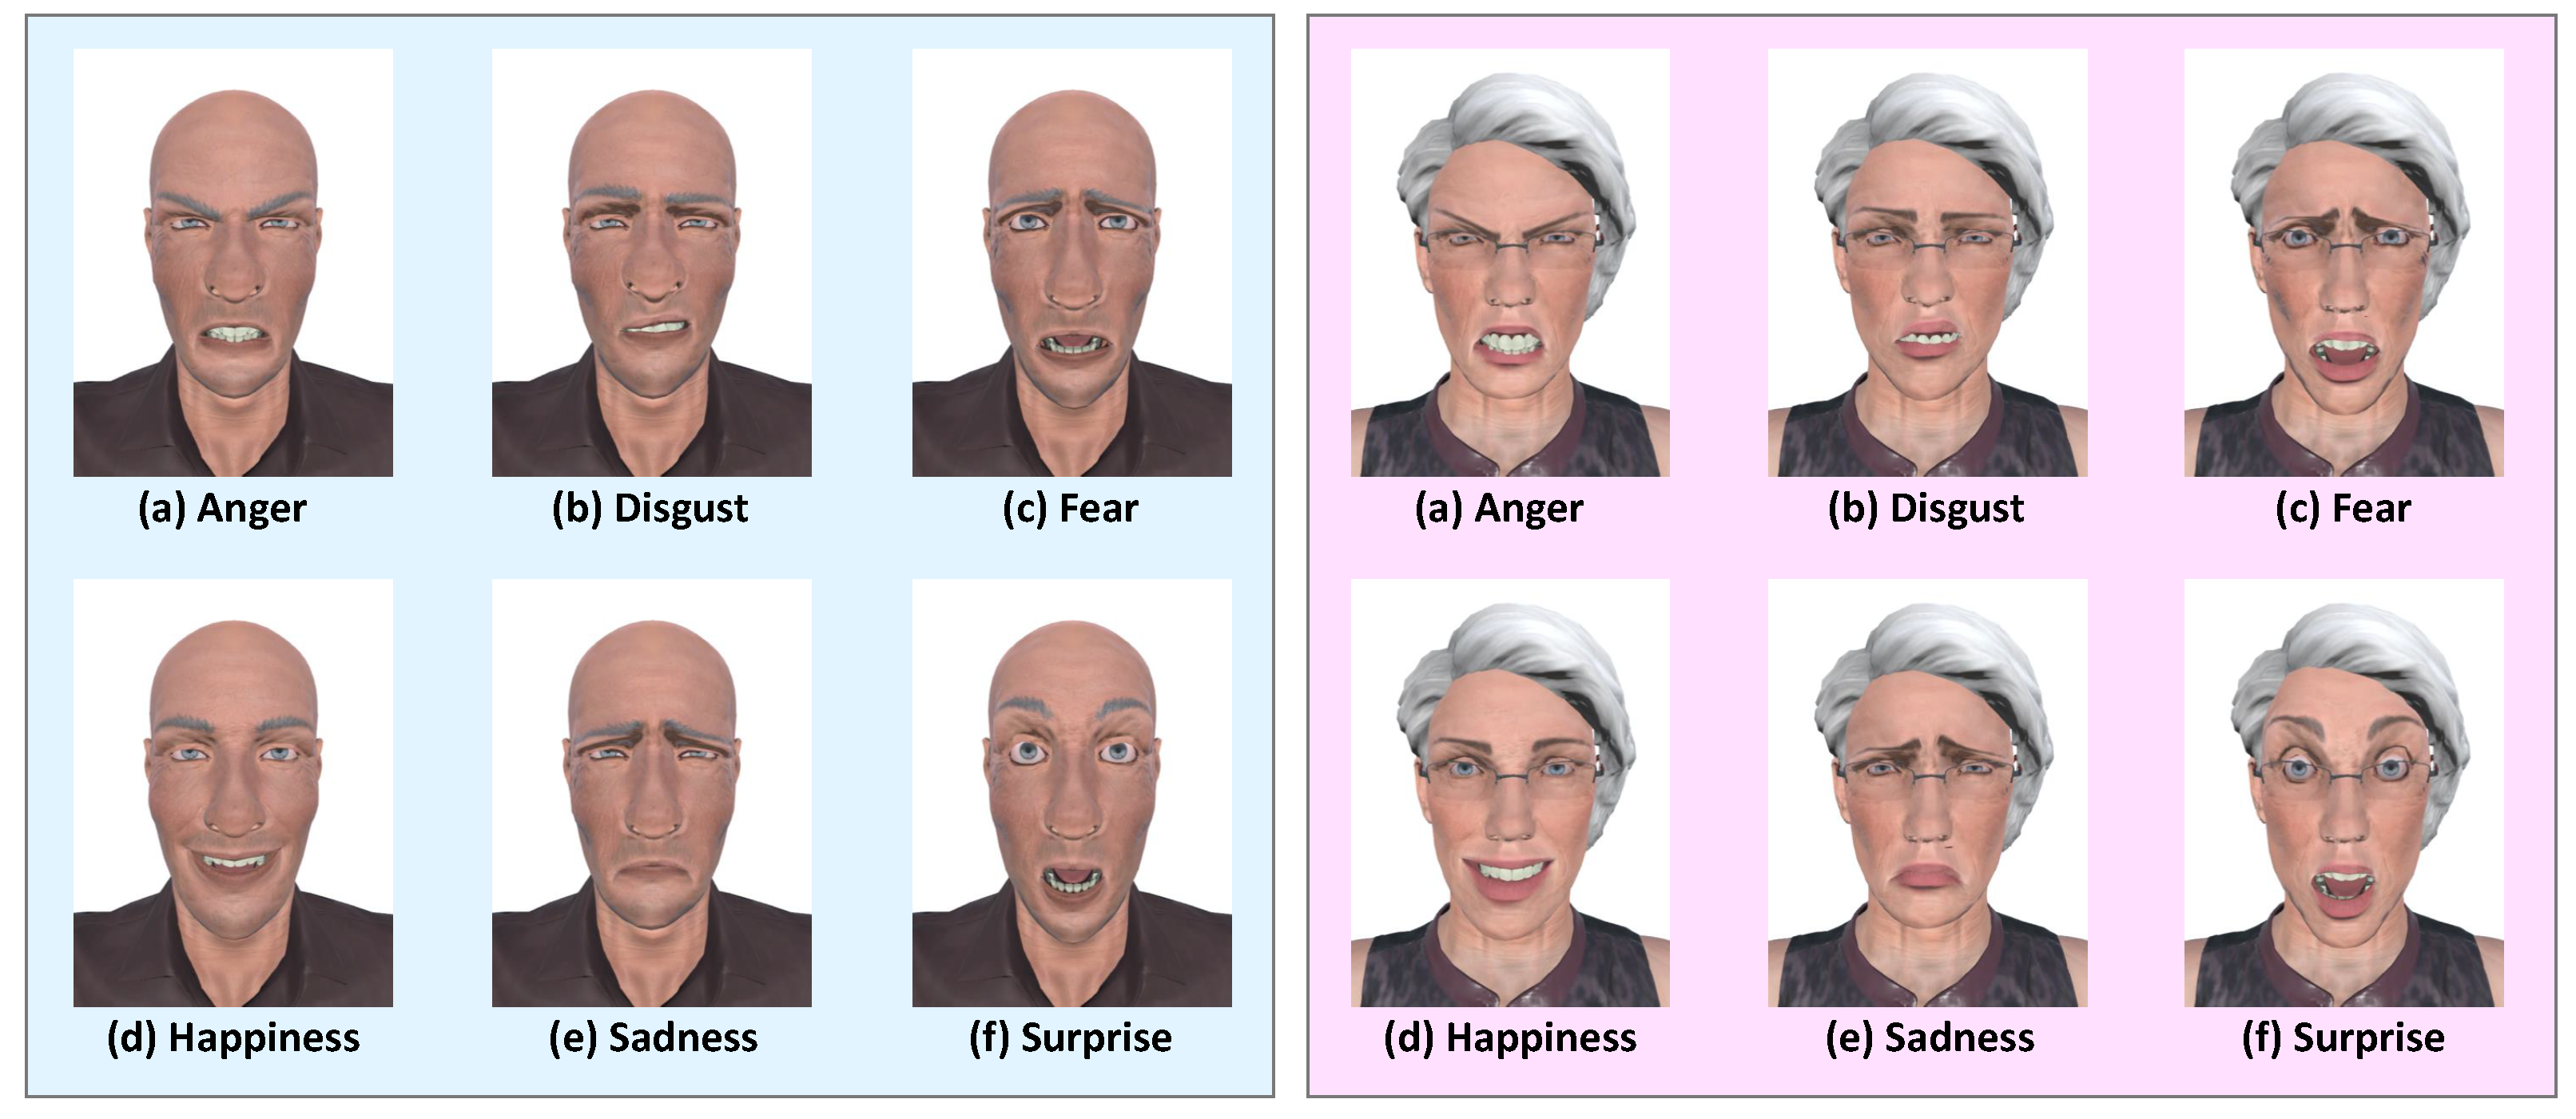
Each model has a series of blendshapes, which consist of a set of coefficients that allow the modification of specific groups of vertices of their face. They focus on facial characteristics such as eyebrows, eyelids or lips. In addition, these blendshapes designed individually can be combined, enabling the generation of facial expressions in a simple way. The design of the blendshapes that compose the six basic emotions defined by Ekman and Friesen (anger, disgust, fear, happiness, sadness and surprise) [25] was carried out following a previously detailed procedure [26], which is based on the well-known Facial Action Coding System [25]. Figure 6 shows how these emotions are seen in the faces of the two characters.

5.2. Transitions Between Emotions

The option to choose the desired emotion was added to the Unity application, and can be established before starting the simulation. In addition, a drop-down menu has also been added to the user interface so that it can be changed at any time, even if the simulation has already started. Apart from the six basic emotions plus the neutral expression, a random mode that selects a different one every few minutes was also added.
When moving from one emotion to another, a transition was made in which the facial expression changed little by little so that there was no sudden change. As mentioned before, each emotion is formed by the combination of a set of blendshapes that modify a specific area of the face. Therefore, to create a fluid transition between two expressions, the blendshape values of the previous one are increased or decreased by one unit per frame until they coincide with those of the following one.

5.3. Face Detection Algorithm

Cascade classifiers are used to recognise a person’s face from a photograph. Then, the characteristics and operation of the cascade classifiers are described to later specify how this machine learning methodology was implemented in the emotion recognition module.

5.3.1. Cascade Classifiers

Description

In machine learning, a classifier is an algorithm that can identify which of several categories a new example belongs to through pattern recognition, because it was trained with a set of previously labelled cases. On the other hand, a cascade classifier is a combination method or ensemble that consists of the concatenation of several classifiers, where the information produced by each one of them as output is used as additional information for the next entry.
Cascade classifiers were initially proposed by Viola and Jones [27], and they supposed a new way of detecting objects in machine learning that is characterised by processing images extremely quickly and with a high detection rate. This approach can be divided into three parts: (i) Transformation of the original image into a new representation called “integral image”, which allows the identification of features to be computed very quickly; (ii) A machine learning algorithm based on AdaBoost, which consists of selecting a few of the most important characteristics to reduce their number and produce much more efficient classifiers; and (iii) The cascade classifier to quickly discard unnecessary areas of the image and focus on the regions where the figure to find can be.

Functioning

A cascade classifier has several stages, each of which is a combination of weak classifiers. This is based on the machine learning meta-algorithm called Boosting, which consists of putting together the results of several weak classifiers to form a robust one. The weak ones are those predictors with a low precision but slightly higher than a random one (that is, greater than 50% in a binary classification problem), while the robust ones are those with a high percentage of correctness.
The operation is as follows: each area of the image is inspected by means of a sliding window and for each stage of the cascade classifier, it is checked whether the object being sought is found in that subsection (checking the characteristics of the area). When it fails in one stage (that is, the value given by one of the weak classifiers does not exceed a threshold), it no longer goes to the next stage, which greatly saves the calculation. Only the area that manages to pass all the stages is finally considered positive. The training of a cascade classifier requires the images of positive and negative cases of the object or figure to be detected, it being necessary that all the images have the same size. Once trained it can then be used to detect the same type of objects in other images.

5.3.2. Implemented Solution

For the recognition of the person’s face from a photograph, cascade sorters based on Haar filters were used. This was done using OpenCV (Open Source Computer Vision Library) [28], an open source software library with functions and algorithms for use in machine vision and machine learning, originally developed by Intel and introduced in 1999 [29].
OpenCV provides several trained models of classifiers (available at its GitHub page [30]) that can be loaded through the library itself. Three different models have been used for this application in order to maximise the probability of finding the person’s face correctly in the analysed image. Specifically, the following models were used: “haarcascade_frontalface_default”, “haarcascade_frontalface_alt”, and “haarcascade_frontalface_alt2”. With them, the probability of finding the face is practically guaranteed, although some punctual errors can always arise due to shadows, blurs or turns. In this way, the three models are used to search for a face in the image, and it is saved if found. Finally, the photo of the face is cropped to keep only the area of interest and remove everything else. The resulting images are then introduced into the convolutional neural network for classification into one of the possible emotions.

5.4. Design of the Convolutional Neural Network (CNN)

After detecting the person’s face in the photograph, the next step focuses on recognising the person’s emotion based on their facial expression. To do this, the image is analysed using a convolutional neural network (CNN). The main characteristics and operation of this type of network are described below, as well as the details of the application of the neural network in the specific case of detecting the avatar’s emotion.

5.4.1. Convolutional Neural Network

Description

An artificial neural network is a computational model inspired by the behaviour of networks of neurons in a brain. They consist of a set of units called neurons that transmit certain data to each other. The most famous type of network is the multilayer perceptron (MLP), which is divided into several layers of neurons connected one to the next layer. The initial information enters through the neurons of the input layer and is transformed through the intermediate or hidden layers. Each link has a value called weight that is multiplied by the value of the previous neuron and reaches the next one, where an operation is performed with all the incoming values. Finally, the results are returned in the output layer. The weights of the links are adjusted during the process to give more importance to certain inputs that help in the classification.
A convolutional neural network (CNN) is a type of artificial neural network designed to recognise visual patterns by mimicking the primary visual cortex of the brain. They are named after the mathematical concept of “convolution”, which is a linear transformation of two functions into a new one representing the magnitude at which they overlap. This type of network is similar to MLP, but applied to two-dimensional arrays to classify or segment images, and is able to capture the spatial dependencies of the image through the use of various filters. It contains a hierarchy of layers that become more specialised, i.e., the first layers detect lines and curves while the last ones are able to recognise complex shapes such as an entire object.

Functioning

In order for a neural network to learn to recognise objects and shapes on its own, it must first be trained with a large number of images. In this way, it will be able to pick up the most important features of the sample.
In the first layer, the pixel values of the image are taken as input (it is desirable that they are normalised between 0 and 1). That is, when entering the value of each one, if the image is 48 pixels wide and 48 pixels high, it would be necessary to have 48 × 48 = 2304 entries. This is true for images that have only one colour channel (such as black and white images). If they have three channels (such as RGB colour images), 48 × 48 × 3 = 6912 entries would be needed.
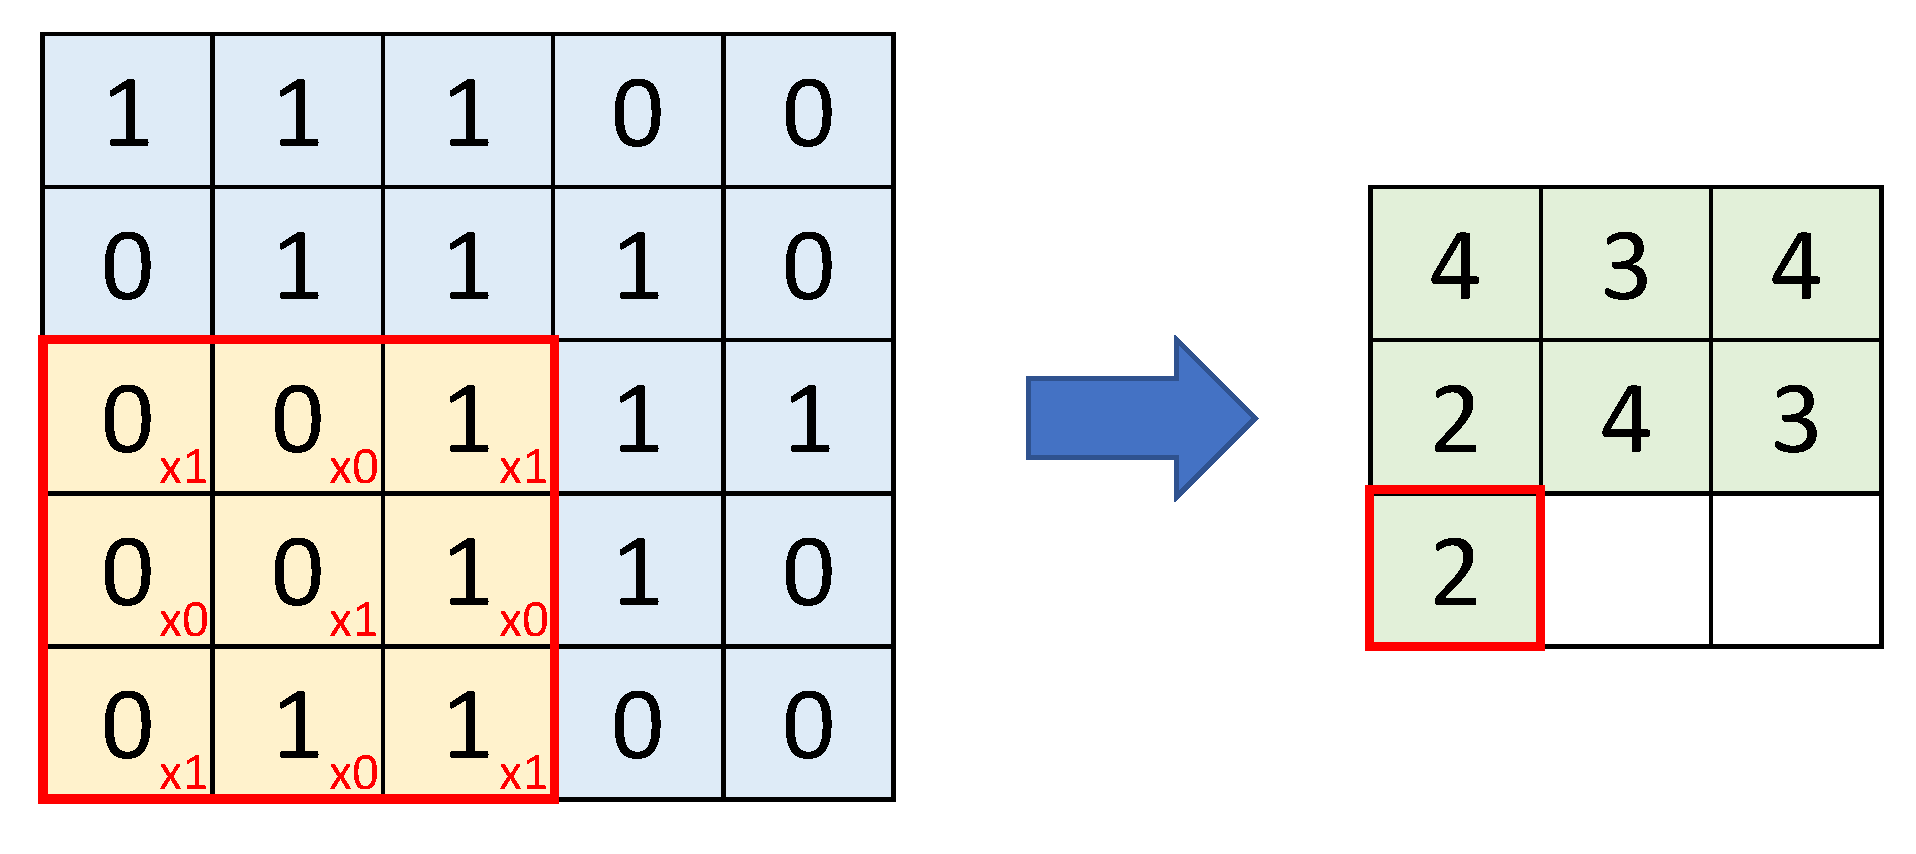
Then, groups of neighbouring pixels are taken and operated on with a small matrix called kernel. Its size can be specified (e.g., 3 × 3) and it is filled with weight values. It cycles through all input values (from left to right and from top to bottom, moving one or more units for each step as specified), generating a new matrix which will be the next hidden layer. For example, for a 48 × 48 image (and with only one colour channel), a 3 × 3 kernel (with one shift unit) can generate a 46 × 46 matrix. An example of this transformation can be seen in Figure 7, using a 3 × 3 kernel moving from pixel to pixel in an original 5 × 5 image, resulting in a matrix of size 3 × 3. This process can be applied multiple times on the same layer, having a set of kernels (called a filter) that will produce several output matrices (this set is called feature mapping). Thus, a filter of 32 kernels would result in 32 output matrices.
It is possible that some values in the matrix turn out to be negative, so an activation function is used to rectify the data. The most commonly one used is the ReLU (Rectified Linear Unit) function, which returns the maximum value between those data and 0. It is defined as f ( x ) = m a x ( 0 , x ) .
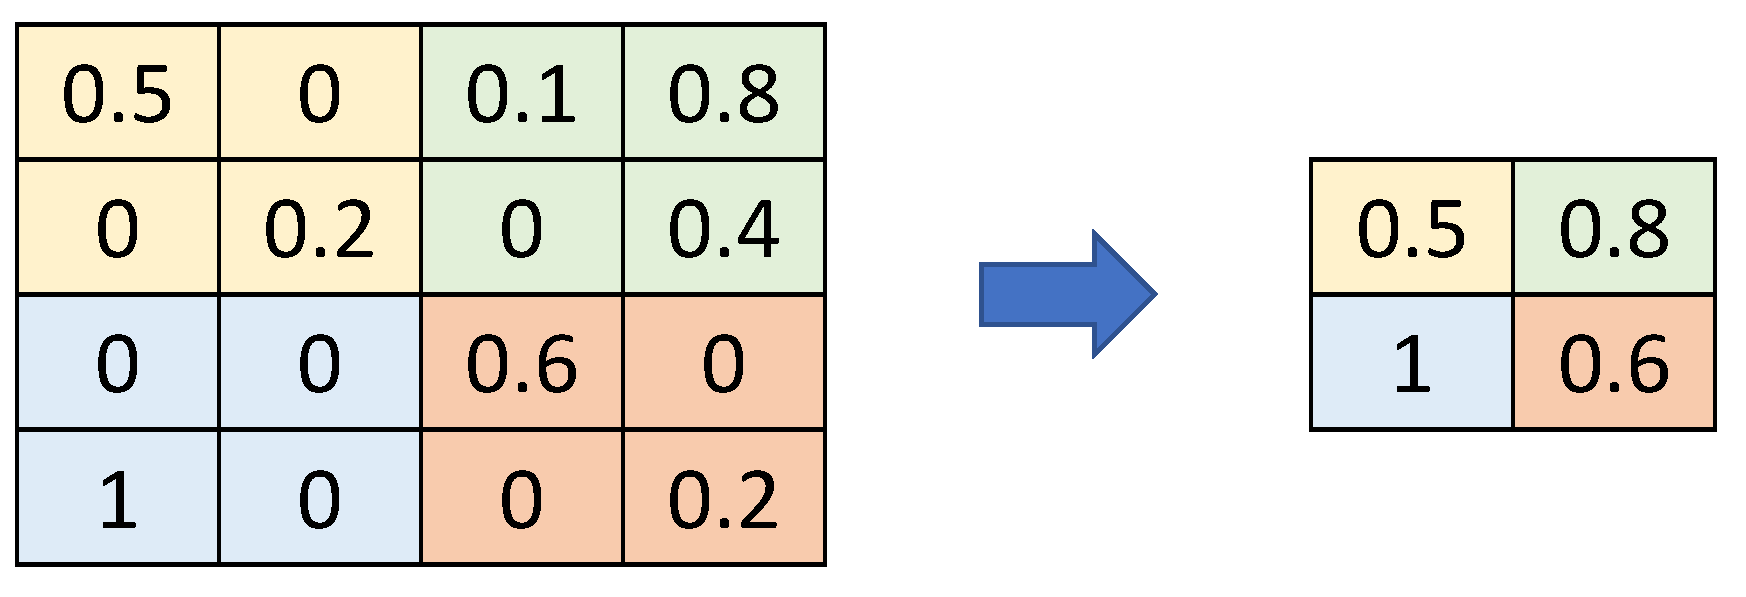
Each of these new matrices represents specific features of the original image, which will help with object distinction later on. If we generated 32 of them and each on was 46 by 46, we would need 46 × 46 × 32 = 67,712 entries for the next layer. The initial image is too small and yet too many values are formed in the first layer alone. Many of these are not even important, so it is advisable to reduce their number in order to lighten the processing in the next layers. This is done in the subsampling part, where a kernel-like process is performed by windowing through each matrix and forming a new, reduced one by keeping a smaller number of values. There are several types, such as MaxPooling (which takes the highest values from each region) or the AveragePooling (which generates a new value from the average). In Figure 8, you can see how MaxPooling is performed with a window size of 2 by 2 (and with 2 displacement units) to a 4-by-4 matrix to reduce it by half.
In this way, a convolution is completed. As a summary of the previous steps: the image values are entered, the kernel filter is applied, and the set of matrices or feature mapping is obtained, whilst MaxPooling is applied and the reduced matrices are generated as a result. The values of the latter matrices would be used as input in the next convolution, repeating the whole process successively according to the number of convolutions carried out.
The output of the last convolution is then linked to another neural network (a fully connected multilayer perceptron). This is performed by a layer called Flatten, which transforms the matrices into a vector so that their values can be used as inputs. In addition, a Dropout, a process that randomly discards a percentage of neurons to avoid overfitting during training, can be performed on each layer of neurons. Finally, in the last layer, an activation function called Softmax is run to convert the output into a probability distribution with as many values as there are classes. Once trained, classification is carried out in this part. When classifying, the output returns a set of data where each one represents the probability that the image belongs to that class.
It must be taken into account that the training of a convolutional neural network requires a lot of memory because a large number of images must be processed. Therefore, this process has to be done step by step, dividing the set of images into several batches or batches. Moreover, not only do all data have to be passed once, but multiple times in order to improve feature capture. Thus, when all batches are passed until an iteration is completed, an epoch is said to be completed. Performing too few can cause the model to underfit the data while too many can lead to overfitting, so the right number must be found. However, there is no definitive solution as this number can vary greatly depending on the type of problem and the amount of data in the set.

5.4.2. Implemented Solution

The CNN network for emotion classification was created using Keras [31], the deep learning application programming interface (API) written in Python. It is the high-level API of TensorFlow 2 [32] (end-to-end open source machine learning platform developed by Google) in which the model starts from zero and the layers that will form its structure must be added one by one. Among the layers that can be included are:
  • Convolutional Layers: These are responsible for deriving features from the spatial dependencies between pixels in the image, generating multiple filters that produce a feature map. Several of these layers are usually included (sometimes back to back) to capture as much information as possible. The first layers detect simple shapes such as lines and curves while the later layers are more specialised and can recognise complex shapes. However, it is not advisable to add too many layers because, at some point, they do not significantly improve the model and only increase its complexity and computational time.
  • Subsampling Layers (such as MaxPooling or AveragePooling): These are included after the convolutional layers to reduce the number of parameters generated and subsequently reduce the overfitting of the model.
  • Flatten Layer: It converts the output of the convolutions into a vector used as the input of the final stage of the network, the fully connected layers.
  • Fully Connected Layers (FCL): These are typically used to calculate probabilities and have an input layer, one or more hidden layers and an output layer.
  • Dropout Layers: These are placed between the fully connected layers to remove a percentage of their neurons and reduce overfitting.
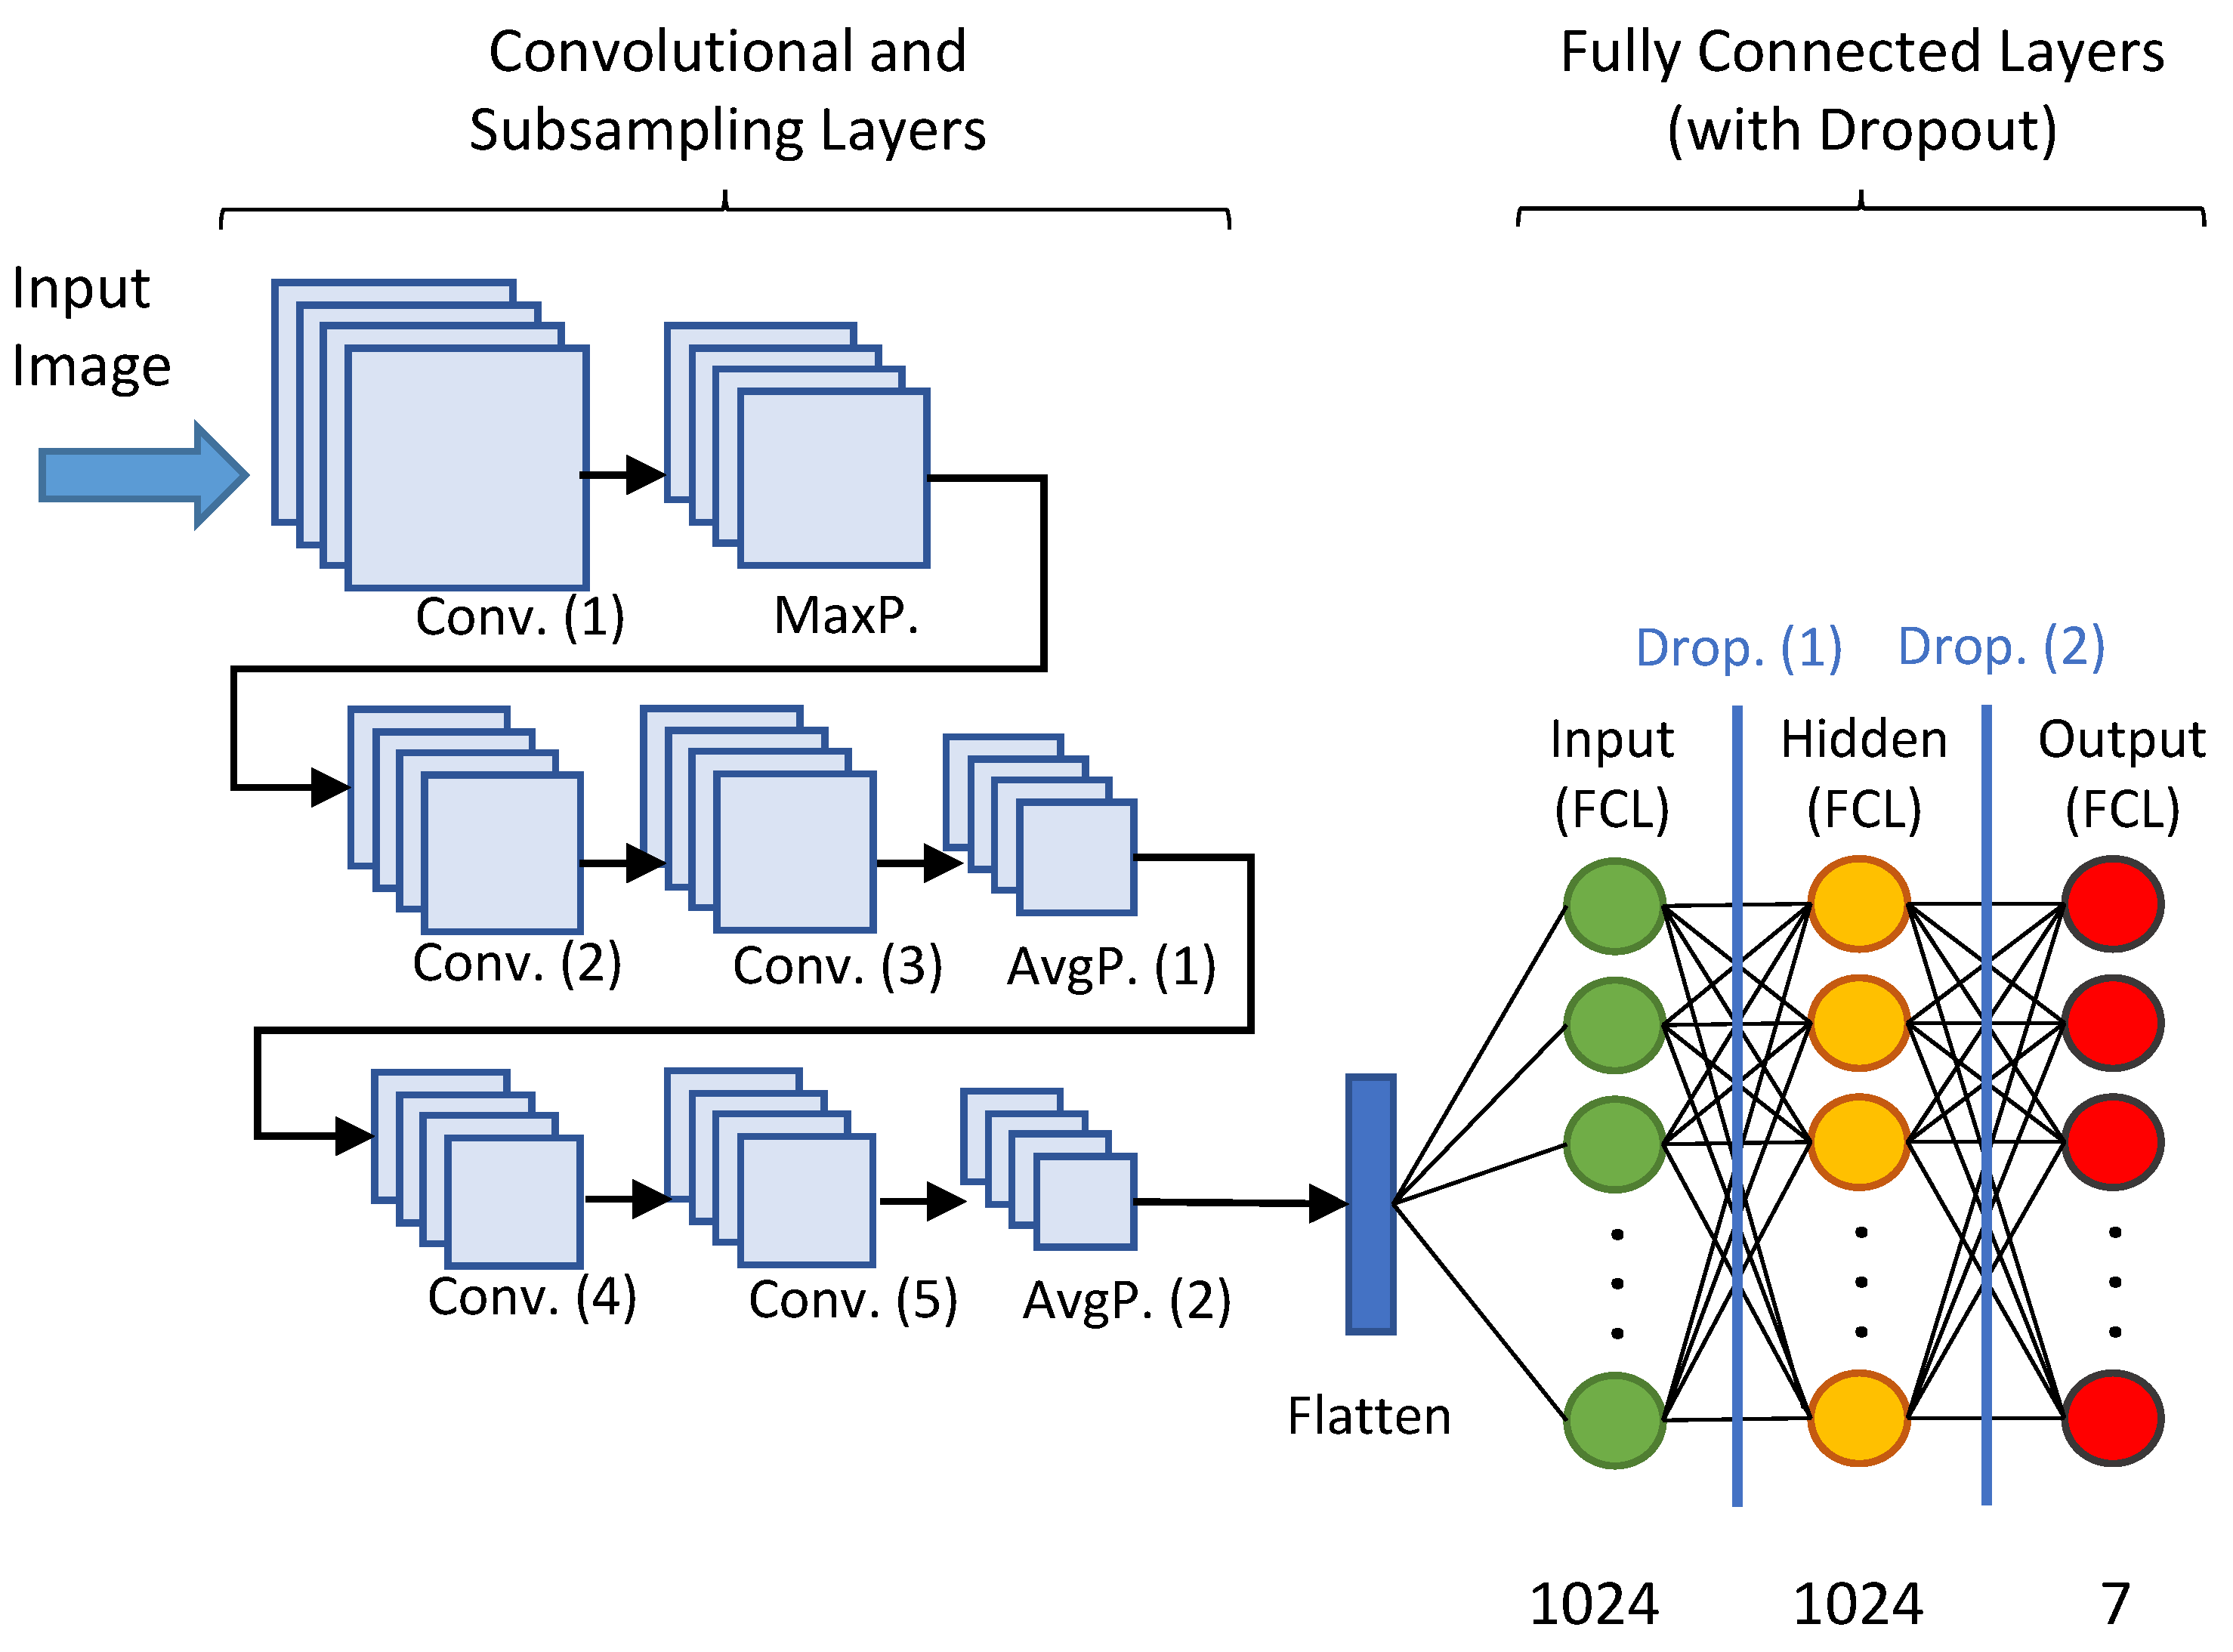
It was decided to add three sets of convolutional layers (the first with only one layer and the others with two) so that the model would be able to detect a large amount of information from the images. After each set, a subsampling layer was attached to reduce the size of its parameters before they were introduced into the final fully connected layers. The diagram of Figure 9 depicts the structure of the convolutional neural network with all the layers that were included, while Table 1 compiles the size of the outputs and the number of parameters generated in each one.
A short description of the layers that make up the CNN network is given below:
  • “Conv (1)”: The first convolutional layer has 64 5 × 5 kernels and uses ReLU as an activation function. Its input size is 48 × 48 × 1 as the input images are 48 pixels wide by 48 pixels high with only one colour channel (black and white).
  • “MaxP”: A 5 × 5 MaxPooling layer with two displacement units.
  • “Conv (2)”: A second convolutional layer with 64 3 × 3 kernels and ReLU as activation function.
  • “Conv (3)”: A third convolutional layer just like the previous one.
  • “AvgP (1)”: A first 3 × 3 AveragePooling layer with two displacement units.
  • “Conv (4)”: A fourth convolutional layer with 128 3 × 3 kernels and ReLU as activation function.
  • “Conv (5)”: A fifth convolutional layer identical to the previous one.
  • “AvgP (2)”: A second 3 × 3 AveragePooling layer with two displacement units
  • “Flatten”: A layer which takes the output from the convolutional layers and converts it to an input vector for the fully connected layers where the classification is finished.
  • “Input (FCL)”: The first fully connected layer with 1024 neurons which takes the inputs from the feature analysis and applies the weights to predict the correct label.
  • “Drop (1)”: A first Dropout layer to get rid of 20% of the neurons and reduce overfitting.
  • “Hidden (FCL)”: A hidden fully connected layer with the same number of neurons as the input.
  • “Drop (2)”: A second layer of Dropout with the same characteristics as the previous one.
  • “Output (FCL) ”: The output layer where a Softmax function is run to convert the output into a probability distribution of size 7 (equal to the number of classes to be classified, i.e., the six basic emotions plus neutral).

5.5. Definition of Neural Network Training

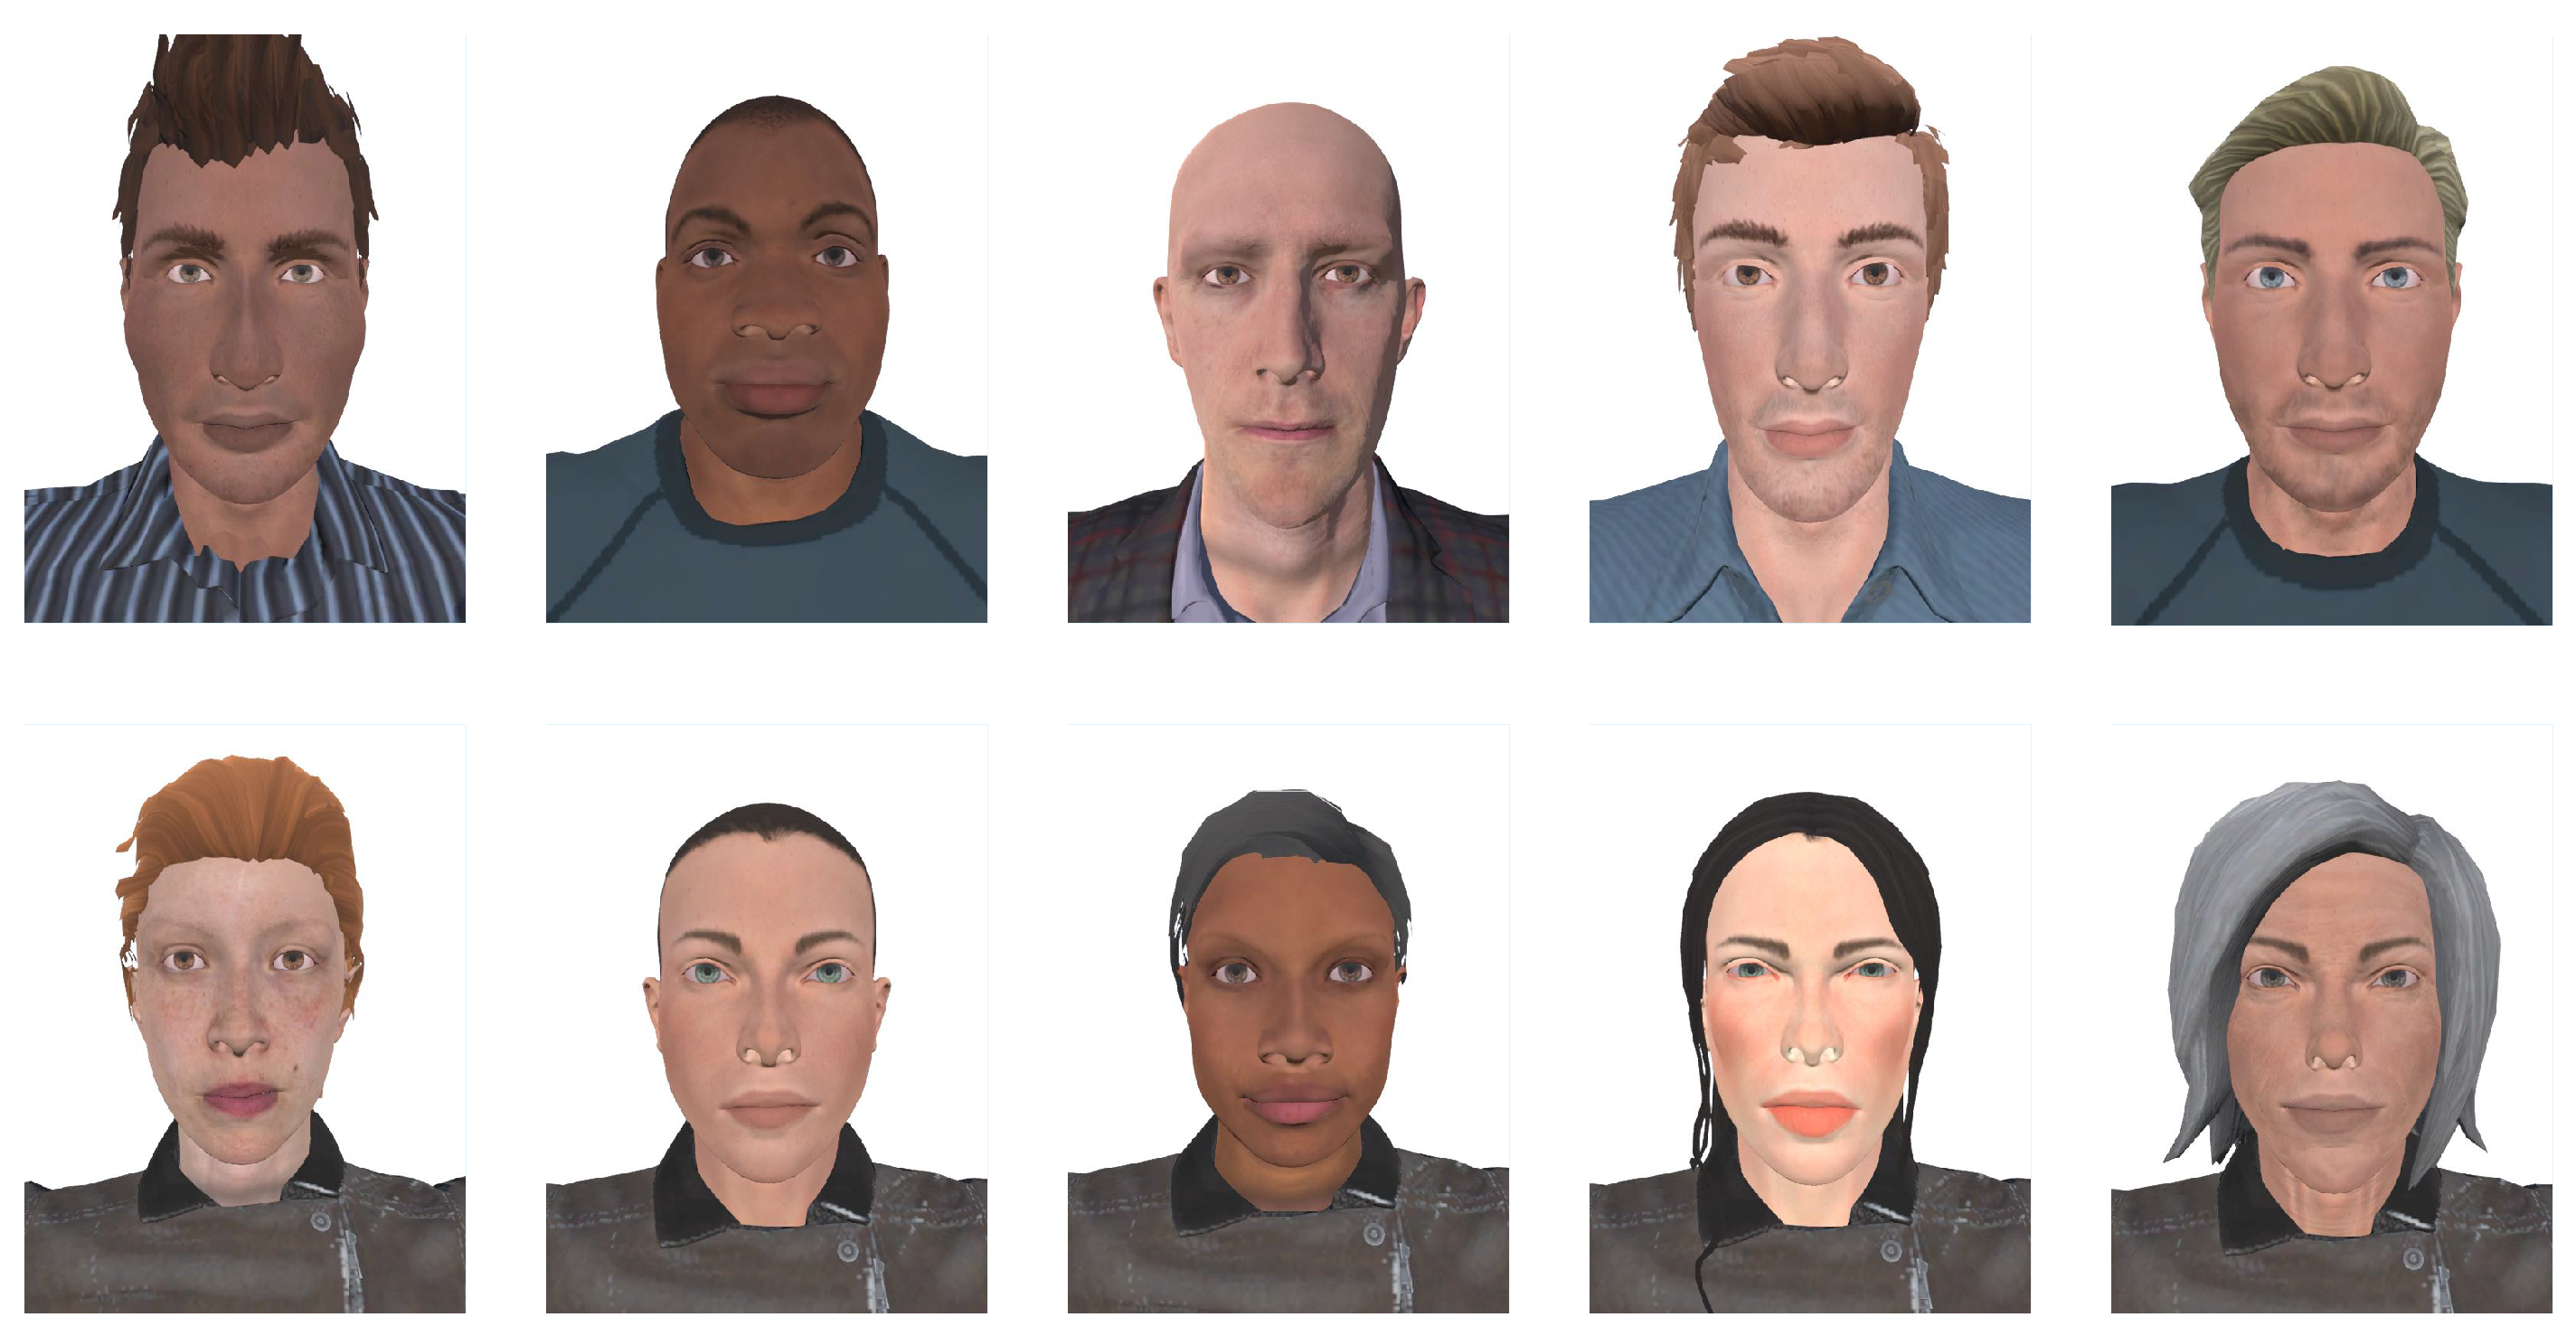
A series of new virtual characters were designed so that the CNN can learn to extract the basic characteristics of emotions from photos of their faces. If the network was trained with the characters included in the application (the male and female avatars shown above in Figure 5), then the model would end up over-adjusting to them, memorising their faces instead of learning to obtain the particularities of each expression independently of the person. It would not serve then to generalise and it would not work well if new characters were added.
For this reason, 10 new avatars were created exclusively to use their photos in the training: five male and five female (they can be seen in Figure 10). All of them are very different from each other, varying in their features and skin colour. For each one, several photographs of their emotions were taken, slightly modifying some features at random so that the image was not always the same (although without changing enough to be considered different emotions). In addition, they were taken in different settings and varying the intensity of the light. This diverse database will help the network to focus on the most important features rather than unnecessary areas.
These images were passed through the cascade sorter models to detect the face areas and cut them out. The size of the photos have a significant influence on the processing time of the convolutions, so they were resized to 48 pixels wide by 48 pixels high (a small resolution but sufficient to distinguish the features). The number of colour channels also affected the processing time, although fortunately this is not a necessary element to detect facial expressions. Therefore, images are converted to black and white (single colour channel). This initial transformation of the images considerably lightens the computational load of the training.
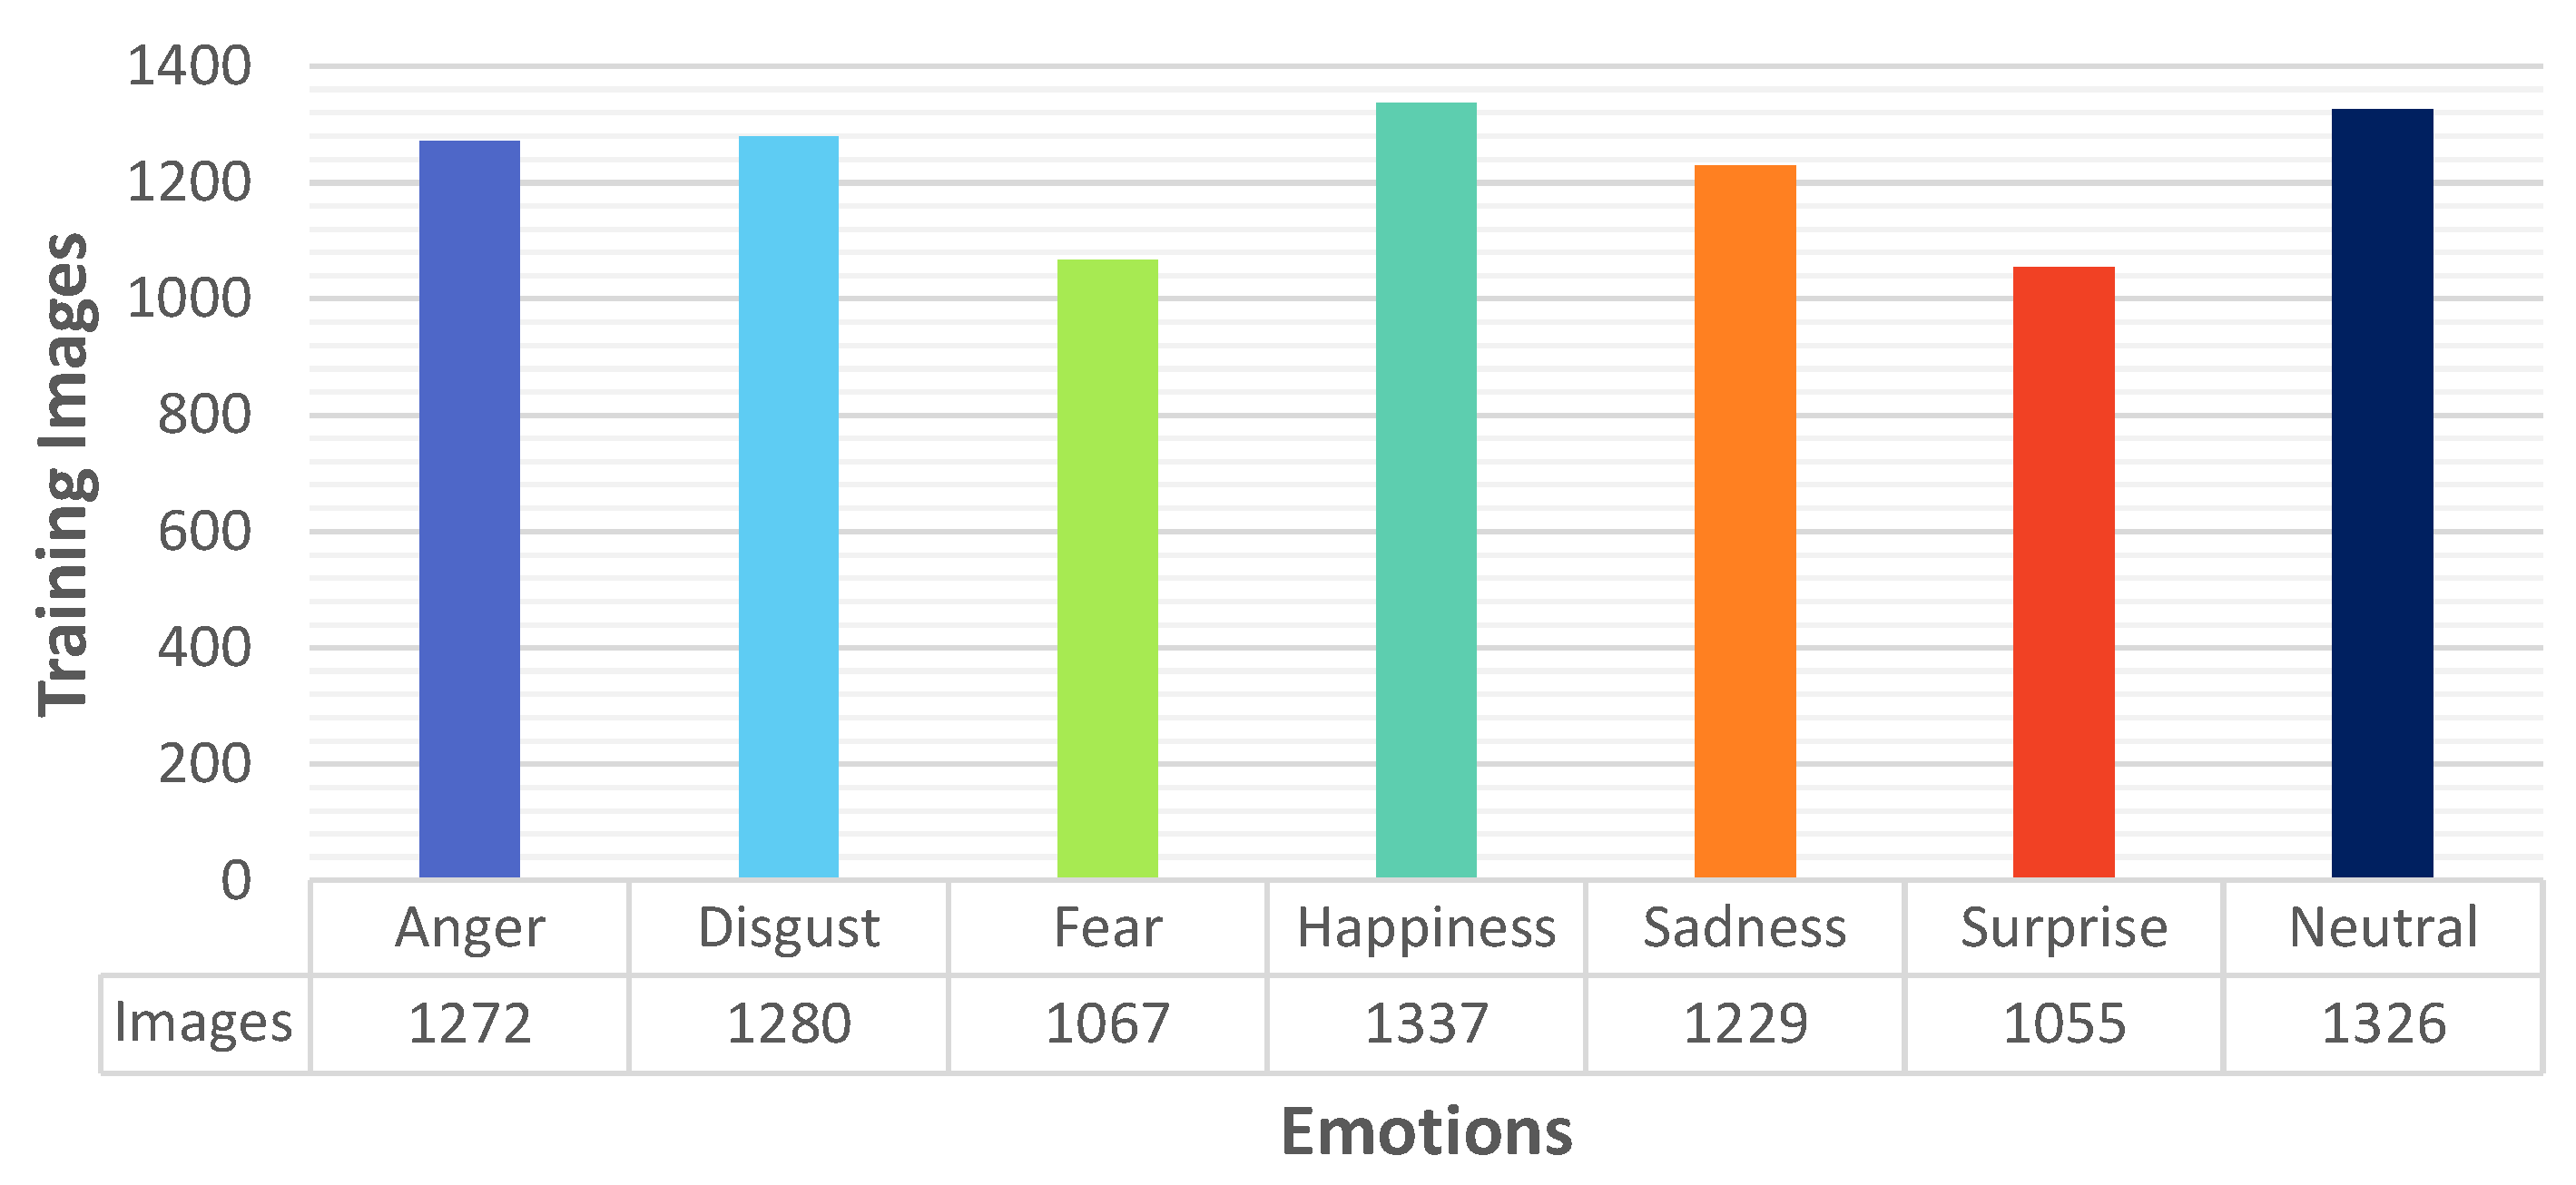
Figure 11 shows the distribution of the samples with the amount of photos available for each emotion. There was a total amount of 8566 images composing the training set. The differences in the number of images per emotion are related to problems with the initial detection of the face. Nevertheless, a similar proportion is maintained between the classes. This will help the model to learn all emotions in the same way and not undermine any of them.
From this data set, a stratified sample (with the same proportion of emotions as the main one) of 10% was taken to be used as a validation of the model during the training (i.e., to check if it improves or worsens when trying different combinations of parameters). In this way, the model was trained in batches of 100 images for 40 epochs. A success rate of 98.25% was obtained for the training set and 89.64% for the validation set. Increasing the number of epochs did not improve the model, and over-adjustment occurred.
The resulting configuration was saved in a file including: its architecture; the values of the weights learned; training configuration and its status (to follow the training process where it was left off). This configuration file must be loaded at the start of the emotion recognition application in order to classify new images.

6. Experimental Results

After completing the development of the new ER module, several tests were carried out to check the correct functioning of the module on the VR platform, which are detailed below. Firstly, a test was presented that focused on the communication between the VR Visualiser and the ER System where it was verified that the emotion detection system correctly classified the avatar’s emotion in the image taken from the UAV camera in the virtual environment, while the second test analysed the performance of the emotion detection using a set of metrics.
The UAV simulator was paramount for the correct functioning of the platform. Therefore, Section 6.1 was introduced to provide a detailed description of how monitoring trajectories are calculated and performed by the quadrotor. This monitoring flight allows obtaining the facial images of the avatar, which were then sent to the ER system for analysis.

6.1. UAV Simulator Data

The UAV simulator module was described in Section 3, block diagram was illustrated in Figure 4, is responsible for performing the calculations related to the position and orientation of the UAV during the monitoring process to capture facial images that will be analysed to determine the person’s emotional state. As already mentioned, in order to perform this calculation, this module needs to know the position and orientation of the person to be monitored at all times, which is received from the VR visualiser through the MQTT communication. Based on this information, the trajectory planner determines the route to be taken by the UAV, which commonly starts from the position of the UAV base station. Then, it approaches the person in order to fly around them and capture facial images with its on-board camera. As a result, the planner generates the set of reference signals for the UAV’s position and orientation which are the inputs to the GPI controller, which finally determines the control inputs to apply to the quadrotor model in order to minimise tracking errors and thus ensure that the UAV performs the monitoring flight accurately.
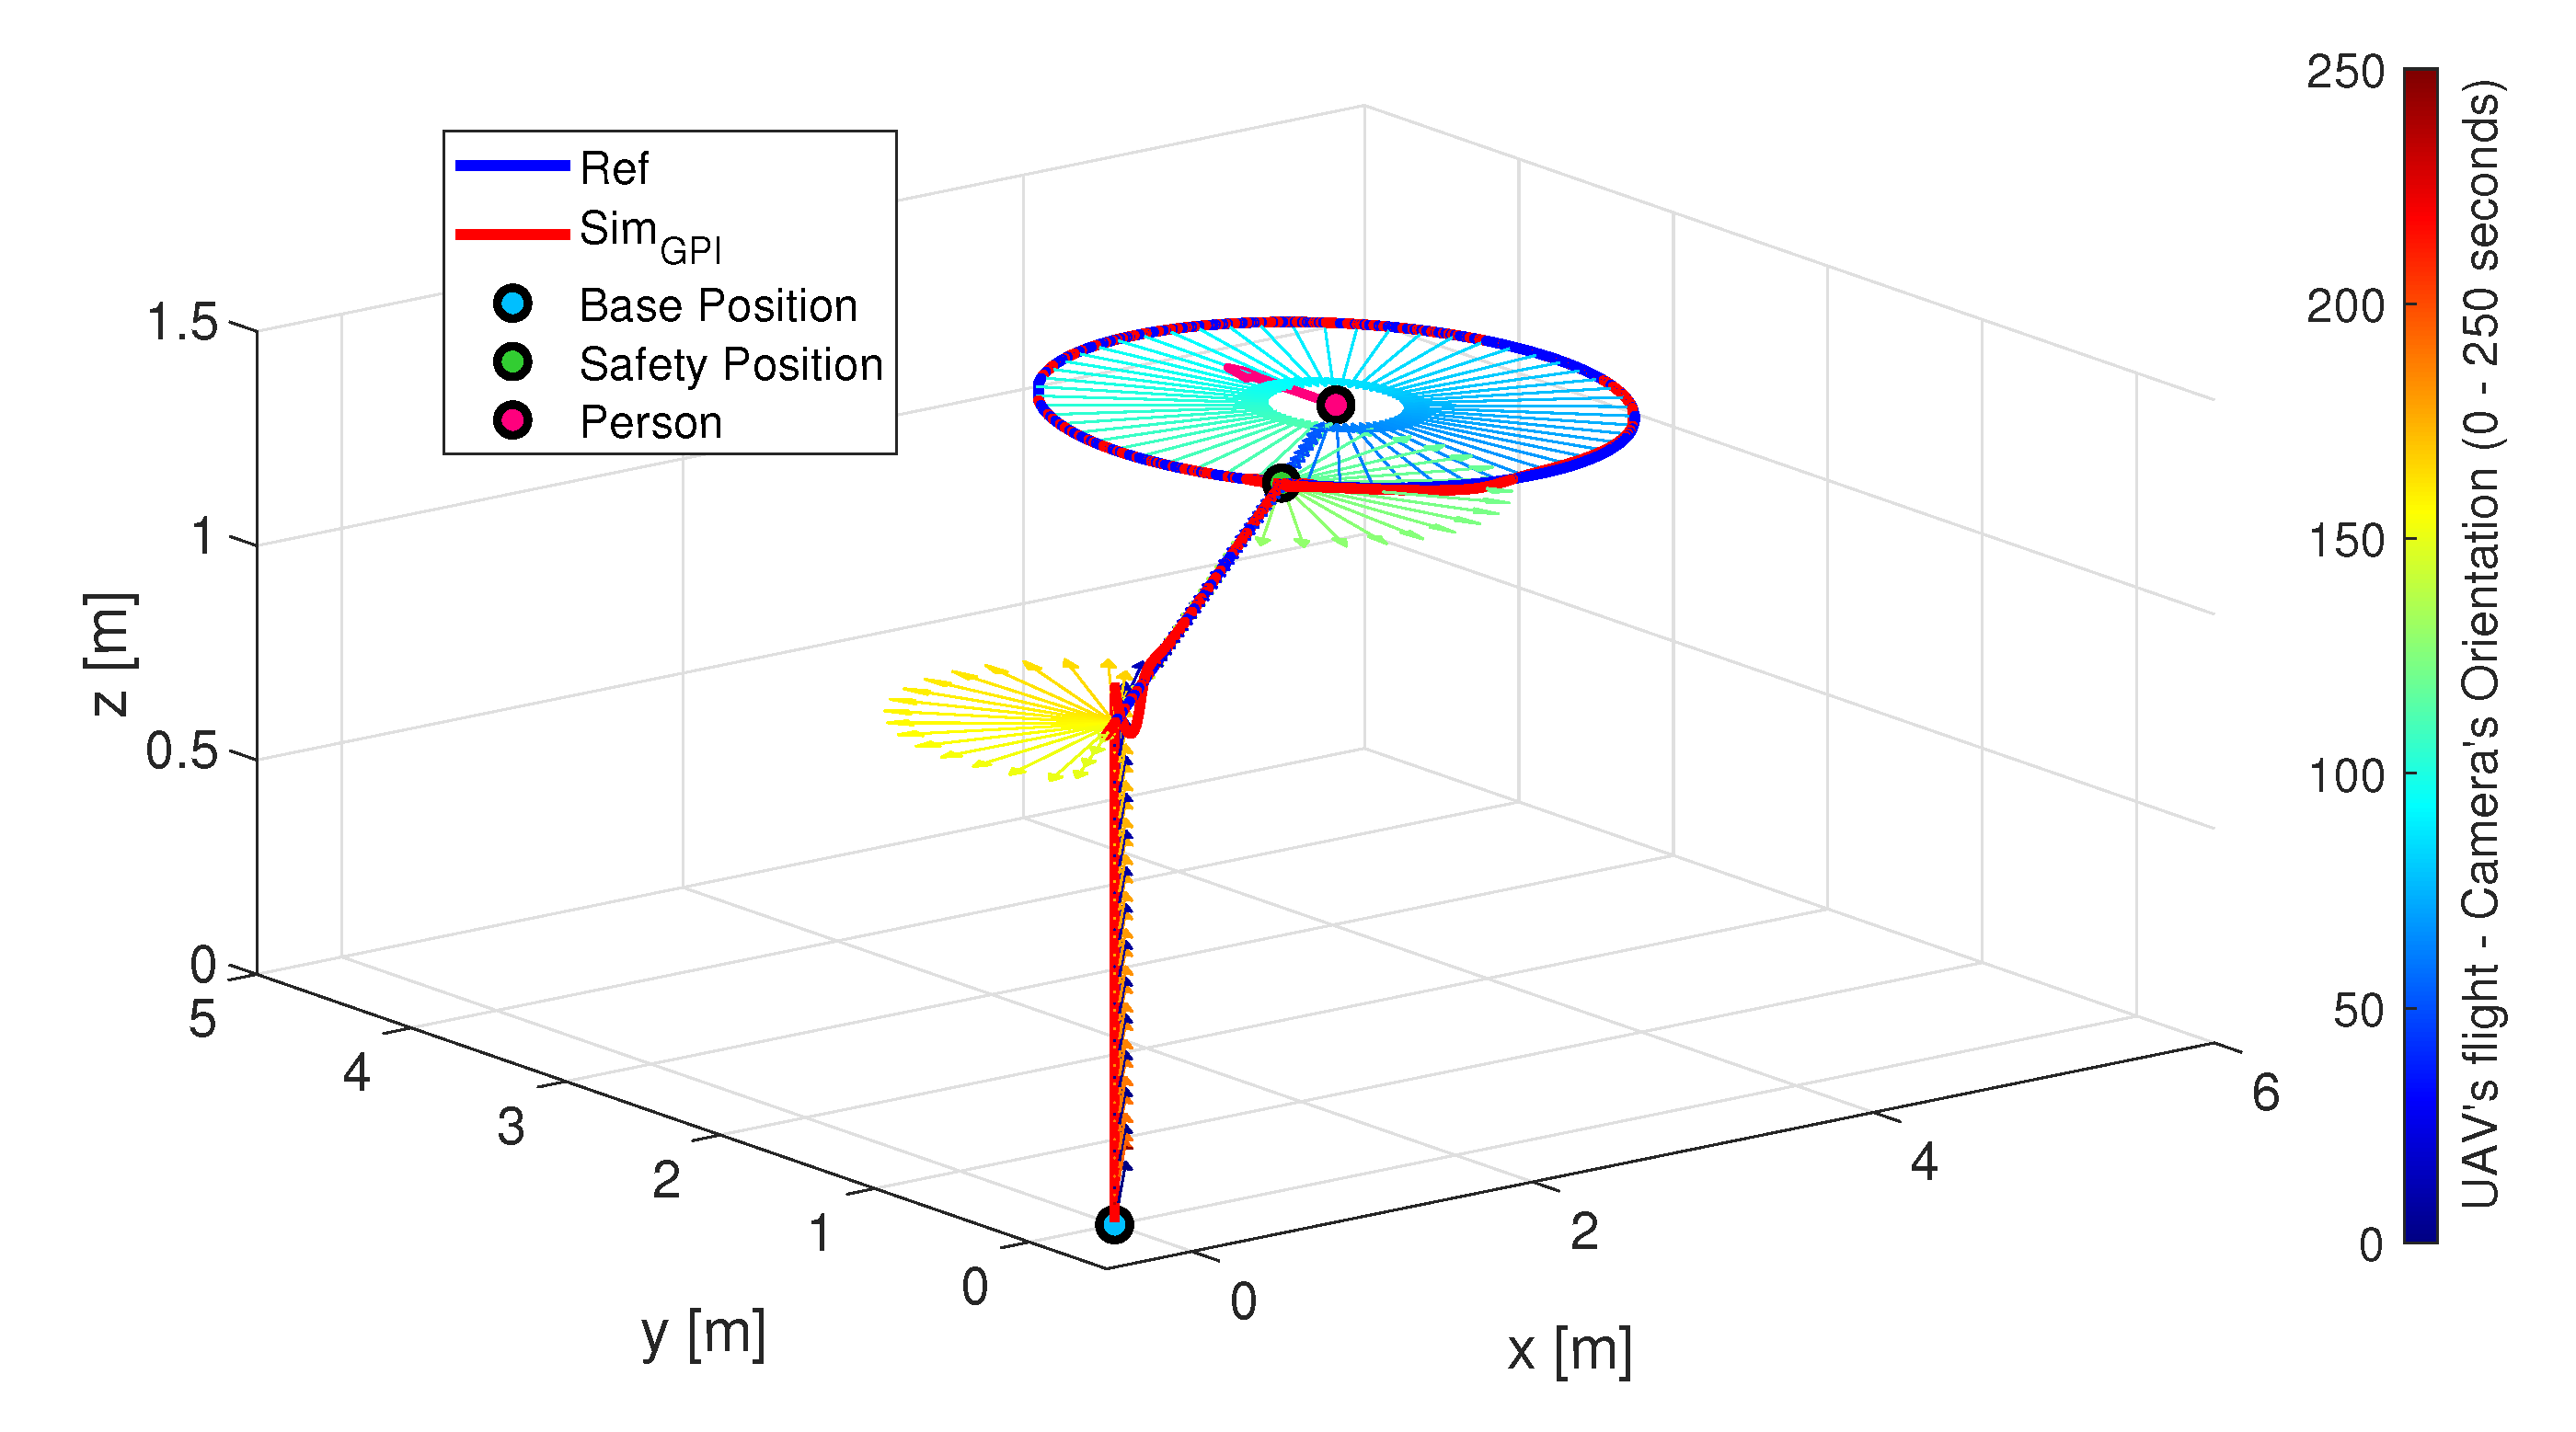
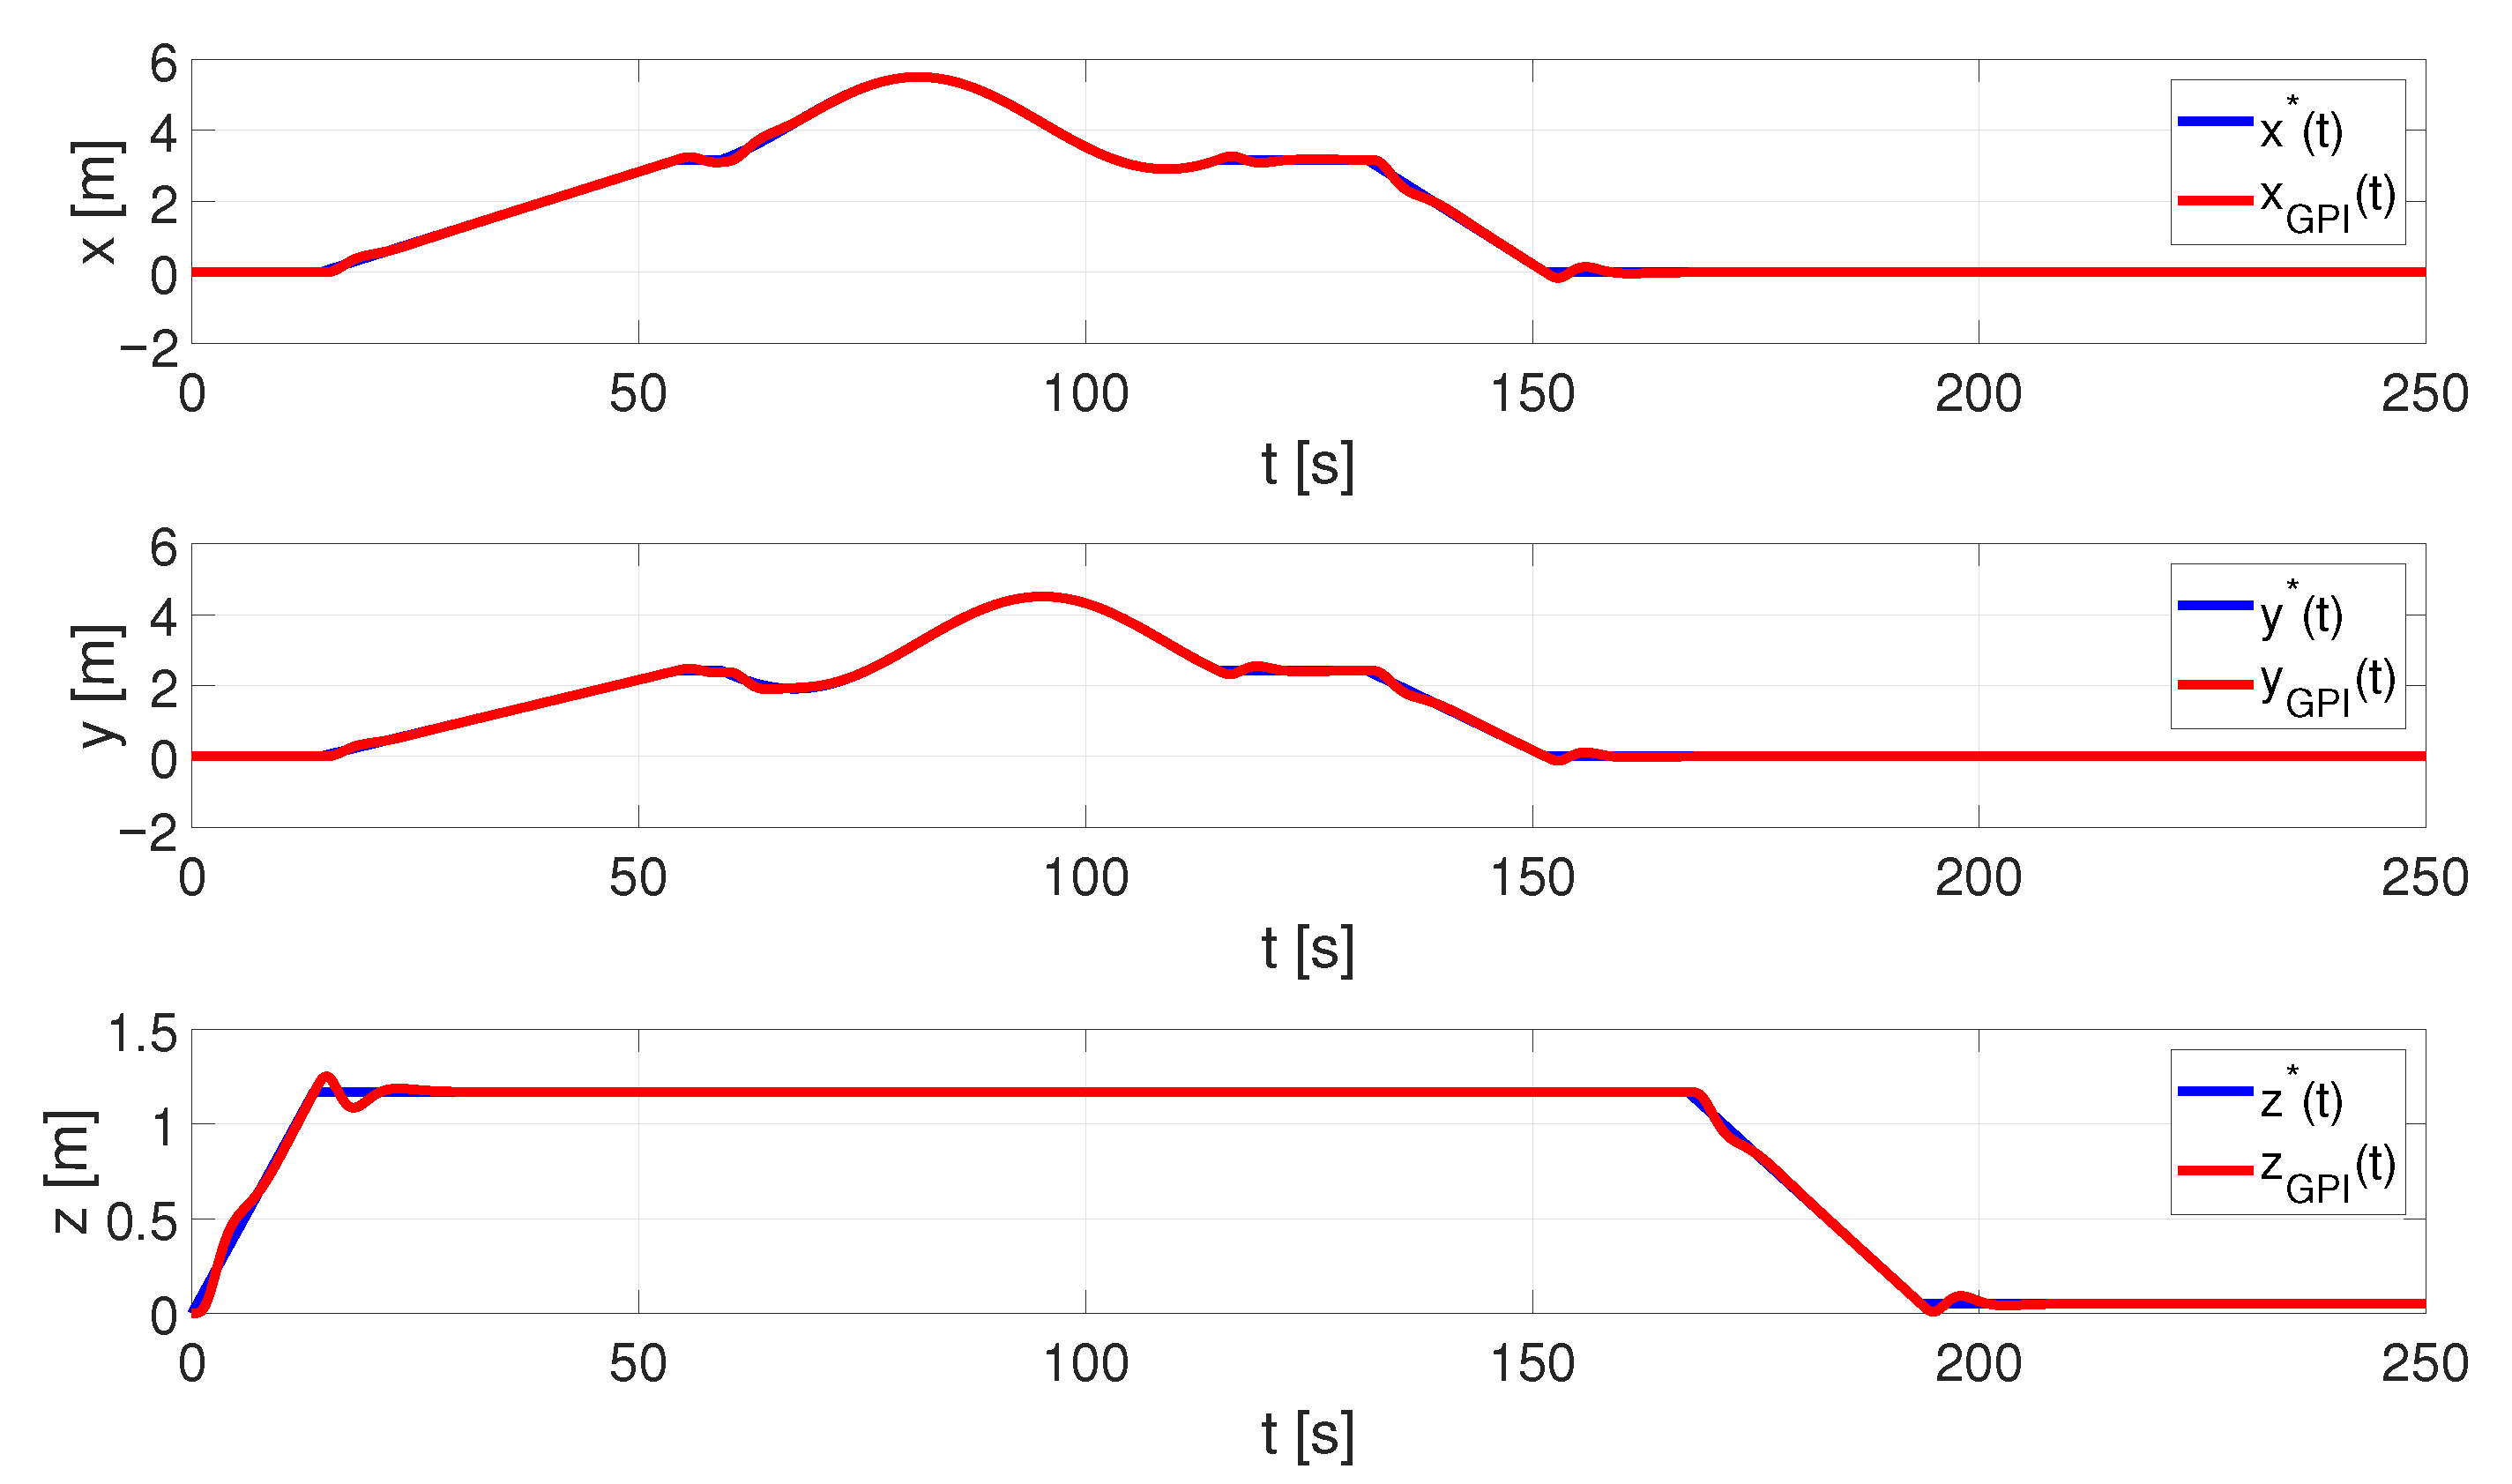
Figure 12, Figure 13, Figure 14 and Figure 15 represent the data generated by the UAV simulator during the monitoring process of an avatar while they are sitting on a couch, which is the scenario used to verify the correct integration of the new ER system within the VR platform (see Section 6.2). The 3D monitoring trajectory calculated by the planner (in blue), versus the real trajectory followed by the quadrotor model under the action of the GPI controller (in red) are represented in Figure 12. As can be seen, the small differences in the two graphs are only noticeable at certain points (blue and red lines visible), while when they coincide, only the red line is visible.
In addition to the position of the UAV, the orientation of the aircraft, and therefore of its on-board camera, is also represented by arrows (in different colours over time), so that the alignment of the final orientation of the camera performed by the controller and the one intended by the planner can be verified. Please note that coloured circles are used to mark key points on the trajectory: the base station from which the UAV begins the monitoring process (and to which it returns after completion), in blue; the safety position to which the UAV is approaching before starting the circular path around the person, in green; and finally, the person’s pose information received from the VR visualiser, the avatar’s head position and where it looks (represented by an arrow), in red.
The details of how the quadrotor manages to track the trajectories prescribed by the planner thanks to the GPI controller can be found in Figure 13 and Figure 14. The former shows the reference for the X Y Z position of the UAV (in blue) versus the actual position of the model (in red), with minimal differences. The latter shows the orientation of the aircraft, in the form of the roll ( ϕ ), pitch ( θ ) and yaw ( ψ ) angles. This figure shows how the controller achieves adjusting the yaw angle in order to orientate the UAV’s on-board camera as mentioned before (yaw reference angle in blue, actual in red).
The GPI control drives the model towards perfectly tracking the reference trajectories by means of the input control vector applied to the quadcopter model and illustrated in Figure 15. This way, the total thrust, u, and the angular moments, τ θ , τ ϕ , τ ψ (rolling moment, pitching moment and yawing moment, respectively) are represented over time. As a result of this action, the UAV pose will be able to follow the reference trajectories and thereby perform the expected monitoring flight.

6.2. Integration of the ER System into the VR Platform

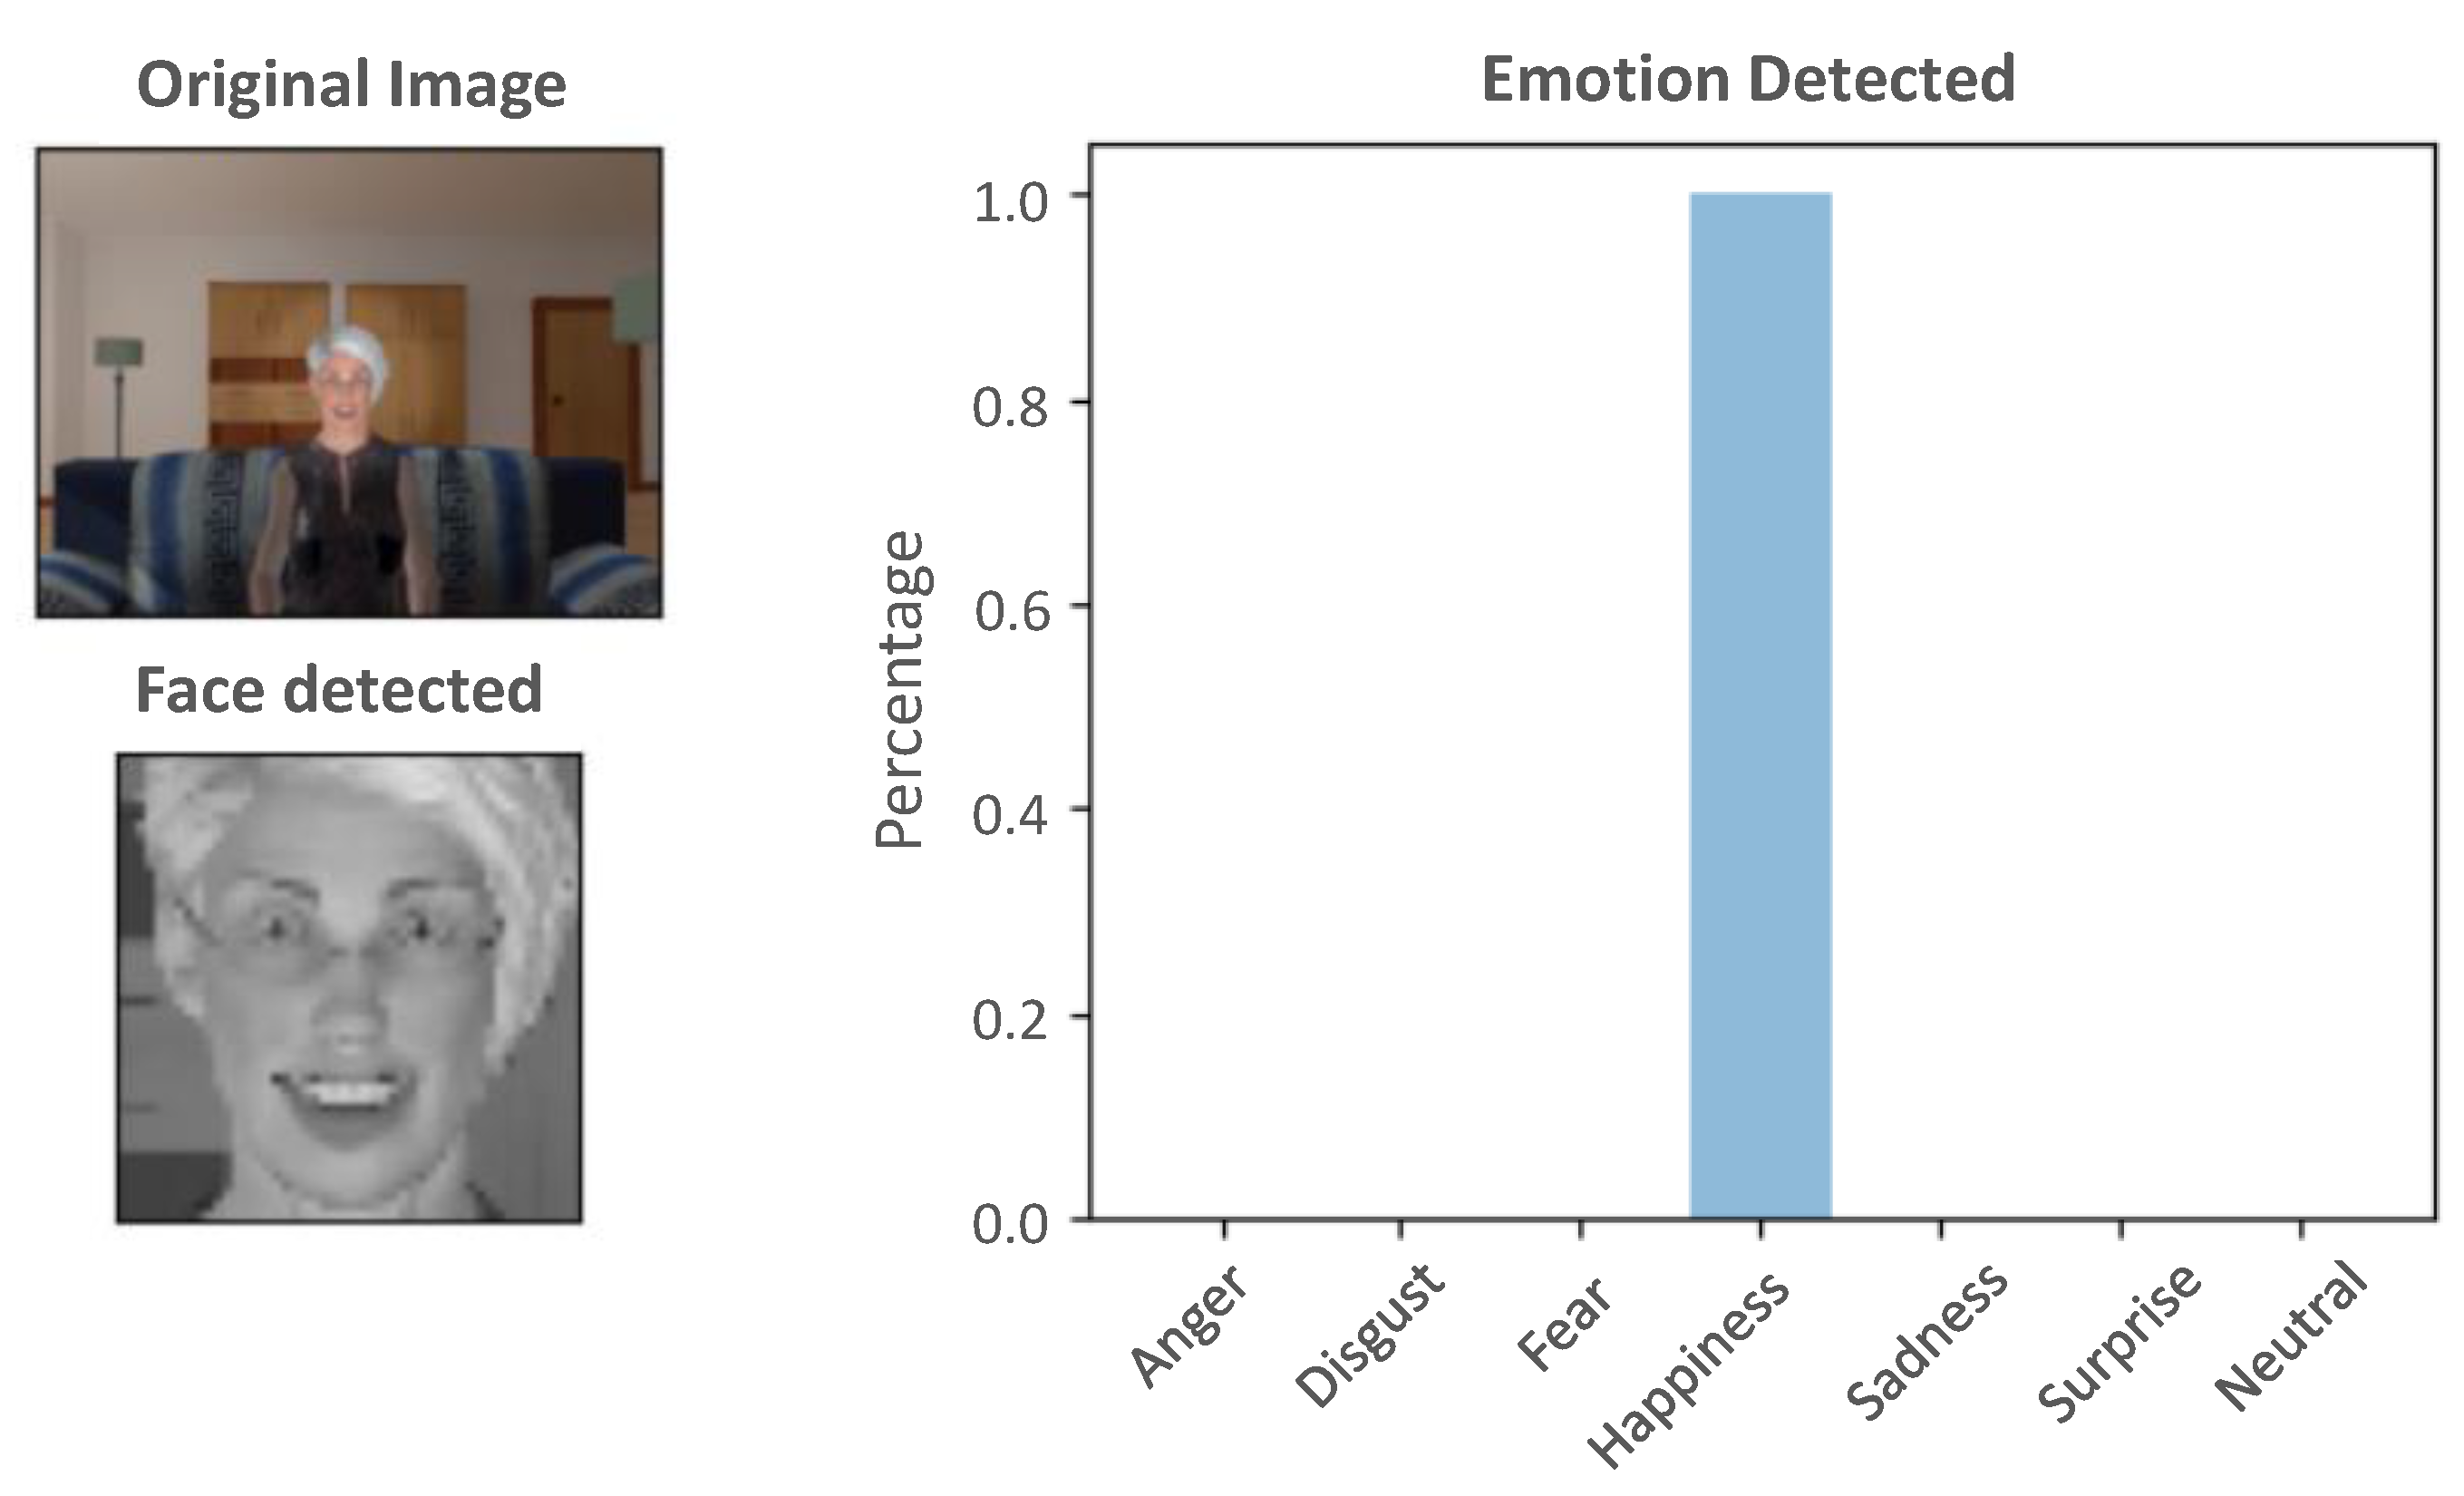
The following is an example to verify that the communication between the VR Visualiser and the ER System works as expected. After receiving the images from Unity and performing the classification process, the model generates a probability distribution for all the emotions. An example of the emotion detection interface is shown in Figure 16. The original image is in the upper left corner, whilst underneath it is the face that was detected (already transformed to enter the model) and on the right there is a graph with the percentages for each emotion. At the end of the classification, the recognition system returns a message with the detected emotion together with its percentage of certainty.
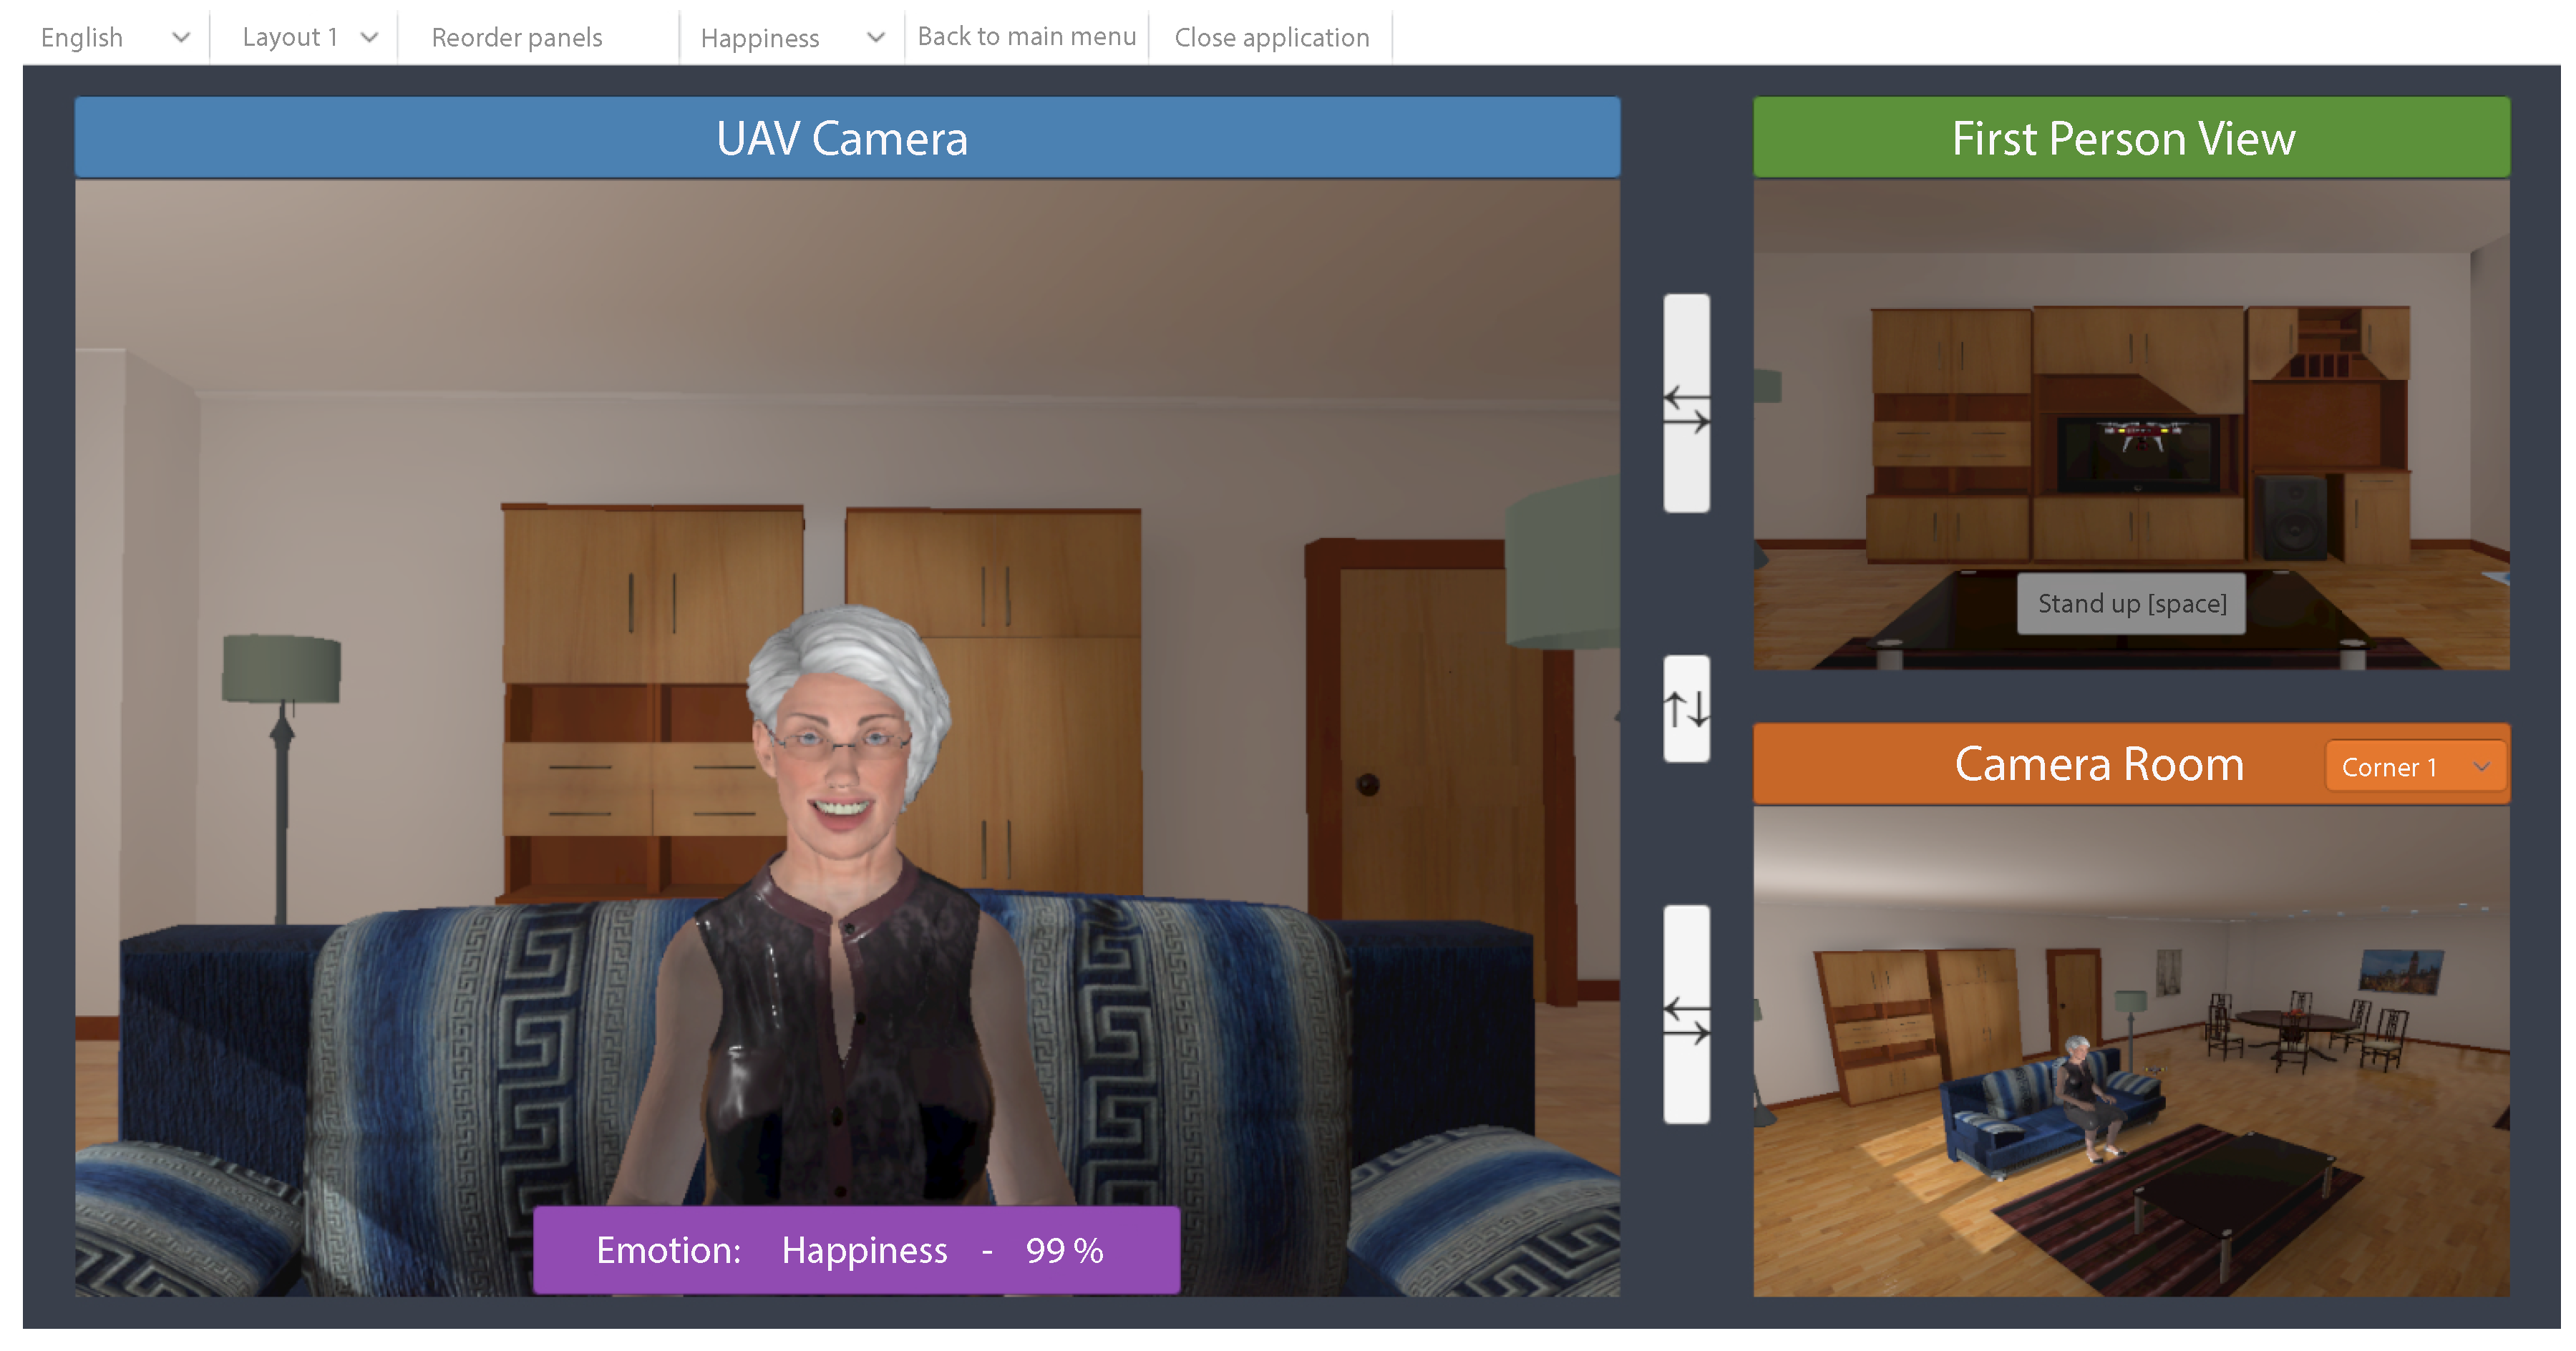
Figure 17 shows the VR simulator implemented in Unity when the message with the information of the emotion is received. It is divided into different sections that show various views of the environment. On the UAV’s camera section, the data received from the detection system are shown on the purple panel at the bottom. The application correctly displays the detected emotion together with its percentage, so the communication between both programs works as expected.

6.3. Performance Test of the Emotion Detector

From an initial set of 616 images (44 images per seven classes per two avatars), 502 images with faces of the male and female avatar emotions were correctly identified by the face detection algorithm and were used to test the emotion classifier. It is important to remember that no images of these two characters were used for the training of the convolutional neural network, so it will be the first time the CNN finds them. If they are correctly classified, it means that the neural network has successfully extracted the most important features from the training images and can generalise to new cases.
Confusion matrices have been used in order to analyse the performance of the classifier. The rows of the matrix represent the real classes (to which each case really belongs) and the columns indicate the classification done by the model. The main diagonal represents correct classifications, while other cells are classification errors. Thus, Figure 18 shows the confusion matrix for the test performed with a combination of the man and woman images. In addition, the right side of this image shows the recall or true positive rate (TPR) and the false negative rate (FNR). They are the percentages of images classified correctly (left column) and incorrectly (right column) for each emotion, respectively. Regarding anger, 100% of the images were correctly classified, while this percentage drops to 53% for the case of fear, the worst case. On the other hand, the precision or positive predictive value (PPV) and the false discovery rate (FDR), that is, the percentages of correct (first row) versus incorrect (second row) predictions are shown at the bottom. In this case, the best result is for surprise, as 98.1% of the predictions about this emotion were correct, compared to 73.2% and 74.7% for the cases of anger and disgust, respectively.
To complete the data analysis, several metrics are summarised in Table 2; the accuracy (ACC), the aforementioned recall (TPR) and precision (PPV), the specificity or true negative rate (TNR), and the F1 score, the harmonic mean of precision and recall. All these parameters were calculated for each class (emotion), and also globally, using the arithmetic mean and the weighted average (taking into account the number images of each class). According to the metrics, over 84% in all average parameters, it can be concluded that the model works satisfactorily and it is able to correctly classify the emotions in a high percentage of cases.

7. Conclusions and Future Work

The main long-term objective of our research project is the development of an assistant aerial vehicle for monitoring dependent people at home. This social robot will have the mission of flying every so often to take snapshots of the person in order to determine their state and based on this, whether assistance or help is needed. To determine the person’s state, emotion analysis was selected as the main technique in our proposal. In the development of this project, we designed a VR platform that allowed us to have a safe environment in which to develop and validate the different solutions at an engineering level, as well as to carry out studies with participants in a realistic environment in order to adapt the solutions to the preferences of future users and their families. This VR platform is based on the real-time communication of three modules using the MQTT message protocol; the UAV Simulator implemented in MATLAB, the VR Visualiser developed in Unity and the new ER System programmed in Python.
The computer vision ER module is the great novelty of this work and is composed of two main parts: a set of cascade classifiers used to detect the face of the person in the image received from the camera on board the UAV, and a CNN designed for classifying the person’s emotion in one of the six plus one basic emotions (surprise; fear; happiness; sadness; disgust; anger; or neutral expression). At this point, we would like to highlight the manifold possibilities to use this proposal for other applications based on facial cues detection, such as assisting drivers (e.g., driver attention detection, sleeping detection, yawning detection, mobile phone detection [33]) and biometric surveillance (e.g., video-based face recognition [34]), among others.
The integration of the new ER System within the VR platform was evaluated and fulfilled the expected function. The VR Visualiser sends the images captured by the on-board camera of the virtual quadrotor to the ER System, while the latter sends back the information about the avatar’s emotion after the image analysis is finished. Apart from this, within the VR platform, the UAV Simulator and the VR Visualiser need to exchange information for the correct navigation of the UAV during the monitoring process. In this sense, the results showed that the trajectory planner correctly determines the references for the UAV’s position and yaw angle according to the position and orientation of the person, while the 3D virtual quadrotor reproduces the flight based on the UAV state information received from the UAV Simulator. More details about the trajectory planner operation can be found in our previous works [13,24].
On the other hand, the results of the tests carried out to evaluate the behaviour of the CNN demonstrate that the system is able to correctly classify the emotions in a great number of cases. The metrics used to measure the performance are higher than 84% in all the cases and the F1 score, which is a balance between the precision and recall, near 85%. This way, the results of the CNN can be considered satisfactory, however, it should be noted that inaccuracies were observed because the set of cascade classifiers sometimes fail to correctly detect the face of the person in the aerial images. Therefore, this makes the overall performance of the ER System decrease.
This is one of the points of improvement for future work: to achieve a higher percentage of success in detecting the person’s face so that more images can be analysed by the CNN. In this regard, in future work we propose to evaluate novel deep learning methods showing excellent classification results. The inclusion, after the face detection stage, of novel CNNs such as recurrent CNNs [35] or novel CNNs [36] will probably increase the percentage of emotions correctly detected.
Other points to debug and refine in order to improve the CNN results will be to increase the set of CNN training images with new characters, different degrees of emotions and with pictures taken without being fully frontal (with the head slightly rotated). In addition, it should be mentioned that the ER System could be used in the future implementation of the assistant UAV that monitors dependent people in a real environment, as the methodology used is valid for images of real people. However, some calibrations would probably be needed to fine-tune and adapt this module to a real environment.
Apart from future work aimed at improving the ER system, and in relation to the long-term goal of developing the social robot for the care of dependent people, it is worth highlighting the need to extend the current functionality of the trajectory planner. It is essential to add transitions between states in order to enable the monitoring process when the person moves, as well as to solve the problem of obstacle detection and avoidance. In addition, energy limitations and possible failures in the communication with the processing system must also be considered, so that the UAV returns to its base position in any circumstance that prevents the monitoring flight to be performed in a completely safe way. All these challenges will be our main lines of research, and the VR platform will be a fundamental tool to achieve them.

Author Contributions

L.M.B., R.M., A.M., A.S.G. and A.F.-C. conceived the proposal. L.M.B., R.M., A.M., A.S.G. and A.F.-C. designed and evaluated the proposed trajectory planning algorithm. L.M.B., R.M., A.M., A.S.G. and A.F.-C. designed and evaluated the virtual reality environments and the computer vision algorithm. L.M.B., R.M., A.M., A.S.G. and A.F.-C. managed the study. Additionally, L.M.B., R.M. and A.S.G. and A.F.-C. analysed the data and participated in writing the paper. All authors have read and agreed to the published version of the manuscript.

Funding

The work leading to this paper has received funding from iRel40 and VALU3S projects. iRel40 and VALU3S are European co-funded innovation projects that have been granted by the ECSEL Joint Undertaking (JU) under grant agreements No. 876659 and 876852, respectively. The funding of the projects comes from the Horizon 2020 research programme and participating countries. National funding is provided by Germany, including the Free States of Saxony and Thuringia, Austria, Belgium, Finland, France, Italy, the Netherlands, Slovakia, Spain, Sweden, and Turkey. This work has received National funding from Spain’s Agencia Estatal de Investigación (AEI) under PCI2020-112240 and PCI2020-112001 grants, respectively. In addition, this work was partially supported by Spanish Ministerio de Ciencia, Innovación y Universidades, Agencia Estatal de Investigación (AEI) / European Regional Development Fund (FEDER, UE) under EQC2019-006063-P and PID2020-115220RB-C21 grants, and by CIBERSAM of the Instituto de Salud Carlos III.

Conflicts of Interest

The authors declare no conflict of interest.

Abbreviations

The following abbreviations are used in this manuscript:
ACCAccuracy
CNNConvolutional Neural Network
EREmotion Recognition
FCLFully Connected Layer
FDRFalse Discovery Rate
FNFalse Negative
FNRFalse Negative Rate
FPFalse Positive
GPIGeneralised Proportional Integral
MLPMultilayer Perceptron
MQTTMessage Queue Telemetry Transport
PPVPositive Predictive Value (or Precision)
TNTrue Negative
TNRTrue Negative Rate (or Specificity)
TPTrue Positive
TPRTrue Positive Rate (or Recall)
UAVUnmanned Aerial Vehicle
VRVirtual Reality

References

  1. Fong, T.; Nourbakhsh, I.; Dautenhahn, K. A survey of socially interactive robots. Robot. Auton. Syst. 2003, 42, 143–166. [Google Scholar] [CrossRef] [Green Version]
  2. Calderita, L.V.; Vega, A.; Barroso-Ramírez, S.; Bustos, P.; Núñez, P. Designing a Cyber-Physical System for Ambient Assisted Living: A Use-Case Analysis for Social Robot Navigation in Caregiving Centers. Sensors 2020, 20, 4005. [Google Scholar] [CrossRef] [PubMed]
  3. Loza-Matovelle, D.; Verdugo, A.; Zalama, E.; Gómez-García-Bermejo, J. An Architecture for the Integration of Robots and Sensors for the Care of the Elderly in an Ambient Assisted Living Environment. Robotics 2019, 8, 76. [Google Scholar] [CrossRef] [Green Version]
  4. Sokullu, R.; Balcı, A.; Demir, E. The Role of Drones in Ambient Assisted Living Systems for the Elderly. In Enhanced Living Environments: Algorithms, Architectures, Platforms, and Systems; Ganchev, I., Garcia, N.M., Dobre, C., Mavromoustakis, C.X., Goleva, R., Eds.; Springer International Publishing: Cham, Switzerland, 2019; pp. 295–321. [Google Scholar] [CrossRef]
  5. Wang, J.; Spicher, N.; Warnecke, J.M.; Haghi, M.; Schwartze, J.; Deserno, T.M. Unobtrusive Health Monitoring in Private Spaces: The Smart Home. Sensors 2021, 21, 864. [Google Scholar] [CrossRef] [PubMed]
  6. Lee, W.; Kim, J.H. Social Relationship Development between Human and Robot through Real-Time Face Identification and Emotional Interaction. In Proceedings of the Companion of the 2018 ACM/IEEE International Conference on Human-Robot Interaction (HRI’18), Chicago, IL, USA, 5–8 March 2018; Association for Computing Machinery: New York, NY, USA, 2018; p. 379. [Google Scholar] [CrossRef]
  7. Malliaraki, E. Social Interaction with Drones Using Human Emotion Recognition. In Proceedings of the Companion of the 2018 ACM/IEEE International Conference on Human-Robot Interaction (HRI’18), Chicago, IL, USA, 5–8 March 2018; Association for Computing Machinery: New York, NY, USA, 2018; pp. 187–188. [Google Scholar] [CrossRef]
  8. Liu, S.; Watterson, M.; Mohta, K.; Sun, K.; Bhattacharya, S.; Taylor, C.J.; Kumar, V. Planning Dynamically Feasible Trajectories for Quadrotors Using Safe Flight Corridors in 3-D Complex Environments. IEEE Robot. Autom. Lett. 2017, 2, 1688–1695. [Google Scholar] [CrossRef]
  9. Giansanti, D. The Social Robot in Rehabilitation and Assistance: What Is the Future? Healthcare 2021, 9, 244. [Google Scholar] [CrossRef] [PubMed]
  10. Belmonte, L.M.; Morales, R.; García, A.S.; Segura, E.; Novais, P.; Fernández-Caballero, A. Assisting Dependent People at Home through Autonomous Unmanned Aerial Vehicles. In Proceedings of the International Symposium on Ambient Intelligence, Ávila, Spain, 26–28 June 2019; Advances in Intelligent Systems and Computing. Springer International Publishing: Cham, Switzerland, 2019; pp. 216–223. [Google Scholar] [CrossRef]
  11. Berni, A.; Borgianni, Y. Applications of Virtual Reality in Engineering and Product Design: Why, What, How, When and Where. Electronics 2020, 9, 1064. [Google Scholar] [CrossRef]
  12. De la Cruz, M.; Casañ, G.; Sanz, P.; Marín, R. Preliminary Work on a Virtual Reality Interface for the Guidance of Underwater Robots. Robotics 2020, 9, 81. [Google Scholar] [CrossRef]
  13. Belmonte, L.; Garcia, A.S.; Segura, E.; Novais, P.J.; Morales, R.; Fernandez-Caballero, A. Virtual Reality Simulation of a Quadrotor to Monitor Dependent People at Home. IEEE Trans. Emerg. Top. Comput. 2020. [Google Scholar] [CrossRef]
  14. Castillo, P.; Dzul, A.; Lozano, R. Real-time stabilization and tracking of a four-rotor mini rotorcraft. IEEE Trans. Control Syst. Technol. 2004, 12, 510–516. [Google Scholar] [CrossRef]
  15. Fernández-Caballero, A.; Belmonte, L.M.; Morales, R.; Somolinos, J.A. Generalized Proportional Integral Control for an Unmanned Quadrotor System. Int. J. Adv. Robot. Syst. 2015, 12, 85. [Google Scholar] [CrossRef] [Green Version]
  16. Morales, R.; Sira-Ramírez, H. Trajectory tracking for the magnetic ball levitation system via exact feedforward linearisation and GPI control. Int. J. Control 2010, 83, 1155–1166. [Google Scholar] [CrossRef]
  17. Morales, R.; Feliu, V.; Jaramillo, V. Position control of very lightweight single-link flexible arms with large payload variations by using disturbance observers. Robot. Auton. Syst. 2012, 60, 532–547. [Google Scholar] [CrossRef]
  18. Morales, R.; Sira-Ramírez, H.; Feliu, V. Adaptive control based on fast online algebraic identification and GPI control for magnetic levitation systems with time-varying input gain. Int. J. Control 2014, 87, 1604–1621. [Google Scholar] [CrossRef]
  19. Morales, R.; Feliu, V.; Sira-Ramirez, H. Nonlinear Control for Magnetic Levitation Systems Based on Fast Online Algebraic Identification of the Input Gain. IEEE Trans. Control Syst. Technol. 2011, 19, 757–771. [Google Scholar] [CrossRef]
  20. Belmonte, L.M.; Morales, R.; Fernández-Caballero, A.; Somolinos, J.A. Robust Linear Longitudinal Feedback Control of a Flapping Wing Micro Air Vehicle. In Artificial Computation in Biology and Medicine; Ferrández Vicente, J.M., Álvarez-Sánchez, J.R., de la Paz López, F., Toledo-Moreo, F.J., Adeli, H., Eds.; Springer International Publishing: Cham, Switzerland, 2015; pp. 449–458. [Google Scholar]
  21. Belmonte, L.M.; Morales, R.; Fernández-Caballero, A.; Somolinos, J.A. A tandem active disturbance rejection control for a laboratory helicopter with variable-speed rotors. IEEE Trans. Ind. Electron. 2016, 63, 6395–6406. [Google Scholar] [CrossRef]
  22. Belmonte, L.M.; Morales, R.; Fernández-Caballero, A.; Somolinos, J.A. Robust decentralized nonlinear control for a twin rotor MIMO system. Sensors 2016, 16, 1160. [Google Scholar] [CrossRef] [Green Version]
  23. Panduro, R.; Segura, E.; Belmonte, L.M.; Fernández-Caballero, A.; Novais, P.; Benet, J.; Morales, R. Intelligent trajectory planner and generalised proportional integral control for two carts equipped with a red-green-blue depth sensor on a circular rail. Integr. Comput. Aided Eng. 2020, 27, 267–285. [Google Scholar] [CrossRef]
  24. Belmonte, L.M.; García, A.S.; Morales, R.; de la Vara, J.L.; López de la Rosa, F.; Fernández-Caballero, A. Feeling of Safety and Comfort towards a Socially Assistive Unmanned Aerial Vehicle That Monitors People in a Virtual Home. Sensors 2021, 21, 908. [Google Scholar] [CrossRef] [PubMed]
  25. Ekman, P.; Friesen, W. Facial Action Coding System: A Technique for the Measurement of Facial Movement; Consulting Psychologists Press: Palo Alto, CA, USA, 1978. [Google Scholar]
  26. García, A.S.; Fernández-Sotos, P.; Vicente-Querol, M.A.; Lahera, G.; Rodriguez-Jimenez, R.; Fernández-Caballero, A. Design of reliable virtual human facial expressions and validation by healthy people. Integr. Comput. Aided Eng. 2020, 27, 287–299. [Google Scholar] [CrossRef]
  27. Viola, P.; Jones, M. Rapid object detection using a boosted cascade of simple features. In Proceedings of the 2001 IEEE Computer Society Conference on Computer Vision and Pattern Recognition (CVPR 2001), Kauai, HI, USA, 8–14 December 2001; Volume 1, p. I. [Google Scholar] [CrossRef]
  28. Bradski, G. The OpenCV Library. Dr. Dobb’S J. Softw. Tools 2000, 120, 122–125. [Google Scholar]
  29. Kaehler, A. Learning OpenCV 3: Computer Vision in C++ with the OpenCV Library; O’Reilly Media: Sebastopol, CA, USA, 2016. [Google Scholar]
  30. OpenCV—GitHub Page. 2021. Available online: https://github.com/opencv/opencv (accessed on 4 March 2021).
  31. Chollet, F. Keras. 2015. Available online: https://keras.io (accessed on 4 March 2021).
  32. Abadi, M.; Agarwal, A.; Barham, P.; Brevdo, E.; Chen, Z.; Citro, C.; Corrado, G.S.; Davis, A.; Dean, J.; Devin, M.; et al. TensorFlow: Large-Scale Machine Learning on Heterogeneous Systems. 2015. Available online: https:/www.tensorflow.org (accessed on 4 March 2021).
  33. Nair, A.; Mansoori, S.; Moghe, R.; Shah, P.; Talele, K. Driver assistant system using Haar cascade and convolution neural networks (CNN). In Proceedings of the 2019 3rd International Conference on Trends in Electronics and Informatics, Tirunelveli, India, 23–25 April 2019; pp. 1261–1263. [Google Scholar] [CrossRef]
  34. Parchami, M.; Bashbaghi, S.; Granger, E. Video-based face recognition using ensemble of Haar-like deep convolutional neural networks. In Proceedings of the 2017 International Joint Conference on Neural Networks, Anchorage, AK, USA, 14–19 May 2017; pp. 4625–4632. [Google Scholar] [CrossRef]
  35. Feng, Q.; Yang, J.; Liu, Y.; Ou, C.; Zhu, D.; Niu, B.; Liu, J.; Li, B. Multi-temporal unmanned aerial vehicle remote sensing for vegetable mapping using an attention-based recurrent convolutional neural network. Remote Sens. 2020, 12, 1668. [Google Scholar] [CrossRef]
  36. Kumar, A.; Vashishtha, G.; Gandhi, C.P.; Zhou, Y.; Glowacz, A.; Xiang, J. Novel convolutional neural network (NCNN) for the diagnosis of bearing defects in rotary machinery. IEEE Trans. Instrum. Meas. 2021, 70, 1–10. [Google Scholar] [CrossRef]
Figure 1. Schematic diagram of the operation of the proposed flying social robot for the assistance of dependent people at home.
Electronics 10 00868 g001
Figure 2. High level architecture of the virtual reality (VR) simulation platform.
Electronics 10 00868 g002
Figure 3. MQTT communication in the VR platform.
Electronics 10 00868 g003
Figure 4. Block diagram of the UAV simulator.
Electronics 10 00868 g004
Figure 5. The faces of the avatars with a neutral expression (left—old man; right—old woman).
Electronics 10 00868 g005
Figure 6. Basic emotions in the avatars (left—old man; right—old woman): (a) anger; (b) disgust; (c) fear; (d) happiness; (e) sadness; and (f) surprise.
Electronics 10 00868 g006
Figure 7. Example of kernel traversing an image.
Electronics 10 00868 g007
Figure 8. Example of subsampling with MaxPooling.
Electronics 10 00868 g008
Figure 9. Structure of the convolutional neural network (CNN) implemented.
Electronics 10 00868 g009
Figure 10. Set of avatars used for convolutional neural network training.
Electronics 10 00868 g010
Figure 11. Distribution of the samples used for training the convolutional neural network.
Electronics 10 00868 g011
Figure 12. Reference monitoring trajectory generated by the planner versus the actual trajectory followed by the quadrotor model overseen by the GPI controller in the UAV simulator module.
Electronics 10 00868 g012
Figure 13. Position and reference variables of the centre of mass of the quadcopter in the UAV simulator module.
Electronics 10 00868 g013
Figure 14. Attitude variables of the quadcopter in the UAV simulator module.
Electronics 10 00868 g014
Figure 15. Applied control inputs by the GPI controller in the UAV simulator module.
Electronics 10 00868 g015
Figure 16. Test results displayed on the emotion detection interface.
Electronics 10 00868 g016
Figure 17. Test results displayed on the VR Visualiser interface.
Electronics 10 00868 g017
Figure 18. Confusion matrix for the tested image set.
Electronics 10 00868 g018
Table 1. Details of the layers that make up the CNN.
LabelTypeOutput SizeParams
Conv (1)Convolutional44 × 44 × 641664
MaxPMaxPooling20 × 20 × 640
Conv (2)Convolutional18 × 18 × 6436,928
Conv (3)Convolutional16 × 16 × 6436,928
AvgP (1)AveragePooling7 × 7 × 640
Conv (4)Convolutional5 × 5 × 12873,856
Conv (5)Convolutional3 × 3 × 128147,584
AvgP (1)AveragePooling1 × 1 × 1280
FlattenFlatten1280
Input (FCL)Fully Connected1024132,096
Drop (1)Dropout10240
Hidden (FCL)Fully Connected10241,049,600
Drop (2)Dropout10240
Output (FCL)Fully Connected77175
Table 2. Model metrics for the tested image set.
ClassImagesAccuracy, ACCRecall, TPRPrecision, PPVSpecificity, TNRF1 Score
TP + TN TP + TN + FP + FN TP TP + FN TP TP + FP TN TN + FP 2 · PPV · TPR PPV + TPR
0-Anger5296.22%100.00%73.24%95.78%84.55%
1-Disgust7093.82%84.29%74.68%95.37%79.19%
2-Fear8392.03%53.01%97.78%99.76%68.75%
3-Happiness7798.01%93.51%93.51%98.82%93.51%
4-Sadness7796.81%94.81%85.88%97.18%90.12%
5-Surprise6098.21%86.67%98.11%99.77%92.04%
6-Neutral8394.62%89.16%80.43%95.70%84.57%
Total502-----
Average (AVG)-95.67%85.92%86.23%97.48%84.68%
Weighted AVG-95.53%84.86%86.71%97.53%84.32%
TP—true positive; FP—false positive; TN—true negative; FN—false negative.
Publisher’s Note: MDPI stays neutral with regard to jurisdictional claims in published maps and institutional affiliations.