Article

CoLL-IoT: A Collaborative Intruder Detection System for Internet of Things Devices

by
Hani Mohammed Alshahrani
College of Computer Science and Information Systems, Najran University, Najran 61441, Saudi Arabia
Electronics 2021, 10(7), 848; https://doi.org/10.3390/electronics10070848
Submission received: 16 February 2021 / Revised: 28 March 2021 / Accepted: 31 March 2021 / Published: 2 April 2021

Abstract

:
The Internet of Things (IoT) and its applications are becoming popular among many users nowadays, as it makes their life easier. Because of its popularity, attacks that target these devices have increased dramatically, which might cause the entire system to be unavailable. Some of these attacks are denial of service attack, sybil attack, man in the middle attack, and replay attack. Therefore, as the attacks have increased, the detection solutions to detect malware in the IoT have also increased. Most of the current solutions often have very serious limitations, and malware is becoming more apt in taking advantage of them. Therefore, it is important to develop a tool to overcome the existing limitations of current detection systems. This paper presents CoLL-IoT, a CoLLaborative intruder detection system that detects malicious activities in IoT devices. CoLL-IoT consists of the following four main layers: IoT layer, network layer, fog layer, and cloud layer. All of the layers work collaboratively by monitoring and analyzing all of the network traffic generated and received by IoT devices. CoLL-IoT brings the detection system close to the IoT devices by taking the advantage of edge computing and fog computing paradigms. The proposed system was evaluated on the UNSW-NB15 dataset that has more than 175,000 records and achieved an accuracy of up to 98 % with low type II error rate of 0.01 . The evaluation results showed that CoLL-IoT outperformed the other existing tools, such as Dendron, which was also evaluated on the UNSW-NB15 dataset.

1. Introduction

The Internet of Things (IoT) was introduced for the first time by the British scientist Kevin Ashton in 1999, where he described a system that would allow physical objects to be connected to the Internet via many sensors [1]. The IoT can be defined as a network of interconnected devices that can send and receive data while it is in a static or dynamic state [2]. IoT devices collect data by using some devices, such as sensors and radio-frequency identification (RFID) tags, for a special event or environment to provide an intelligent solution for different challenges. This has become possible because of the rapid development of technologies, such as cloud computing, advanced data analysis algorithms, and wireless communication [1]. Therefore, the IoT has been used in various applications, such as smart vehicles, smart homes, healthcare, and industries, to put them on a network and digitize them. All of the collected data can be exchanged between all the parties in the IoT; for example, the data can be exchanged between a human and a device, a device and a device, and a human and all other realistic environments [3].
Edge computing is an emerging technology that aims to deliver various services and applications close to IoT devices [4]. Edge computing aims to minimize the high latency in IoT applications, improve network performance, reduce operational cost, ensure the appropriate use of energy and resources, and efficiently manage data. It has been implemented by many researchers to detect malicious activities in IoT devices. For example, Eskandari et al. [5] proposed an intelligent anomaly intrusion detection system for IoT devices. The proposed method analyzes the network traffic by using an edge device to detect malicious behavior.
Various researchers have proposed different techniques to detect malicious activities in IoT devices. These techniques range from tools running on edge computing to cloud computing. Some examples include [6,7]. These tools extract one or more features of the network traffic. Subsequently, they apply machine learning techniques to classify the requests as malware or benign. However, some of these tools have high latency, as they depend on fog computing to capture and analyze requests. Moreover, some of the existing works only consider a few types of attacks in the IoT in their detection system.
This paper presents CoLL-IoT, a collaborative system that detects malicious activities in IoT devices. CoLL-IoT consists of the following four main layers: IoT layer, network layer, fog layer, and cloud layer. All of the layers work collaboratively by monitoring and analyzing all the network traffic that is generated and received by IoT devices. The first layer, namely the IoT layer, consists of all the IoT devices and sensors that are connected to the system. The second layer contains intelligent edge computing devices that observe all of the network traffic generated by the IoT devices in the previous layer. Managing and maintaining a list of all the malicious activities is the responsibility of the fog layer. The last one is the cloud layer; it contains high computational resources to train and update the detection system in the edge computing devices.
In summary, the main contributions of this research are as follows:
  • Present CoLL-IoT, a collaborative system that detects malicious activities that are targeting IoT devices.
  • Implement different machine learning algorithms to achieve the best results in terms of time and space complexities.
  • Evaluate the proposed system on UNSW-NB15 [8] dataset that was recently generated using the data of real traffic.
  • Deploy and execute CoLL-IoT on a low powered device and effectively detect most of the malicious activities with low type II error rate.
  • Achieve a better detection rate than existing tools by using the same benchmark dataset.
The remainder of this paper is organized, as follows: Section 2 discusses the background of the Internet of Things (IoT) and the edge computing paradigm. Section 3 discusses the related work. Section 4 presents the system design of CoLL-IoT. Section 5 presents the results of the proposed system and a discussion of the results. Finally, Section 6 presents the conclusion of this paper.

2. Background

2.1. Internet of Things (IoT)

The general architecture of the IoT consists of four layers, namely the perception layer, the network layer, the processing layer, and the application layer, as shown in Figure 1 [2]. The first layer contains all the IoT sensors, such as image sensors, gas sensors, and water sensors. The second layer is composed of all the connectivity devices that have a protocol responsible for exchanging information with the upper layer. The next layer is responsible for processing all of the data transmitted from the lower layer. This layer is called the processing layer and it contains all the servers and edge computing devices that are responsible for executing different tasks, such as decision making and classification techniques. The top layer in the IoT architecture is the application layer. This layer delivers different applications to different users on the basis of their needs. The architecture of the IoT is discussed below.

2.1.1. Perception Layer

This is the basic layer of the entire IoT architecture. It is responsible for gathering all of the data from various sensors. Furthermore, the devices in this layer are responsible for sending and receiving data to and from the upper layers. Some information that could be collected from the sensors in the static or dynamic states are the objects’ state, the environment of the surrounding areas, and the objects’ characteristics. Therefore, all of the objects that are used for collecting data in the IoT, such as sensors, people, electronics, and smartphones, are called “things” [3].

2.1.2. Network Layer

This layer is responsible for transmitting data and providing network access to the Internet. Therefore, all of the information that is collected from the sensors in the upper layer is transmitted through this layer. Various communication technologies, such as GSM, WLAN, and IPv6, are used in this layer to achieve the main function of transmitting data. This layer can contain one or more network devices, such as gateways, edge computing, and mobile communication network, which are needed to provide the lower layer with three main functionalities: network communications, software protocol, and communication security [3].

2.1.3. Processing Layer

This layer contains high computational resources to process the massive amount of data collected from the sensors in the perception layer. The layer links the upper and the lower layer by processing the collected information intelligently and presenting this information in the application layer [3]. Various computational resources, such as high computing devices, cloud computing devices, and clusters, are utilized in this layer to achieve the main functionalities of this layer.

2.1.4. Application Layer

The application layer is the top layer of the IoT architecture. It provides users with many services, such as management devices and the interface of the device’s display. This layer has an intelligent decision system that responds quickly to the needs of various businesses, such as healthcare, energy management, and environment monitoring. The accuracy of the response result depends on the latest information that is used to train the intelligent decision system [3].

2.2. Edge Computing

Edge computing is an emerging technology that aims to deliver various services and applications that are close to the IoT devices in the lower layer [4]. As discussed in Section 2.1.1, IoT devices are responsible for collecting a huge amount of data to be processed, which has resulted in the innovation of edge computing to achieve complex computations near the perception layer. Therefore, all of the collected data are transferred to the nearest edge computing device for processing through one of the communication technologies, such as WiFi, cellular communication, and Ethernet cables. Edge computing devices provide several benefits to the IoT’s context [4]. These benefits are as follows: minimize the high latency in IoT applications, enhance the privacy, improve network performance, reduce operational cost, ensure appropriate use of energy and resources, and manage data efficiently. Therefore, these benefits encourage developers and enterprises to develop new services for IoT devices. According to Yu et al. [9], the architecture of edge computing is divided into three ends as follows: front-end, near-end, and far-end; these aspects are shown in Figure 2 and discussed in the subsections below.

2.2.1. Front-End

The devices deployed in this end are capable of providing real-time services [9]. These services provide interaction with the end users to enhance their experience while using IoT devices. If a device in this end cannot process some requests because of certain storage or computation limitations, then it must send these requests to the upper layer to be processed. Some examples of devices in this end are the sensors in smart homes and smart cities.

2.2.2. Near-End

To overcome some of the limitations of the previous end, this end is introduced. It provides better data processing and caching capabilities than the front-end. Therefore, users will have a better performance experience on data processing [9]. However, the latency will increase during the computation process.

2.2.3. Far-End

For high computing resources, all of the data are transferred to this end, which has cloud computing servers. However, transmitting data to this end results in a high latency in the network [9]. Some resources that can be provided by this end are machine learning, big data processing, and parallel computing.
Table 1 shows a comparison of the edge computing ends in terms of the edge deployment, edge network technology, and an example of an existing tool.

2.3. IoT Attacks

IoT attacks are classified into four types, as follows: physical attack, software attack, network attack, and data attack, as shown in Figure 3 [2]. Each attack targets one or more of the IoT layers. The first type is the physical attack, which is designed to be executed physically by attackers while they are close to the IoT devices or the network. This type targets both the application and perception layers to launch attacks, such as tampering malicious code injection or side channel attack. The second type is the software attack, which run by attackers by utilizing existing security vulnerabilities in the IoT system. This attack targets the application and processing layers in IoT architecture. Virus, worms, spyware, and adware are some examples of this attack. The third type is network attack, which aims to damage the network system, and it can be achieved by attackers while they are close to the network or not. This attack targets processing and network layers to launch an attack, such as denial of service attack, routing information attack, and traffic analysis attack. Finally, data attack is the fourth type of IoT attack, which targets data in the application layer and cloud computing resources in the processing layer. Data inconsistency, data breach, and unauthorized access to sensitive data are some examples of this type.

3. Related Work

Researchers have proposed a variety of tools to detect different attacks targeting IoT devices. These attacks are classified into multiple types, as follows: physical attack, network attack, software attack, and data attack. Ibrahim et al. [6] proposed a detection tool, called AD-IoT (which stands for anomaly detection of IoT), which analyzes the network traffic and uses a machine learning algorithm to detect malicious traffic in IoT devices. The proposed system consists of the following three layers: IoT layer, fog layer, and cloud layer. Moreover, they applied different machine learning algorithms to evaluate the proposed system by using the UNSW-NB15 dataset [8]. However, their results did not show the binary classification performance of the proposed system. Furthermore, the proposed system does not illustrate the capturing process of the network traffic.
Nevertheless, Kasongo and Sun [13] conducted a study to analyze the performance of intrusion detection systems using UNSW-NB15 [8]. They applied the extreme gradient boosting (XGBoost) [14] algorithm with a filter-based feature reduction technique. Subsequently, they applied different machine learning algorithms to evaluate the proposed feature reduction technique and the achieved an accuracy of 90.85% for the binary classification part. Therefore, the application of such a technique will improve the classification results for the selection of the optimal features for the classification. Moreover, Moustafa and Saly [15] evaluated the different network anomaly detection systems by using different datasets, namely UNSW-NB15 [8] and KDD99 [16]. Their statistical analysis revealed that the use of the UNSW-NB15 dataset in anomaly detection systems led to better performance than that of the KDD99 dataset, as the former contains more than 40 features that are composed of the network flow between hosts. In the case of the UNSW-NB15 dataset, the accuracy reached 85.56%; in contrast, when the KDD99 dataset was used, the highest accuracy was 92.30%. However, the study revealed that the UNSW-NB15 dataset can be considered to be more complex than the KDD99 dataset, as it contains more behavioral traffic of modern attacks.
Papamartzivanos et al. [17] proposed new detection rules that were based on a decision tree (DT) algorithm to classify network attacks and zero-day attacks that target IoT devices. The proposed tool, called Dendron, was tested on different datasets, namely KDD99, UNSW-NB15, and NSL-KDD [18]. It achieved an accuracy of 98.85% on the KDD99 dataset, while achieving an accuracy of 97.55% and 84.33% on the NSL-KDD and UNSW-NB15 dataset, respectively.
Furthermore, Parker et al. [7] utilized a deep learning detection technique to improve IoT intrusion detection systems. The proposed model combined deep extraction and mutual information selection elements with a radial basis function classifier. The proposed model was called DEMISe, and the Aegean WiFi impersonation attack detection (AWID) dataset was the dataset utilized to evaluate the proposed system [19]. It achieved a detection rate of 98.04 % with the top 10 features using logistic regression (LR) classifier. However, this method takes a long time for the classification as compared to the previously discussed methods.
Zhou et al. [20] proposed another detection tool based on machine learning by using the random forests (RF) algorithm. The proposed method was tested on the KDD99 and NSL-KDD datasets and achieved an accuracy of 99.8 % on the KDD99 dataset. However, despite the high accuracy, the proposed method could not detect attacks from the network traffic [21].
Anthi et al. [22] proposed a three-layer intrusion detection system using a supervised machine learning approach. The proposed system classifies network attacks on IoT devices in three phases, as follows: (i) profile each normal behavior for each IoT device connected to the network, (ii) detect malicious packets in the network on the basis of the attack behavior, and (iii) classify the attack’s type once it has been detected. The detection of malicious packets in the network achieved an F-score of 90.0 % .
Nguyen at al. [23] proposed anomaly detection system, called (DÏoT), for IoT based on federated learning (FL) approach, which can be defined as multiple devices build a joint training machine learning model without sharing the data [24]. The proposed system trained on devices using unlabeled data to detect malicious behavior in the network traffic. The proposed system achieved a detection accuracy rate of 95.6 % . However, despite the high accuracy rate achieved by DÏoT, some potential vulnerabilities exist in the federated learning approach, such as model poisoning and inference attacks [25].
Ferhat and Ahmet [26] proposed a hybrid malware detection technique that uses autoencoder and deep neural networks (ANN). The proposed system uses the UNSW-NB15 dataset that depicts a recent network flow of multiple attacks. The main contribution of the proposed tool is to use the autoencoder that allows the neural network model to learn in an unsupervised approach. The evaluation of the proposed system shows that the best detection accuracy rate of achieved is 97.44 % using the relu activation function.
Table 2 shows a comparison of the existing works in terms of the security threat, detection method, evaluation, utilized datasets, applied machine learning, and limitations.
Limitations of Existing Works: as malware is becoming a severe problem in IoT paradigm, a comprehensive solution is needed to protect users’ data and safeguard the resources of the IoT devices. Unfortunately, existing solutions suffer from many limitations. For example, the proposed system by Ibrahim et al. [6] has a major limitation, which is analyzing network traffic on the fog computing layer, which results in a high latency rate. Moreover, the solutions proposed by [13,15,17] produce a low detection rate, which might not be able to detect malicious behavior accurately. Nevertheless, the execution time for the tool proposed by [19] takes a long time to classify a new sample as benign or malicious traffic. Additionally, the tool that was proposed by [22] was developed to detect only five types of the IoT attacks, while CoLL-IoT is designed to detect more type of attacks. Moreover, some of the existing tools do not consider typical network attack, such as the proposed tool by [20], which does not consider typical network attacks and it uses the KDD99 dataset, which does not contain recent attacks.
Therefore, CoLL-IoT overcomes the limitation of existing tools by introducing a collaborative system that detects malicious activities that are targeting IoT devices. Furthermore, it applies several machine learning algorithms to achieve the best results in terms of time and space complexities whlie using a recent benchmark dataset.

4. Proposed Method

The goal of this research was to design and implement a collaborative system that detects malicious activities in IoT devices; the proposed system was named CoLL-IoT. CoLL-IoT consists of four main layers, as follows: IoT layer, network layer, fog layer, and cloud layer, as shown in Figure 4. All of the layers work collaboratively by monitoring and analyzing all of the network traffic generated and received by the IoT devices. Figure 5 shows the basic steps of the proposed system.
The first layer, the IoT layer, consists of all the IoT devices and sensors that are connected to the system. Therefore, all of the network traffic generated or received by the IoT devices in this layer will be analyzed by an intelligent system in the upper layer.
The network layer is the second layer. This layer contains intelligent edge computing devices that observe all of the network traffic generated by the IoT devices in the lower layer. All of the traffic will be captured as raw packets to extract the required features that allow machine learning models to distinguish abnormal traffic. Figure 6 shows the packet capturing process in this layer and the architecture of the edge computing device. This layer consists of two detectors, called the pre-detector and the primary detector. The pre-detector utilizes scanning technique to analyze all samples to detect abnormal activities. This achieved by sending a query of each incoming and outgoing traffic to VirusTotal [27], in order to classify each sample as benign or malicious. Incoming and outgoing traffic are both considered to protect the devices from communicating with attackers or malicious destinations. Therefore, if a device initiates a new communication or receives an incoming communication, then the pre-detector will interrupt that request for further investigation. Therefore, the pre-detector will query the interrupted request to VirusTotal to check the destination’s or source’s IP address of the request. Thus, if the results from the pre-detector do not contain any malicious activity, then the extracted features will be presented to the primary detector model to classify the extracted features as malicious or benign based on the main model that is trained on the cloud layer. The goal of the primary detector is to detect zero-day attacks that are not detected by VirusTotal yet. Hence, if the sample is detected to be abnormal by one of the detectors, then the traffic will be blocked, and the sample will be sent to the upper layer for further analysis to confirm the malicious activities. Moreover, the detected sample will be broadcasting to all other primary detector nodes as a zero-day attack. The primary detector model is stored in the internal storage of the edge device and it will be updated automatically on the basis of the notification received from the upper layer. There are two reasons of considering VirusTotal for scanning all packets in the pre-detector: (1) VirusTotal is a free service that can be accessed online through the website or the pre-designed API; and, (2) VirusTotal allows users to analyze files or URLs using different antivirus and scanner systems. Algorithm 1 shows the detection procedures for CoLL-IoT.
Algorithm 1 CoLL-IoT Detection Procedures
     Input: NT: Captured Network Traffic;
     Output: Result: 0-Normal; 1-Malicious;
1:
C = l o a d M o d e l ( )
2:
for E a c h C a p t u r e d T r a f f i c do
3:
      C . p r e d i c t ( N T ) ;
4:
     if R e s u l t = 0 then
5:
          A l l o w T r a f f i c ;
6:
     else
7:
           B l o c k T r a f f i c ;
8:
           I n f o r m O t h e r N o d e s ;
The upper layer that is responsible for managing and maintaining a list of all the malicious activities is the fog layer, as shown in Figure 4. In this layer, a list of all the detected abnormal traffic will be aggregated from the different edge computing devices in the previous layer. Subsequently, the detected samples will be analyzed again to reduce the error rates. This step confirms the abnormal behavior of the captured packets in the lower layer. Figure 7 shows the steps to confirm and broadcast the confirmed malicious samples in the fog layer.
The cloud layer is the top layer in the CoLL-IoT detection system. This layer is composed of high computational resources. Therefore, all of the new abnormal samples detected by all the connected nodes in the network layers and confirmed by the fog layer are sent to this layer. The machine learning model will be trained on all of the samples in the datasets, including the new detected samples. Once the machine learning model is trained, the new trained model will be published to all the nodes to update the primary detector and clear the pre-detector model. This approach will help to reduce the hardware consumption that is utilized by the pre-detector model.

4.1. Machine Learning

Machine learning is a technique that takes large sets of data and attempts to predict a value for a new sample after discovering patterns in the previous data. In many complicated problems, designing a specific algorithm in computer science is extremely difficult. Therefore, machine learning is often used to solve these complex problems. This section discusses machine learning algorithms that have been applied to detect suspicious network traffic.
In this research, several supervised machine learning algorithms that were used for classification were investigated and tested. They included K-nearest neighbors (K-NN), logistic regression (LR), random forests, and extreme gradient boosting (XGBoost). All of the ML algorithms were trained on the top 15, 20, 25, and 30 features that were selected by the F-test [28] and chi-square [29] feature selection algorithms from the 49 considered features. Therefore, after training and testing all of algorithms, the algorithm that provides the best results is saved in a pickled format to be used to classify new samples.

4.1.1. K-Nearest Neighbors (K-NN)

K-nearest neighbors (K-NN) is a machine learning technique that classifies a new sample by determining the most similar samples in the training dataset. Therefore, it represents each feature of the inspected sample in an n-dimensional space for classification [30]. The classification of the new sample depends on the distance between all of the samples in the dimensional area and the order of the neighborhood samples.

4.1.2. Random Forests

The random forests algorithm consists of several decision trees, which sorts new samples on the basis of the values of its features [30]. The classification results can be reached by the leaf nodes in the decision trees. Each tree in the decision trees classifies and selects a set of data randomly from the input data. Once a testing data item is labeled by a tree (also called a vote), the forest can give the classification result based on the most votes among all of the trees.
Extreme gradient boosting (XGBoost) [14] is another ensemble algorithm that utilizes decision trees to build a robust learning algorithm. To predict a new sample, XGBoost uses an arbitrary differential loss function for the result prediction. XGBoost is known for its efficiency in terms of the computing time and memory utilization.

4.1.3. Logistic Regression (LR)

Logistic regression classifies the data on the basis of an equation that separates the data points from each other. It utilizes the sigmoid function to predict a new sample by taking all of the features as an input and multiplying each individual feature by a weight. The result of the sum of all the features is used for the classification decision once it is applied to the sigmoid function.

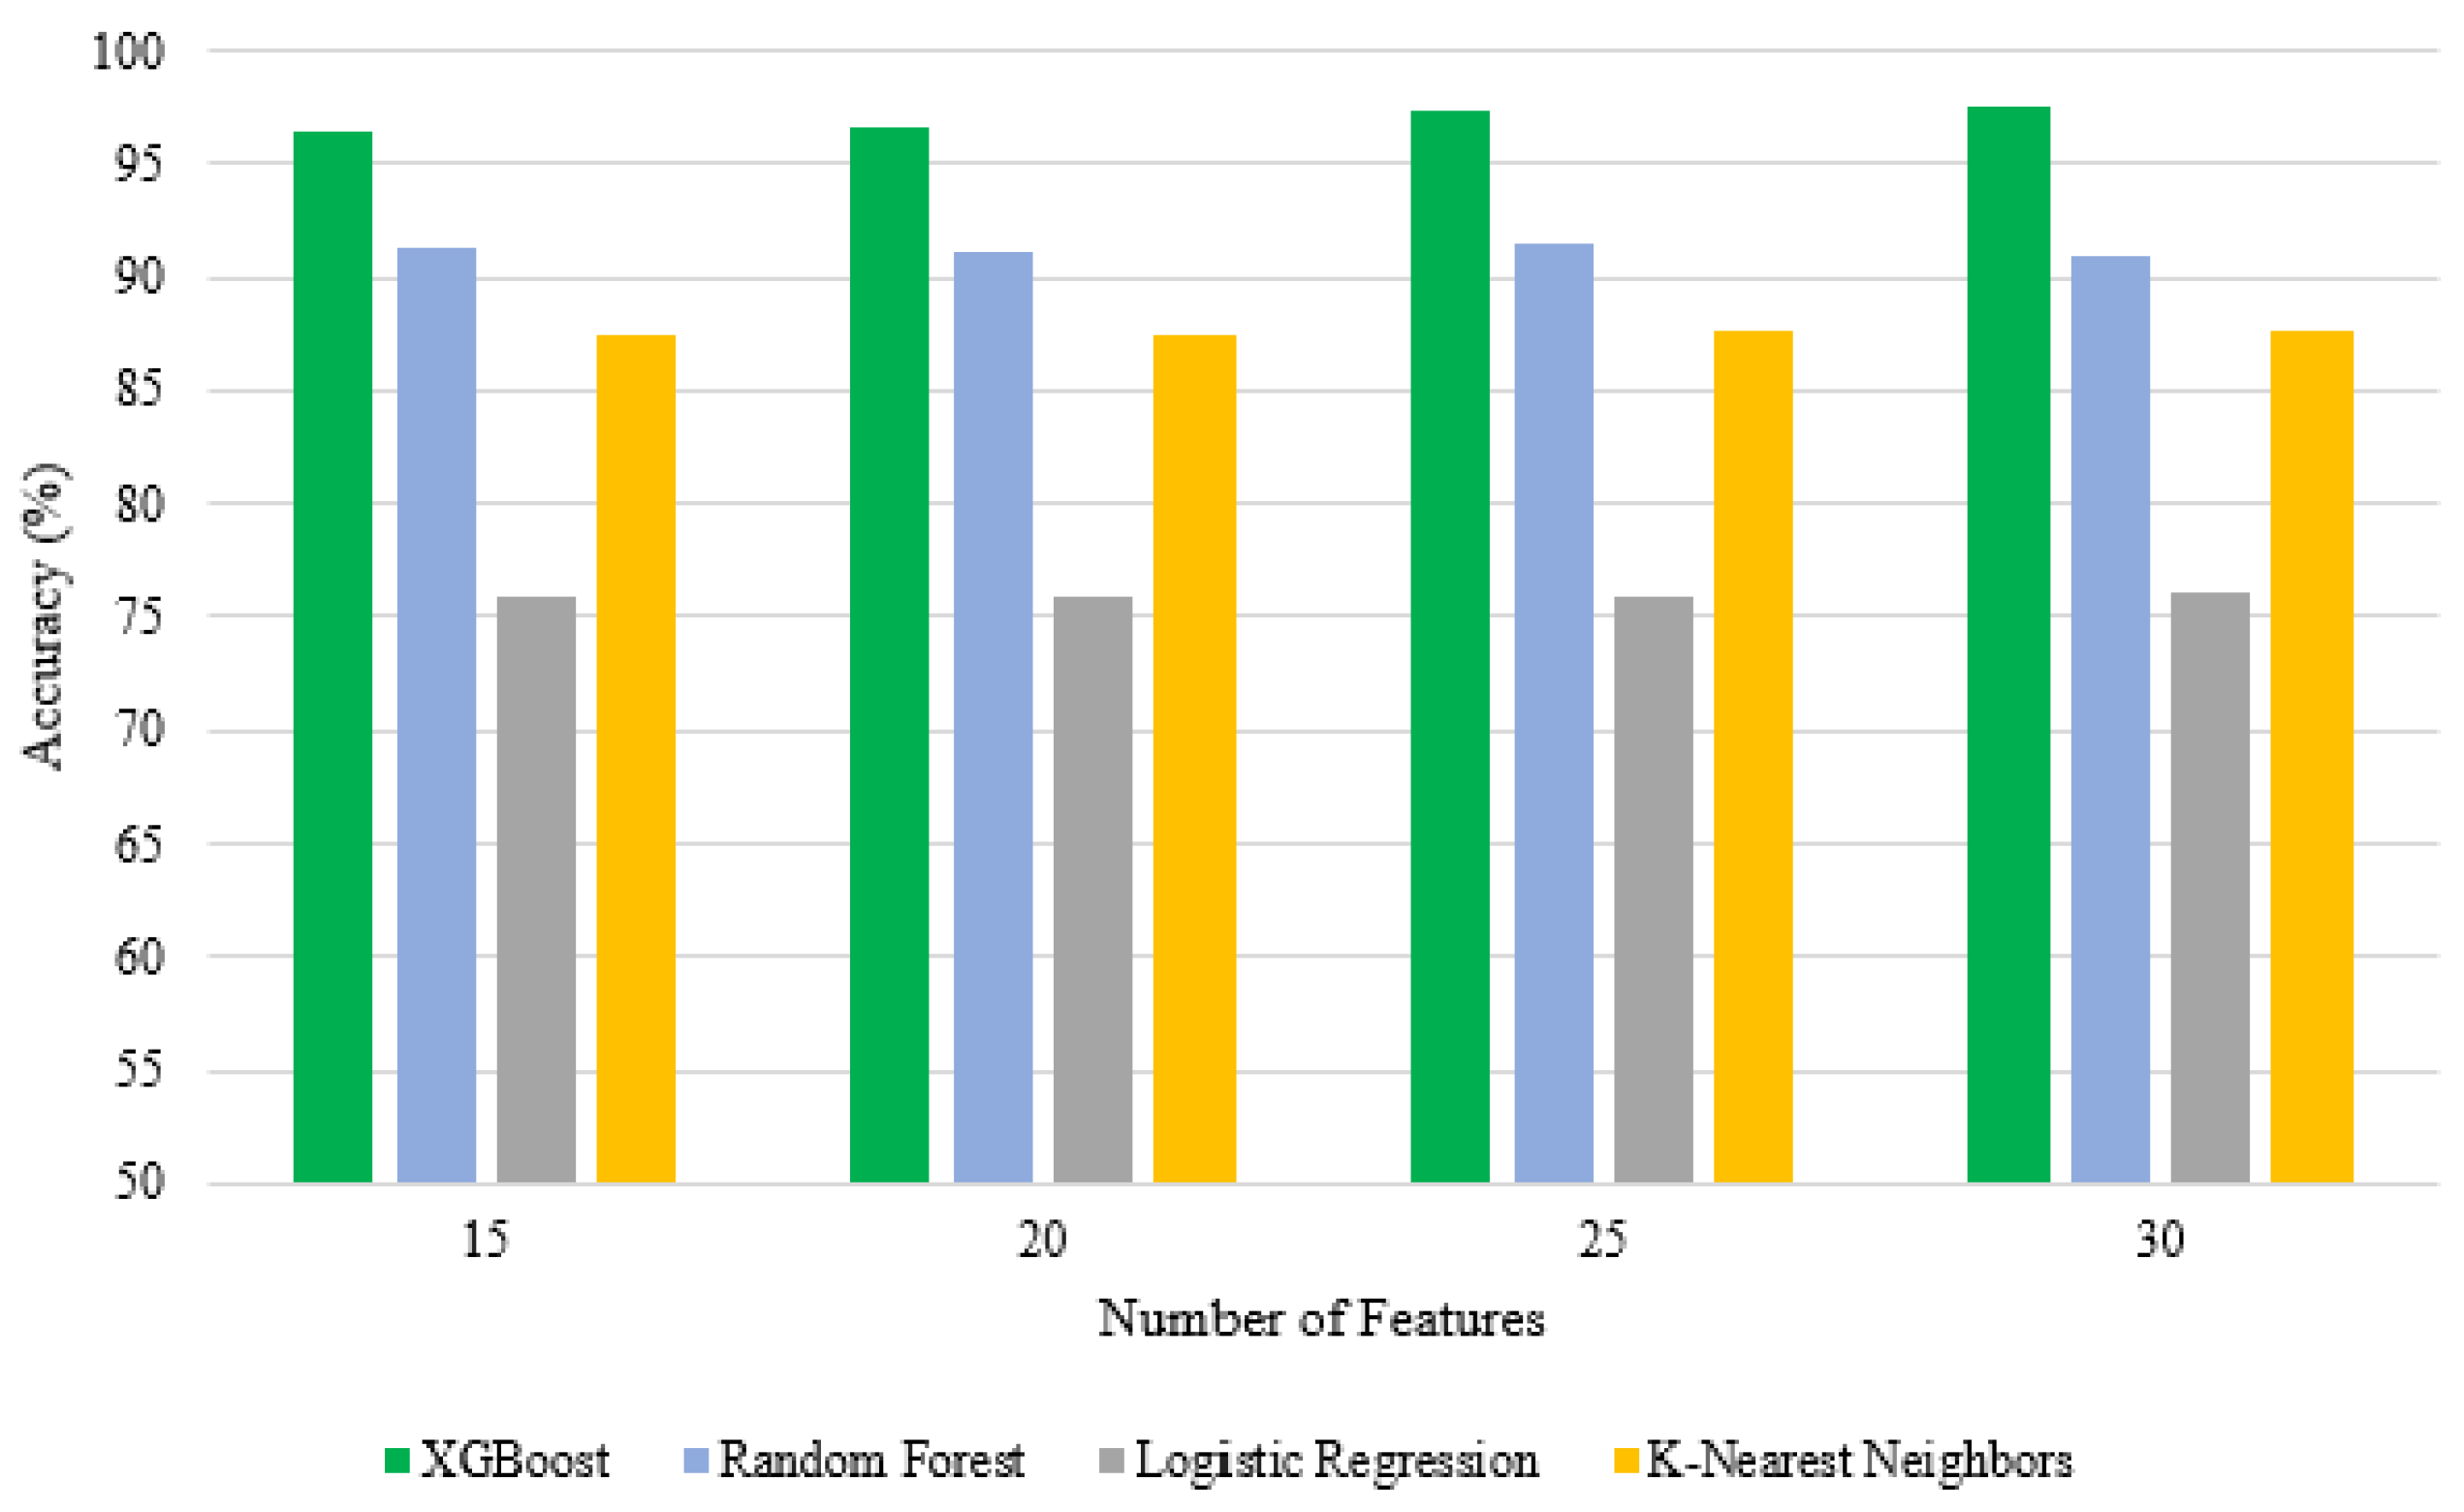
4.2. Feature Selection

Applying the feature selection algorithm on the extracted features is an essential step to find the best set of features that can be used to classify benign traffic from malicious traffic. In this research, two features selection algorithms were applied, namely F-test [28] and chi-square [29].
The F-test feature selection algorithm is utilized by CoLL-IoT to reduce the number of extracted features. It is one of the filter methods that computes the score of each feature by considering the relationship between the feature and target variable [28]. The F-test is a statistical test that is used to compare between the models and check whether there are any important differences. The score for each feature X i is calculated using Equation (1) [31].
t ( X i ) = | μ i 1 μ i 2 | σ i 1 2 n 1 + σ i 2 2 n 2
where μ i 1 and μ i 2 refer to the mean of the i-th feature for class C j , where j is equal to 1 or 2, which denotes the class index; n 1 and n 2 refer to the sizes of the group for the first class and second class samples, respectively. Additionally, σ i 1 and σ i 1 refer to the standard deviation of the i-th feature for class C j . Figure 8 shows the top 20 selected features after applying the F-test feature selection. Table 3 shows the description of the top 20 features that were selected by the F-test feature selection algorithm.
Moreover, the chi-square feature selection algorithm is also considered to find the best features. It calculates the independence between the label and each feature, as shown in Equation (2).
χ 2 ( t , c ) = N × ( A D C B ) 2 ( A + C ) × ( B + D ) × ( A + B ) × ( C + D )
where t and c are the feature dimension and label to be evaluated, respectively; N represents the number of samples; A represents the number of times that t and c co-occur; B represents the number of times t occurs without c; C represents the number of times c occurs without t; and, D represents the number of times neither t nor c occur.

4.3. Dataset

CoLL-IoT was evaluated using the UNSW-NB15 [8] dataset that was recently generated using the data of real traffic. The dataset was created by the Cyber Range Lab of the Australian Centre for Cyber Security in 2015. It contains nine types of attacks, as shown in Table 4. These attacks are, as follows: denial-of-service (DoS), fuzzers, backdoors, exploits, analysis, generic, worms, shellcode, and reconnaissance. These types were analyzed based on 49 features. There were 175,341 records in the training set and 82,332 records in the testing set.

4.4. Evaluation Metrics

To evaluate the performance of the detection model, the following metrics were considered:
  • Accuracy: the total number of samples that are correctly classified to the total number of samples. Accuracy was calculated using Equation (3):
    A c c u r a c y = T P + T N T P + T N + F P + F N
    where TP refers to true positive. This means that the model correctly classifies malicious samples as malicious. TN refers to true negative, which means that the model correctly classifies benign samples as benign. FP refers to a false positive, which means that the model could not classify a benign sample as benign. FN refers to false negative, which means that the model could not classify a malicious sample as malicious.
  • Type I Error or FP Rate: the total number of benign samples that are not classified correctly to the total number of all the benign samples. This was calculated using Equation (4):
    T y p e I E r r o r = F P T N + F P
  • Type II Error or FN Rate: the total number of malicious samples that are not classified correctly as compared to the total number of all the malicious samples. This was calculated using Equation (5):
    T y p e I I E r r o r = F N F N + T P
  • F1-Score: this refers to how discriminative the model is and it was calculated using Equation (6):
    F 1 - S c o r e = 2 p r e c i s i o n r e c a l l p r e c i s i o n + r e c a l l
    where precision represents the ratio of the malicious samples that are classified correctly to the total number of all samples that are classified as malicious; and, recall represents the ratio of the malicious samples that are correctly classified to the total number of malicious samples.
Additionally, sensitivity and specificity metrics were considered to evaluate the performance of the detection model. Therefore, sensitivity represents the percentage of malicious samples that were correctly classified as malicious; and specificity represents the percentage of benign samples that were classified correctly as benign.

5. Results and Discussion
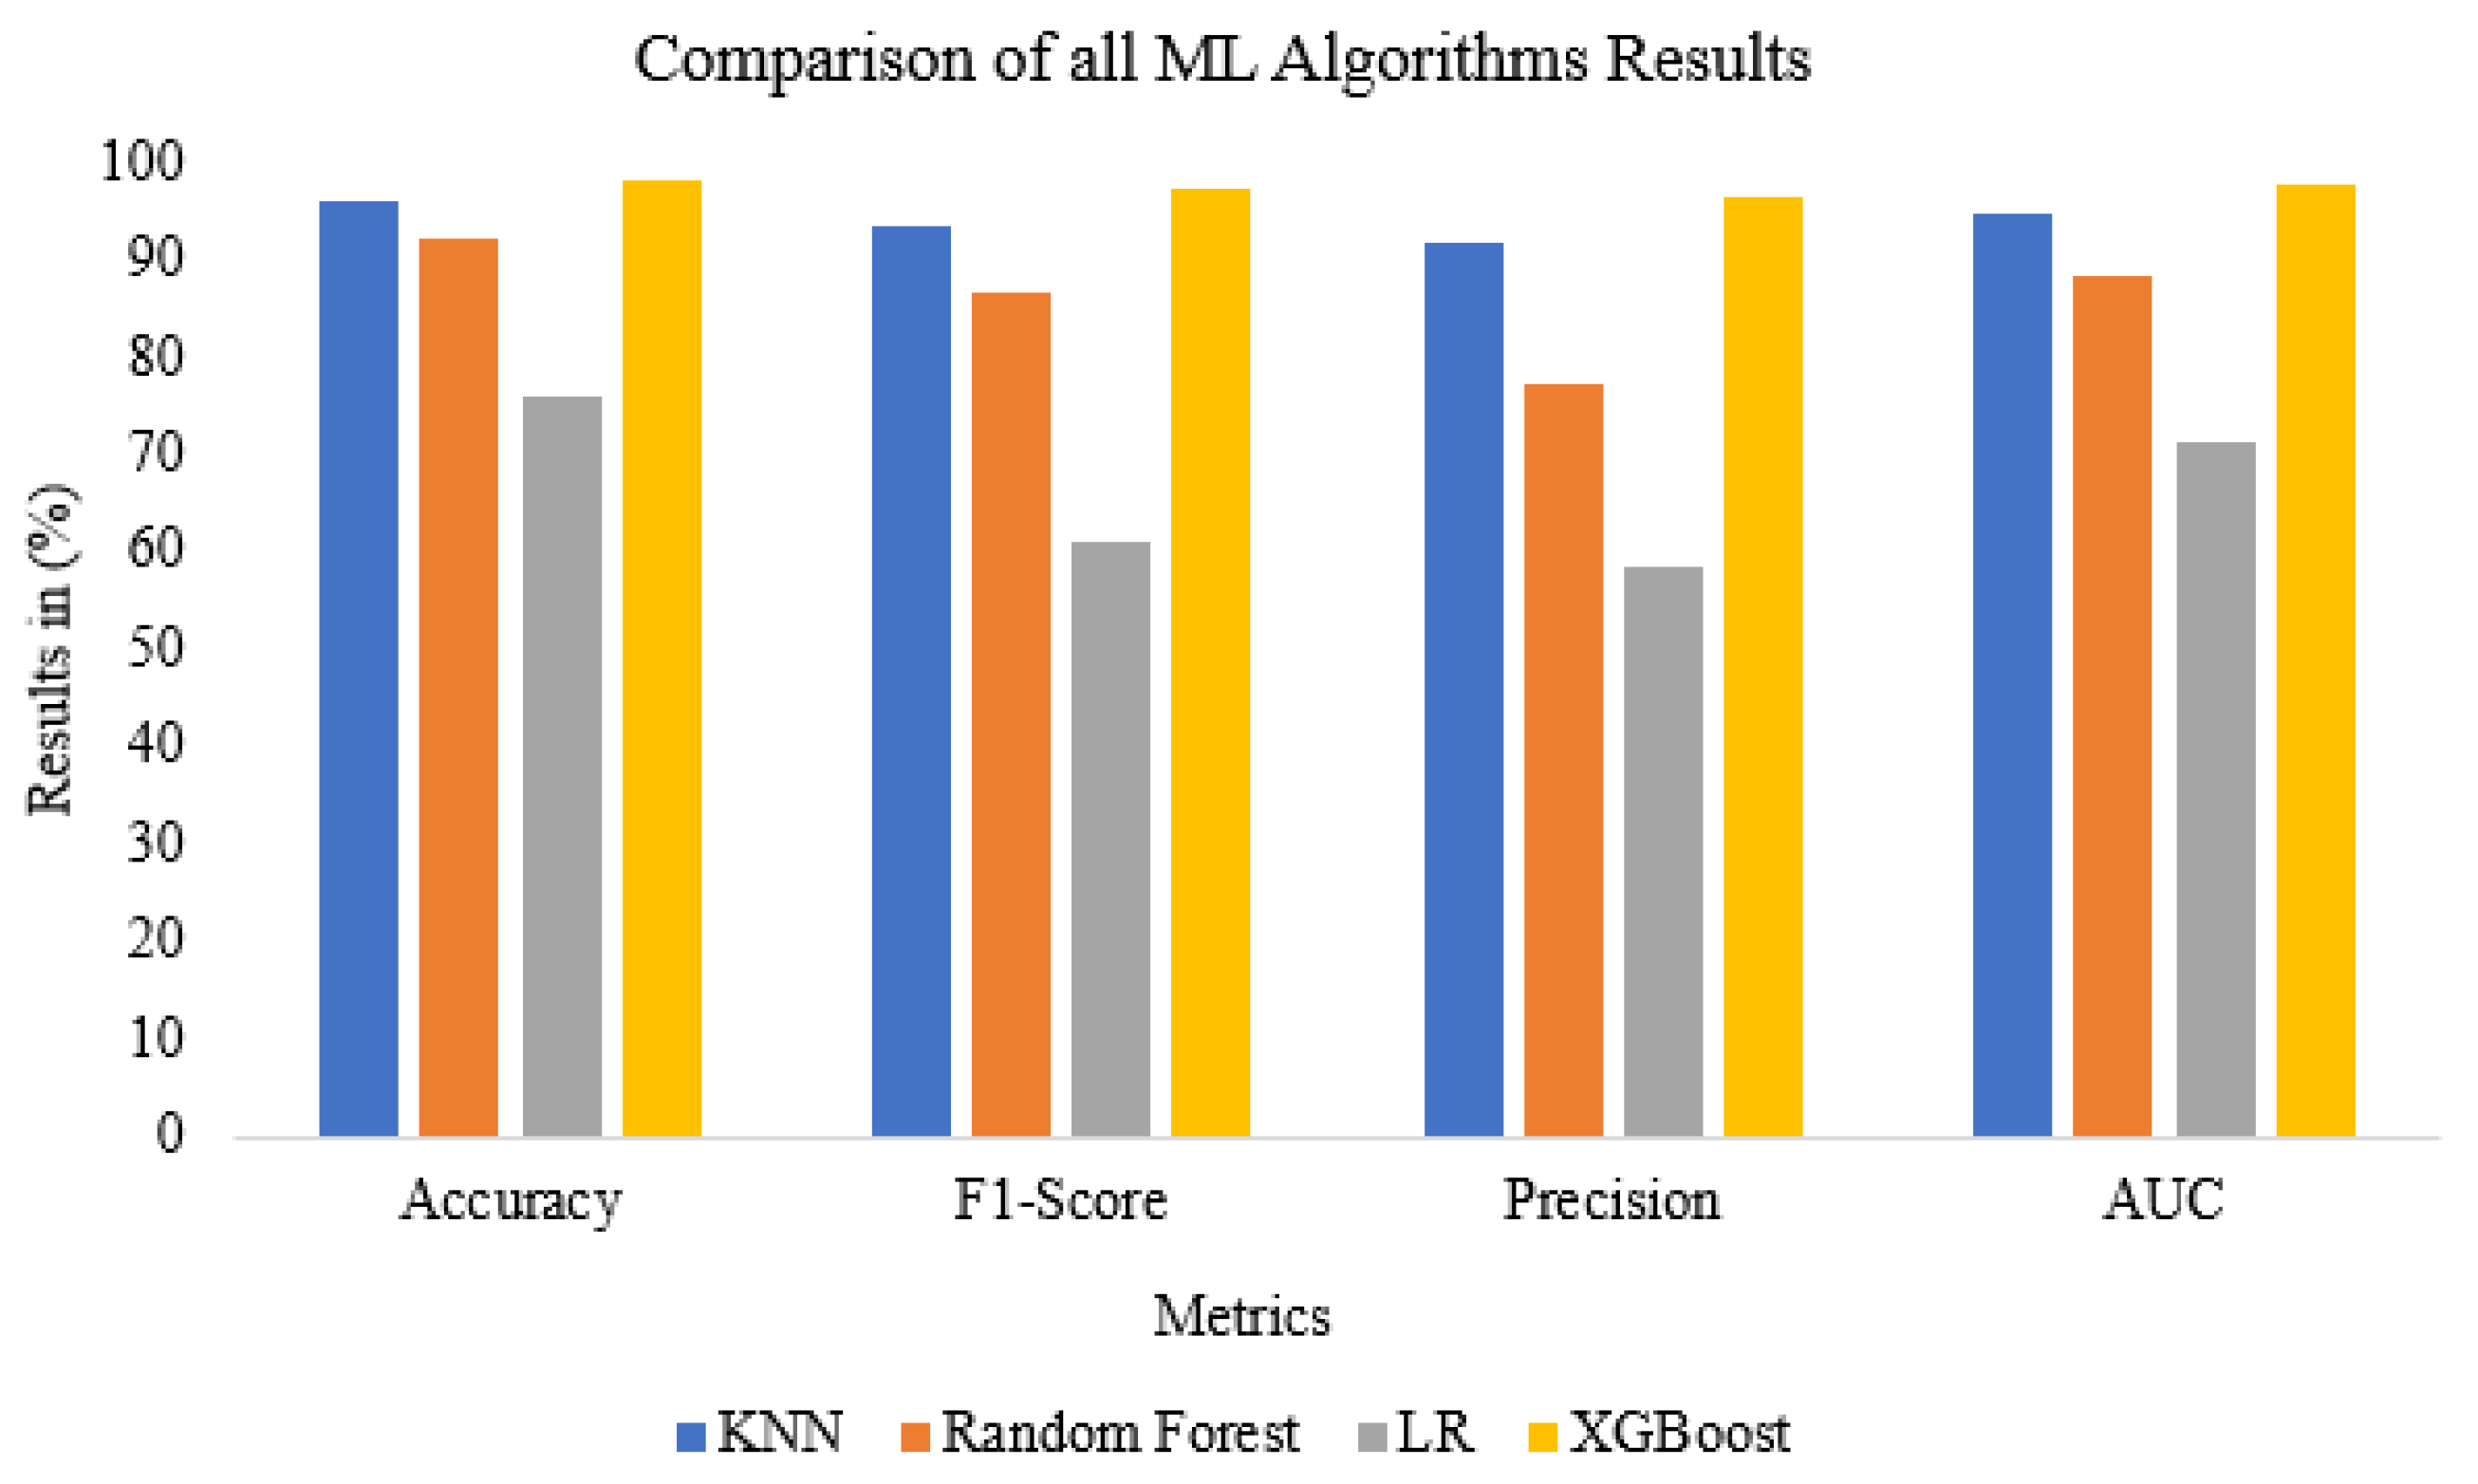
5.1. Results

The machine learning models were implemented and tested by using Scikit-learn library in python 3.5 [32] with 64 bits. Table 5 shows the best parameters for each classifier to obtain the best evaluation results.
Therefore, the best accuracy was 98.35 % , which was achieved by the XGBoost algorithm when it was trained on the top features selected by the F-test algorithm, as shown in Table 6. The type I error rate for XGBoost was 3.16 % , and the type II error rate was 1.6 % . The lowest accuracy for CoLL-IoT was achieved by the LR algorithm using the top features that were selected by the chi-square algorithm. It produced an accuracy of 76.21 % with 18.76 % and 36.01 % for the type I error rate and the type II error rate, respectively. The other ML algorithms produced average results. For example, random forests (RF) produced a 92.37 % accuracy and 9.69 % type I error rate with a 1.48 % type II error rate. Moreover, K-NN achieved a 94.95 % accuracy, while 3.76 % and 4.12 % were the results for the type I and type II error rates, respectively. Figure 9 and Figure 10 show a comparison of the all algorithm results on the basis of the different sets of features that were selected by the chi-square and F-test algorithms, respectively. Moreover, Figure 11 shows a comparison of all the algorithm results, including accuracy, F1-score, precision, and area under a curve (AUC). Furthermore, Figure 12 shows the receiver operating characteristic (ROC) for all of the machine learning algorithms applied by CoLL-IoT. Table 6 shows the prediction time and space complexities for each algorithm.

5.2. Discussion

CoLL-IoT was compared to the other existing state-of-the-art tools, as shown in Table 7. All of the tools were tested and evaluated on the same benchmark UNSW-NB15 [8]. Kasongo and Sun [13] evaluated their intrusion detection system on the UNSW-NB15 dataset by using different machine learning algorithms, as follows: support vector machine (SVM), K-NN, LR, artificial neural network (ANN), and decision tree (DT). They achieved 90.85% accuracy using the DT machine learning algorithm while they applied the XGBoost feature extraction technique. Furthermore, comparing CoLL-IoT to one of the existing tools that was proposed by Moustafa and Slay [15], I found that CoLL-IoT performed better than the latter technique. Moustafa and Slay [15] analyzed different machine learning algorithms using the UNSW-NB15 dataset. The best accuracy that they achieved was 85.56% using the DT algorithm, while they report a 15.78% type I error rate. Kumar et al. [33] proposed a detection system that was based on network traffic activities. They evaluated and tested the proposed system on UNSW-NB15 and achieved an average of 84.83% accuracy with an average of 2.01% type I error rate. Dimitrios et al. [17] proposed network intrusion detection system rule while using the decision tree algorithms. They evaluated the proposed system on the UNSW-NB15 dataset and achieved 84.33% accuracy with 2.61% type I error rate. Moreover, the performance of CoLL-IoT was compared to that of another anomaly detection system that was proposed by Souhail et al. [34]. The proposed system applied two detection stages to classify malicious behavior using the SVM algorithm and achieved 82.11% accuracy. Moreover, the tool proposed by Ferhat and Ahmet [26] achieved 97.44 % using deep neural network using autoencoder.

5.3. Hardware Resource Utilization

To evaluate CoLL-IoT on a common edge computing device, we evaluated it on a Raspberry Pi 3 Model B (https://www.raspberrypi.org/products/) (accessed on 1 March 2021), which has quad core CPU at 1.2 GHz, 1 GB of RAM, and is equipped with on-board wireless and wired network adapters. The Raspberry Pi run as an edge computing device that hosted the machine learning model of CoLL-IoT and captured all of the network traffic to detect any malicious behavior. During the experiment of CoLL-IoT, the value of the CPU load and the memory utilization were measured. Moreover, the time that was taken to classify the captured network traffic was analyzed. Therefore, to evaluate the memory and CPU usage, sysstat [35] was used, which is a package for Linux OS to monitor and report system performance and activities. It contains different tools to report CPU statistics, processor statistics, memory statistics, etc.
The CPU and the memory of the edge device was evaluated three times before installing CoLL-IoT and after the instillation during the analysis stage, as shown in Figure 13. The average CPU load was increased slightly by 1 % while analyzing the network traffic and running the machine learning model for classification. Moreover, the average memory utilization for CoLL-IoT only increased by 0.9 % . The size of the machine learning model running on the edge device was 10 MB and, during the evaluation stage, CoLL-IoT took 8 seconds to analyze and classify 10 new samples.

6. Conclusions

This paper presented CoLL-IoT, a collaborative detection system to detect malicious activities in IoT devices. The proposed system consisted of the following four main layers: the IoT layer, network layer, fog layer, and cloud layer. All of the layers worked collaboratively to analyze the network traffic in order to detect malicious activities. First, different machine learning algorithms were implemented to achieve the best results in terms of time and space complexities. Second, CoLL-IOT was deployed and executed on a resource-constrained device and effectively detect most of the malicious activities with low type II error rate. Third, CoLL-IoT was evaluated on the UNSW-NB15 dataset that contains recent IoT attacks, namely: denial-of-service (DoS), fuzzers, backdoors, exploits, analysis, generic, worms, shellcode, and reconnaissance. The evaluation results showed that CoLL-IoT achieved up to 98 % accuracy with a low type II error rate of 0.01 . Finally, the proposed tool achieved a better detection rate than existing tools by using the same benchmark dataset.
As future work, we plan to implement deep learning algorithm using LITNET-2020 benchmark dataset [36]. This dataset has more features of the network flow than UNSW-NB15. Moreover, it has 12 types of attacks, which will help to build a model that can detect recent attacks in this area.

Funding

The author would like to express his gratitude to the Ministry of Education and the Deanship of Scientific Research—Najran University—Kingdom of Saudi Arabia for its financial and technical support under code number (NU/ESCI/17/088).

Conflicts of Interest

The authors declare no conflict of interest.

References

  1. Rose, K.; Eldridge, S.; Chapin, L. The internet of things: An overview. Internet Soc. (ISOC) 2015, 80, 1–50. [Google Scholar]
  2. Sengupta, J.; Ruj, S.; Bit, S.D. A Comprehensive survey on attacks, security issues and blockchain solutions for IoT and IIoT. J. Netw. Comput. Appl. 2020, 149, 102481. [Google Scholar] [CrossRef]
  3. Chen, M.; Miao, Y.; Humar, I. OPNET IoT Simulation; Springer Nature: Singapore, 2019. [Google Scholar]
  4. Hassan, N.; Gillani, S.; Ahmed, E.; Yaqoob, I.; Imran, M. The Role of Edge Computing in Internet of Things. IEEE Commun. Mag. 2018, 56, 110–115. [Google Scholar] [CrossRef]
  5. Eskandari, M.; Janjua, Z.H.; Vecchio, M.; Antonelli, F. Passban IDS: An intelligent anomaly-based intrusion detection system for IoT edge devices. IEEE Internet Things J. 2020, 7, 6882–6897. [Google Scholar] [CrossRef]
  6. Alrashdi, I.; Alqazzaz, A.; Aloufi, E.; Alharthi, R.; Zohdy, M.; Ming, H. AD-IoT: Anomaly Detection of IoT Cyberattacks in Smart City Using Machine Learning. In Proceedings of the 2019 IEEE 9th Annual Computing and Communication Workshop and Conference (CCWC), Las Vegas, NV, USA, 7–9 January 2019; pp. 305–310. [Google Scholar] [CrossRef]
  7. Parker, L.R.; Yoo, P.D.; Asyhari, T.A.; Chermak, L.; Jhi, Y.; Taha, K. Demise: Interpretable deep extraction and mutual information selection techniques for IoT intrusion detection. In Proceedings of the 14th International Conference on Availability, Reliability and Security, Canterbury, UK, 26–29 August 2019; pp. 1–10. [Google Scholar]
  8. Moustafa, N.; Slay, J. UNSW-NB15: A comprehensive data set for network intrusion detection systems (UNSW-NB15 network data set). In Proceedings of the 2015 Military Communications and Information Systems Conference (MilCIS), Canberra, Australia, 10–12 November 2015; pp. 1–6. [Google Scholar] [CrossRef]
  9. Yu, W.; Liang, F.; He, X.; Hatcher, W.G.; Lu, C.; Lin, J.; Yang, X. A Survey on the Edge Computing for the Internet of Things. IEEE Access 2018, 6, 6900–6919. [Google Scholar] [CrossRef]
  10. Satyanarayanan, M.; Bahl, P.; Caceres, R.; Davies, N. The case for vm-based cloudlets in mobile computing. IEEE Pervasive Comput. 2009, 8, 14–23. [Google Scholar] [CrossRef]
  11. Nishio, T.; Shinkuma, R.; Takahashi, T.; Mandayam, N.B. Service-oriented heterogeneous resource sharing for optimizing service latency in mobile cloud. In Proceedings of the First International Workshop on Mobile Cloud Computing & Networking, Bangalore, India, 29 July–1 August 2013; pp. 19–26. [Google Scholar]
  12. Griffin, D.; Rio, M.; Simoens, P.; Smet, P.; Vandeputte, F.; Vermoesen, L.; Bursztynowski, D.; Schamel, F. Service oriented networking. In Proceedings of the 2014 European Conference on Networks and Communications (EuCNC), Bologna, Italy, 23–26 June 2014; pp. 1–5. [Google Scholar]
  13. Kasongo, S.M.; Sun, Y. Performance Analysis of Intrusion Detection Systems Using a Feature Selection Method on the UNSW-NB15 Dataset. J. Big Data 2020, 7, 1–20. [Google Scholar] [CrossRef]
  14. Chen, T.; Guestrin, C. Xgboost: A scalable tree boosting system. In Proceedings of the 22nd ACM Sigkdd International Conference on Knowledge Discovery and Data Mining, San Francisco, CA, USA, 13–17 August 2016; pp. 785–794. [Google Scholar]
  15. Moustafa, N.; Slay, J. The evaluation of Network Anomaly Detection Systems: Statistical analysis of the UNSW-NB15 data set and the comparison with the KDD99 data set. Inf. Secur. J. Glob. Perspect. 2016, 25, 18–31. [Google Scholar] [CrossRef]
  16. Brugger, T. KDD Cup’99 dataset (Network Intrusion) considered harmful. KDnuggets Newsl. 2007, 7, 15. [Google Scholar]
  17. Papamartzivanos, D.; Mármol, F.G.; Kambourakis, G. Dendron: Genetic trees driven rule induction for network intrusion detection systems. Future Gener. Comput. Syst. 2018, 79, 558–574. [Google Scholar] [CrossRef]
  18. Tavallaee, M.; Bagheri, E.; Lu, W.; Ghorbani, A.A. A detailed analysis of the KDD CUP 99 data set. In Proceedings of the 2009 IEEE Symposium on Computational Intelligence for Security and Defense Applications, Ottawa, ON, Canada, 8–10 July 2009; pp. 1–6. [Google Scholar]
  19. Kolias, C.; Kambourakis, G.; Stavrou, A.; Gritzalis, S. Intrusion Detection in 802.11 Networks: Empirical Evaluation of Threats and a Public Dataset. IEEE Commun. Surv. Tutor. 2016, 18, 184–208. [Google Scholar] [CrossRef]
  20. Zhou, Y.; Cheng, G.; Jiang, S.; Dai, M. Building an efficient intrusion detection system based on feature selection and ensemble classifier. Comput. Netw. 2020, 174, 107247. [Google Scholar] [CrossRef] [Green Version]
  21. Rahman, M.A.; Asyhari, A.T.; Leong, L.; Satrya, G.; Tao, M.H.; Zolkipli, M. Scalable machine learning-based intrusion detection system for iot-enabled smart cities. Sustain. Cities Soc. 2020, 61, 102324. [Google Scholar] [CrossRef]
  22. Anthi, E.; Williams, L.; Słowińska, M.; Theodorakopoulos, G.; Burnap, P. A Supervised Intrusion Detection System for Smart Home IoT Devices. IEEE Internet Things J. 2019, 6, 9042–9053. [Google Scholar] [CrossRef]
  23. Nguyen, T.D.; Marchal, S.; Miettinen, M.; Fereidooni, H.; Asokan, N.; Sadeghi, A. DÏoT: A Federated Self-learning Anomaly Detection System for IoT. In Proceedings of the 2019 IEEE 39th International Conference on Distributed Computing Systems (ICDCS), Dallas, TX, USA, 7–10 July 2019; pp. 756–767. [Google Scholar] [CrossRef] [Green Version]
  24. Jiang, J.C.; Kantarci, B.; Oktug, S.; Soyata, T. Federated Learning in Smart City Sensing: Challenges and Opportunities. Sensors 2020, 20, 6230. [Google Scholar] [CrossRef] [PubMed]
  25. Lyu, L.; Yu, H.; Yang, Q. Threats to federated learning: A survey. arXiv 2020, arXiv:2003.02133. [Google Scholar]
  26. Catak, F.O.; Mustacoglu, A.F. Distributed denial of service attack detection using autoencoder and deep neural networks. J. Intell. Fuzzy Syst. 2019, 37, 3969–3979. [Google Scholar] [CrossRef]
  27. Asaithambi, S. The VirusTotal Homepage. Available online: https://www.virustotal.com/gui/ (accessed on 24 March 2021).
  28. Asaithambi, S. Why, How and When to Apply Feature Selection. Available online: https://www.shorturl.at/qzEI6 (accessed on 21 September 2019).
  29. Cen, L.; Gates, C.; Si, L.; Li, N. A probabilistic discriminative model for android malware detection with decompiled source code. IEEE Trans. Dependable Secur. Comput. 2015, 12, 400–412. [Google Scholar] [CrossRef]
  30. Kotsiantis, S. Supervised Machine Learning: A Review of Classification Techniques. In Proceedings of the 2007 Conference on Emerging Artificial Intelligence Applications in Computer Engineering: Real Word AI Systems with Applications in eHealth, HCI, Information Retrieval and Pervasive Technologies; IOS Press: Amsterdam, The Netherlands, 2007; pp. 3–24. [Google Scholar]
  31. Chandra, B.; Gupta, M. An efficient statistical feature selection approach for classification of gene expression data. J. Biomed. Inform. 2011, 44, 529–535. [Google Scholar] [CrossRef] [Green Version]
  32. Scikit-Learn Machine Learning in Python. Available online: https://scikit-learn.org/stable/ (accessed on 4 March 2021).
  33. Kumar, V.; Sinha, D.; Das, A.K.; Pandey, S.C.; Goswami, R.T. An integrated rule based intrusion detection system: Analysis on UNSW-NB15 data set and the real time online dataset. Clust. Comput. 2020, 23, 1397–1418. [Google Scholar] [CrossRef]
  34. Meftah, S.; Rachidi, T.; Assem, N. Network based intrusion detection using the UNSW-NB15 dataset. Int. J. Comput. Digit. Syst. 2019, 8, 478–487. [Google Scholar]
  35. Godard, S. Sar Collect, Report, or sAve System Activity Information. Available online: https://linux.die.net/man/1/sar (accessed on 6 February 2021).
  36. Damasevicius, R.; Venckauskas, A.; Grigaliunas, S.; Toldinas, J.; Morkevicius, N.; Aleliunas, T.; Smuikys, P. LITNET-2020: An annotated real-world network flow dataset for network intrusion detection. Electronics 2020, 9, 800. [Google Scholar] [CrossRef]
Figure 1. Internet of Things (IoT) Architecture and Security Requirements.
Electronics 10 00848 g001
Figure 2. Architecture of Edge Computing.
Electronics 10 00848 g002
Figure 3. Attacks and Targeted Layers in IoT.
Electronics 10 00848 g003
Figure 4. Architecture of CoLL-IoT Detection System.
Electronics 10 00848 g004
Figure 5. Workflow of CoLL-IoT Detection System.
Electronics 10 00848 g005
Figure 6. Architecture of Edge Computing Device in the Proposed System.
Electronics 10 00848 g006
Figure 7. Workflow of the Fog Layer in the Proposed System.
Electronics 10 00848 g007
Figure 8. Top 20 selected features selected by F-test feature selection algorithm.
Electronics 10 00848 g008
Figure 9. Accuracy comparison for the top features selected by chi-square.
Electronics 10 00848 g009
Figure 10. Accuracy comparison for the top features selected by F-test.
Electronics 10 00848 g010
Figure 11. Comparison of all ML algorithms’ results.
Electronics 10 00848 g011
Figure 12. ROC for the applied algorithms.
Electronics 10 00848 g012
Figure 13. Hardware Resource Utilization.
Electronics 10 00848 g013
Table 1. Comparison of Edge Computing Ends.
MetricsFront-EndNear-EndFar-End
DeploymentWiFi access points, cellular base station, or radio access networkRouters, access points, or mobile nodesCloud data centers or local data centers
NetworkWiFi, LTE, or any other technologiesMultiple wireless access points including WiFi, 3G, or LTEEnterprise networks and WiFi hotspots
ExampleCloudlet [10]Mobile Cloud [11]FUSION [12]
Table 2. Comparison of Existing Works.
ToolApproachDatasetsAlgorithmLimitations
 [6]MLUNSW-NB15XGBoostHigh latency as
traffic analyzed in fog layer
[13]MLUNSW-NB15XGBoostLow detection rate
[15]MLUNSW-NB15DTLow detection rate
KDD99
[17]MLKDD99DTLow detection rate
UNSW-NB15
NSL-KDD
[7]MLAWIDLRTime consuming
[20]MLKDD99RFDoes not consider typical network attacks
[22]MLNAJ48Considers only five types of attacks
[23]FLNAGRUVulnerable to poisoning and inference attacks
[26]ANNUNSW-NB15AutoencoderHigh error rate if features are independent on each other
Table 3. Description of the top 20 selected features.
FeaturesDescriptionFeaturesDescription
dmeanszThe mean of raw packetsswinThe frame value of
transmitted by the destination size TCP at the source
protoProtocol of the transactiondwinThe frame value of
TCP at the destination
sbytesThe size from the sourcestcpbThe base sequence number
to the destination of source TCP
dbytesThe size from thedtcpbThe base sequence number
destination to the source of destination TCP
dlossNumber of packetssmeanszThe mean of raw packets
dropped or delegated transmitted by the source size
sloadSource bits/sec.response body lenThe size of the response by the server
dloadDestination bits/sec.sjitSource jitter (ms)
spktsNumber of packets at the sourcedjitDestination jitter (ms)
dpktsNumber of packets atsintpktArrival time between
the destination source layers (ms)
dintpktArrival time betweensttlTime from source to
destination layers (ms) destination to live value
Table 4. Type of attacks in the UNSW-NB15 dataset.
AttackNumber of Records
DoS1167
Fuzzers5051
Backdoors534
Exploits5409
Analysis526
Generic7522
Worms24
Shellcode223
Reconnaissance1759
Table 5. Parameters Tuning Using Scikit-learn library.
ClassifierBest Parameters
K-NNmetric_params = None, n_jobs = 8, n_neighbors = 5, p = 2,
weights = ‘uniform’
Random Forestsn_estimator = 8, max_depth = None, max_depth = None,
max_features = ‘auto’, max_leaf_nodes = None
LRintercept_scaling = 1, max_iter = 100
XGBoostcolsample_bytree = 1, learning_rate = 0.1, max_depth = 3,
n_estimators = 100, n_jobs = 1
Table 6. Comparison of all machine learning results.
MetricsAlgorithm
K-NNRandom ForestsLRXGBoost
True Positives30,85625,98519,65532,413
True Negatives70,25371,18860,51771,053
False Positives2770764113,9711213
False Negatives132639111,062526
Sensitivity (%)95.8898.5263.9998.40
Specificity (%)96.2190.3181.2498.32
Precision (%)91.7677.2858.4596.39
Type I Error (%)3.769.6918.763.61
Type II Error (%)4.121.4836.011.6
Accuracy (%)96.1192.3776.2198.35
F1-Score (%)93.7886.6161.0997.39
AUC (%)94.9588.3671.4997.82
Time Complexity O ( k n p ) O ( p n t r e e s ) O ( p ) O ( p n t r e e s )
Space Complexity O ( n p ) O ( p n t r e e s ) O ( p ) O ( p n t r e e s )
n number of data point; p number of features; k number of nearest neighbours; ntrees number of trees.
Table 7. Comparison with existing tools.
Existing ToolsMetrics
Accuracy (%)F1-Score (%)Precision (%)Type I Error (%)
Kasongo & Sun [13]90.8588.4580.33NA
Moustafa & Slay [15]85.56NANA15.78
Kumar et al. [33]84.83NANA2.01
Dimitrios et al. [17]84.3348.81NA2.61
Souhail et al. [34]82.11NANANA
Ferhat and Ahmet [26]97.4489.8589.24NA
CoLL-IoT98.3597.3996.393.61
Publisher’s Note: MDPI stays neutral with regard to jurisdictional claims in published maps and institutional affiliations.

