Article

Real-Time Prediction of Capacity Fade and Remaining Useful Life of Lithium-Ion Batteries Based on Charge/Discharge Characteristics

1
Department of Mechanical Engineering, Yeungnam University, Gyeongsan, Gyeongbuk 38541, Korea
2
Korea Railroad Research Institute, Uiwang, Gyeonggi 16105, Korea
3
Department of Automotive Engineering, Yeungnam University, Gyeongsan, Gyeongbuk 38541, Korea
*
Authors to whom correspondence should be addressed.
C.-J. Lee and B.-K. Kim contributed equally to this work.
Electronics 2021, 10(7), 846; https://doi.org/10.3390/electronics10070846
Submission received: 16 February 2021 / Revised: 25 March 2021 / Accepted: 26 March 2021 / Published: 1 April 2021
(This article belongs to the Special Issue Advances in Control for Electric Vehicle)

Abstract

:
We propose a robust and reliable method based on deep neural networks to estimate the remaining useful life of lithium-ion batteries in electric vehicles. In general, the degradation of a battery can be predicted by monitoring its internal resistance. However, prediction under battery operation cannot be achieved using conventional methods such as electrochemical impedance spectroscopy. The battery state can be predicted based on the change in the capacity according to the state of health. For the proposed method, a statistical analysis of capacity fade considering the impedance increase according to the degree of deterioration is conducted by applying a deep neural network to diverse data from charge/discharge characteristics. Then, probabilistic predictions based on the capacity fade trends are obtained to improve the prediction accuracy of the remaining useful life using another deep neural network.

1. Introduction

Energy storage devices (i.e., batteries) for electric vehicles (EVs) are among the most expensive components and are essential for supplying the energy required to drive these vehicles. A malfunction of batteries and their reduced lifetime that hinders an adequate energy supply to drive the vehicle may lead to accidents in the worst case. Accordingly, various approaches have been proposed to increase the lifetime of batteries while maintaining the size of a battery pack and protecting from electromagnetic interferences (EMIs) [1,2]. Such various efforts have improved the performance and safety of batteries used in electric vehicles, but there is still a possibility of malfunction at any time. Therefore, the deterioration of batteries supplying power to an EV must be continuously monitored [3]. Batteries are generally charged and discharged through repetitive electrochemical redox processes. Hence, it is difficult to accurately predict the remaining useful life (RUL) using theoretical models based on the mechanism of functional degradation by utilizing the data from experimental measurements of state of charge (SOC), state of health (SOH), and state of life (SOL) because of these nonlinear characteristics [4]. Moreover, the battery characteristics are determined by various features such as the microscopic structure of the active materials in the anode and cathode, as well as the operation environment, conditions, and frequency of use [5,6]. It is cumbersome to set the requirements according to the characteristics of the target applications. Therefore, various approaches are required to improve the battery management system (BMS).
To assess the reliability of a system relying on battery power, prognostics and health management (PHM) [7,8] based on measured data can be applied. This technique is an advancement compared with regular maintenance, corrective maintenance, and conventional diagnosis of the system state [9]. Therefore, this technology can improve the function of BMSs for EV batteries with high voltages, which can increase user and manufacturer satisfaction [10]. Research is being actively performed on technology to predict the RUL of lithium-ion batteries (LIBs) by applying prognostics and health management based on machine learning [11,12,13,14,15,16,17]. Conventional prognostics and health management detect deterioration or failure due to aging or harsh environments of various mechanical devices or electronic boards such as BMS [18]. In addition, analysis and predictive diagnosis identify and characterize anomalies, and facility management helps to maintain systems and processes. Although most early studies on prognostics and health management have focused on aerospace engineering, they are currently being applied to diverse areas such as rail transportation and power generation [19,20,21].
In the past, RUL prediction could be achieved by measuring their impedance after removing the batteries from a vehicle for evaluation according to the frequency based on the potentiostatic/galvanostatic method [11,12]. During the continuous charging and discharging of the battery, its internal parameters (e.g., conductivities of electrode active materials and electrolyte ions) are used in this method to identify the relationship between the battery internal resistance and discharge capacity to predict the RUL. In fact, after several charge/discharge cycles, the battery deteriorates because of irreversible reactions, and the discharge capacity is reduced over the cycles [22].
Other methods for RUL prediction include data analysis, model-based methods, and hybrid methods that combine data analysis and models [11,12,13,14]. Recently, data analysis has been more frequently used and involves acquiring and analyzing performance data that change over time according to the unique characteristics of the battery. Alternatively, physics-based methods rely on mathematical models to predict system deterioration [21,23]. Although mathematical modeling based on the analysis of the charge/discharge mechanisms can provide highly accurate and interpretable results, it is difficult to model large battery packs as opposed to single cells, and environmental variables cannot be reflected in the model even if interlock circuits and automatic control are considered [10]. RUL prediction using filtering, a statistical technique, has recently attracted research attention [13,14]. For instance, the particle filter (PF) [13], which has been primarily used in the fields of control, location tracking, and pattern recognition, has been recently used for battery RUL prediction.
Although data obtained from simulations of data-driven models can be used for RUL prediction, the low accuracy and efficiency of data analysis based on statistical methods render machine learning necessary for accurate and fast prediction. Methods based on machine learning involve the analysis of data relevance, data stratification through mul-tiple weighted learning models, and other related processes. Learning based on the battery historic data allows the RUL to be predicted based on currently available data. Therefore, the prediction accuracy depends on the quantity and quality of the collected data.
Commonly used machine learning techniques include long short-term memory (LSTM), artificial neural networks (NNs), support vector machines (SVM), and relevance vector machines (RVMs). Among these, NNs further developed into a generalized regression artificial neural network that estimates the relationship between the cause and the factor [24]. This technique can be effectively used in BMS because it reflects the probability of failure of the features from the system according to the representativeness of the learned data. Thus, it is evaluated as a promising PHM because it is the basis of deep learning and can compensate for the limitations of prediction [25]. In addition, the regression neural network technique is probabilistic in the prediction results, so filtering is often used to improve accuracy [17,19]. For example, researchers from Toyota recently obtained data from 124 battery cells and predicted the life of the cells with a probability of approximately 90% [15]. Then, they used the prediction to optimally charge the battery for 10 min. If the data needed for battery RUL prediction are insufficient, it is difficult to obtain valid predictions for a distant horizon. Therefore, in addition to research on enhancing the performance of machine learning algorithms, it is crucial to obtain high-quality experimental data under a variety of conditions and determine representative features for prediction through preprocessing.
In this study, we applied deep neural networks (DNNs) to charge and discharge data of lithium-ion batteries provided by the Ames Prognostics Center of NASA (National Aeronautics and Space Administration), a U.S. research institute specialized in aerospace. Then, we predicted the RUL of the batteries by analyzing 11 battery features and classifying them into training and test data. The 11 features include five test environment and test condition features and six geometric features from the curves related to the battery deterioration, which is caused by an increase in internal resistance over charge/discharge cycles. We implemented a machine learning algorithm in Python to learn the discharge capacity according to each feature and then predict the capacity from unseen data. Finally, we analyzed the capacity fading characteristics related to performance degradation with increasing charge/discharge cycles for RUL prediction. We compared a PF, which has been extensively used in prior studies, with the proposed prediction method regarding estimation error considering DNN parameters such as the hidden layers and activation functions. Furthermore, we evaluated the feature extraction and analysis according to the training data and analyzed the findings.

2. Materials and Methods

Figure 1 shows the diagram for data preprocessing (i.e., feature extraction) and RUL prediction adopted in this study. As the charge and discharge data of the lithium-ion batteries are related to performance degradation that may occur over the cycles, we deter-mined charge/discharge curve features and extracted additional features from the test environment and condition data, obtaining 11 features. We used two DNNs to predict the capacity fade and RUL of batteries: (i) the SOH (i.e., capacity fade) of batteries was predicted using 11 features, and (ii) the RUL prediction was performed based on the SOH prediction results obtained in the previous step. Finally, the prediction results are com-pared with the test data to determine their accuracy. To validate the proposed DNNs, the battery test data used for prediction were excluded from the training.

2.1. Preprocessing

To create an accurate machine learning model, big data must be refined, classified according to the application, and prioritized according to relevance. For example, for a learning model to determine capacity fading due to battery deterioration, the available data include charge voltage/current, discharge voltage/current, temperature condition, usage frequency, and production date. From the available data, the production date has a low relevance for capacity fading estimation. The analysis of big data related to lithium-ion battery charge and discharge and the exclusion of irrelevant data corresponds to data mining. In fact, regardless of data availability, accurate results may not be obtained if redundant or irrelevant data are included in the model.

2.1.1. Data Structure

The publicly available NASA data used in this study correspond to the lithium-ion battery charge and discharge tests. These data were collected on the Gen2 18650 lithium-ion batteries of Idaho National Laboratory (INL: Idaho Falls, ID) under the Advanced Technology Development (ATD) program. In addition, the data were collected in a study from 2007 by Saha and Goebel to develop battery failure prognostics and prediction for accident prevention in the aerospace field [16]. The study was intended to compare and analyze data obtained via modeling and data obtained from a hardware testbed for predicting battery deterioration.
In this study, we used the charge and discharge test data obtained from the hardware testbed to train an RUL prediction model. The data comprised six datasets according to the experimental conditions and were classified considering the experiment end capacity, discharge current, discharge conditions, and experimental temperature. In addition to the charge and discharge voltage and current during the battery cycle testing, various types of data were included in each dataset, as shown in Figure 2. Although the measured impedance can indicate battery deterioration or aging, it was irregularly measured after various cycles and not in every cycle during data collection. On the other hand, although impedance can provide accurate predictions of battery aging, the battery must be separated from its host system, and the electrochemical impedance spectrometer used for the measurements is costly. In this study, we aimed to avoid expensive equipment for determining battery deterioration and instead use only data that can be collected during charge and discharge from all the battery data that can be collected during the operation of an electric vehicle to achieve RUL prediction.

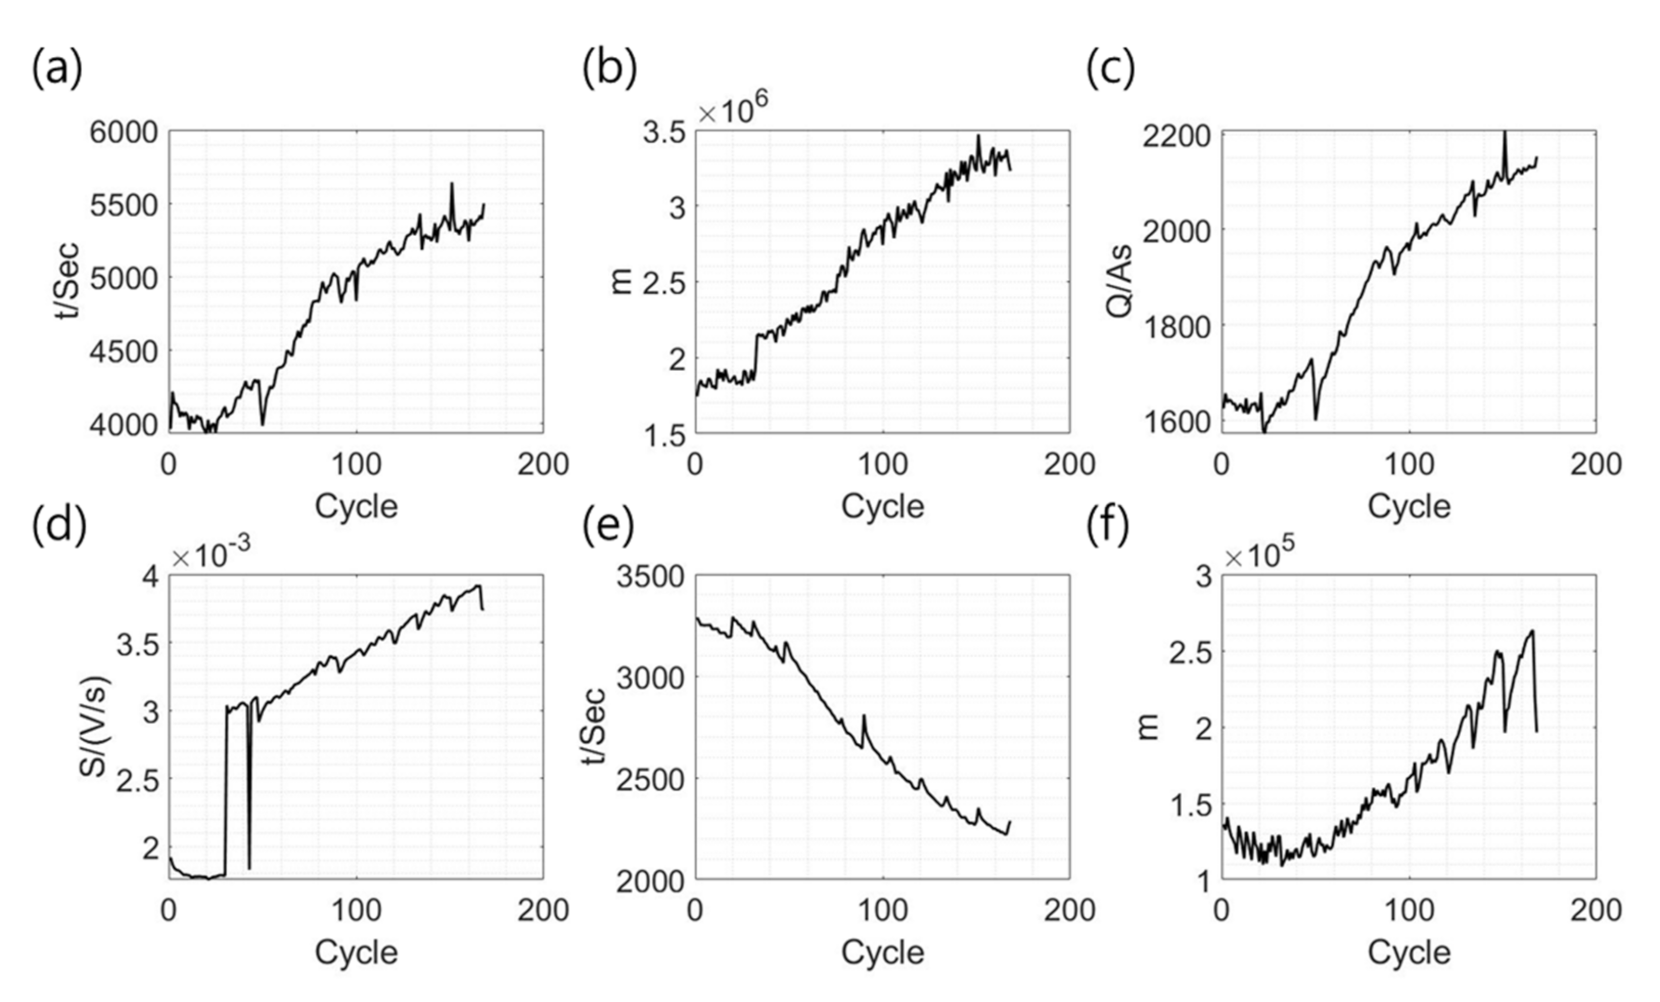
2.1.2. Feature Extraction

To predict the capacity at any battery cycle, features must be extracted according to the corresponding test environment. We extracted features for machine learning from the lithium-ion battery data provided by NASA. Figure 3 shows the current and voltage curves during the battery charge and discharge over time. As the number of cycles in-creased, although the curves retained a similar shape, various changes occurred in the curves due to aging. For example, as the internal resistance increased, the constant-voltage section gradually decreased during discharge, and the usable time continuously de-creased. Lu et al. [26] proposed a method to extract four types of features from the curves, called geometric features, and predicted the battery RUL by applying dimensionality re-duction to the NASA battery data. The four geometric features are the length of the constant voltage section, maximum curvature radius, area under the constant voltage section in the charge current curve, and initial slope of the discharge.
After extracting the four geometric features, we analyzed the extraction of additional features. Figure 3a shows the current curve over 168 charge cycles for battery B0005 from the dataset. As the number of cycles increased, the constant-voltage section increased, and the constant-current section decreased. Figure 3b shows the voltage curve over 168 dis-charge cycles of the battery B0005. Besides the initial slope, we extracted two additional geometric features, namely the discharge section above 3 V and the curvature radius of the voltage drop. Figure 4 shows the changes in current and voltage at 10, 50, 100, and 150 charge/discharge cycles, along with the corresponding definitions of the six extracted geometric features (a–f).
Numerous variables affect battery deterioration over time. Excluding electrochemical elements, they can be classified as test environment and test condition variables. We used the test temperature (test environment), discharge voltage and current (test condition), and discharge time and charge time per cycle to complete the features for training and evaluation of the proposed machine learning model. The output label for the model is the capacity per cycle, and Table 1 lists the extracted features used to construct the corresponding datasets.

2.2. Proposed DNNs for Capacity Fade and RUL Prediction

In a DNN structure, the input data are processed through multiple hidden layers to obtain an output. We used two DNN models. To predict the battery capacity at a cycle, we adopted a DNN architecture with 1 output layer, 11 input layers, and 5 hidden layers with rectified linear unit (ReLU) activation. The training data consisted of seven of the eight types of battery data, and the test data consisted of one of the eight types for capacity prediction. For the second DNN model, we considered 1 output layer, 65 hidden layers, and the capacity predicted in the first model as the input. Figure 5 shows the structure of the DNN proposed in the first step (i.e., capacity fading prediction). If the SOH predicted by the first model is accumulated, then time-series prediction is performed for the RUL prediction in the next step.

2.3. Data-Based PF for Comparison

The PF was introduced in 1993 to obtain numerical approximations for nonlinear problems. Since then, it has been used in diverse fields, including economics, defense, transportation, image analysis, and robotics. PF is a Monte Carlo method based on Bayesian statistics. An empirical model from known data was used to estimate the current probabilities in several cases. To predict the capacity based on battery data using a PF, the battery behavior must be modeled. The obtained model can provide an accurate prediction of capacity fading. Equation (1) describes a capacity fading trend based on regression analysis from a previous study [27]. The model was generated from a base model considering several cases using a PF.
Q = a   exp   b k + c   exp   d k
where Q is the battery capacity, k is the number of cycles, a and b are constants related to the internal impedance, and c and d indicate the aging rate. Using Equation (1), the parameter constants were defined according to the battery capacity data. xki is a vector that reflects the noise in the parameter constant. Equation (2) represents the likelihood of the existing measured battery capacities zk and zki [28]:
p z k   |   x k i = 1 σ 2 π exp 1 2 z k h k x k i 2 σ 2
where σ is the standard deviation of the measurement noise and hk is the capacity fading model in Equation (1). Equation (2) expresses the likelihood by considering a Gaussian distribution of the measurement noise of a single particle. However, multiple particles accumulate as a probability density function, and the noise distribution no longer follows a Gaussian distribution because of the state distribution and nonlinearity.
By predicting without nonlinear constraints, the PF can be compared with existing unscented and extended Kalman filters [12].
w k i = w k 1 i p z k | x k i
To calculate the likelihood for one particle, the accumulation of existing weights should be performed as in Equation (3).
w ¯ k i = w k i i = 1 N w k i
Finally, Equation (4) normalizes the accumulated weights to satisfy a total weight of 1. We adopted this PF model to compare the lithium-ion battery RUL prediction using the pro-posed DNNs with that using the PF.

3. Results

From the battery data provided by NASA, we used those from cells B0005–B0007, B0018, B0029–B0032, and B0043–B0045. Batteries B0005–B0018 were tested at a discharge current of 2 A until 70% of its capacity. However, verification of the actual capacity data revealed slight differences across the batteries. Similarly, we detected the differences be-tween the other batteries. Nevertheless, as we use capacity as output, these differences do not influence the model provided that conditions such as discharge current are correct. The 11 extracted features were input to the proposed model to predict the battery capacity using the first DNN model. Then, the number of cycles and capacity predicted from the first model were input to the second DNN model for the prediction of RUL, which was defined as the time at which the effective capacity of the battery reached 70%.

3.1. Feature Extraction for Capacity Fade and RUL Prediction

We obtained 5 of the 11 features (features 7–11 in Table 1) from the available battery data and calculated the other six features (features 1–6 in Table 1) from the charge current curve and discharge voltage curve per cycle according to the definitions depicted in Figure 4. Figure 6 shows the geometric features extracted from the cycle testing data of B0005 according to the cycle. For the DNN, the training dataset was constructed using 11 features. In the data shown in Figure 6, there is one cycle at which the charge current and discharge voltage change sharply. This phenomenon was not mentioned in the original study by the NASA team.

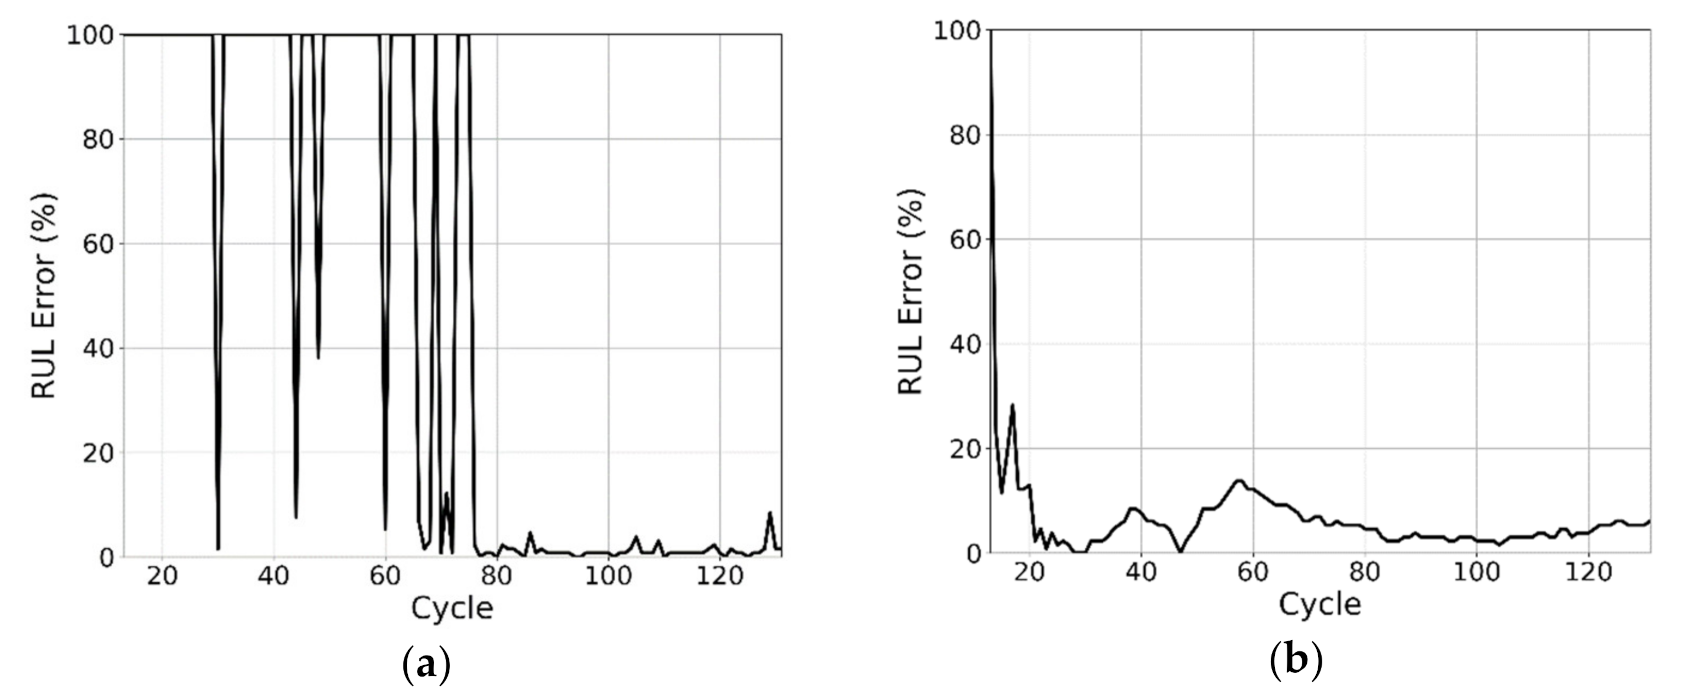
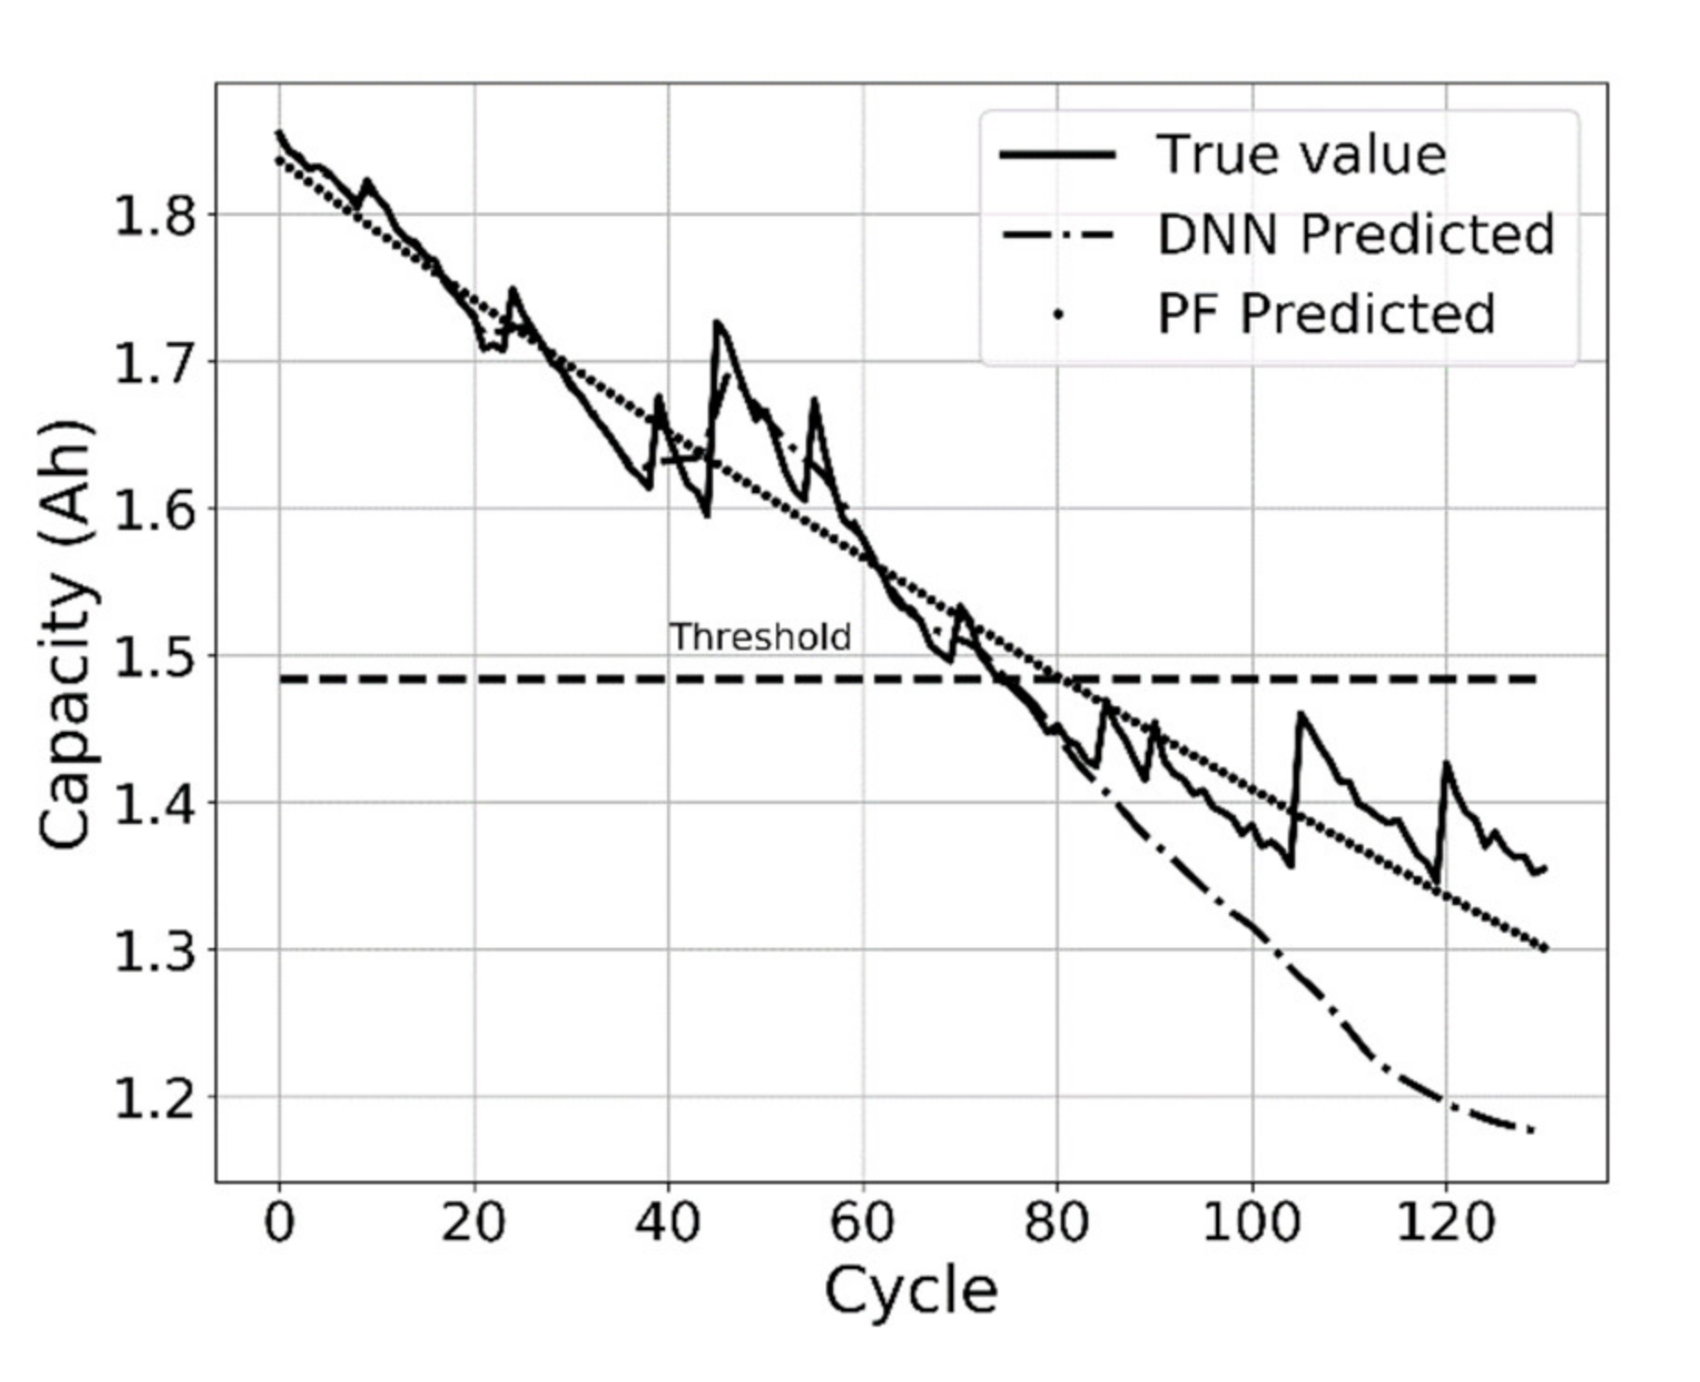
3.2. Prediction of Capacity Fade and RUL Using DNNs

We used the first DNN model to predict the capacity fade trend considering 80% of the data from seven batteries as the training data, and the data from battery B0018 as test data. In Figure 7, the data from the cycles shaded in gray were not used for training. In addition, the B0043–B0045 data were used as verification data for learning during training. To prevent overfitting during learning, training was conducted by setting the dropout rate to 0.1. In the training algorithm, the function “ReLU” was used as the activation function, the function “He normal” was used as the kernel initializer, and the function “Adam” was used as the optimizer. Finally, we use the mean-squared error for the loss function:
1 n i = 1 n y i t i 2
where n is the number of data points, yi is the output from the DNN, and ti is the corresponding measurement. As shown in Figure 8, the training and test errors decreased throughout the training and converged close to zero (9.01 × 10⁻⁵ and 1.07 × 10⁻⁴, respectively).
We confirmed that the prediction error differs depending on the battery considered for training and testing. Therefore, we obtained the error according to the battery data used for training and testing. Table 2 lists the error during training and prediction error after training considering different test data. The maximum and minimum training errors occurred for data from batteries B0018 and B0007, respectively, and the maximum and minimum test errors were obtained for data from batteries B0032 and B0018, respectively. The average prediction error of battery capacity was 3.40 × 10⁻⁴ for the test data of battery B0018, being the smallest average error. Therefore, the capacity prediction results may vary with the characteristics of the training data.
We confirmed that the prediction error differed depending on the battery used for training and testing. Therefore, we obtained the error based on the battery data used for training and testing. Table 2 lists the training and prediction test errors (e.g., root mean-squared error (RMSE)) obtained using the process proposed in this study. Each training dataset consisted of the remaining batteries, excluding one specific battery among all the battery data. That is, it shows the capacity prediction results performed after training on a dataset excluding a specific battery. The maximum and minimum training errors occurred for data from batteries B0018 and B0007, respectively, and the maximum and minimum test errors were obtained for B0032 and B0018 batteries, respectively. The average prediction error of battery capacity was 3.40 × 10⁻⁴ for test data of battery B0018, which had the smallest average error. The sum of the mean-squared errors of the predicted capacities of various batteries was 13.69 × 10⁻³, which was the smallest when the data of the B0018 battery was selected as the test data. The average prediction error of battery capacity was 3.40 × 10⁻⁴ for test data of battery B0018, which had the smallest average error. Therefore, the capacity prediction results may vary according to the characteristics of the training data.
Considering the training and test errors, we constructed training datasets to achieve the most accurate prediction, excluding data from battery B0018. Thus, excluding this battery that provides the smallest training error, we used the data from the other batteries during training to predict the capacity of battery B0018. Figure 9 shows the measured capacity, predicted capacity, and predicted RUL based on the predicted capacity. For RUL prediction from the capacity obtained by the DNN with 11 features over various cycles, we determined the future capacity fade and RUL over cycles through DNN-based regression. Therefore, we determined the capacity fade and RUL using the predicted capacity trends from the 11 features under the actual operating environment conditions of an electric vehicle. DNN-based prediction enhances accuracy by using training data from actual conditions and obtained during battery manufacturing. For instance, using training data from batteries other than B0018 for capacity prediction, corresponding to approximately 70% of the available data for battery B0018, we accurately predicted the capacity fading over the remaining cycles through regression.
From the obtained results, the error with respect to the actual capacity was 7.93 × 10⁻⁴, and the RUL prediction provided an error of approximately 7.63%. Meanwhile, for battery B0018, despite the small error in capacity prediction, the change in capacity over the cycles notably increased, as shown in Figure 9a. In contrast, when using data from battery B0005 for testing, despite the larger training error than that for battery B0018, the capacity prediction exhibited a small error of 3.59%, as shown in Figure 9b. Hence, when the data of battery B0005 were used for training, the training error was reduced. Overall, accurate prediction depends on both the preprocessing of data collected under multiple test conditions and the type and quality of the data collected during operation.

4. Discussion

The two proposed DNN models were used to predict the capacity fade and RUL based on capacity by training the measured data in a real driving environment without requiring expensive and complex equipment for measurement. However, the DNN model cannot suitably predict the battery capacity during manufacturing, and massive amounts of data are required to achieve accurate deep learning. We evaluated the DNN model and PF implemented in previous research to confirm the error in terms of the cycle at which the capacity fade reaches 80% of the nominal capacity. We also determined the mean squared error, assuming that 10% to 100% of the initial battery capacity was secured. Figure 10 shows the error between the evaluated methods and the real end of life (EOL) cycle (i.e., 80% capacity fading of all cycles).
The EOL cycle based on the cycle testing data of battery B0018 is the 75th cycle. At the 13th cycle, that is, 10% of the cycles, we performed DNN training and PF modeling for prediction. The predicted EOL cycle using the DNN showed an overall error of 45.7%, which rapidly dropped to 1.1% after 76 cycles. Likewise, the predicted EOL cycle using the PF showed an overall error of 6.4%, which decreased to 3.7% at 76 cycles, which is when the DNN error rate decreases. Thus, using the proposed DNN, the EOL was predicted only when at least 80% of the tested battery data were available, while the PF could predict the EOL using initial data from less than eight cycles. An analysis of this result was performed to evaluate the utility of this algorithm during operation in real-time, assuming that there is no total capacity data. For learning-based algorithms, it can be understood that obtaining a certain amount of prior data has a great effect on improving accuracy. Figure 11 shows the results of the training and modeling capacities up to 76 cycles using the DNN and PF, respectively. The DNN accuracy depends on the data availability, whereas the PF can perform a suitable prediction even when only initial data are available, given the underlying model for prediction.

5. Conclusions

We investigated the application of DNNs and machine learning algorithms for battery capacity fading and RUL prediction. We detail the method design, preprocessing of training data to extract representative features, and application of the proposed method. The training data comprise the geometric features of the current and voltage curves during charge and discharge, test environment features, and test condition features. Using these features to construct a training dataset, two DNNs were trained to predict the capacity fading and the corresponding RUL. Specifically, we predicted the capacity using the 11 extracted features and obtained RUL predictions through regression. The proposed DNN model can provide accurate predictions with an error of approximately 3.59%. Unlike other studies in which the battery should be detached to conduct electrochemical impedance spectroscopy to determine the battery deterioration, we predict the RUL using charge and discharge data collected during operation, thus preventing the cumbersome process of measuring the battery impedance. As the 11 features reflect different characteristics of capacity related to deterioration, we obtained a high RUL prediction accuracy. In addition to data acquired during battery manufacturing, data from actual operation reflecting environmental factors and load characteristics can be integrated during training, thus securing accurate results under different conditions. Accordingly, this study can be further improved. For instance, we aim to predict capacity fade and RUL using partial data during charging and discharging and other battery storage devices such as supercapacitors and Li-S. Further research and development in this area can shorten the battery development period, prevent accidents during battery operation, and improve battery preservation.

Author Contributions

Conceptualization, B.-K.K. and S.-W.K.; methodology, K.N. and S.-W.K.; software, C.-J.L.; validation, C.-J.L. and S.-W.K.; formal analysis, S.-W.K.; investigation, C.-J.L. and M.-K.K.; resources, M.-K.K.; data curation, C.-J.L.; writing—original draft preparation, C.-J.L. and S.-W.K.; writing—review and editing, K.N. and S.-W.K. All authors have read and agreed to the published version of the manuscript.

Funding

This research was supported by a grant from R&D program of Korea Railroad Research Institute. In addition, this work was supported by the National Research Foundation of Korea (NRF) grant funded by the Korea government (MSIT) (No. 2019R1A5A8080290).

Data Availability Statement

Data are available by request.

Conflicts of Interest

The authors declare no conflict of interest.

References

  1. Doridant, A.; Abouda, K.; Givelin, P.; Thibaud, B. Battery Management System Demonstrator Board design using EMC System simulation. In Proceedings of the 2019 International Symposium on Electromagnetic Compatibility—EMC EUROPE, Barcelona, Spain, 2–6 September 2019; pp. 427–432. [Google Scholar]
  2. Aiello, O.; Crovetti, P.S.; Fiori, F. Susceptibility to EMI of a Battery Management System IC for electric vehicles. In Proceedings of the 2015 IEEE International Symposium on Electromagnetic Compatibility (EMC), Dresden, Germany, 16–22 August 2015; pp. 749–754. [Google Scholar]
  3. Zhang, D.; Cadet, C.; Yousfi-Steiner, N.; Druart, F.; Bérenguer, C. PHM-oriented degradation indicators for batteries and fuel cells. Fuel Cells 2017, 2, 268–276. [Google Scholar] [CrossRef]
  4. Xing, Y.; Ma, E.W.M.; Tsui, K.L.; Pecht, M. Battery Management Systems in Electric and Hybrid Vehicles. Energies 2011, 4, 1840–1857. [Google Scholar] [CrossRef]
  5. Kailong, L.; Kang, L.; Qiao, P.; Cheng, Z. A brief review on key technologies in the battery management system of electric vehicles. Front. Mech. Eng. 2019, 14, 47–64. [Google Scholar]
  6. Sisodia, A.; Monteiro, J. Lithium-ion battery management system: A lifecycle evaluation model for the use in the development of electric vehicles. Int. Conf. Res. Mech. Eng. Sci. 2018, 144, 4020. [Google Scholar] [CrossRef]
  7. Vichare, N.; Pecht, M. Prognostics and health management of electronics. IEEE Trans. Compon. Packag. Technol. 2006, 29, 222–229. [Google Scholar] [CrossRef]
  8. Liu, Z.; Jia, Z.; Vong, C.-M.; Han, J.; Yan, C.; Pecht, M. A Patent Analysis of Prognostics and Health Management (PHM) Innovations for Electrical Systems. IEEE Access 2018, 6, 18088–18107. [Google Scholar] [CrossRef]
  9. Xia, T.; Dong, Y.; Xiao, L.; Du, S.; Pan, P.; Xi, L. Recent advances in prognostics and health man-agement for advanced manufacturing paradigms. Reliab. Eng. Syst. Saf. 2018, 178, 255–268. [Google Scholar] [CrossRef]
  10. Lelie, M.; Braun, T.; Knips, M.; Nordmann, H.; Ringbeck, F.; Zappen, H.; Sauer, D.U. Battery Management System Hardware Concepts: An Overview. Appl. Sci. 2018, 8, 534. [Google Scholar] [CrossRef] [Green Version]
  11. Yoon, C.-O.; Moon, E.-A.; Jonghoon, K.; Kim, K.-H. Lifetime Prediction and Internal Parameter Analysis of Lithium-Ion Cell for Spacecraft Application. J. Adv. Eng. Technol. 2017, 10, 17–22. [Google Scholar] [CrossRef]
  12. Vasebi, A.; Bathaee, S.; Partovibakhsh, M. Predicting state of charge of lead-acid batteries for hybrid electric vehicles by extended Kalman filter. Energy Convers. Manag. 2008, 49, 75–82. [Google Scholar] [CrossRef]
  13. Sim, S.H.; Gang, J.H.; An, D.; Kim, S.I.; Kim, J.Y.; Choi, J.H. Remaining Useful Life Prediction of Li-Ion Battery Based on Charge Voltage Characteristics. Trans. Korean Soc. Mech. Eng. B 2013, 37, 313–322. [Google Scholar] [CrossRef] [Green Version]
  14. Choi, Y.; Kim, H. Prognostics and Health Management for Battery Remaining Useful Life Prediction Based on Electrochemistry Model: A Tutorial. J. Korean Inst. Commun. Inf. Sci. 2017, 42, 939–949. [Google Scholar] [CrossRef] [Green Version]
  15. Severson, K.A.; Attia, P.M.; Jin, N.; Perkins, N.; Jiang, B.; Yang, Z.; Chen, M.H.; Aykol, M.; Herring, P.K.; Fraggedakis, D.; et al. Data-driven prediction of battery cycle life before capacity degradation. Nat. Energy 2019, 4, 383–391. [Google Scholar] [CrossRef] [Green Version]
  16. Saha, B.; Goebel, K. Battery Data Set, NASA Ames Prognostics Data Repository; NASA Ames: Moffett Field, CA, USA, 2007. Available online: http://ti.arc.nasa.gov/project/prognostic-datarepository (accessed on 15 March 2019).
  17. Xia, T.; Song, Y.; Zheng, Y.; Pan, E.; Xi, L. An ensemble framework based on convolutional bi-directional LSTM with multiple time windows for remaining useful life estimation. Comput. Ind. 2020, 115, 103182. [Google Scholar] [CrossRef]
  18. Aiello, O. Electromagnetic Susceptibility of Battery Management Systems’ ICs for Electric Vehicles: Experimental Study. Electron. 2020, 9, 510. [Google Scholar] [CrossRef] [Green Version]
  19. Chemali, E.; Kollmeyer, P.J.; Preindl, M.; Emadi, A. State-of-charge estimation of Li-ion batteries using deep neural networks: A machine learning approach. J. Power Sources 2018, 400, 242–255. [Google Scholar] [CrossRef]
  20. Lim, S.W.; Jeong, U.H.; Lim, H.W. Study on failure prediction method of BLDC motor driver. J. Adv. Eng. Technol. 2016, 9, 105–109. [Google Scholar]
  21. Meng, H.; Li, Y.-F. A review on prognostics and health management (PHM) methods of lithium-ion batteries. Renew. Sustain. Energy Rev. 2019, 116, 109405. [Google Scholar] [CrossRef]
  22. Bian, X.; Wei, Z.; He, J.; Yan, F.; Liu, L. A Novel Model-based Voltage Construction Method for Robust State-of-health Estimation of Lithium-ion Batteries. IEEE Trans. Ind. Electron. 2020, 1. [Google Scholar] [CrossRef]
  23. He, J.; Wei, Z.; Bian, X.; Yan, F. State-of-Health Estimation of Lithium-Ion Batteries Using Incremental Capacity Analysis Based on Voltage–Capacity Model. IEEE Trans. Transp. Electrif. 2020, 6, 417–426. [Google Scholar] [CrossRef]
  24. Mansour-Saatloo, A.; Moradzadeh, A.; Mohammadi-Ivatloo, B.; Ahmadian, A.; Elkamel, A. Machine Learning Based PEVs Load Extraction and Analysis. Electron. 2020, 9, 1150. [Google Scholar] [CrossRef]
  25. Zhang, L.; Lin, J.; Liu, B.; Zhang, Z.; Yan, X.; Wei, M. A Review on Deep Learning Applications in Prognostics and Health Management. Ieee Access 2019, 7, 162415–162438. [Google Scholar] [CrossRef]
  26. Lu, C.; Tao, L.; Fan, H. Li-ion battery capacity estimation: A geometrical approach. J. Power Sources 2014, 261, 141–147. [Google Scholar] [CrossRef]
  27. He, W.; Williard, N.; Osterman, M.; Pecht, M. Prognostics of lithium-ion batteries based on Dempster–Shafer theory and the Bayesian Monte Carlo method. J. Power Sources 2011, 196, 10314–10321. [Google Scholar] [CrossRef]
  28. Walker, E.; Rayman, S.; White, R.E. Comparison of a particle filter and other state estimation methods for prognostics of lith-ium-ion batteries. J. Power Sources 2015, 287, 1–12. [Google Scholar] [CrossRef] [Green Version]
Figure 1. Experimental data preprocessing, battery capacity and RUL prediction, and performance comparison performed in this study. RUL: remaining useful life; NASA: National Aeronautics and Space Administration.
Electronics 10 00846 g001
Figure 2. Data structure provided by NASA from lithium-ion battery charge/discharge tests.
Electronics 10 00846 g002
Figure 3. Battery charge/discharge curves over time: (a) current variations during charge and (b) voltage variations during discharge.
Electronics 10 00846 g003
Figure 4. Extraction of geometric features from curves of (a) current during charge and (b) voltage during discharge.
Electronics 10 00846 g004
Figure 5. Deep neural network (DNN) algorithm framework designed for RUL prediction.
Electronics 10 00846 g005
Figure 6. Geometric features (af) (defined in Figure 4) extracted from charge/discharge curves of battery B0005.
Electronics 10 00846 g006
Figure 7. Capacity prediction of each battery based using the DNN model.
Electronics 10 00846 g007
Figure 8. Mean squared error for (a) training and (b) test data.
Electronics 10 00846 g008
Figure 9. RUL prediction based using the DNN model for batteries (a) B0018 and (b) B0005.
Electronics 10 00846 g009
Figure 10. End of life (EOL) prediction error using (a) DNN and (b) particle filter (PF).
Electronics 10 00846 g010
Figure 11. Results from DNN learning and PF modeling at cycle 76 for capacity prediction.
Electronics 10 00846 g011
Table 1. Features used in this study for RUL prediction.
No.FeatureProcess
1Length of constant voltage sectionCharge
2Area under constant voltage sectionCharge
3Maximum radius of curvature in constant voltage sectionCharge
4Maximum slope of initial voltage curveDischarge
5Length of voltage range above 3 VDischarge
6Maximum radius of curvature in voltage curveDischarge
7Discharging time
8Charging time
9Test temperature
10Discharging voltage
11Discharging current
RUL: remaining useful life.
Table 2. Training and test errors according to training data.
Root Mean-Squared Error of Capacity Predictions
Battery Excluded from TrainingTraining Error (×10−5)TestError (×10−2)B0005 (×10−5)B0006 (×10−4)B0007 (×10−5)B0018 (×10−5)B0029 (×10−4)B0030 (×10−4)B0031 (×10−4)B0032 (×10−4)
B00055.970.3443693.106.542.072.451.130.8132.29
B00063.320.2584.7828.84.593.675.973.151.514.00
B00072.765.0919.18.30538013.46.112.912.125.97
B00189.020.01075.902.445.8210.93.102.101.213.90
B00292.781.691.692.014.506.961441.631.621.57
B00303.560.05416.02.481.393.521.714.951.701.85
B00313.9921.12.591.036.382.623.172.4720503.52
B00325.2022.916.45.049.258.838.746.142.582240
Publisher’s Note: MDPI stays neutral with regard to jurisdictional claims in published maps and institutional affiliations.

