Article

Data-Driven Construction of User Utility Functions from Radio Connection Traces in LTE

by
Antonio J. García
*,
Carolina Gijón
,
Matías Toril
and
Salvador Luna-Ramírez
*
Department of Communications Engineering, University of Malaga, 29071 Malaga, Spain
*
Authors to whom correspondence should be addressed.
Electronics 2021, 10(7), 829; https://doi.org/10.3390/electronics10070829
Submission received: 12 February 2021 / Revised: 27 March 2021 / Accepted: 28 March 2021 / Published: 31 March 2021
(This article belongs to the Special Issue Radio Access Network Planning and Management)

Abstract

:
In recent years, the number of services in mobile networks has increased exponentially. This increase has forced operators to change their network management processes to ensure an adequate Quality of Experience (QoE). A key component in QoE management is the availability of a precise QoE model for every service that reflects the impact of network performance variations on the end-user experience. In this work, an automatic method is presented for deriving Quality-of-Service (QoS) thresholds in analytical QoE models of several services from radio connection traces collected in an Long Term Evolution (LTE) network. Such QoS thresholds reflect the minimum connection performance below which a user gives up its connection. The proposed method relies on the fact that user experience influences the traffic volume requested by users. Method assessment is performed with real connection traces taken from live LTE networks. Results confirm that packet delay or user throughput are critical factors for user experience in the analyzed services.

1. Introduction

In recent years, there has been a significant increase in the number of users and services in mobile networks. This fact has led to an exponential growth in the demand of mobility services. In coming years, a tenfold increase of mobile traffic is expected, reaching 71% of total traffic on the Internet by 2022. Internet of Things (IoT) applications are one of the main causes for this increase, and by 2023, IoT devices will account for 50% of all global networked devices [1]. Not only that, new radio access technologies (e.g., 5G) have increased the complexity of mobile networks, which has been identified as a major issue for the success of future deployments [2].
Traditionally, operators have managed their networks in a Quality of Service (QoS) framework. This QoS perspective needs to measure user or network performance (e.g., accessibility, sustainability, integrity, et al.). Thus, network management must be oriented in such a way as to meet some requirements based on these indicators (e.g., a user throughput not less than X Mbps). Additionally, QoS requirements can be defined in a service basis in such a way that different services can use different indicators and/or meet different requirements. As an example, operators usually demand some maximum delay for real-time services (e.g., Voice over IP (VoIP)), while throughput is the most-used indicator for best-effort services (e.g., the Internet) [3].
The QoS framework, however, lacks the user’s perspective, and so a good network/user performance is not always translated into a good user experience. Operators have therefore shifted their focus from network performance to end-user satisfaction (Quality of Experience (QoE)) [4]. This shift is reinforced by the success of smartphones and tablets, which has raised users’ expectations, and the introduction of 5G new radio technology [5,6]. As a consequence, QoS management processes have been replaced by a more modern approach that is focused on QoE. This new paradigm has become a key differentiating factor in a competitive market in which networks and services are similar for all operators. In this new framework focused on the user’s perspective, Customer Experience Management (CEM) has become an extremely important task for mobile network operators [7].
CEM aims to improve the final user experience by optimizing the use of network resources [8]. One of the main tasks involved in CEM is to find sophisticated indicators at the service level to ensure service performance is properly characterized. Unfortunately, such service performance indicators are usually not available for network operators, unless complex crowd sourcing schemes are deployed [9]. Thus, CEM tries to understand the factors influencing user quality perception with the aim of describing the relationship between measurable variables and the experience perceived by the end user (i.e., QoE modeling [8,10]. Such variables may be human (e.g., age, education, etc.), system (e.g., resolution, throughput, delay, etc.) or context (e.g., cost, data charging gap, mobility, etc.) factors [11,12,13]. For system aspects, QoE models often consist of analytical utility functions relating network-based QoS indicators to user opinion [14]. In its simplest form, this relationship between QoS and QoE is a logarithmic [15] or exponential [16] function. This approach is followed by most frameworks for large-scale, on-line, passive monitoring for each connection [17,18]. For a comprehensive survey of objective QoE models, the reader is referred to [19].
Most QoE models include parameters reflecting QoS thresholds above/below which QoE remains constant [20]. The values of these thresholds are derived from subjective tests with real users in lab environments, which are time-consuming and may not reflect the true conditions in real life. Moreover, objective QoE models are seldom updated. However, customer expectations continuously increase as a result of handset upgrades, service diversification and new radio technologies. As a consequence, user satisfaction progressively decreases if the provided QoS remains the same. For this reason, QoE models must be continuously updated. In most cases, tuning model parameters would be enough, avoiding more complex actions, such as changing the model structure. Even so, an automatic parameter tuning process is required to avoid subjective tests.
Current mobile networks generate a huge amount of information in the form of measurements and interaction registers [21]. However, for simplicity, the majority of this information is discarded, and CEM is often performed based on limited data. Thus, operators are only focused on Configuration Management (CM), Performance Management (PM), Charge Data Record (CDR) and Customer Relationship Management (CRM) data. All this information is usually aggregated, meaning that it is impossible to identify an individual user’s QoE. With the latest advances in information technologies, it is now possible to analyze massive volumes of information by using Big Data Analytics (BDA) techniques [22]. In mobile networks, BDA can improve the reaction time of management systems, allowing actions in real time and in a proactive way to improve the monitoring, control and optimization of QoE [21]. Connection traces are one of the main sources of information in mobile networks. Traces systematically register all events associated with a specific cell/user in some period of time, becoming a powerful tool for automated network performance analysis, monitoring and control [6].
In this work, a novel automatic method is presented to tune QoS thresholds in classical analytical QoE models by analyzing radio connection traces in an Long Term Evolution (LTE) system. The proposed method relies on the fact that users tend to shorten their connections when QoE is not satisfactory. Thus, the values of QoS thresholds can be inferred by detecting the loss of traffic volume for each connection as a result of unsatisfied users. The method consists of two stages: first, connections are segregated per service, based on QoS Class Identifiers (QCIs) and hierarchical clustering from connection descriptors; then, the value of QoS thresholds is estimated for each service by analyzing traffic descriptors on a per-connection basis. Method assessment is carried out by using a real trace dataset from two live LTE networks. Unlike previous approaches, the proposed data-driven method (a) can be fully automated, eliminating the need for subjective tests when deploying a new service; (b) can deal with the large diversity of system and human factors, which cannot be taken into account in lab environments; and (c) can be executed periodically to detect changes in user trends in large geographical regions.
The rest of the work is organized as follows. Section 2 introduces the use of utility functions for QoE characterization. Section 3 outlines the trace collection process in mobile networks. Section 4 describes the proposed method to adjust QoS threshold parameters in classical QoE models based on network traces. Section 5 shows the results obtained with a trace dataset taken from real LTE systems. Finally, Section 6 presents the main conclusions.

2. Characterization of Quality of Experience

QoE monitoring in mobile networks is a key factor for operators [23]. As the network evolves, new indicators and counters are included in network equipment with the aim of reflecting service performance (e.g., initial buffering time or web download time for video and web services, respectively). However, user experience, as a subjective matter, cannot be measured but only estimated from network and service performance indicators. For this purpose, QoE models use utility functions to map the value of network Key Performance Indicators (KPIs), reflecting QoS, to user experience [20,24].
How QoS parameters are mapped into a QoE indicator is a widely studied subject. A generic formula connecting QoE with QoS for different packet data services is described in [16]. It is assumed here that user experience remains constant at a maximum level when some upper QoS threshold is exceeded. Similarly, a minimum QoS threshold can be defined below which a user neglects to continue its connection due to their bad experience. These statements can be formulated as
Q o E = max { min { f ( Q o S 1 , Q o S 2 , , Q o S N ) , Q o E m a x } , Q o E m i n } ,
where Q o S i , i { 1 , 2 N } , are the N network performance indicators reflecting service performance, Q o E is the indicator quantifying user experience, f is the user utility function, and Q o E m a x and Q o E m i n define the range of Q o E values. Note that existence of Q o E limits implies that there also exist QoS thresholds, Q o S i , t h m a x and Q o S i , t h m i n , above or below which Q o E does not change. Thus, (1) can be reformulated as
Q o E = f ( max { min { Q o S 1 , Q o S 1 , t h m a x } , Q o S 1 , t h m i n } , , max { min { Q o S N , Q o S N , t h m a x } , Q o S N , t h m i n } ) .
At the same time, user experience is influenced by factors that strongly depend on the requested service. For instance, a user performing a voice call is sensitive to packet delay, whereas a user uploading a photo in a social network is more sensitive to throughput [25]. Thus, different user utility functions are defined for each service [20]. To aid comparison, QoE is commonly measured as the Mean Opinion Score (MOS). MOS scale ranges from 1 (worst experience) to 5 (best experience), i.e., M O S m a x ( s ) 5 and M O S m i n ( s ) 1 . However, some models set more restrictive limits. With these considerations, (1) can be reformulated as
M O S ( s ) = max { min { f ( s ) ( Q o S 1 , Q o S 2 , , Q o S N Q o S ) , M O S m a x ( s ) } , M O S t h m i n ( s ) } = f ( s ) ( max { min { Q o S 1 , Q o S 1 , m a x ( s ) } , Q o S 1 , m i n ( s ) } ) , , max { min { Q o S N , Q o S N , m a x ( s ) } , Q o S N , m i n ( s ) } ) ,
where superscript s refers to the service under consideration (i.e., s { w e b , v i d e o , } ). From (3), it follows that users of different services can experience a different QoE with the same network performance (QoS). Consequently, different QoS requirements must be achieved to guarantee the same MOS for all services in a mobile network [20].
QoS thresholds give extremely valuable information to network operators, as it is not worthwhile to increase Q o S beyond/below a certain threshold if there is no impact on user experience. Unfortunately, the value of QoS thresholds per service, Q o S i , m i n / m a x ( s ) , is highly dependent on many factors, such as user expectation (which is not the same for all users), handset features (the user expects a better experience for a more expensive terminal) or network evolution (a specific level of user experience previously seen as acceptable may not be so some months later). All these factors make it very difficult for operators to find precise QoS thresholds for their networks. Nonetheless, approximating these thresholds is still useful for operators as it allows them to assess the overall cell performance from a user experience perspective. From these thresholds, operators can trigger corrective actions to have an impact on the overall user experience (e.g., ensuring some minimum user QoE). In this work, we take advantage of the fact that the minimum threshold, Q o S i , m i n , often reflects the QoS below which the user gives up the connection [16]. Thus, Q o S i , m i n can be inferred from user behavior observed in connection traces.

3. Trace Collection Process

Monitoring the QoE of individual users can only be done by collecting QoS indicators for each connection. Such a piece of information is only available in connection traces, containing signaling messages (a.k.a. events) exchanged between every single piece of user equipment (UE) and base station. The structure of events consists of a header and a message container made up of different attributes, referred to as event parameters. The header provides general information (e.g., timestamp, base station, user, event type, among others), whereas attributes stored in the message container are specific to the event. Depending on the network entities involved, events can be external or internal. External events consist of signaling messages exchanged through network interfaces via standard protocols [26,27,28], whereas internal events store vendor-specific information about the performance of the base stations (known as evolved Nodes B (eNBs) in LTE). Events selected by the network operator are registered in a Data Trace File (DTF) for each cell, which is. generated after each reporting period (currently, 15 min). Two types of DTFs are distinguished: UE Traffic Recording (UETR) and Cell Traffic Recording (CTR) [29]. UETRs gather events from a specific users identified by International Mobile Subscriber Identity (IMSI), while CTRs store cell performance information by monitoring many anonymous connections [30]. In this work, CTRs are used to collect QoS indicators that reflect the average performance of each cell in the network.
A high-level view of the architecture for trace reporting in LTE can be found in [30]. The operator starts the trace collection process by preparing a Configuration Trace File (CTF) in the Operations Support System (OSS). A CTF consists of (a) the event(s) to be monitored, (b) the particular UE(s) or ratio of anonymous users to be monitored, (c) the Reporting Output Period (ROP), (d) the maximum number of traces activated simultaneously in the OSS and (e) the time period when trace collection is enabled. Once trace collection is enabled, UEs transfer their event records to their serving eNB. After finishing the ROP, DTFs are generated by the eNB and then sent to the OSS asynchronously.
Trace files are binary files encoded in ASN.1 format [29]. Trace decoding is performed by a parsing tool that decodes, synchronizes and correlates events to extract the information contained in fields and compute the required network indicators, as described later.

4. Estimation of QoS Thresholds on a Per-Service Basis

A novel method to automatically estimate QoS thresholds for different services is described in this section. In this work, only the threshold that determines the worst network performance tolerated by users before terminating the connection is estimated. Depending on the service, this critical value corresponds to Q o S i , t h m i n ( s ) or Q o S i , t h m a x ( s ) . Estimation is carried out by a heuristic approach based on user behavior observed in connection traces. The inputs to the method are the following descriptors, collected for each connection: (a) the QCI value; (b) the Radio Resource Control (RRC) connection time; (c) the total downlink (DL) and uplink (UL) traffic volume at the packet data converge protocol level; (d) the DL traffic volume ratio transmitted in the last transmission time intervals (TTIs) [31]; (e) the DL activity ratio, computed as the ratio between active TTIs (i.e., those with data to transmit) and the effective duration of the connection; (f) the DL session throughput, computed as the volume transmitted in the DL divided by the effective duration of the connection; (g) the mean downlink delay, τ , defined as the sum of DL mean connection delays in Radio Link Control (RLC) and Medium Access Control (MAC) layers; and (h) the mean DL Packet Data Control Protocol (PDCP) connection throughput, T H P D C P , D L , excluding the last TTIs. The output of the method is an estimate of the QoS threshold for each indicator i and service s, Q o S i , t h m i n / m a x ( s ) .
Two main steps are required to estimate QoS thresholds for each service: (1) the classification of connection traces on a service basis and (2) the estimation of QoS thresholds for each service by analyzing user behavior.

4.1. Step 1: Classification of Connection Traces

Due to the coexistence of multiple services with very different requirements, cellular operators are forced to classify traffic for each service to offer differentiated access and resource management [32]. In LTE, services are distinguished by their QCI value [33]. Then, different traffic management priorities and policies (e.g., scheduling weights, queue thresholds, link-layer protocol configuration, etc.) are applied depending on QCI. In current networks, services are commonly classified as QCI 1 (VoIP), QCI 2 (conversational video), QCI 3 (real-time gaming), QCI 4 (non-conversational video), QCI 5 (IMS signaling) and QCIs from 6 to 9 (services based on the Transport Control Protocol without a guaranteed bit rate) [33]. In particular, QCI labels 6 to 9 include a mix of services, ranging from social networks to buffered streaming, which have very different QoS requirements from a QoE perspective. Moreover, some operators assign these last QCI values for user prioritization purposes (i.e., plan vs pre-paid). Thus, it is very difficult to monitor the experience of each specific service based on counters in the network management system, even if these are segregated per QCI. Thus, a more accurate traffic classification is needed for QCIs 6–9.
In recent years, several methods for data traffic classification have been proposed. The simplest method is to identify the connection port [34]. However, currently, several applications use non-standard ports, and port assignment is often dynamic, meaning that there is no unequivocal relationship between a port number and service. More refined methods for traffic classification are based on the analysis of information exchanged along the session [35]. Such an approach cannot be applied for encrypted traffic services. Moreover, even for non-encrypted services, all these methods rely on information from high protocol layers, which can only be accessed by expensive network probes [36].
An option to solve these limitations consists of analyzing payload-independent flow characteristics. These methods exploit the fact that different applications show different features in their traffic that can be classified with Machine Learning (ML) techniques. Encrypted traffic classification has been extensively covered in the literature. In [37], a supervised learning algorithm is used to identify fingerprints of Android apps from their encrypted network traffic. However, supervised schemes require a labeled training dataset. Other alternatives use unsupervised learning algorithms to classify connections without the need of a previously-labeled dataset [38,39]. In [38], an unsupervised method for offline coarse-grained traffic classification in cellular radio access networks is presented. This method relies on the fact that the identification of the class of service for a specific connection can be performed from a set of traffic descriptors showing the properties of data bursts in the connection. Unfortunately, radio connection traces do not explicitly register these traffic descriptors at the burst level, so that they must be estimated from other traffic parameters collected per connection. In the absence of labeled data that could be used as ground truth, the authors in [38] validate their method by comparing the traffic mix resulting from their classification algorithm against mobile traffic statistics published by a vendor. Results show that traffic shares per application class estimated by the proposed method are similar to those provided by a vendor report.
The above-described method is used in this work in the absence of a large dataset of real traces that includes the service requested by the user for each radio connection, due to the difficulty of combining data from the radio access and core domains. To this end, the following traffic descriptors are collected per connection:
  • The RRC connection time;
  • The total DL traffic volume at the packet data converge protocol level;
  • The UL traffic volume ratio η U L [%], computed as
    η U L = 100 × V U L V U L + V D L ;
  • The DL traffic volume ratio transmitted in last TTIs, η U L l a s t T T I , computed as
    η U L l a s t T T I = V D L l a s t T T I V D L ;
  • The DL activity ratio, η D L a c t i v e , computed as the ratio between active TTIs and the effective duration of the connection,
    η D L a c t i v e = T D L a c t i v e T e f f ;
  • The session DL throughput, T H D L s e s s i o n (in bps).
Then, burst level parameters required for traffic classification are estimated for each connection from the set of traffic descriptors listed above. From these parameters, connections are divided into groups by hierarchical clustering. Finally, the resulting groups are associated with broad application groups by analyzing the median value of traffic descriptors for connections in each group.

4.2. Step 2: Estimation of Minimum Qos Thresholds

As explained in Section 2, each service has its own user utility function, f ( s ) , combining different QoS indicators. In this work, the analysis is restricted to application groups that have a significant share of connections and are affected by QoS; namely, Voice over LTE (VoLTE), full-buffer data services (e.g., app download, software update, large file download via File Transfer Protocol, etc.) and streaming services (e.g., audio/video, live/buffered, etc.). For simplicity, in each service, only the QoS indicator with the largest impact on QoE for each service is considered (i.e., N = 1 s in (3)). This indicator is not necessarily the same for all services. For instance, packet delay negatively affects user experience for real-time services (e.g., VoLTE or conversational video-streaming), whereas user experience in non-real-time services (e.g., app download) is more sensitive to user data throughput. Previous works have shown that user experience in most services is dominated by a single QoS metric. For instance, in [40], an analytical model to estimate the QoE for a video-streaming service based on different network level metrics (e.g., average session throughput, packet loss ratio and round-trip time) is presented. It is shown there that QoE is strongly correlated with a single QoS metric (average session throughput). On the other hand, it is well accepted that voice calls are mostly affected by packet delay [41]. For this reason, user experience is estimated here from the foremost QoS indicator of the requested service in order to reduce the complexity of the proposed model.
Hereafter, it is assumed that the QoE of a connection k of service s, M O S ( s ) ( k ) , is conditioned by the value of the indicator i with the largest impact for that service, Q o S i ( s ) ( k ) . When this indicator falls below a certain threshold, Q o S i , m i n ( s ) users experience their worst QoE, M O S m i n ( s ) , which is reflected in different traffic indicators depending on the service. For instance, unsatisfied VoLTE users tend to shorten their connections, and the effect is therefore observed in connection length. In contrast, in non-real-time services, whether background, interactive or streaming, the effect is more evident in the traffic volume for each connection. As a consequence, an analysis of an additional and service-based traffic indicators (e.g., length connection for VoLTE or data volume for streaming services) is needed in order to detect those low-QoE connections. This traffic indicator is denoted as T j ( s ) ( k ) . Then, the QoE estimation of a connection k of service s is based on QoS indicator j, Q o S j ( s ) ( k ) , used to infer the user behavior, and QoS indicator i, Q o S i ( s ) , as the indicator with the largest effect on QoE. As user behavior is not deterministic, this Q o S i ( s ) has some random component so that connections with the same Q o S i ( s ) do not end up with identical values of Q o S j ( s ) . To deal with this uncertainty, a percentile curve relating connection Q o S i ( s ) and Q o S j ( s ) is constructed for each service by discretizing Q o S i ( s ) values and computing the 50th percentile (median) of the distribution of Q o S j ( s ) per bin, Q o S j , 50 t h t i l e ( s ) ( Q o S i ( s ) ) .
Finally, the QoS threshold for each service, Q o S i , t h m i n ( s ) , is estimated. This minimum QoS threshold determines a boundary between two states: a degraded state, where a user perceives a bad service performance and tends to stop the connection, and a normal state, where service performance is good enough to consume the service normally. As this boundary highly depends on service, the following paragraphs anticipate the ideal user behavior for broad service classes. To this end, Figure 1 shows the expected relationship between the selected QoS and traffic indicators—i.e., Q o S i ( s ) ( k ) , Q o S j ( s ) ( k ) and T j ( s ) ( k ) —for each class.
In full-buffer data services, all data are available at the beginning of the connection, meaning that the associated traffic pattern consists of a few, very long bursts in which data are transmitted at full speed. Thus, the user terminal demands as many resources as possible until all the data are transmitted. It is assumed here that the user tends to give up the session when the download time exceeds a certain threshold. Such an action should be reflected both in connection duration and traffic volumes per connection, as shown in Figure 1a. The x-axis represents the mean DL PDCP connection throughput, measured only considering active (and non-last) TTIs, which are selected as the QoS indicator with the largest impact on QoE for these services. The primary x-axis represents the connection duration, while the secondary y-axis represents the total DL data volume per the connection. The solid curve represents the median of the distribution of connection duration, whereas the dashed line represents the median of the distribution of the total DL data volume. For clarity, the shaded area labeled as the degraded state comprises connections whose link conditions are unacceptable for the user, which are more likely to be interrupted. As observed in the figure, it is expected that users will try to maintain a connection until a maximum duration is reached. On the right of the figure, as the link performance improves, the connection duration is reduced, since data are transmitted faster. In contrast, the data volume per connection remains constant, since it is not conditioned by link performance beyond a certain point (i.e., the user ends the connection before downloading the complete data). Thus, the minimum QoS threshold, T H m i n , in full-buffer data services is estimated as the average DL PDCP throughput below which connection duration drops.
Streaming services are also affected by user throughput, meaning that the selected QoS indicator is again DL PDCP throughput. However, a different behavior is expected for connection duration and data volume. Streaming sessions consist of long connections with large data volume distributed in many bursts. Unlike full-buffer data services, streaming services are elastic, meaning that a good link performance does not necessarily lead to a reduction of session duration. Thus, connection duration may not be a good QoS indicator to reflect user behavior. Instead, DL session throughput, calculated by dividing the total DL data volume by the connection duration (including silent periods), may reflect the quality of the downloaded material. Figure 1b shows the expected impact of user behavior for streaming services, representing the relationship between DL PDCP throughput and DL session throughput. The solid line represents the median session throughput and the shaded area defines the degraded state. As shown, in the degraded state, the session throughput decreases as the DL PDCP throughput decreases. Once the DL PDCP throughput is good enough, the session throughput remains constant, showing that the latter is not conditioned by the former. Thus, the minimum QoS threshold, T H m i n , for streaming services is the value of the DL PDCP throughput below which the median session throughput starts to decrease.
In a VoLTE service, the connection duration is the most representative indicator for the characterization of user behavior. However, unlike full-buffer data, the QoS indicator with the strongest impact on QoE is packet delay. Figure 1c shows the expected impact of user behavior in VoLTE by representing the variation of connection duration caused by changes in DL packet delay. As in previous sub-figures, the solid line represents the median of connection duration and the shaded area is the degraded state. It is observed that the median connection duration should drop when the DL packet delay increases above a certain limit. Thus, the minimum QoS threshold, τ m a x , for VoLTE is the value of average DL packet delay above which the mean connection duration starts to decrease.
It is envisaged that, in real networks, some services may not be fully represented by the three above cases. For instance, web service or social networks might show different behaviors depending on the size of their objects. Likewise, live streaming may have strict latency requirements.

5. Performance Assessment

In this section, the above-described method to estimate QoS thresholds on a service basis is tested with a set of radio connection traces taken from a live LTE network. For clarity, the analysis set-up is first explained and results are presented later. Finally, implementation issues are discussed.

5.1. Analysis Set-Up

Two independent datasets are generated from anonymous traces collected in two different LTE systems. Both systems are mature enough to provide a large set of connections with a varying QoS to derive the required QoS thresholds. Dataset 1 is collected in 1960 LTE cells covering an urban area of 3900 km2. Specifically, traces are collected during two hours (from 10:00 to 12:00 a.m.), resulting in 48,683 connections: 43% of connections in QCI 1 and 57% in the range of QCIs 6–9. On the other hand, dataset 2 is collected from 10:00 to 11:00 a.m. in 145 LTE cells covering 125 km2 in an urban area, resulting in 10,123 connections, all of which have QCIs between 6 and 9.
Traces are processed to obtain the traffic descriptors for each connection needed for traffic classification, as defined in Section 4.1. Then, connections are classified with the unsupervised learning method described in the same subsection. After classification, 8% of connections are labeled as full-buffer data services, 5% are classified as streaming, 35% are classified as VoIP, 5% as web browsing of webs with large objects and 47% as web browsing for webs with small objects or social networks.

5.2. Results

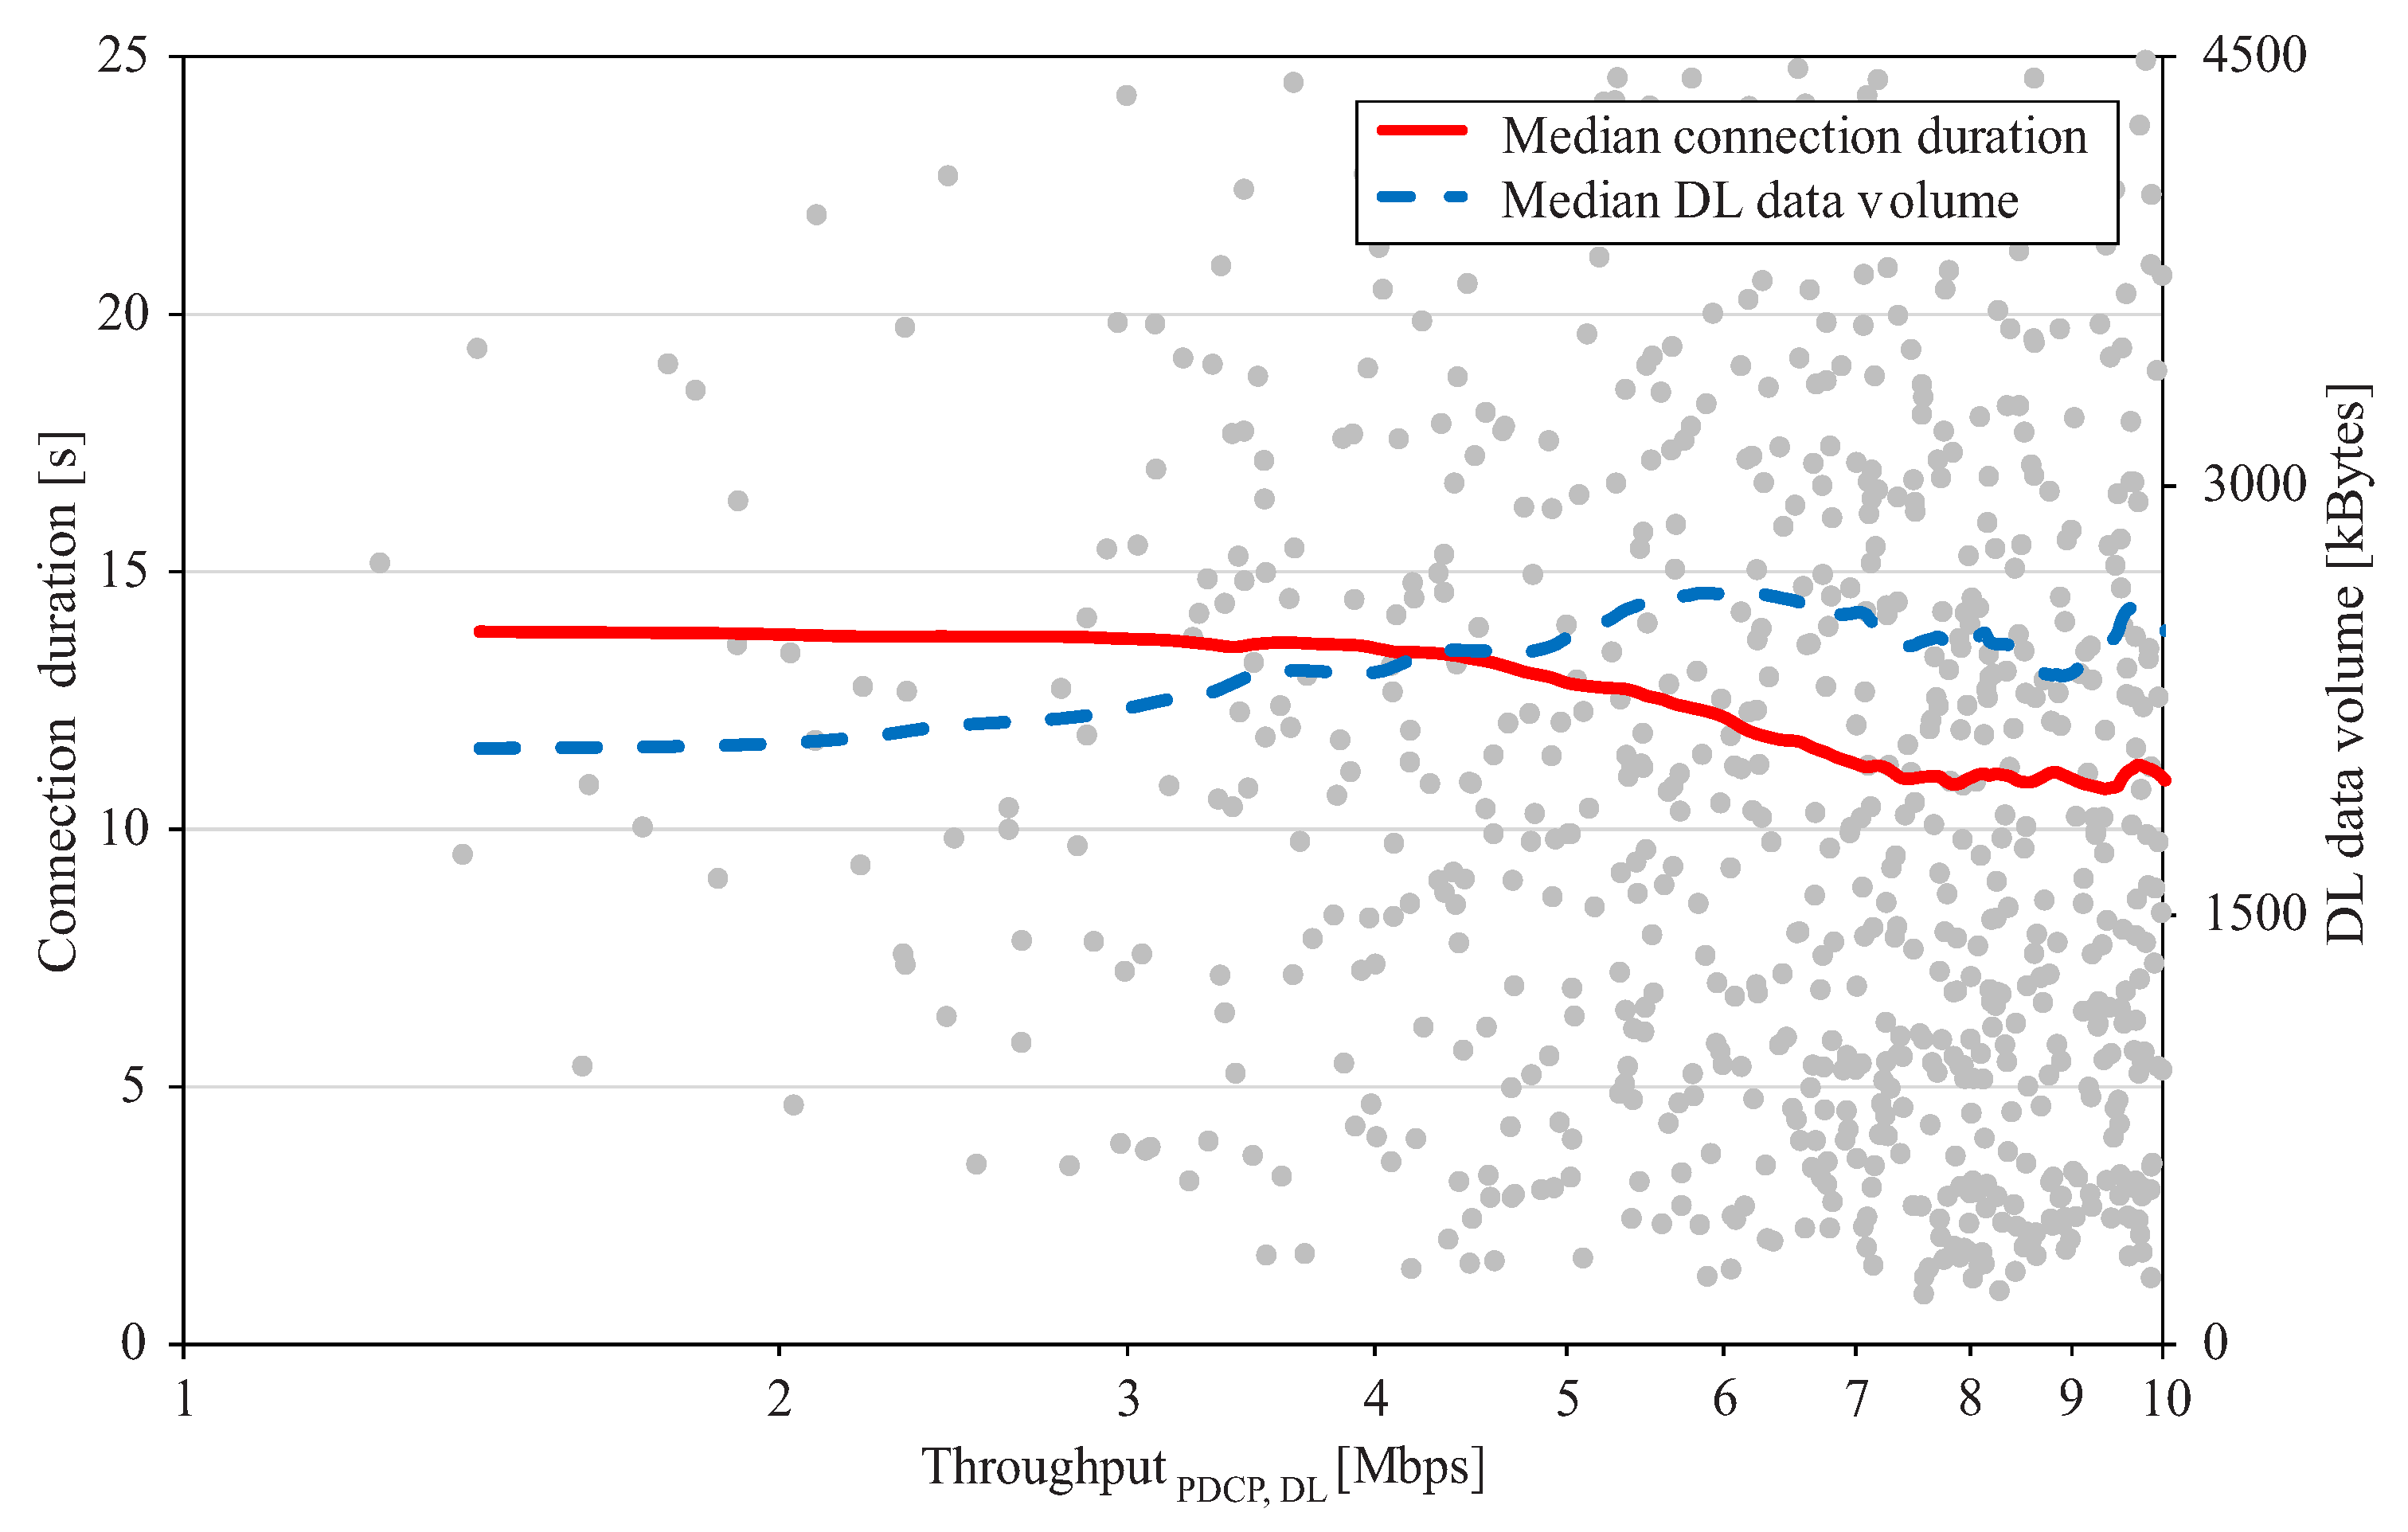
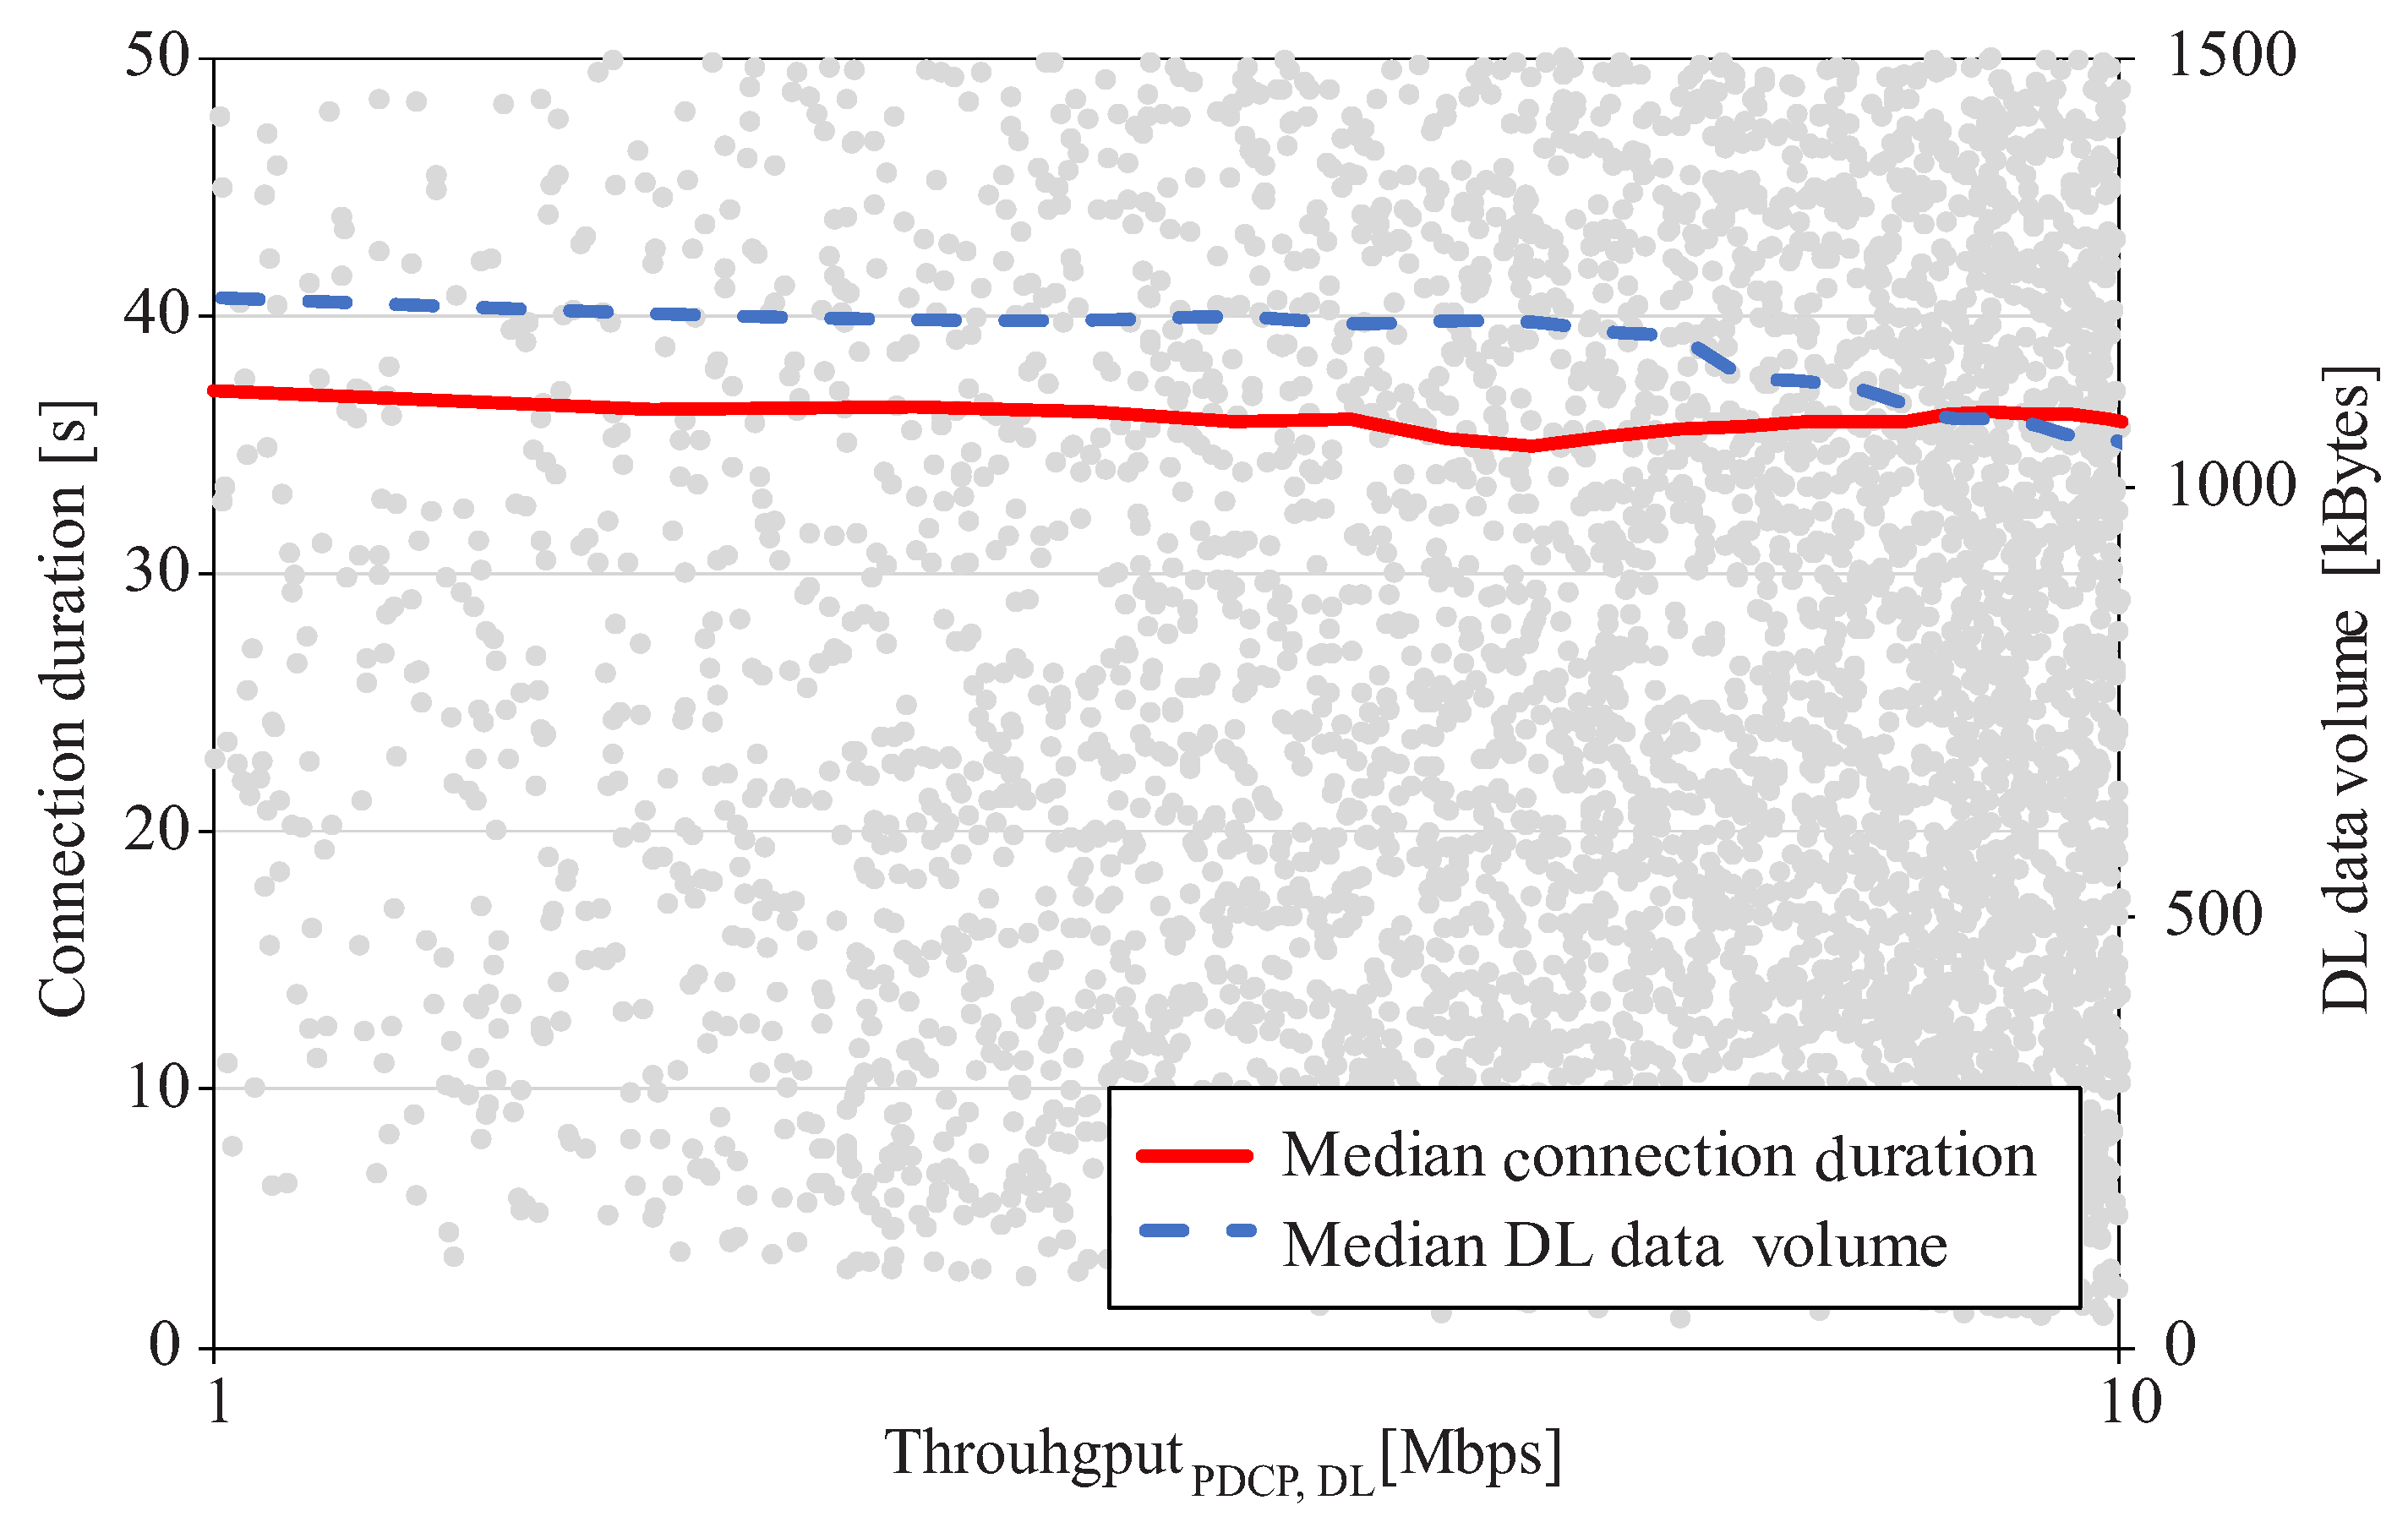
Figure 2 shows the analysis for full-buffer data services. Each point in the figure represents a connection labeled as full-buffer data service. The solid line represents the median connection duration, C D m e d i a n ( f b ) , and the dashed line represents the median DL data volume, V D L m e d i a n ( f b ) . The throughput axis is adjusted to low values (below 10 Mbps) to better identify the boundary between the two states specified in Figure 1a. The results confirm the expected impact of user behavior, since, for a low DL PDCP throughput, the DL data volume decreases and the connection duration stagnates. The minimum QoS threshold can be determined as the T H P D C P , D L ( f b ) value that causes C D m e d i a n ( f b ) to drop and V D L m e d i a n ( f b ) to remain constant. From the figure, the estimated threshold for this service is T H P D C P , D L ( f b ) m i n = 5 Mbps.
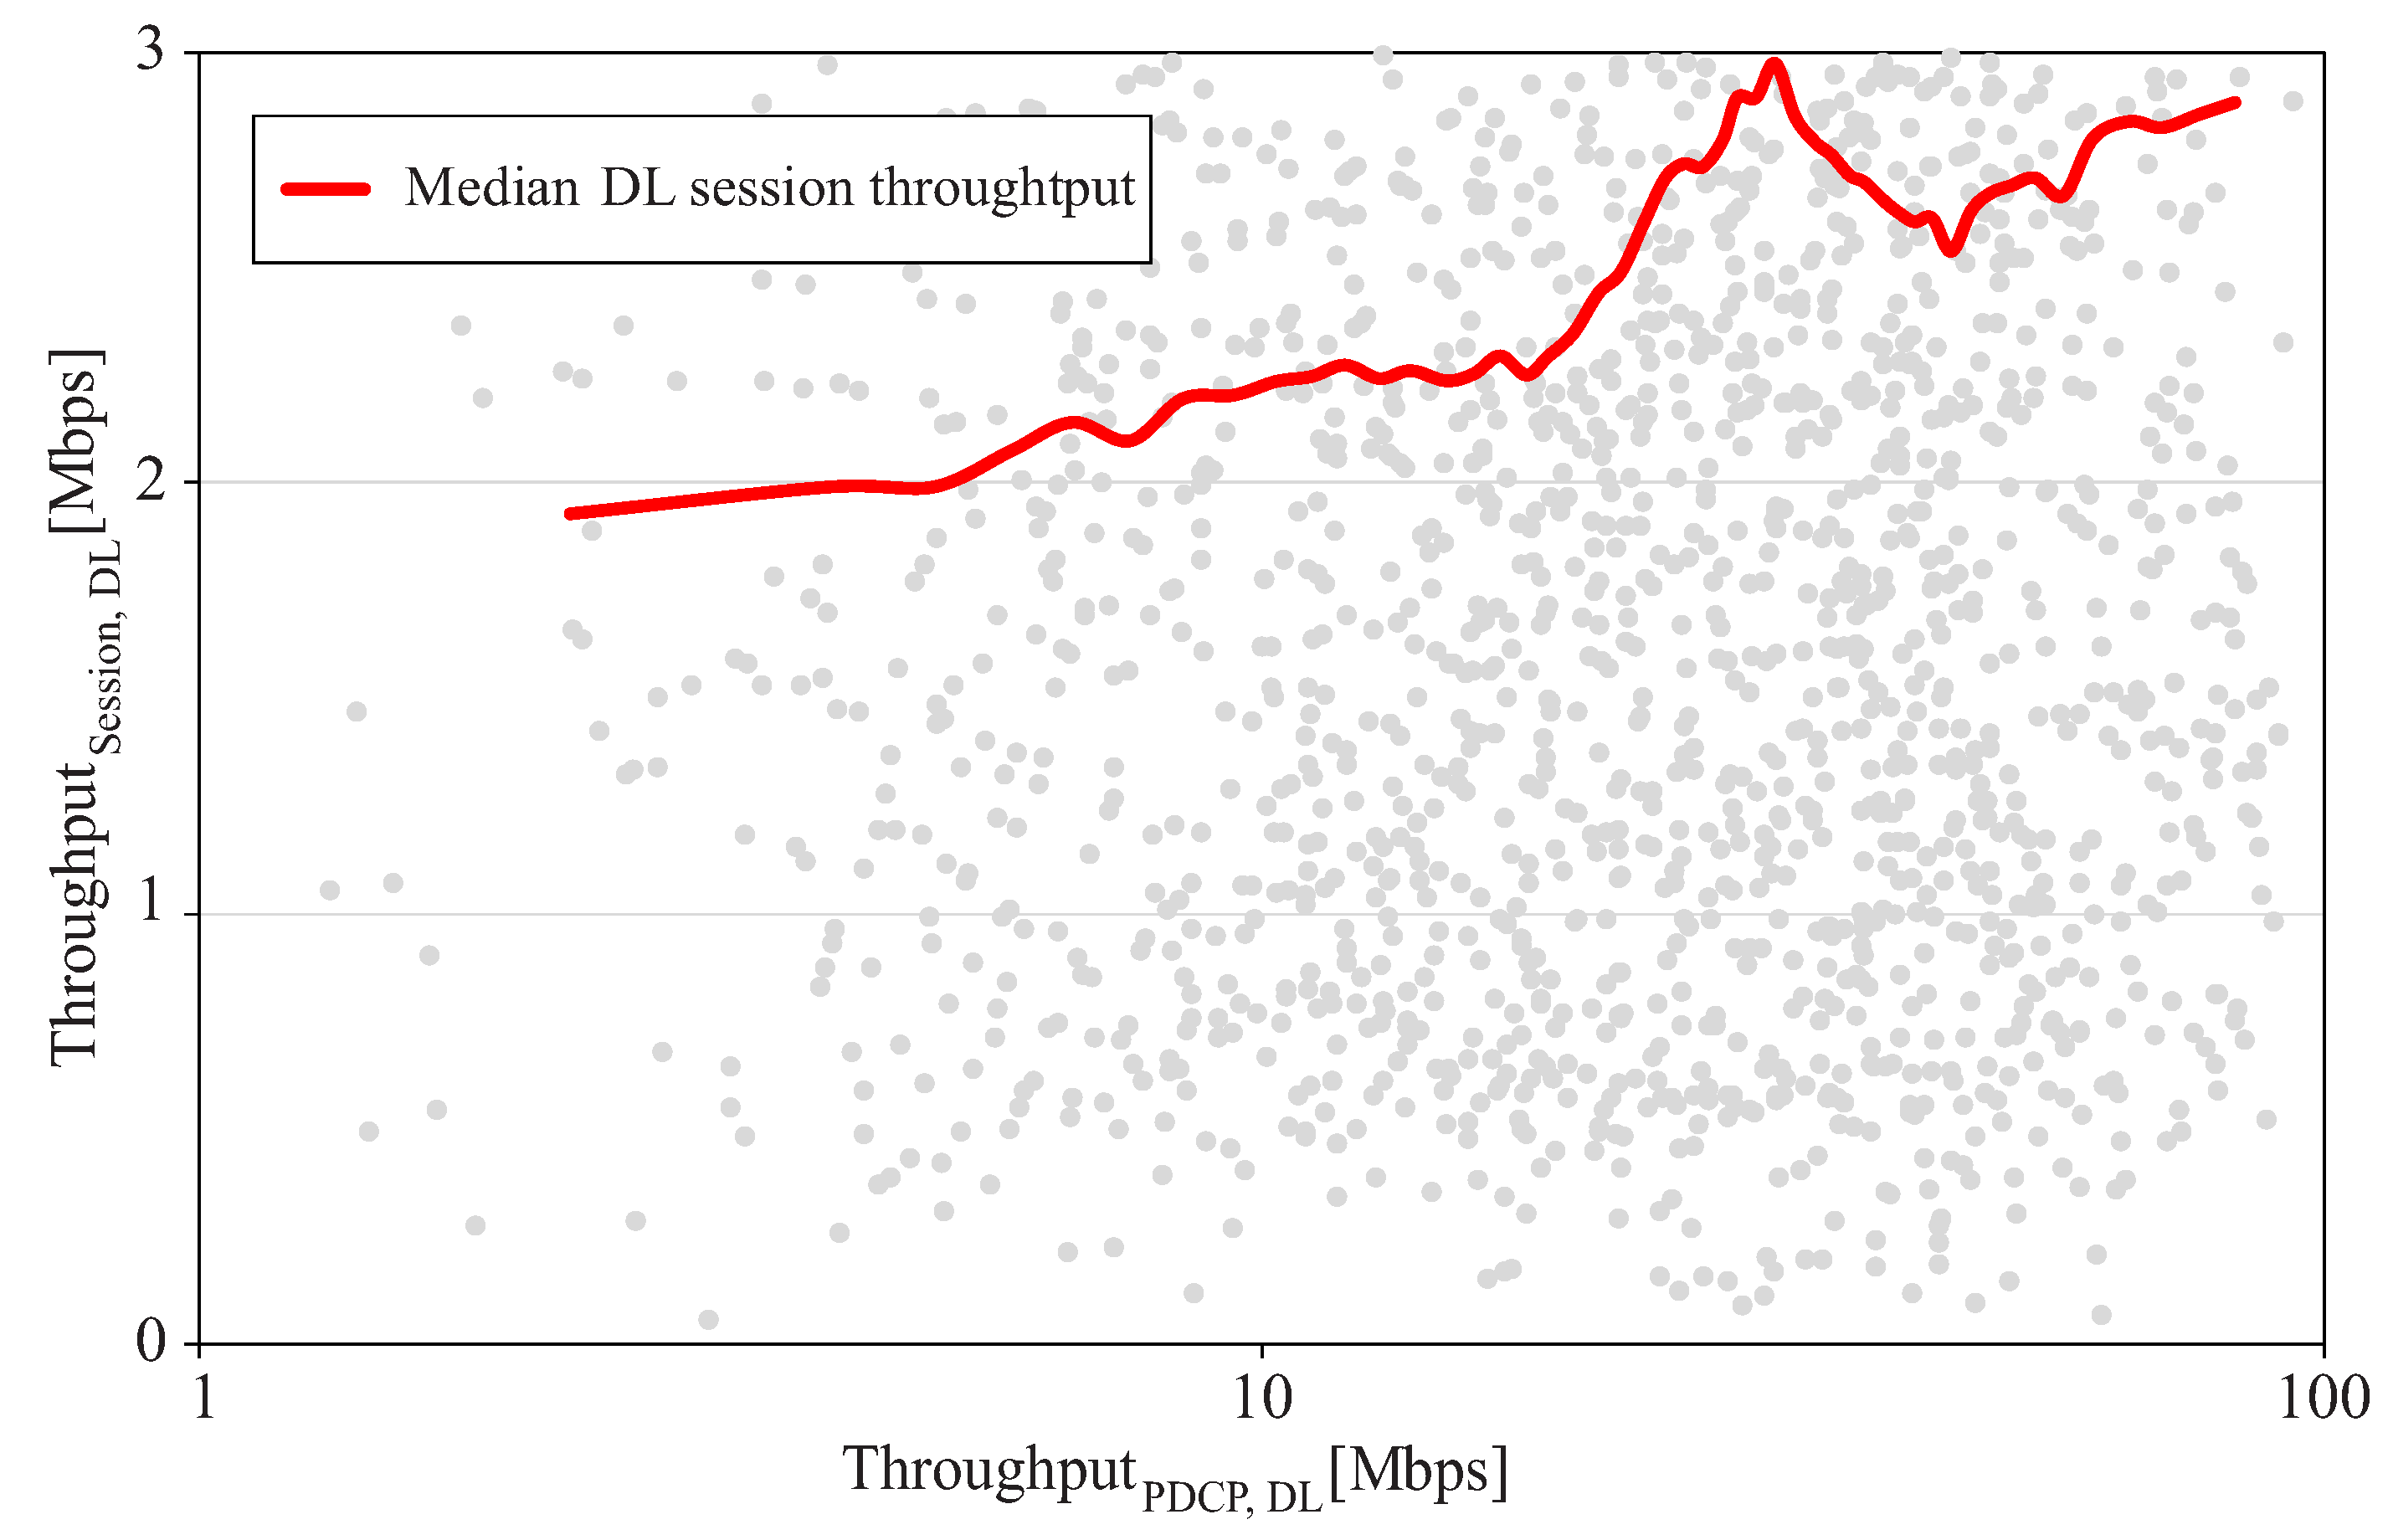
Figure 3 shows the analysis pf streaming services. Each point in the figure represents a connection identified as a streaming service. The solid line represents the median DL session throughput, T H s e s s i o n , D L m e d i a n ( s t r ) . Results show that T H s e s s i o n , D L ( s t r ) presents a trend close to the expected behavior in Figure 1b. Thus, the minimum QoE threshold for this service can be set as the T H P D C P , D L ( s t r ) value such that T H s e s s i o n , D L reaches its peak; i.e., T H P D C P , D L , m i n ( s t r ) = 30 Mbps.
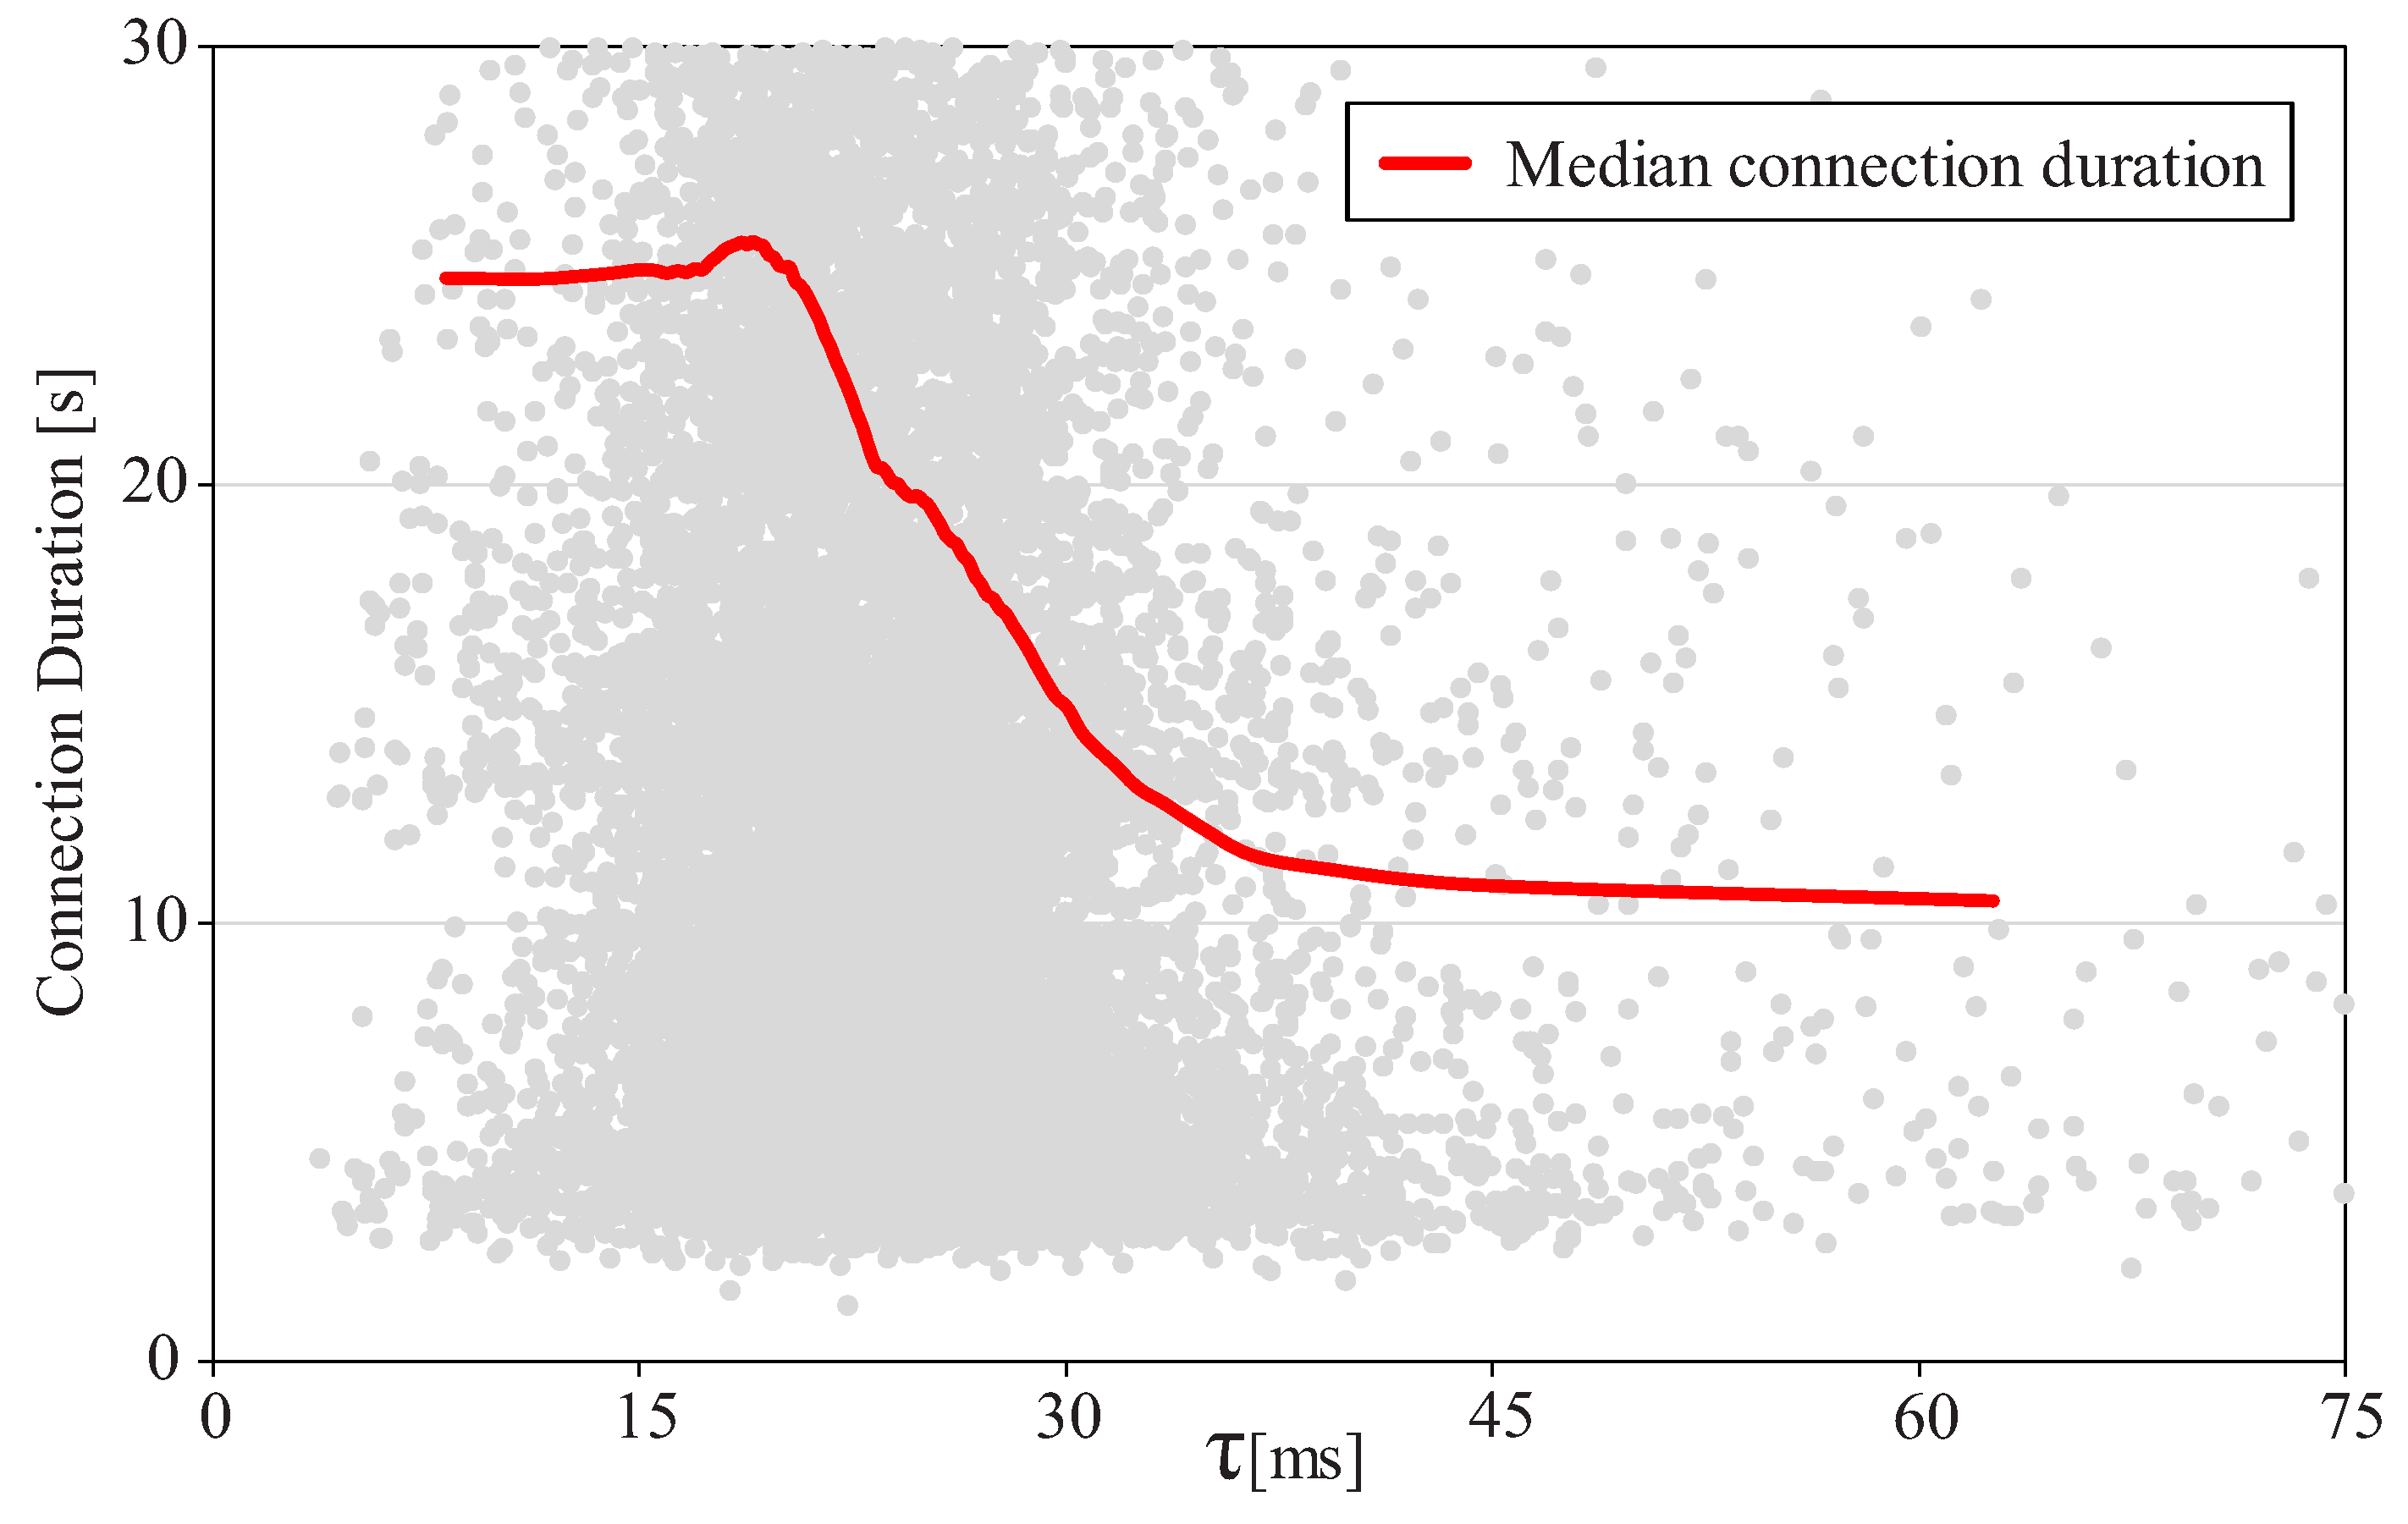
Figure 4 shows the analysis of VoLTE. Each point in the figure represents a VoLTE connection. The solid line representing C D m e d i a n ( v ) confirms the impact of users anticipated in Figure 1c. From the figure, it is inferred that the maximum DL packet delay threshold is τ m a x ( v ) = 20 ms.
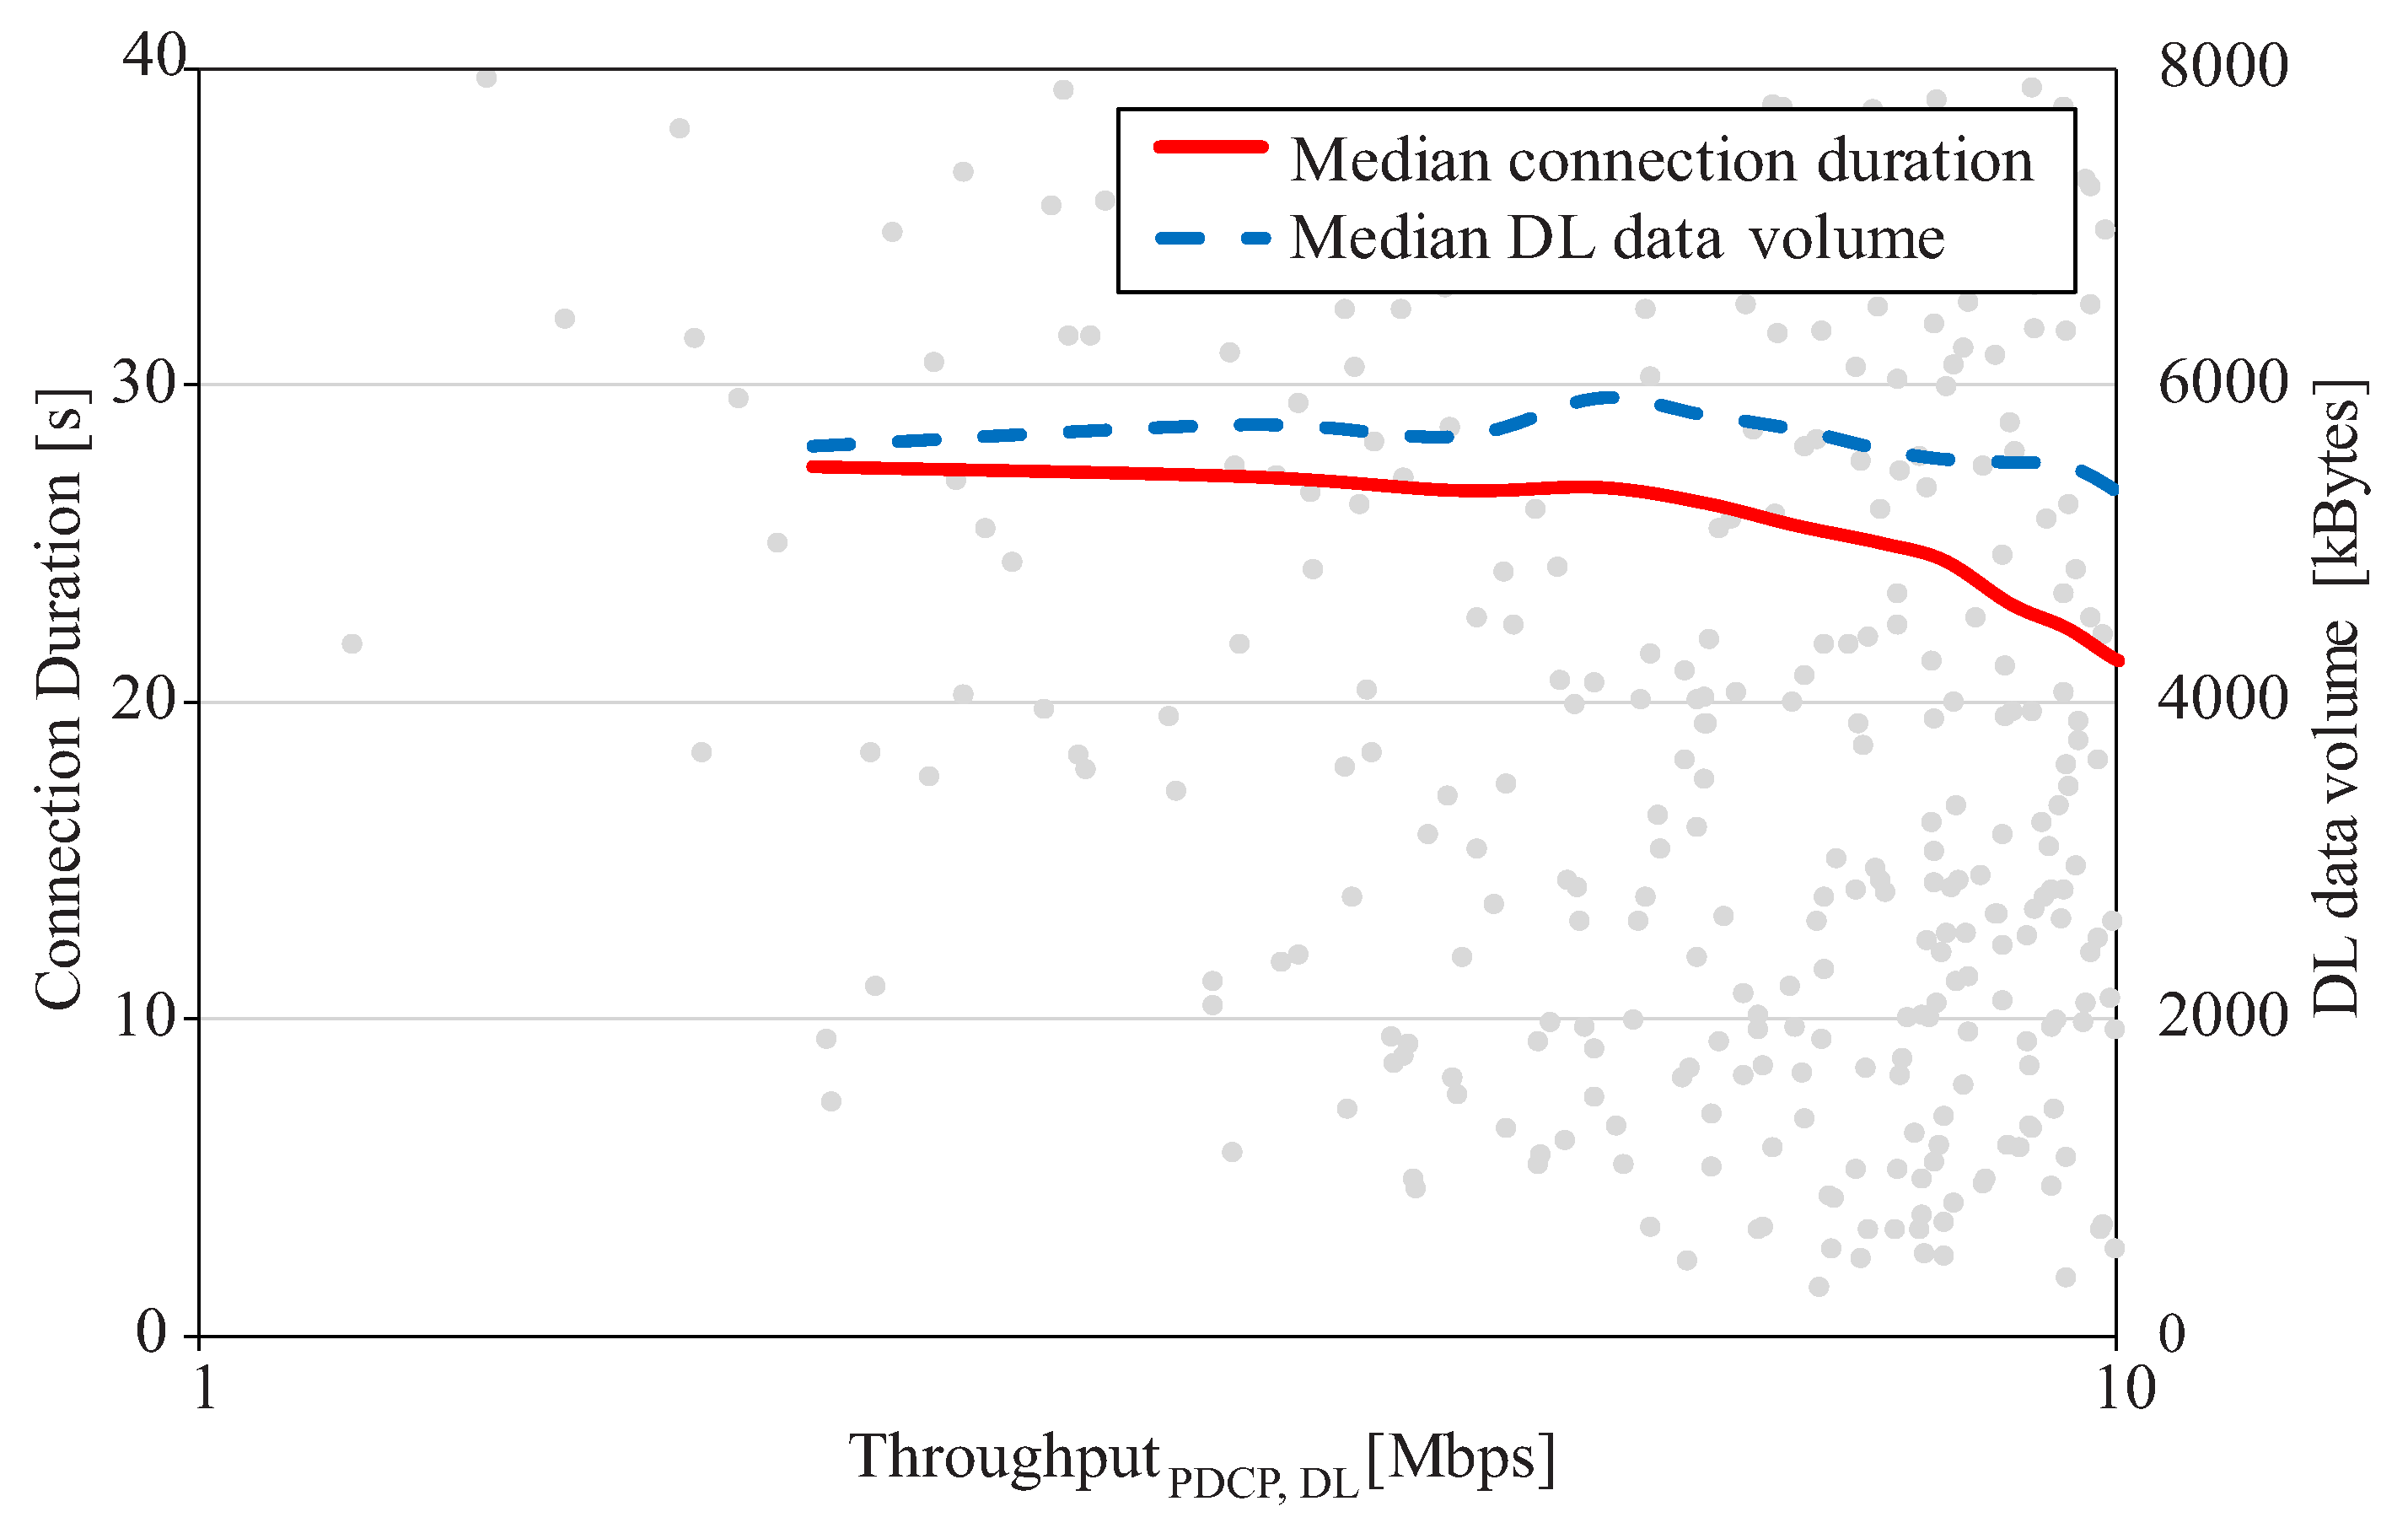
Figure 5 shows the analysis of web browsing for webs with large objects. Each point in the figure represents a connection labeled as web browsing with this feature. The solid line represents C D m e d i a n ( w l ) , and the dashed line represents V D L m e d i a n ( w l ) . A priori, user behavior for these services should be close to that in full-buffer services. However, the DL data volume seems not to be greatly affected by changes in DL PDCP throughput. This is due to the fact that web sessions manage a lower amount of data for each connection than full-buffer data services and thus the link performance must be much worse for the user to notice this degradation. Based on the available data, a minimum QoS value for this service cannot be obtained.
Finally, Figure 6 shows the analysis of web browsing with small objects and social networks. Each point in the figure represents a connection identified as these services. The solid line represents C D m e d i a n ( w s ) and the dashed line represents V D L m e d i a n ( w s ) . It is observed that C D m e d i a n ( w s ) and V D L m e d i a n ( w s ) do not show changes regardless of throughput values. This is due to the fact that these services manage a very small amount of data for each connection. As a consequence, user satisfaction relies more on successful data transactions rather than on the connection duration. Thus, only extremely bad link conditions would impact C D . Thus, T H P D C P , D L , m i n ( w s ) cannot be estimated.

5.3. Implementation Issues

The method is designed as a centralized scheme that can be integrated into OSS platforms. Due to its simplicity, its computational load is relatively low. The theoretical time complexity increases linearly with the number of analyzed connection traces. In practice, the most time-consuming process is trace pre-processing, which can be done by trace processing tools provided by OSS vendors and the classification process, which is performed by using an unsupervised algorithm and can be implemented, along with the rest of the method, in any programming language (in this work, Matlab [42]). Specifically, the total execution time for the considered datasets in a 2.6-GHz quad-core processor laptop is less than 5462 s (92 s per 1000 connections).

6. Conclusions

In this paper, a novel automatic method for estimating QoS thresholds to be integrated in user utility functions on a per-service basis in an LTE system is proposed. The method relies on the collection of radio connection traces. In the first stage, connection traces are classified into application groups based on QCI and traffic descriptors registered per connection. Then, a minimum QoS threshold is inferred on a per-service basis by analyzing the QoS indicator with the largest impact on user experience and the traffic indicator that best reflects user behavior. The method has been tested with traces taken from live LTE networks, resulting in a minimum DL user throughput of 5 Mbps for full-buffer data services, 30 Mbps for streaming services and a maximum DL packet delay of 20 ms for VoIP services. The proposed data-driven method can be fully automated, eliminating the need for time-consuming subjective tests. Likewise, it can deal with the large diversity of system and human factors, which cannot be taken into account in lab environments. Due to its low computational load, it can be executed periodically to track changes in user trends. Additional analysis can be extended to 5G and broadband Internet satellite systems to check the impact of network capabilities on general user behavior.

Author Contributions

The contributions of authors are as follows: Conceptualization, A.J.G., M.T. and S.L.-R.; methodology, A.J.G. and M.T.; software, A.J.G. and M.T.; validation, A.J.G. and M.T.; formal analysis, A.J.G.; investigation, A.J.G. and M.T.; resources, M.T. and S.L.-R.; data curation, A.J.G. and C.G.; writing—original draft preparation, A.J.G.; writing—review and editing, M.T. and S.L.-R.; visualization, A.J.G.; supervision, M.T. and S.L.-R.; project administration, M.T. and S.L.-R.; funding acquisition, M.T. All authors have read and agreed to the published version of the manuscript.

Funding

This work has been funded by the Spanish Ministry of Science, Innovation and Universities (RTI2018-099148-BI00), the Junta de Andalucía (UMA18-FEDERJA256) and Ericsson Spain.

Data Availability Statement

Restrictions apply to the availability of these data. Data were obtained from Ericsson Spain and are available from A.J.G. with the permission of Ericsson Spain.

Conflicts of Interest

The authors declare no conflict of interest.

Abbreviations

The following abbreviations are used in this manuscript:
BDABig Data Analytics
CDRCharge Data Record
CEMCustomer Experience Management
CMConfiguration Management
CRMCustomer Relationship Management
CTFConfiguration Trace File
CTRCell Traffic Recording
DLDownlink
DTFData Trace File
eNBevolved Nodes B
IMSIInternational Mobile Subscriber Identity
IoTInternet of Things
KPIKey Performance Indicator
LTELong Term Evolution
MACMedium Access Control
MLMachine Learning
MOSMean Opinion Score
PMPerformance Management
OSSOperations Support System
PDCPPacket Data Control Protocol
QCIQoS Class Identifier
QoEQuality of Experience
QoSQuality of Service
RLCRadio Link Control
ROPReporting Output Period
RRCRadio Resource Control
TTITransmission Time Interval
UEUser Equipment
UETRUser Equipment Traffic Recording
ULUplink
VoIPVoice over IP
VoLTEVoice over LTE

References

  1. Cisco Systems Inc. Cisco Visual Networking Index: Global Mobile Data Traffic Forecast Update, 2017–2022. Available online: https://s3.amazonaws.com/media.mediapost.com/uploads/CiscoForecast.pdf (accessed on 29 March 2021).
  2. Hossain, E.; Hasan, M. 5G cellular: Key enabling technologies and research challenges. IEEE Instrum. Meas. Mag. 2015, 18, 11–21. [Google Scholar] [CrossRef] [Green Version]
  3. Sesia, S.; Toufik, I.; Baker, M. LTE-the UMTS Long Term Evolution: From Theory to Practice; John Wiley & Sons: Hoboken, NJ, USA, 2011. [Google Scholar]
  4. Liotou, E.; Tsolkas, D.; Passas, N.; Merakos, L. Quality of experience management in mobile cellular networks: Key issues and design challenges. IEEE Commun. Mag. 2015, 53, 145–153. [Google Scholar] [CrossRef]
  5. Gupta, A.; Jha, R.K. A survey of 5G network: Architecture and emerging technologies. IEEE Access 2015, 3, 1206–1232. [Google Scholar] [CrossRef]
  6. Imran, A.; Zoha, A.; Abu-Dayya, A. Challenges in 5G: How to empower SON with big data for enabling 5G. IEEE Netw. 2014, 28, 27–33. [Google Scholar] [CrossRef]
  7. Banerjee, A. Revolutionizing CEM with Subscriber-Centric Network Operations and QoE Strategy. Available online: http://www.accantosystems.com/wp-content/uploads/2016/10/Heavy-Reading-Accanto-Final-Aug-2014.pdf (accessed on 29 March 2021).
  8. Baraković, S.; Skorin-Kapov, L. Survey and challenges of QoE management issues in wireless networks. J. Comput. Netw. Commun. 2013, 2013, 165146. [Google Scholar] [CrossRef] [Green Version]
  9. Jin, H.; Su, L.; Chen, D.; Nahrstedt, K.; Xu, J. Quality of information aware incentive mechanisms for mobile crowd sensing systems. In MobiHoc’15, Proceedings of the 16th ACM International Symposium on Mobile Ad Hoc Networking and Computing, Hangzhou, China, 22–25 June 2015; Association for Computing Machinery: New York, NY, USA, 2015. [Google Scholar]
  10. Collange, D.; Costeux, J.L. Passive Estimation of Quality of Experience. J. UCS 2008, 14, 625–641. [Google Scholar]
  11. Brunnström, K.; Beker, S.A.; De Moor, K.; Dooms, A.; Egger, S.; Garcia, M.N.; Hossfeld, T.; Jumisko-Pyykkö, S.; Keimel, C.; Larabi, M.C.; et al. Qualinet White Paper on Definitions of Quality of Experience. Available online: https://hal.archives-ouvertes.fr/hal-00977812 (accessed on 29 March 2021).
  12. Li, Y.; Kim, K.H.; Vlachou, C.; Xie, J. Bridging the data charging gap in the cellular edge. In SIGCOMM’19, Proceedings of the ACM Special Interest Group on Data Communication, Beijing, China, 19–23 August, 2019; Association for Computing Machinery: New York, NY, USA, 2019. [Google Scholar]
  13. Wang, J.; Zheng, Y.; Ni, Y.; Xu, C.; Qian, F.; Li, W.; Jiang, W.; Cheng, Y.; Cheng, Z.; Li, Y.; et al. An active-passive measurement study of tcp performance over lte on high-speed rails. In Proceedings of the 25th Annual International Conference on Mobile Computing and Networking, Los Cabos, Mexico, 21–25 October 2019; pp. 1–16. [Google Scholar]
  14. Hori, T.; Ohtsuki, T. QoE and throughput aware radio resource allocation algorithm in LTE network with users using different applications. In Proceedings of the 2016 IEEE 27th Annual International Symposium on Personal, Indoor, and Mobile Radio Communications (PIMRC), Valencia, Spain, 4–8 September 2016; pp. 1–6. [Google Scholar]
  15. Reichl, P.; Tuffin, B.; Schatz, R. Logarithmic laws in service quality perception: Where microeconomics meets psychophysics and quality of experience. Telecommun. Syst. 2013, 52, 587–600. [Google Scholar] [CrossRef]
  16. Fiedler, M.; Hossfeld, T.; Tran-Gia, P. A generic quantitative relationship between quality of experience and quality of service. IEEE Netw. 2010, 24, 36–41. [Google Scholar] [CrossRef] [Green Version]
  17. Casas, P.; Seufert, M.; Schatz, R. YOUQMON: A system for on-line monitoring of YouTube QoE in operational 3G networks. ACM Sigmetrics Perform. Eval. Rev. 2013, 41, 44–46. [Google Scholar] [CrossRef]
  18. Baer, A.; Casas, P.; D’Alconzo, A.; Fiadino, P.; Golab, L.; Mellia, M.; Schikuta, E. DBStream: A holistic approach to large-scale network traffic monitoring and analysis. Comput. Netw. 2016, 107, 5–19. [Google Scholar] [CrossRef]
  19. Skorin-Kapov, L.; Varela, M.; Hoßfeld, T.; Chen, K.T. A survey of emerging concepts and challenges for QoE management of multimedia services. ACM Trans. Multimed. Comput. Commun. Appl. (TOMM) 2018, 14, 1–29. [Google Scholar] [CrossRef]
  20. Oliver-Balsalobre, P.; Toril, M.; Luna-Ramírez, S.; Avilés, J.M.R. Self-tuning of scheduling parameters for balancing the quality of experience among services in LTE. EURASIP J. Wirel. Commun. Netw. 2016, 2016, 1–12. [Google Scholar] [CrossRef] [Green Version]
  21. Baldo, N.; Giupponi, L.; Mangues-Bafalluy, J. Big data empowered self organized networks. In Proceedings of the European Wireless 2014: 20th European Wireless Conference, Barcelona, Spain, 14–16 May 2014; pp. 1–8. [Google Scholar]
  22. Witten, I.H.; Frank, E.; Mark, A.; Hall, M.A. Data Mining: Practical machine learning tools and techniques. Morgan Kaufmann Burlingt. MA 2011, 10, 1972514. [Google Scholar]
  23. Nokia Siemens Networks. Quality of Experience (QoE) of Mobile Services: Can It be Measured and Improved. Available online: https://docplayer.net/25986899-White-paper-quality-of-experience-qoe-of-mobile-services-can-it-be-measured-and-improved.html (accessed on 29 March 2021).
  24. Fiedler, M.; Chevul, S.; Radtke, O.; Tutschku, K.; Binzenhöfer, A. The network utility function: A practicable concept for assessing network impact on distributed services. In Proceedings of the 19th International Teletraffic Congress (ITC19), Beijing, China, 29 August–2 September 2005. [Google Scholar]
  25. Navarro-Ortiz, J.; Lopez-Soler, J.M.; Stea, G. Quality of experience based resource sharing in IEEE 802.11 e HCCA. In Proceedings of the 2010 European Wireless Conference (EW), Lucca, Italy, 12–15 April 2010; pp. 454–461. [Google Scholar]
  26. 3GPP. TS25.331, Technical Specification Group Radio Access Network; Radio Resource Control (RRC); Protocol specification; V11.4.0, Rel-11. Available online: https://portal.3gpp.org/desktopmodules/Specifications/SpecificationDetails.aspx?specificationId=1180 (accessed on 29 March 2021).
  27. 3GPP. TS36.413, Technical Specification Group Radio Access Network; Evolved Universal Terrestrial Radio Access Network (E-UTRAN); S1 Application Protocol (S1AP); V8.4.0, Rel-8. Available online: https://portal.3gpp.org/desktopmodules/Specifications/SpecificationDetails.aspx?specificationId=2446 (accessed on 29 March 2021).
  28. 3GPP. TS36.423, Technical Specification Group Radio Access Network; Evolved Universal Terrestrial Radio Access Network (E-UTRAN); X2 Application Protocol (X2AP); V9.2.0, Rel-9. Available online: https://portal.3gpp.org/desktopmodules/Specifications/SpecificationDetails.aspx?specificationId=2452 (accessed on 29 March 2021).
  29. 3GPP. TS32.423, Digital Cellular telecommunications system (Phase 2+); Universal Mobile Telecommunications System (UMTS); LTE; Telecommunication Management; Subscriber and Equipment Trace; Trace Data Definition and Management; V10.5.0, Rel-10. Available online: https://portal.3gpp.org/desktopmodules/Specifications/SpecificationDetails.aspx?specificationId=2010 (accessed on 29 March 2021).
  30. 3GPP. TS32.421, Telecommunication Management; Subscriber and Equipment Trace; Trace Concepts and Requirements; V6.7.0, Rel-6. Available online: https://portal.3gpp.org/desktopmodules/Specifications/SpecificationDetails.aspx?specificationId=2008 (accessed on 29 March 2021).
  31. Sánchez, P.A.; Luna-Ramírez, S.; Toril, M.; Gijón, C.; Bejarano-Luque, J.L. A data-driven scheduler performance model for QoE assessment in a LTE radio network planning tool. Comput. Netw. 2020, 173, 107186. [Google Scholar] [CrossRef]
  32. Ekstrom, H. QoS control in the 3GPP evolved packet system. IEEE Commun. Mag. 2009, 47, 76–83. [Google Scholar] [CrossRef]
  33. 3GPP. TS23.203, Technical Specification Group Services and System Aspects; Policy and Charging Control Architecture; V13.7.0, Rel-13. Available online: https://portal.3gpp.org/desktopmodules/Specifications/SpecificationDetails.aspx?specificationId=810 (accessed on 29 March 2021).
  34. Palmieri, F.; Fiore, U. A nonlinear, recurrence-based approach to traffic classification. Comput. Netw. 2009, 53, 761–773. [Google Scholar] [CrossRef]
  35. Nguyen, T.T.; Armitage, G. A survey of techniques for internet traffic classification using machine learning. IEEE Commun. Surv. Tutorials 2008, 10, 56–76. [Google Scholar] [CrossRef]
  36. García, A.J.; Toril, M.; Oliver, P.; Luna-Ramírez, S.; García, R. Big data analytics for automated QoE management in mobile networks. IEEE Commun. Mag. 2019, 57, 91–97. [Google Scholar] [CrossRef]
  37. Taylor, V.F.; Spolaor, R.; Conti, M.; Martinovic, I. Appscanner: Automatic fingerprinting of smartphone apps from encrypted network traffic. In Proceedings of the 2016 IEEE European Symposium on Security and Privacy (EuroS&P), Saarbruecken, Germany, 21–24 March 2016; pp. 439–454. [Google Scholar]
  38. Gijón, C.; Toril, M.; Solera, M.; Luna-Ramírez, S.; Jiménez, L.R. Encrypted Traffic Classification Based on Unsupervised Learning in Cellular Radio Access Networks. IEEE Access 2020, 8, 167252–167263. [Google Scholar] [CrossRef]
  39. Jiménez, L.R. Web Page Classification based on Unsupervised Learning using MIME type Analysis. In Proceedings of the 2021 International Conference on COMmunication Systems & NETworkS (COMSNETS), Bangalore, India, 5–9 January 2021; pp. 375–377. [Google Scholar]
  40. Jiménez, L.R.; Solera, M.; Toril, M. A network-layer QoE model for YouTube live in wireless networks. IEEE Access 2019, 7, 70237–70252. [Google Scholar] [CrossRef]
  41. Na, S.; Yoo, S. Allowable propagation delay for VoIP calls of acceptable quality. In International Workshop on Advanced Internet Services and Applications; Springer: Berlin/Heidelberg, Germany, 2002; pp. 47–55. [Google Scholar]
  42. MathWorks. Matlab. Available online: https://www.mathworks.com/products/matlab.html (accessed on 10 November 2020).
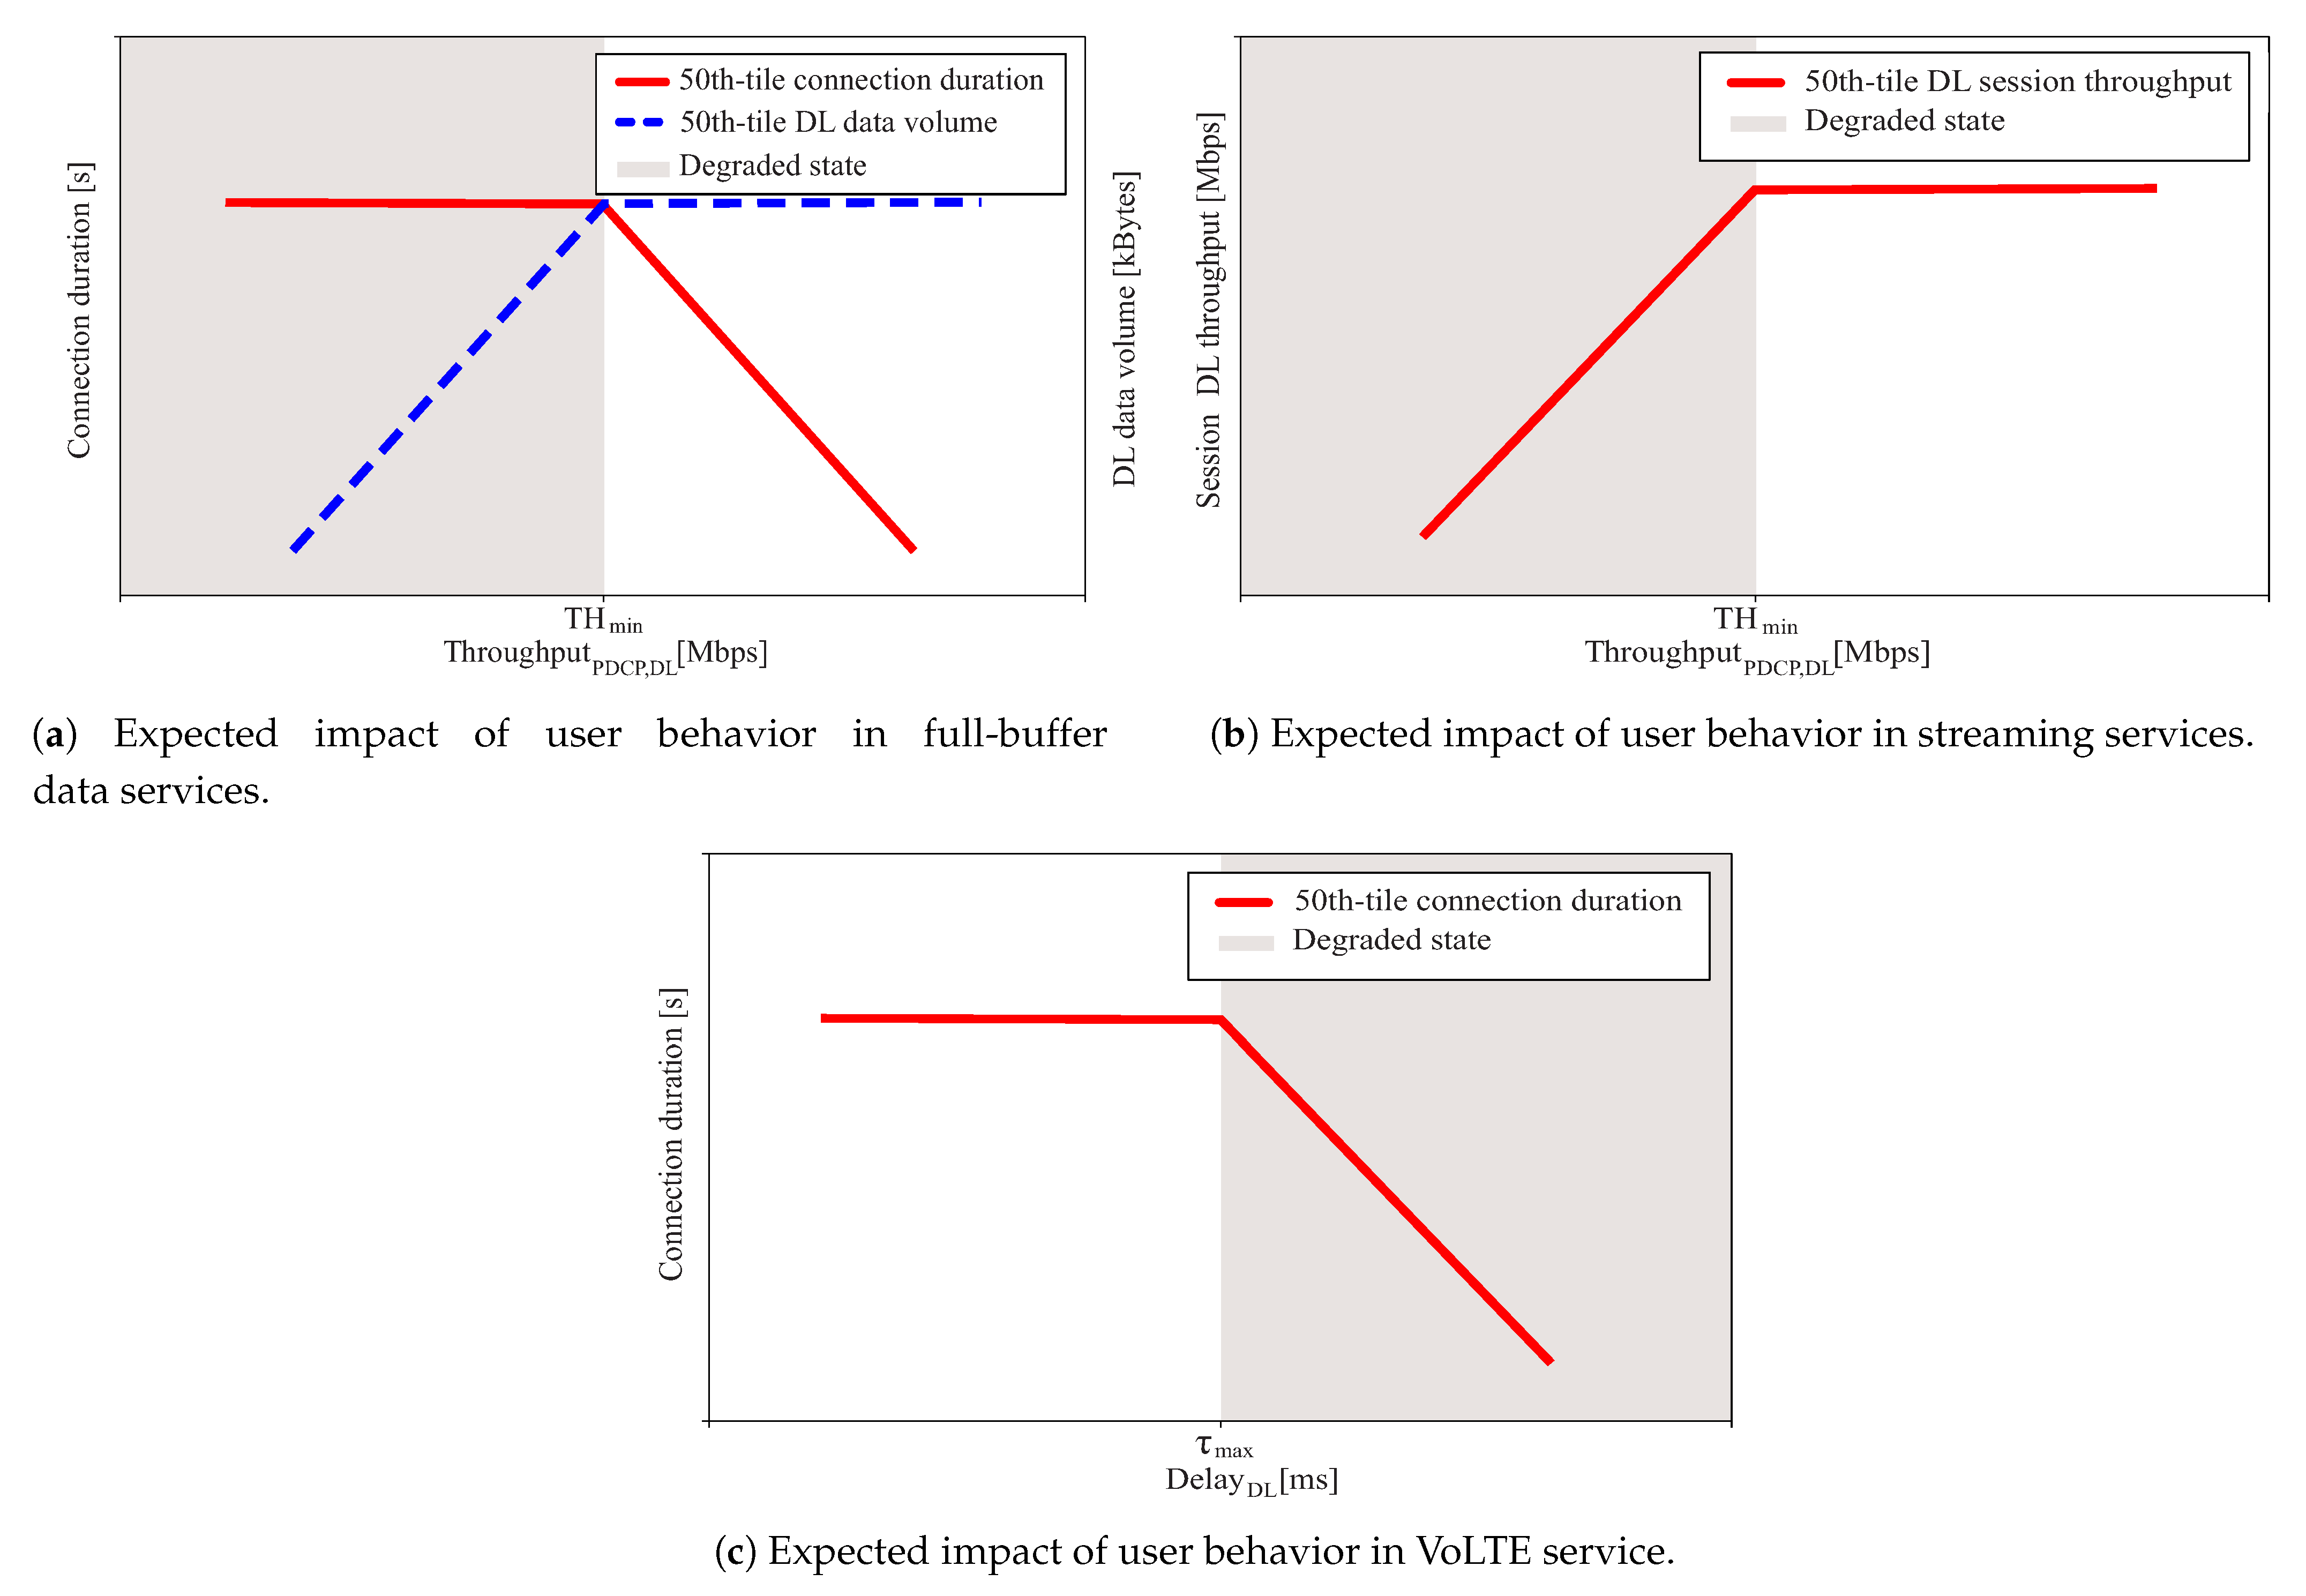
Figure 1. Expected impact of user behavior for broad service classes.
Electronics 10 00829 g001
Figure 2. Quality of Service (QoS) and traffic indicators for full-buffer data services.
Electronics 10 00829 g002
Figure 3. QoS and traffic indicators for streaming services.
Electronics 10 00829 g003
Figure 4. QoS and traffic indicators for a Voice over LTE (VoLTE) service.
Electronics 10 00829 g004
Figure 5. QoS and traffic indicators for a web browsing service (large objects).
Electronics 10 00829 g005
Figure 6. QoS and traffic indicators for social networks and web browsing services (small objects).
Electronics 10 00829 g006
Publisher’s Note: MDPI stays neutral with regard to jurisdictional claims in published maps and institutional affiliations.