Article

Improved YOLOv3 Network for Insulator Detection in Aerial Images with Diverse Background Interference

1
College of Electronic and Information Engineering, Nanjing University of Aeronautics and Astronautics, Nanjing 211106, China
2
College of Mechanical and Electrical Engineering, Chizhou University, Chizhou 247000, China
*
Authors to whom correspondence should be addressed.
Electronics 2021, 10(7), 771; https://doi.org/10.3390/electronics10070771
Submission received: 28 February 2021 / Revised: 21 March 2021 / Accepted: 22 March 2021 / Published: 24 March 2021
(This article belongs to the Section Artificial Intelligence)

Abstract

:
Automatic inspection of insulators from high-voltage transmission lines is of paramount importance to the safety and reliable operation of the power grid. Due to different size insulators and the complex background of aerial images, it is a difficult task to recognize insulators in aerial views. Most of the traditional image processing methods and machine learning methods cannot achieve sufficient performance for insulator detection when diverse background interference is present. In this study, a deep learning method—based on You Only Look Once (YOLO)—will be proposed, capable of detecting insulators from aerial images with complex backgrounds. Firstly, aerial images with common aerial scenes were collected by Unmanned Aerial Vehicle (UAV), and a novel insulator dataset was constructed. Secondly, to enhance feature reuse and propagation, on the basis of YOLOv3 and Dense-Blocks, the YOLOv3-dense network was utilized for insulator detection. To improve detection accuracy for different sized insulators, a structure of multiscale feature fusion was adapted to the YOLOv3-dense network. To obtain abundant semantic information of upper and lower layers, multilevel feature mapping modules were employed across the YOLOv3-dense network. Finally, the YOLOv3-dense network and compared networks were trained and tested on the testing set. The average precision of YOLOv3-dense, YOLOv3, and YOLOv2 were 94.47%, 90.31%, and 83.43%, respectively. Experimental results and analysis validate the claim that the proposed YOLOv3-dense network achieves good performance in the detection of different size insulators amid diverse background interference.

1. Introduction

With the development of computer vision techniques and intelligent grids, the scale of high-voltage transmission lines is increasing. Regular inspection of transmission lines is becoming an important task to ensure the safety and reliable operation of power systems. Specifically, insulators are an indispensable, essential piece of equipment in transmission lines, which play an important role in electrical insulation and mechanical support [1,2]. However, insulators are usually outdoors and subjected to harsh weather conditions. Insulator failure is likely to threaten the safety of the power system, resulting in large-scale blackouts and huge economic losses. Consequently, insulator detection based on computer vision is of great practical significance [3]. Over the past few years, the development of Unmanned Aerial Vehicle (UAV) and sensor techniques [4,5] has led to their exploitation as effective tools for transmission line inspection. Insulator detection by UAVs has become one of the primary research directions for intelligent grid systems [6]. Some scholars have engaged in research on insulator detection from aerial images, and many remarkable results have been achieved through image processing. Current methods for insulator detection can be divided into three categories: (1) traditional image processing methods, (2) machine learning methods, and (3) deep learning methods.
Based on traditional image processing methods, segmentation and feature extraction of aerial images have been explored as a way to recognize insulators within complex backgrounds. Generally, the features of insulators in aerial images include texture [7] shape [8] color [9], gradient [10], and edge [11], among others. Thus, edge detection, morphology, scale-invariant features [12], and wavelet transformations [13,14] are usually employed to extract features and separate insulators from complicated backgrounds. Mathematical models have been established to detect insulators, as well. However, aerial images often include diverse background interference, as shown in Figure 1.
Specifically, in the work of Wang et al. [15], color, shape, and texture features were combined to detect insulators in aerial images. Firstly, the parallel line features were adopted as prior knowledge in order to obtain a region of interest (ROI) for insulators. Secondly, the local binary pattern (LBP) was presented to extend candidate regions of insulators. Finally, the LBP and hue saturation value (HSV) histograms were employed to match insulators with the prior knowledge model. This method effectively reduced the impact of complex backgrounds on insulator detection. However, it required complicated computation and feature extraction. The method also struggled to deal with many kinds of complex scenes. Iruansi et al. [16] proposed an active counter model for segmenting and extracting insulators from ROI regions. Experimental results demonstrated that active contour models were more efficient and flexible than threshold segmentation and gradient algorithms. However, relevant features of insulators are changeable—due to different shooting angles and distances—which reduced the accuracy of insulator detection. In the work of [17], a method of orientation angle detection based on binary shape and prior knowledge was proposed to distinguish insulators from complex backgrounds. Multiple insulators could be detected in complex aerial images with different angles. However, the method required all possible angles of the insulators to be set in advance, and did not work well if the shape of insulator was unknown. Commonly, the color of insulators is quite different from their background interference, and the color histogram is considered an effective method to describe color features. In [18], hue saturation intensity (HIS) color space was adopted to segment glass insulators in aerial images based on a threshold segmentation algorithm. However, it struggled to segment insulators from complex backgrounds by the use of only one threshold. To solve this problem, Zhai et al. [19] proposed an insulator detection method based on the color and spatial morphology features in aerial images. Firstly, color models of insulators were constructed by setting corresponding thresholds for the red-gree-blue (RGB) color space. Secondly, ROIs for insulators were extracted by color and spatial features. Finally, mathematical morphologies were adopted to detect insulators. This method exhibited better robustness and real-time performance compared with other existing methods. However, it did not work well in complex scenes containing various types of background interference. Based on observation of traditional image processing methods, they rely on a variety of feature extraction algorithms and are quite sensitive to background interference. Meanwhile, in the actual detection environment, aerial images captured by UAV usually suffer from different shooting angles, shooting distances, and luminous conditions. Thus, it is impossible to design a model for detecting multiple insulators simultaneously.
Based on machine learning methods, Ada-Boost and Support Vector Machines (SVM) [20] are the most commonly used feature classifier algorithms for insulator detection. In [21], deep convolution feature maps were presented to detect insulators in infrared images, and the classification algorithm of SVM was adopted to achieve that goal. However, this method was easily affected by background interference in aerial images. In [22], background suppression was used to remove the redundant information before extracting insulators from cluttered backgrounds. However, it was difficult to train an SVM classifier with a single feature (which could not effectively detect insulators from complex scenes). In the work of [23], insulators in aerial images were accurately detected through the superposition of weak classifiers. The accuracy of their insulator segmentation and detection was improved to a certain extent, but it did not work well when the insulator was covered by a large area or suffered from complex background interference. To solve this problem, a structural model of insulators and the optimal entropy method of threshold segmentation were proposed in [24] for insulator detection. Firstly, the software of Sketch-Up was adopted to generate insulator simulation images. Next, an insulator training set was constructed. Then, the mathematical morphology algorithm was employed to segment insulators from complex backgrounds. Finally, the Ada-Boost classifier was introduced to detect insulators in aerial images amid cluttered backgrounds. However, the samples of insulators available for training were limited, resulting in the classifier algorithm being difficult to apply on a large scale. Compared with traditional image processing methods, the machine learning methods rely less on specific features in aerial images. However, the algorithms are complicated and require a large amount of calculation.
With recent advances in artificial intelligence and deep learning, many researchers have applied deep learning architectures to object detection, and these techniques have been variously applied [25,26,27,28]. Deep learning architectures make full use of convolution neural networks (CNNs) to automatically learn the depth feature of images layer-by-layer, and optimize the network model parameters by training large-scale data to improve detection accuracy. Recently, with the rapidly development of deep learning theories, more and more researchers have paid attention to deep CNNs, which show a strong advantage in feature extraction. Moreover, large-scale public datasets, high performance hardware processing systems, and deep CNNs have promoted object detection algorithms to a new level. The object detection algorithms based on deep CNNs are divided into single-stage models and two-stage models. Specifically, the single-stage models include single shot multibox detector (SSD) [29] and YOLO [30,31]. Regions with convolutional neural network (R-CNN) [32], fast R-CNN [33], and faster R-CNN [34] are two-stage models. The two-stage models exhibit high detection accuracy, but they are difficult to train and do not currently meet requirements for real-time application. Single-stage models can achieve real-time detection with some loss of accuracy compared to two-stage models. Because of this, they are more feasible for real-world application [35]. Meanwhile, the networks of YOLOv2 and YOLOv3—which are single-stage models—have been widely used for object detection [36,37,38,39,40,41]. Consequently, existing single-stage models can be adapted to detect insulators by transferring learning strategies. To improve the robustness and accuracy of insulator detection, multilevel perception methods were presented in [42]. The SSD model was adopted to train insulator detection models on multilevel training sets. Experimental results demonstrated that the proposed method met the requirement of off-line analysis for insulator detection. However, the samples used for training were limited, and the processing speed of a single image needed to be improved. In the work of [43], the YOLOv2 network was applied to transmission lines, inspecting systems for insulator detection. To solve the problem of lacking samples, several augmentation techniques were employed to avoid overfitting. It was demonstrated in the experimental results that the YOLOv2 network achieved a good detection performance (average prediction accuracy: 88%, average prediction time: 0.04 s). The YOLOv3 network was adopted as a deep-learning model for insulator locating in [44]. Experimental results validated the YOLOv3 model, which performed well on insulator detection. To detect remote sensing targets from complex backgrounds, Xu et al. [45] proposed a multiscale method based on improved YOLOv3 for remote sensing target detection. Experimental results demonstrated that the mean average precision of the proposed method was 10% higher than that of the original YOLOv3.
In summary, traditional image processing methods often rely on a certain feature. The applicability of the final algorithm needs to be further improved if image segmentation is insufficient. Machine learning is more complicated and difficult to implement, compared with deep learning methods. It can thus be concluded that using YOLO models can achieve insulator detection and potentially meet the requirements of actual real-world application. Nevertheless, there are still many difficulties in realizing this potentiality, e.g., different-sized insulators and the complex, ever-changing backgrounds of aerial images. As a feed-forward neural network, DenseNet makes better use of the extracted features, achieving feature reuse and preventing feature loss. Inspired by the work of [45], on the basis of YOLOv3 and DenseNet, this work proposed a network (YOLOv3-dense) to detect insulators in aerial images with complex backgrounds. To enhance feature propagation and reuse, Dense-Blocks are adopted to replace some residual units with lower resolution. To obtain different scales of insulator feature information, a structure of multiscale feature fusion was proposed for the YOLOv3-dense network. To improve the abundance of semantic information in upper and lower layers, multilevel feature mapping modules were employed to YOLO headers.
The rest of this study is organized as follows: (1) Section 1 reports the existing works of insulator detection. (2) Section 2 introduces the framework of YOLOv3. (3) Section 3 details the proposed network of YOLOv3-dense. (4) Section 4 gives experimental results and analysis. (5) Section 5 presents the conclusion of this study.

2. The Network of YOLOv3

YOLO is an end-to-end object detection algorithm based on deep CNNs, transforming object detection into a regression problem—which remarkably enhances the speed of object detection. Specifically, the input image is divided into S × S grids; the grid is responsible for detecting an object if the center of the object’s ground truth falls within its boundaries. Then, the object is predicted by a bounding box on each grid without a proposal region. The final coordinates of the bounding box and category probabilities are generated through regression algorithms. This is the reason why the detection speed of the YOLO algorithm is faster than two-stage models.
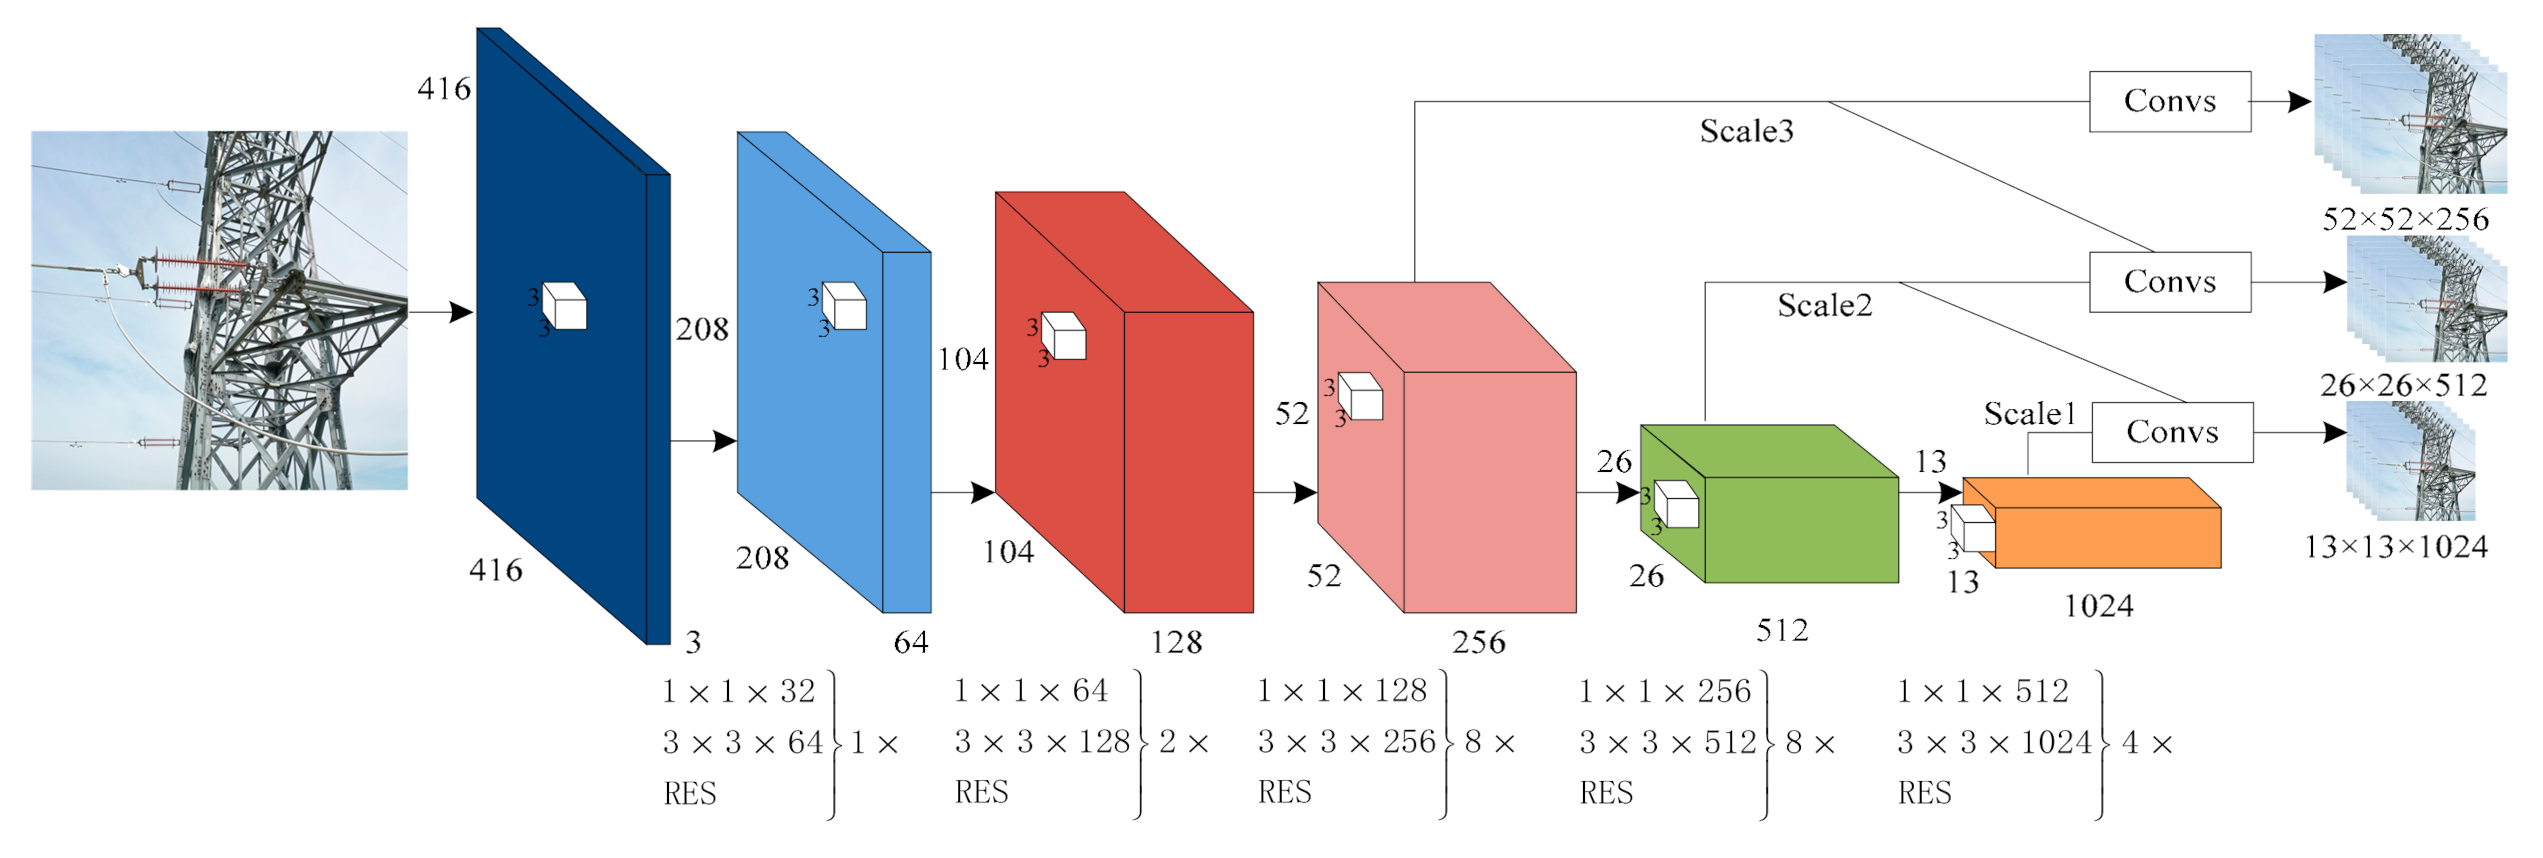
An object detection algorithm for YOLOv3 was proposed by Joseph Redmon in 2019. It evolved from YOLO and YOLOv2. The backbone of the YOLOv3 network is Darknet-53, which is a combination of the Darknet-19 and Res-net modules. The structure of the YOLOv3 network is shown in Figure 2. Specifically, Darknet-53 and multiscale fusion are adapted to the feature extraction network of YOLOv3. The width and height of images are cropped to a multiple of 32, and sized to 416 × 416 for normalization. Then, the cropped and resized image is sent to the Darknet-53 network for feature extraction and three different feature maps (sized 13 × 13, 26 × 26, and 52 × 52) are obtained. To better learn the features in the image, 26 × 26 feature maps are fused with 52 × 52 feature maps via upsampling. Using the same method, the 13 × 13 feature maps are fused with the 26 × 26 ones. Detection accuracy can be improved through multiscale fusion of the deep and shallow features. Finally, the detection results of the YOLOv3 network are predicted by three different scales, (scale 1, scale 2, and scale 3 are used to predict large objects, medium objects, and small objects, respectively).
The feature extraction network of YOLOv3 is shown in Table 1: five Res-net modules are adapted to the feature extraction network. Each Res-net module is composed of a Residual unit (which is mainly made up of 1 × 1 and 3 × 3 convolutional kernels) and a shortcut connection. There are 23 Residual units (1×, 2×, 8×, 8×, 4×, respectively) in the Darknet-53 network. It is possible for the output of the former layer to skip several layers (as the input of the later layers) by introducing Res-net modules.

3. Materials and Methods

Deep learning theory is an important part of computer vision, which has become a research hot spot in object detection technology. The traditional object detection algorithms have been gradually replaced by deep learning-based ones. More and more, deep learning algorithms have been adapted to object detection, and better results have been obtained.
With the deepening of the network, YOLOv3 failed to make full use of multilayer features, which led to the loss of insulator information in the transmission process. It was thus difficult to detect insulators accurately amid complex background interference. In order to enhance feature propagation and reuse, this paper proposes the YOLOv3-dense network, based on the YOLOv3 network. The entire structure of the YOLOv3-dense network is shown in Figure 3. It is composed of a feature extraction network, a feature pyramid network (FPN), feature mapping modules, and a detection network. To improve feature propagation and reuse of the feature extraction network, Dense-Blocks were adapted to replace some of the Residual units with lower resolutions. To obtain different scales of insulator feature information, a structure of multiscale feature fusion was proposed for the YOLOv3-dense network. To obtain abundant semantic information on upper and lower layers, multilevel feature mapping modules were employed for YOLO headers.

3.1. The Feature Extraction Network

During the training of the neural network, the feature maps were compressed by convolution and downsampling. The transmission of image feature maps can be weakened gradually with the deepening of network layers, resulting in the loss of feature information transmission. To solve this problem, the DenseNet [46,47,48] was introduced to reuse those features and prevent their loss, leading to improvements in network performance. In addition, the parameters of the training network could be reduced effectively and low-level features could be retained as long as possible. Consequently, the reuse and fusion of the multilevel features of the network can be further realized by the use of DenseNet. The structure of Dense-Blocks is shown in Figure 4. It can be seen that the input of H1 is X0, the input of H2 is X0, and X1, …, and the input of Ht is X0, X1, …, and X(t−1). This means that in the network, each layer’s input comes from the output of all the previous layers. The expression of Dense-Blocks is defined as follows:
X t = H t X 0 , X 1 , , X ( t 1 )
[X0, X1, …, X(t − 1)] are the spliced feature maps of layers X0, X1, …, and X(t − 1). H1, H2, …, and Ht are the spliced functions for feature maps. The function Hi (i = 1, 2, 3, 4) is composed of batch normalization (BN), rectified linear units (ReLU), and convolutional (Conv), commonly BN-ReLU-Conv (1 × 1) and BN-ReLU-Conv (3 × 3), which are employed in transfer function.
To improve feature propagation and facilitate reuse of the feature extraction network, Dense-Blocks were adopted to replace some Residual units with lower resolution. Three Dense-Blocks were adopted to the YOLOv3-dense network; the structure of Dense-Blk1, Dense-Blk2, and Dense-Blk3 are shown in Figure 4. Specifically, in the network architecture of Dense-Blk1 (Figure 4a), the output of the first layer X0 was 52 × 52 × 128. The output of the second layer X1 was 52 × 52 × 32 after BN-ReLU-Conv (1 × 1 × 32) and BN-ReLU-Conv (3 × 3 × 32) operations by function H1. The feature layers X0 and X1 were spliced into [X0, X1] (52 × 52 × 160) as the input of function H2. Moreover, the function H2 employed BN-ReLU-Conv (1 × 1 × 32) and BN-ReLU-Conv (3 × 3 × 32) operations on the feature maps [X0, X1], and the output of the third layer X2 (52 × 52 × 32) was obtained. The feature layers X0, X1, and X2 were spliced into [X0, X1, X2] (52 × 52 × 192) as the input of function H3. The function H3 employed BN-ReLU-Conv (1 × 1 × 32) and BN-ReLU-Conv (3 × 3 × 32) operations on the feature maps [X0, X1, X2], and the output of the forth layer X3 (52 × 52 × 32) was obtained. The feature layers X0, X1, X2, and X3 were spliced into [X0, X1, X2, X3] (52 × 52 × 224) as the input of function H4. Finally, the function H4 employed BN-ReLU-Conv (1 × 1 × 32) and BN-ReLU-Conv (3 × 3 × 32) operations on the feature maps [X0, X1, X2, X3], and the output of the fifth layer X4 (52 × 52 × 32) was obtained. The feature layers X0, X1, X2, X3, and X4 were spliced into [X0, X1, X2, X3, X4] (52 × 52 × 256) as the input of Res-net modules (52 × 52). Similarly, in the network architecture of Dense-Blk2 (Figure 4b), the output of first layer X0 was 26 × 26 × 256, and the output of layer X1, X2, X3, and X4 was 26 × 26 × 64. The transfer functions of H1, H2, H3, and H4 were BN-ReLU-Conv (1 × 1 × 64) and BN-ReLU-Conv (3 × 3 × 64), and the spliced feature maps of [X0, X1], [X0, X1, X2], [X0, X1, X2, X3], [X0, X1, X2, X3, X4] were 26 × 26 × 320, 26 × 26 × 384, 26 × 26 × 450, and 26 × 26 × 512, respectively. The final feature maps 26 × 26 × 512 were used as the input of Res-net modules (26 × 26). In the network architecture of Dense-Blk3 (Figure 4c), the output of the first layer X0 was 13 × 13 × 512, and the output of layer X1, X2, X3, and X4 was 13 × 13 × 128. The transfer functions of H1, H2, H3, and H4 were BN-ReLU-Conv (1 × 1 × 128) and BN-ReLU-Conv (3 × 3 × 128), and the spliced feature maps of [X0, X1], [X0, X1, X2], [X0, X1, X2, X3], [X0, X1, X2, X3, X4] were 13 × 13 × 640, 13 × 13 × 768, 13 × 13 × 896, and 13 × 13 × 1024, respectively. The final feature maps 13 × 13 × 1024 were used as the input of Res-net modules (13 × 13).
Dense-Blocks were adopted to the proposed network (YOLOv3-dense). The shallow-level features were able to be transmitted more swiftly and easily to high-level features via convolution layers, and multilayer feature reuse and fusion could then be realized. On the other hand, the information and gradient transfer efficiency of the whole network could be improved, which would be beneficial to the fusion of upsampling and shallow features for object detection.
The feature extraction network of YOLOv3-dense is shown in Table 2, which can be divided into six sections, as follows: (1) One convolutional layer was employed in the first section, and the size of the convolution kernel was 3 × 3 × 32. The output feature maps 416 × 416 × 32 were obtained after the convolution operation. (2) One Residual layer and three convolutional layers were employed in the second section, and the sizes of convolution kernels were 3 × 3/2 × 64, 1 × 1 × 32, and 3 × 3 × 64, respectively. The output feature maps 208 × 208 × 64 were obtained after the convolution operation. (3) Two Residual layers and five convolutional layers were employed in the third section, and the sizes of convolution kernels were 3 × 3/2 × 128, 1 × 1 × 64, and 3 × 3 × 128, respectively. The output feature maps 104 × 104 × 128 was obtained after the convolution operation. (4) 18 convolutional layers, 4 Residual layers, and 4 Dense layers were employed in the fourth section, and the sizes of convolution kernels were 3 × 3/2 × 256, 1 × 1 × 128, 1 × 1 × 32, 3 × 3 × 32, and 3 × 3 × 256, respectively. The output feature maps 52 × 52 × 256 were obtained after the convolution operation. (5) 17 convolutional layers, 4 Residual layers, and 4 Dense layers were employed in the fifth section, and the sizes of the convolution kernels were 3 × 3/2 × 256, 1 × 1 × 64, 3 × 3 × 64, 1 × 1 × 256, and 3 × 3 × 512, respectively. The output feature maps 26 × 26 × 512 were obtained after the convolution operation. (6) 17 convolutional layers, 4 Residual layers, and 4 Dense layers were employed in the sixth section, and the sizes of the convolution kernels were 3 × 3/2 × 512, 1 × 1 × 128, 3 × 3 × 128, 1 × 1 × 512, and 3 × 3 × 1024, respectively. The output feature maps 13 × 13 × 1024 were obtained after the convolution operation.

3.2. The Structure of Feature Pyramid Network

In YOLOv3-dense, the input size for aerial images was 416 × 416. The sizes of extracted feature maps for insulator detection were 52 × 52, 26 × 26, and 13 × 13, respectively. Note that the detail and location information of shallow-level feature layers is generally abundant; however, with the gradual deepening of feature layers, detail information decreased, while semantic information increased. Owing to different filming angles and filming distances, insulators exhibit different sizes in aerial images. It is difficult to recognize insulators using only high-level semantic information, because shallow-level feature maps may be ignored, leading to the loss of many details (e.g., the shape, color, and texture, etc. of the insulators). Inspired by the works [49,50,51], in order to obtain different scales of insulator feature information, a structure of multiscale feature fusion was proposed in this work, as shown in Figure 3. High-level feature maps were fused with shallow-level feature maps, and multiresolution feature maps were obtained for insulator prediction.
The structure of multi-scale feature fusion in this work was as follows: first, three-scale effective feature maps (52 × 52 × 256), (26 × 26 × 512), and (13 × 13 × 1024) were extracted by the network of YOLOv3-dense and recorded as large feature layer (LFL0), medium feature layer (MFL0), and small feature layer (SFL0), respectively. Secondly, the small feature layer (SFL0) was upsampled and then fused with the medium feature laayer (MFL0) to obtain a 26 × 26 medium feature layer (MFL1). That medium feature layer (MFL1) was upsampled and then fused with the large feature layer (LFL0) to obtain a 52 × 52 large feature layer (LFL1). That resultant large feature layer (LFL1) employed a feature mapping module to obtain another large feature layer (LFL2) for scale 52 × 52 prediction. Finally, the LFL2 was downsampled and then fused with the dense feature layer (DFL1) from the output of DenseBlk2 to obtain a 26 × 26 medium feature layer (MFL2). MFL2 employed a feature mapping module to obtain a medium feature layer (MFL3) for scale 26 × 26 prediction. Meanwhile, MFL3 was downspampled and then fused with dense feature layer 2 (DFL2) from the output of DenseBlk3 to obtain a 13 × 13 small feature layer (SFL1). SFL1 employed a feature mapping module to obtain small feature layer 2 (SFL2) for scale 13 × 13 prediction.
In this work, the final feature layers of three different scales (LFL2, MFL3, and SFL2) were obtained from the proposed structure of FPN. Through the feature fusion operation, the final feature layer for prediction had more semantic information and higher resolution, which made it more effective in predicting insulators of different scales. The detection accuracy of different size insulators could be improved by FPN.

3.3. The Feature Mapping Module

In the network of YOLOv3, five convolutional layers were employed in previous YOLO headers. To avoid gradient vanishing and enhance the semantic information of upper and lower layers, feature mapping modules were adopted to replace the five convolutional layers. Each feature mapping module contained two Residual units. The structures of feature mapping modules are shown in Table 3. The convolution operations 1×1 and 3×3 can obtain information about different receptive domains in aerial images, and the results of these convolution operations can be aggregated to obtain abundant semantic information. Multiscale feature mapping modules provide different receptive domains and abundant semantic information, which can be beneficial to insulator detection in aerial images with complex backgrounds.

4. Experiments Results and Discussion

The basic configuration of the PC used in this experiment was as follows: Intel(R) Core(TM) i9-9900 K (Intel, Santa Clara, CA, USA), 3.6 GHz primary frequency of CPU, 32 G of RAM, NVIDIA GeForce GTX 3080 (10 G) graphics card (Intel, Santa Clara, CA, USA), CUDA 11.1 and cuDNN 8.0.5 accelerated environments, with Visual Studio 2017 and Open CV 3.4.0 adopted as the visual studio framework. PC used the Windows 10 operating system from Microsfot, and the deep learning framework of the networks was Dark-net [52]. The experimental environment is shown in Table 4.

4.1. Dataset Preparation

Since there were not enough public datasets available for insulator detection, the images used in this experiment were all captured by UAV. Based on the work of [53], another 1400 aerial images of composite insulators were collected, and a novel dataset, CCIN_detection, (Chinese Composite INsulator) was constructed. CCIN_detection contained more common aerial scenes than the aerial images in the dataset CPLID (Chinese Power Line Insulator Dataset) [54]. As shown in Figure 1, aerial images in dataset ‘CCIN_detection’ included diverse scenes.
To increase the richness of the experimental dataset and avoid overfitting during training, data augmentation techniques were applied in this work. Specifically, Gaussian noise, blurring, and rotation were employed to transform the original image styles—and then the Label-Image annotation tool was employed to produce labels. Finally, the dataset ‘CCIN_detection’ included 5000 aerial images in total; 3000 images were employed as a training set, while the other 2000 were used for testing, as shown in Table 5. All the images in dataset ‘CCIN_detection’ were sized to 416 × 416.

4.2. Anchor Boxes Clustering

In order to achieve accurate detection of different scale insulators in aerial images, the k-means++ clustering algorithm was employed in the CCIN_detection dataset to obtain good anchor boxes in advance. The result is shown in Figure 5. The vertical axis indicates the average intersection over union (IoU), and the horizontal axis shows the number of clusters (k). It was determined that when k = 12, the corresponding average IoU = 75.09%, and after k = 12, the average IoU increased slowly. Therefore, the chosen number k of clustering centers for the dataset CCIN_detection was 12, and 12 cluster centers were further divided into three different detection headers. The corresponding anchor boxes for insulator multiscale prediction were obtained as follows: (43, 19), (87, 20), (59, 35), (123, 33), (87, 56), (44, 126), (165, 60), (253, 44), (154, 104), (263, 73), (264, 111), and (260, 174). Among them, (43, 19), (87, 20), (59, 35), and (123, 33) were the anchor boxes for scale 3; (87, 56), (44, 126), (165, 60), and (253, 44) were the anchor boxes for scale 2; (154, 104), (263, 73), (264, 111), and (260, 174) were the anchor boxes for scale 1, respectively.

4.3. Quantitative and Qualitative Analysis

To validate the effectiveness of the network YOLOv3-dense, the compared networks (YOLOv2, YOLOv3, and Method in [45] with three-scale) and YOLOv3-dense network were trained on the Dark-net framework, and the final networks used for insulator detection were evaluated on the same Visual studio framework. In order to obtain a fair comparison, all the networks were trained and then tested on the dataset CCIN_detection. The training parameters are shown in Table 6. During the process of training, the initialization value of the learning rate was 0.001; after the iterations of 25,000 and 32,000, the learning rate was adjusted to 0.0001 and 0.00001, respectively.
True positive (TP), false positive (FP), true negative (TN), and false negative (FN) are the most commonly used parameters in the binary classification model. Precision and recall are defined in Formula (2) and Formula (3), respectively. The two-dimensional precision-recall (P-R) curve is composed of the values of the precision and recall, and the average precision (AP) is defined in Formula (4).
Precision = TP TP + FP
Recall = TP TP + FN
AP = 0 1 P R d R
The P-R curves of four networks are shown in Figure 6. They were conducted on the testing set of CCIN_detection. Based on the observations in Figure 6, the AP values of the four networks were: YOLOv2 (83.43%), YOLOv3 (90.31%), method in [45] (91.70%), and YOLOv3-dense (94.47%), respectively. It was found that the AP value of our proposed network was 11% higher than that of YOLOv2, 4% higher than that of YOLOv3, and 2.8% higher than that of the method in [45]. This indicates that the YOLOv3-dense network is more accurate than the networks of YOLOv2, YOLOv3, and the method in [45].
Running time was also employed to evaluate the performance of the networks, and the experimental results are listed in Table 7. Specifically, the running time of the proposed network YOLOv3-dense (8.5 ms) was only a little longer than those of YOLOv3 (8 ms) and the method in [45] (8 ms). Therefore, our proposed network can run in real-time. The precision values of the four networks were: YOLOv2 (87%), YOLOv3 (90%), method in [45] (94%), and YOLOv3-dense (94%). The recall values of the four networks were: YOLOv2 (83%), YOLOv3 (91%), method in [45] (90%), and YOLOv3-dense (96%), respectively. It was determined that the precision value of the YOLOv3-dense network was 7% higher than that of YOLOv2 and 4% higher than that of YOLOv3. The recall value of the YOLOv3-dense network was 13% higher than YOLOv2, 5% higher than YOLOv3, and 6% higher than the method in [45]. Consequently, as it achieved a good trade-off between precision, recall, AP, and running time, our proposed network may be more advantageous than the compared networks (YOLOv2, YOLOv3, and the method in [45]).
Aerial images captured by UAV for insulator detection commonly include diverse background interference, e.g., skies, rivers, power towers, vegetation, buildings, and so on. To verify the effectiveness of the YOLOv3-dense network in different aerial scenes, the experimental results on images with diverse background interference are shown in Figure 7a–e. Specifically, each Figure shows the insulator detection results, including the bounding box, prediction name (insulator) and predicted confidence. Figure 7a shows experimental scenes with sky in the background. Sky interference is relatively simple, and all of the insulators in the image were segmented accurately from the background. Figure 7b shows experimental scenes with rivers in the background; similarly, these are relatively uncomplicated, and all the insulators in the images were detected. Experimental images with power towers in the background are shown in Figure 7c. Although these were complex compared to the background interference of the sky or rivers, all insulators were detected in these images. Figure 7d shows experimental scenes with vegetation in the background. All insulators were accurately detected under the conditions of occlusion and strong lighting. The experimental scenes with buildings in the background are shown in Figure 7e. Although the backgrounds of these images were more complex than power towers and vegetation, all the insulators were detected correctly. Consequently, the YOLOv3-dense network exhibits good performance for insulator detection.
Due to the different shooting angles and distances in real-world applications, insulators in aerial images are extremely diverse in appearance, shape, and size. To verify the accuracy and robustness of the YOLOv3-dense network in multiscale detection, several typical images with different backgrounds were employed to demonstrate the visualization performances of the four networks: YOLOv2, YOLOv3, the method in [45], and YOLOv3-dense, as shown in Figure 8, Figure 9, Figure 10, Figure 11 and Figure 12. Specifically, Figure 8 shows the experimental results with sky backgrounds. Three insulators were detected by YOLOv2 (Figure 8a), four insulators were detected by both YOLOv3 (Figure 8b) and the method in [45] (Figure 8c). All except for the vertical insulators were detected by YOLOv3-dense (Figure 8d). The experimental results with river backgrounds are shown in Figure 9. YOLOv2 (Figure 9a) and YOLOv3 (Figure 9b) detected five insulators in the image, while six insulators were correctly detected by the method in [45] (Figure 9c) and the YOLOv3-dense network (Figure 9d). Because the shapes of bridges can be similar to insulators, it was hard for YOLOv2 to distinguish insulators from the complex backgrounds. As a result, two bridges were misidentified as insulators in Figure 9a. Figure 10 shows the detection results with power towers in the background. Although the color of insulators was similar to the background, all six insulators in the image were detected by the YOLOv3-dense network (Figure 10d). YOLOv2 (Figure 10a) detected four insulators, while YOLOv3 (Figure 10b) and the method in [45] (Figure 10c) detected five insulators each. Compared to the method in [45], the YOLOv3-dense network performed better in detection through occlusion. The experimental results using images with vegetation in the background are shown in Figure 11. All eight insulators were detected under strong lighting conditions by the method in [45] (Figure 11c) and the YOLOv3-dense network (Figure 11d). Only six insulators were detected by YOLOv2 (Figure 11a) and seven insulators were detected by YOLOv3 (Figure 11b). Figure 12 shows the detection results with buildings in the background Although the background was complex and the color of buildings was similar to the insulators, all insulators (six in total) were correctly detected by the method in [45] (Figure 12c) and YOLOv3-dense network (Figure 12d). Only four insulators were detected by YOLOv2 (Figure 12a) and YOLOv3 (Figure 12b). Consequently, based on the observations of Figure 8, Figure 9, Figure 10, Figure 11 and Figure 12, the YOLOv3-dense network achieved better performances in diverse scenes compared to the networks of YOLOv2, YOLOv3, and the method in [45].
It can be concluded that the YOLOv3-dense network could be utilized on UAV for insulator inspection. The YOLOv3-dense network has advantages in occluded object detection, and can be extended into other component inspections in high-voltage transmission lines (e.g., anti-vibration hammers, bird nests, etc.); moreover, it would be impactful to be able to implement insulator detection in different weather conditions.

5. Conclusions

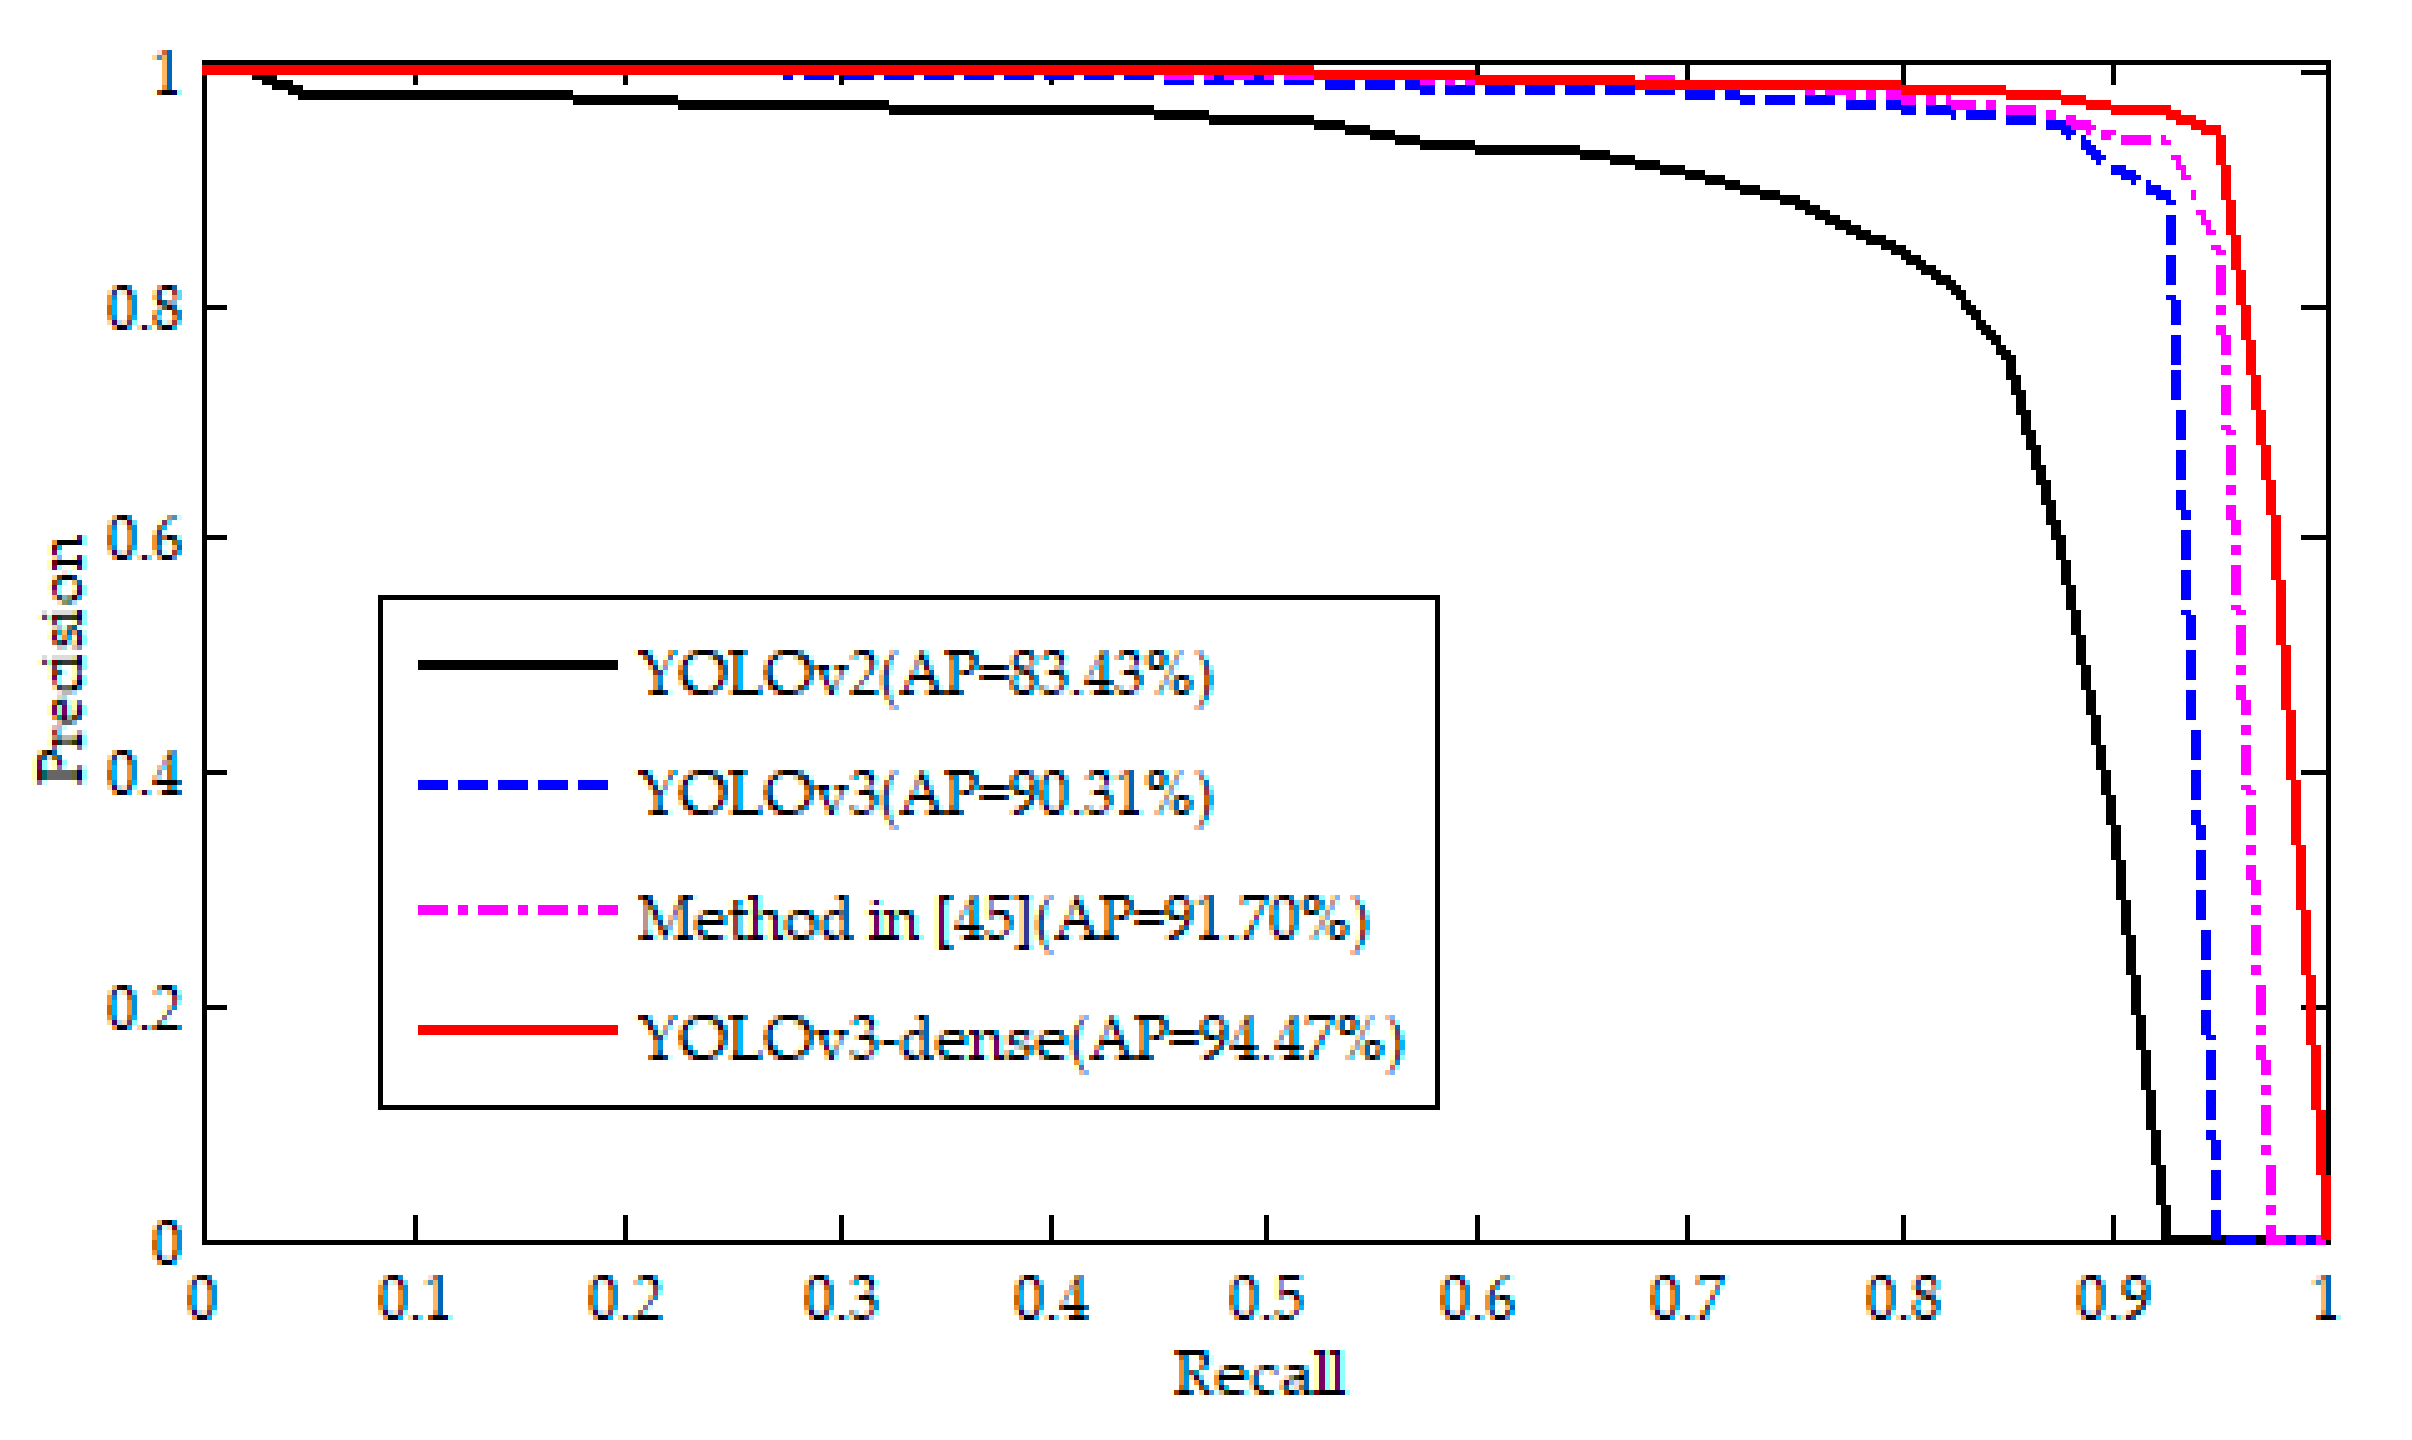
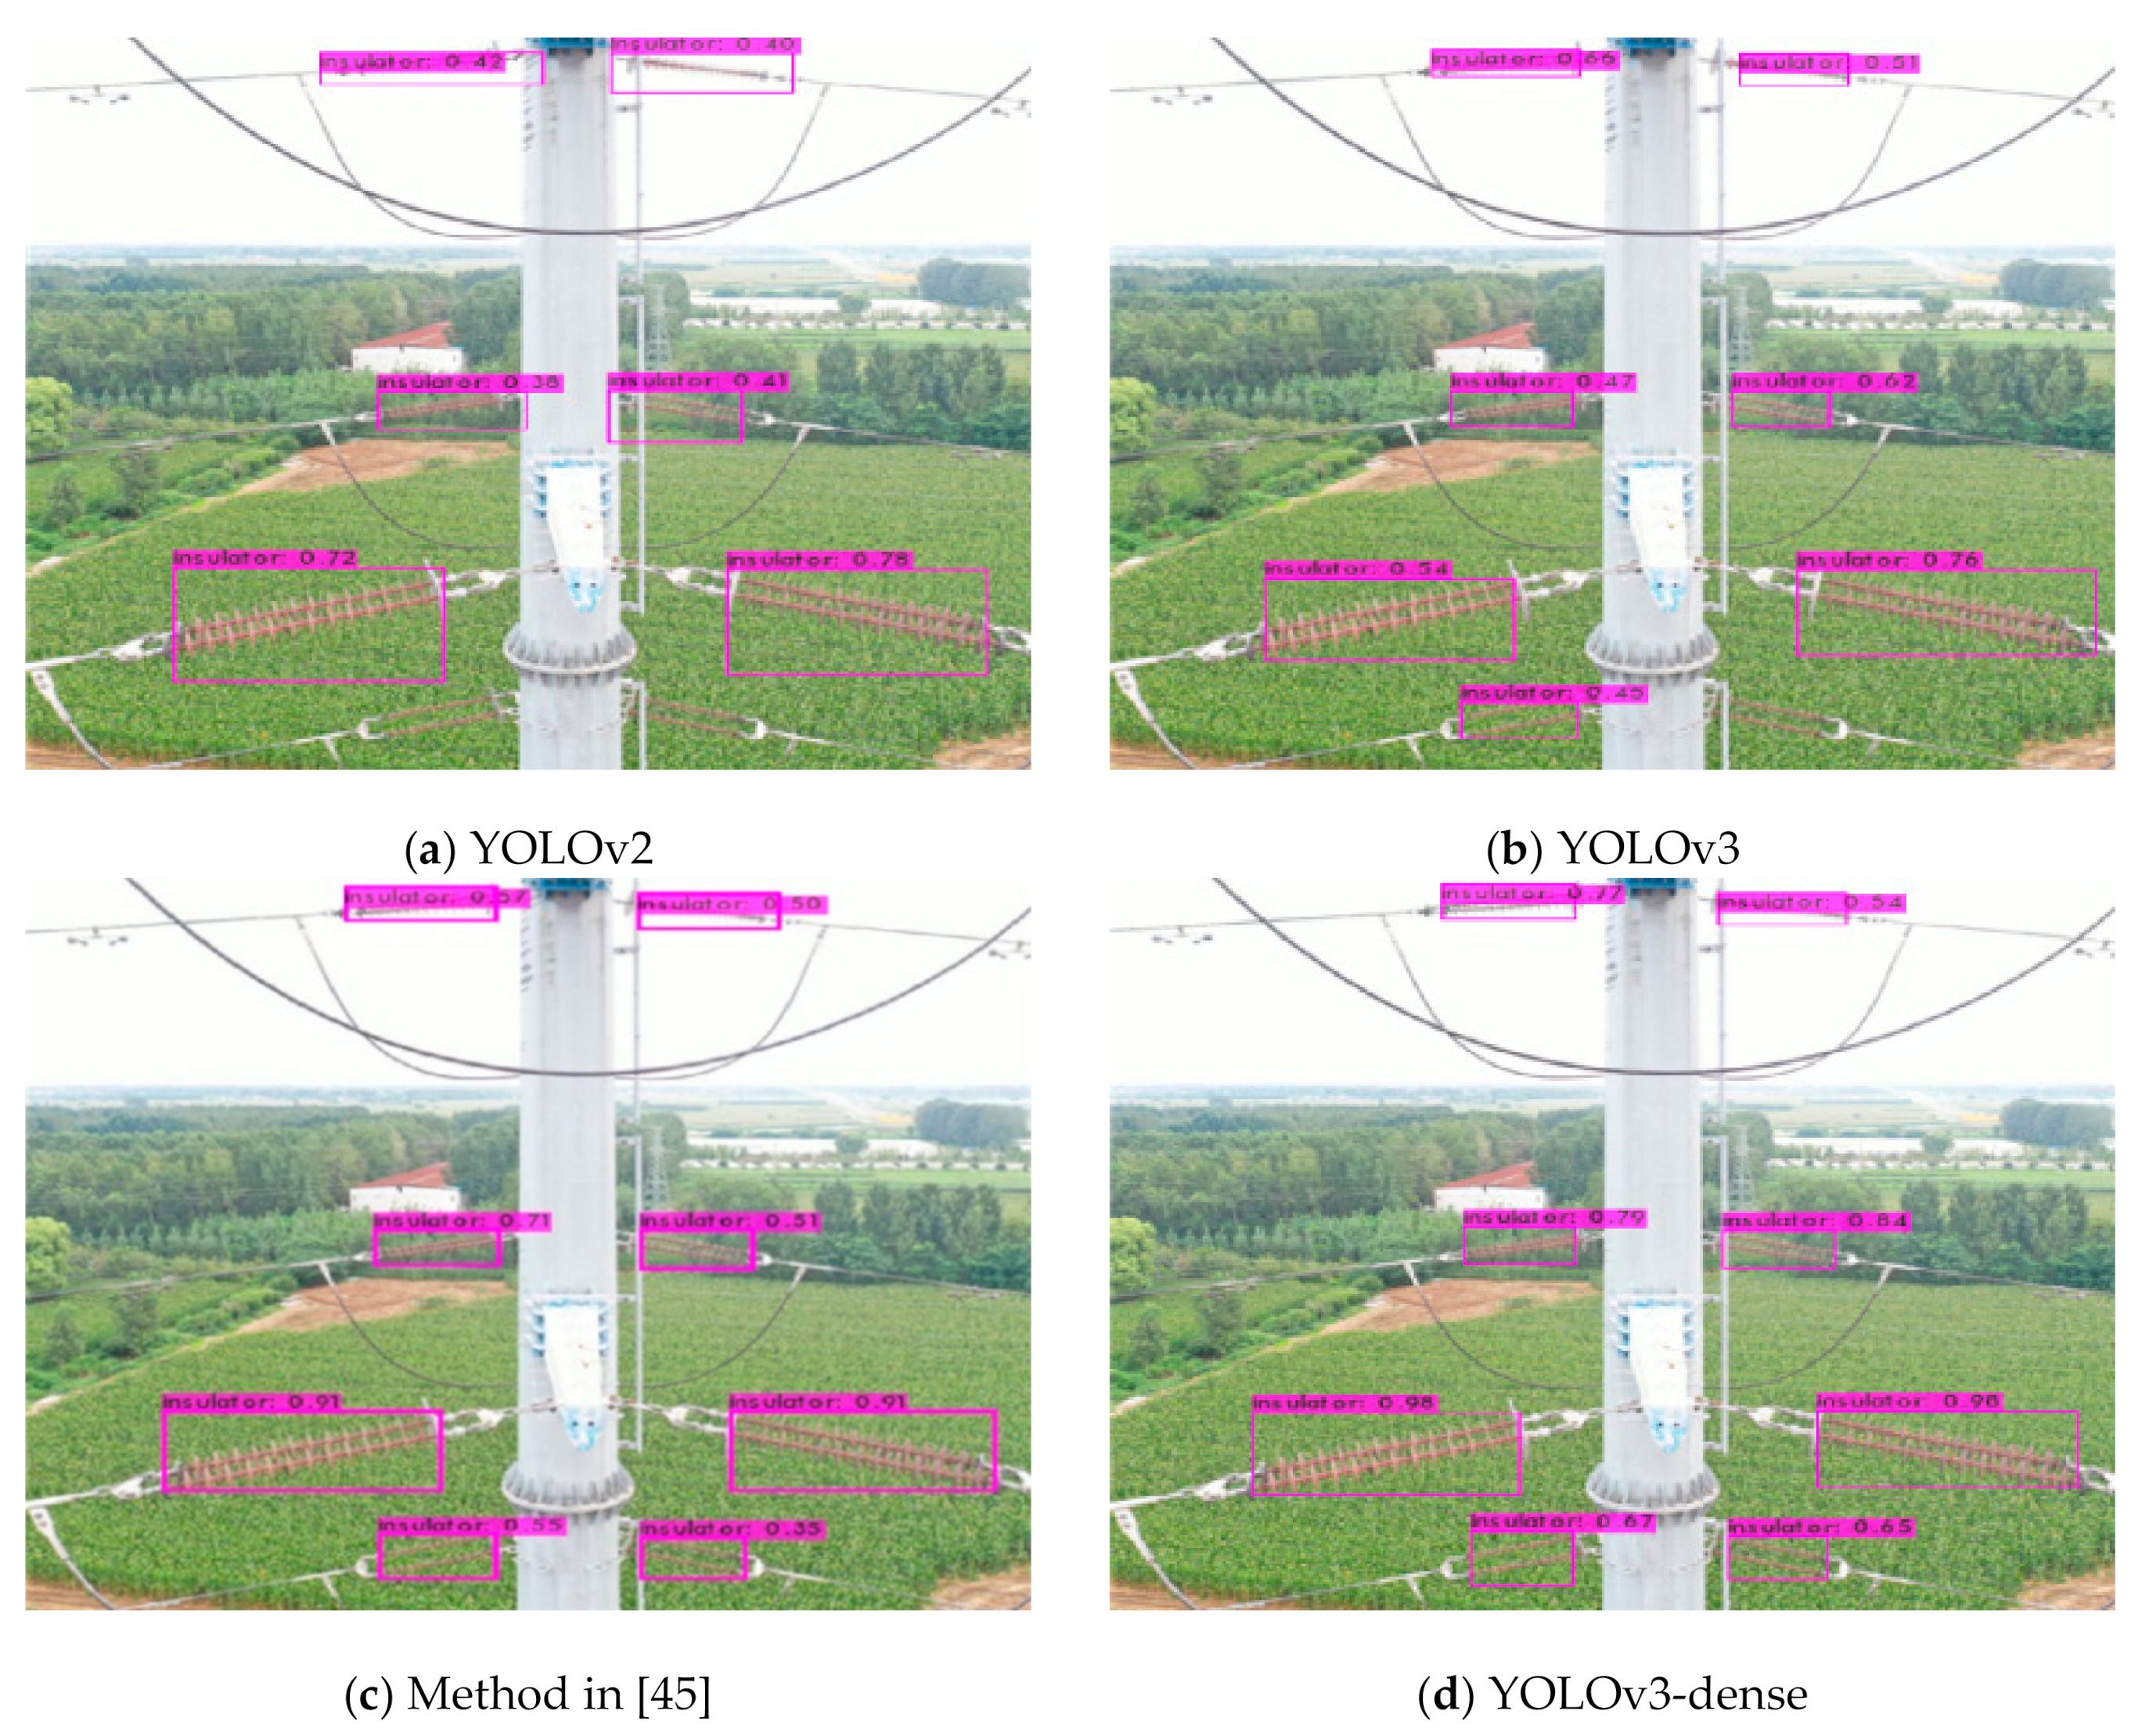
In this study, a modified network (YOLOv3-dense) was proposed for the detection of different-sized insulators in aerial images with complex backgrounds. A novel insulator dataset was constructed, which contained composite insulator images captured by UAV in common aerial scenes. The modified network YOLOv3-dense combined YOLOv3 with Dense-Blocks to optimize the feature extraction network. To enhance the accuracy and robustness of different-sized insulator detection, a structure of FPN was proposed as an addition to the YOLOv3-dense network. Multilevel feature mapping modules were adapted to the YOLOv3-dense network to obtain abundant semantic information of the upper and lower layers. The networks of YOLOv3-dense, the method in [45], YOLOv3, and YOLOv2 were trained and tested on the constructed dataset. Experimental results demonstrated that the AP value of the YOLOv3-dense was 2.8%, 4%, and 11% higher than that of the method in [45], YOLOv3 and YOLOv2, respectively. In addition, the precision values of the networks YOLOv3-dense, the method in [45], YOLOv3, and YOLOv2 were 94%, 94%, 90%, and 87%, respectively—and the recall values were 96%, 90%, 91%, and 83%, respectively. The results confirmed that the proposed network is superior to the method in [45], YOLOv3 and YOLOv2. Although the running time of the proposed network (8.5 ms) is slightly higher than that of YOLOv3 (8 ms), the proposed network can still be used to detect insulators in real-time. Consequently, the proposed network achieved good performance in different-sized insulator detection amid diverse background interference.
For a future study, the proposed model will be used for UAV-based real-time inspection of transmission lines.

Author Contributions

C.L. wrote this paper and finished the experiment; Methodology, Y.W.; experiments, J.L.; labeling the ground-truth for each image in the dataset, Z.S.; All authors have read and agreed to the published version of the manuscript.

Funding

This research was funded by the National Nature Science Founding of China under Grant 61573183; Open Project Program of the National Laboratory of Pattern Recognition (NLPR) under Grant 201900029; Excellent Young Talents support plan in Colleges of Anhui Province Grant gxyq 2019109, gxgnfx 2019056.

Acknowledgments

The authors wish to thank the editor and reviewers for their suggestions, and to thank Yiquan Wu for his guidance.

Conflicts of Interest

The authors declare no conflict of interest.

References

  1. Liu, Y.; Pei, S.; Fu, W.; Zhang, K.; Ji, X.; Yin, Z. The discrimination method as applied to a deteriorated porcelain insulator used in transmission lines on the basis of a convolution neural network. IEEE Trans. Dielectr. Electr. Insul. 2017, 24, 3559–3566. [Google Scholar] [CrossRef]
  2. Nguyen, V.N.; Jenssen, R.; Roverso, D. Automatic autonomous vision-based power line inspection: A review of current status and the potential role of deep learning. Int. J. Electr. Power Energy Syst. 2018, 99, 107–120. [Google Scholar] [CrossRef] [Green Version]
  3. Fan, Y.; Deng, Y.; Zhou, J.; Wang, J.; Lei, L.; Xu, J.; Wang, X. Analysis of Electric Field Distribution on Composite Insulator of 500kV AC Typical Tower and Its Effect on Decay Fracture. In Proceedings of the 2020 International Conference on Electrical Technology and Automatic Control ICETAC (2020), Anhui, China, 7–9 August 2020. [Google Scholar]
  4. Hui, X.; Bian, J.; Yu, Y.; Zhao, X.; Tan, M. A novel autonomous navigation approach for UAV power line inspection. In Proceedings of the 2017 IEEE International Conference on Robotics and Biomimetics (ROBIO), Macau, China, 5–8 December 2017; IEEE: Piscataway, NJ, USA, 2017. [Google Scholar]
  5. Prasad, S. Review on Machine Vision based Insulator Inspection Systems for Power Distribution System. J. Eng. Sci. Technol. Rev. 2016, 9, 135–141. [Google Scholar] [CrossRef]
  6. Li, Y.; Zhang, W.; Li, P.; Ning, Y.; Suo, C. A Method for Autonomous Navigation and Positioning of UAV Based on Electric Field Array Detection. Sensors 2021, 21, 1146. [Google Scholar] [CrossRef]
  7. Zuo, D.; Hu, H.; Qian, R.; Liu, Z. An insulator defect detection algorithm based on computer vision. In Proceedings of the 2017 IEEE International Conference on Information and Automation (ICIA), Macau, China, 18–20 July 2017; pp. 361–365. [Google Scholar]
  8. Jiang, Y.T.; Han, J.; Ding, J. The identification and diagnosis of self-blast defects of glass insulators based on multi-feature fusion. Electr. Power. 2017, 50, 52–58. [Google Scholar]
  9. Zhai, Y.; Wang, D.; Zhang, M.; Wang, J.; Guo, F. Fault detection of insulator based on saliency and adaptive morphology. Multimed. Tools Appl. 2017, 76, 12051–12064. [Google Scholar] [CrossRef]
  10. Zai, H.; He, L.; Liu, Y. Target Tracking Method of Transmission Line Insulator Based on Multi Feature Fusion and Adaptive Scale Filter. In Proceedings of the 5th Asia Conference on Power and Electrical Engineering (ACPEE), Chengdu, China, 4–7 June 2020. [Google Scholar] [CrossRef]
  11. Yin, J.; Lu, Y.; Gong, Z.; Jiang, Y.; Yao, J. Edge Detection of High-Voltage Porcelain Insulators in Infrared Image Using Dual Parity Morphological Gradients. IEEE Access 2019, 7, 32728–32734. [Google Scholar] [CrossRef]
  12. Zhang, X.; Ou, G.; He, H.; Ding, Y. Zero-insulator detection based on infrared images matching. IEEE Trans. Dielectr. Electr. Insul. 2020, 56, 104–109. [Google Scholar] [CrossRef]
  13. Anjum, S.; Jayaram, S.; El-Hag, A.; Jahromi, A. Detection and classification of defects in ceramic insulators using RF antenna. IEEE Trans. Dielectr. Electr. Insul. 2017, 24, 183–190. [Google Scholar] [CrossRef]
  14. Haiba, A.S.; Gad, A.; Eldebeikey, S.M.; Halawa, M. Statistical Significance of Wavelet Extracted Features in the Condition Monitoring of Ceramic Outdoor Insulators. In Proceedings of the 2019 IEEE Electrical Insulation Conference (EIC), Calgary, AB, Canada, 16–19 June 2019; IEEE: Piscataway, NJ, USA, 2019. [Google Scholar]
  15. Wang, W.; Wang, Y.; Han, J.; Yue, L. Recognition and Drop-Off Detection of Insulator Based on Aerial Image. In Proceedings of the International Symposium on Computational Intelligence & Design, Hangzhou, Zhejiang, China, 10–11 December 2016; IEEE: Piscataway, NJ, USA, 2017. [Google Scholar] [CrossRef]
  16. Iruansi, U.; Tapamo, J.R.; Davidson, I.E. An active contour approach to insulator segmentation. In Proceedings of the 12th IEEE Africon International Conference, Addis Ababa, Ethiopia, 14–17 September 2015; IEEE: Piscataway, NJ, USA, 2015. [Google Scholar] [CrossRef]
  17. Zhao, Z.; Liu, N.; Wang, L. Localization of multiple insulators by orientation angle detection and binary shape prior knowledge. IEEE Trans. Dielectr. Electr. Insul. 2015, 22, 3421–3428. [Google Scholar] [CrossRef]
  18. Huang, X.N.; Zhang, Z.L. A Method to Extract Insulator Image from Aerial Image of Helicopter Patrol. Power Sys. Technol. 2010, 34, 194–197. [Google Scholar]
  19. Zhai, Y.; Chen, R.; Yang, Q.; Li, X.; Zhao, Z. Insulator Fault Detection Based on Spatial Morphological Features of Aerial Images. IEEE Access 2018, 6, 35316–35326. [Google Scholar] [CrossRef]
  20. Prasad, P.S.; Rao, B.P. LBP-HF features and machine learning applied for automated monitoring of insulators for overhead power distribution lines. In Proceedings of the 2016 International Conference on Wireless Communications, Signal Processing and Networking (WiSPNET), Chennai, India, 23-25 March 2016; IEEE: Piscataway, NJ, USA, 2016. [Google Scholar] [CrossRef]
  21. Zhao, Z.; Fan, X.; Xu, G.; Zhang, L.; Qi, Y.; Zhang, K. Aggregating Deep Convolutional Feature Maps for Insulator Detection in Infrared Images. IEEE Access 2017, 5, 21831–21839. [Google Scholar] [CrossRef]
  22. Wang, X.; Zhang, Y. Insulator identification from aerial images using Support Vector Machine with background suppression. In Proceedings of the 2016 International Conference on Unmanned Aircraft Systems (ICUAS), Arlington, VA, USA, 7–10 June 2016; IEEE: Piscataway, NJ, USA, 2016. [Google Scholar] [CrossRef]
  23. Cheng, H.; Han, P.; Wang, D.; Zhai, Y. Location Method of Insulators in Power Grid Patrol Aerial Images. J. Syst. Simul. 2017, 29, 1327–1336. [Google Scholar]
  24. Zhai, Y.; Wang, D.; Guo, Y.; Zhang, M.; Liu, Y. Recognition of Aerial Insulator Image Based on Structural Model and the Optimal Entropy Threshold Segmentation. DEStech Trans. Eng. Technol. Res. 2016. [Google Scholar] [CrossRef] [Green Version]
  25. Manzo, M.; Pellino, S. Fighting together against the pandemic: Learning multiple models on tomography images for COVID-19 diagnosis. arXiv 2020, arXiv:2012.01251. [Google Scholar]
  26. Shi, C.; Huang, Y. Cap-Count Guided Weakly Supervised Insulator Cap Missing Detection in Aerial Images. IEEE Sensors J. 2020, 21, 1. [Google Scholar] [CrossRef]
  27. Ge, C.; Wang, J.; Wang, J.; Qi, Q.; Liao, J. Towards automatic visual inspection: A weakly supervised learning method for industrial applicable object detection. Comput. Ind. 2020, 121, 103232. [Google Scholar] [CrossRef]
  28. Huang, X.; Shang, E.; Xue, J.; Ding, H. A Multi-feature Fusion-based Deep Learning for Insulator Image Identification and Fault Detection. In Proceedings of the 2020 IEEE 4th Information Technology, Networking, Electronic and Automation Control Conference (ITNEC), Chongqing, China, 12–14 June 2020; IEEE: Piscataway, NJ, USA, 2020. [Google Scholar] [CrossRef]
  29. Liu, W.; Anguelov, D.; Erhan, D.; Szegedy, C.; Reed, S.; Fu, C.Y.; Berg, A.C. Ssd: Single shot multibox detector. In Proceedings of the European Conference on Computer Vision, Amsterdam, The Netherlands, 8–16 October 2016; Springer: Cham, Switzerland, 2016; pp. 21–37. [Google Scholar] [CrossRef] [Green Version]
  30. Redmon, J.; Farhadi, A. Yolov3: An incremental improvement. arXiv 2018, arXiv:1804.02767. [Google Scholar]
  31. Bochkovskiy, A.; Wang, C.Y.; Liao, H.Y.M. YOLOv4: Optimal Speed and Accuracy of Object Detection. arXiv 2020, arXiv:2004.10934. [Google Scholar]
  32. Girshick, R.; Donahue, J.; Darrell, T.; Malik, J. Rich feature hierarchies for accurate object detection and semantic segmentation. In Proceedings of the IEEE Conference on Computer Vision and Pattern Recognition, Columbus, OH, USA, 23–28 June 2014; pp. 580–587. [Google Scholar] [CrossRef] [Green Version]
  33. Girshick, R. Fast r-cnn. In Proceedings of the IEEE International Conference on Computer Vision, Santiago, Chile, 7–13 December 2015; pp. 1440–1448. [Google Scholar] [CrossRef]
  34. Ren, S.; He, K.; Girshick, R.; Sun, J. Faster R-CNN: Towards Real-Time Object Detection with Region Proposal Networks. IEEE Trans. Pattern Anal. Mach. Intell. 2017, 39, 1137–1149. [Google Scholar] [CrossRef] [Green Version]
  35. Chen, H.; He, Z.; Shi, B.; Zhong, T. Research on Recognition Method of Electrical Components Based on YOLO V3. IEEE Access 2019, 7, 157818–157819. [Google Scholar] [CrossRef]
  36. Wang, H.; Hu, Z.; Guo, Y.; Yang, Z.; Zhou, F.; Xu, P. A Real-Time Safety Helmet Wearing Detection Approach Based on CSYOLOv3. Appl. Sci. 2020, 10, 6732. [Google Scholar] [CrossRef]
  37. Rahman, E.; Zhang, Y.; Ahmad, S.; Ahmad, H.; Jobaer, S. Autonomous Vision-Based Primary Distribution Systems Porcelain Insulators Inspection Using UAVs. Sensors 2021, 21, 974. [Google Scholar] [CrossRef] [PubMed]
  38. Huang, Z.; Wang, J. DC-SPP-YOLO: Dense Connection and Spatial Pyramid Pooling Based YOLO for Object Detection. arXiv 2019, arXiv:1903.08589. [Google Scholar] [CrossRef] [Green Version]
  39. Zhang, Z.; Wang, H.; Zhang, J.; Yang, W. A vehicle real-time detection algorithm based on YOLOv2 framework. In Proceedings of the International Conference on Real-time Image and Video Processing, Orlando, FL, USA, 16–17 April 2018. [Google Scholar]
  40. Han, J.; Yang, Z.; Xu, H.; Hu, G.; Zhang, C.; Li, H.; Lai, S.; Zeng, H. Search Like an Eagle: A Cascaded Model for Insulator Missing Faults Detection in Aerial Images. Energies 2020, 13, 713. [Google Scholar] [CrossRef] [Green Version]
  41. Wu, W.; Li, Q. Machine Vision Inspection of Electrical Connectors Based on Improved Yolo-v3. IEEE Access 2020, 8, 166184–166196. [Google Scholar] [CrossRef]
  42. Jiang, H.; Qiu, X.; Chen, J.; Liu, X.; Zhuang, S. Insulator Fault Detection in Aerial Images Based on Ensemble Learning with Multi-level Perception. IEEE Access 2019, 7, 61797–61810. [Google Scholar] [CrossRef]
  43. Sadykova, D.; Pernebayeva, D.; Bagheri, M.; James, A. IN-YOLO: Real-time Detection of Outdoor High Voltage Insulators using UAV Imaging. IEEE Trans. Power Del. 2019, 35, 1599–1601. [Google Scholar] [CrossRef]
  44. Adou, M.W.; Xu, H.; Chen, G. Insulator Faults Detection Based on Deep Learning. In Proceedings of the International Conference on Anti- Counterfeiting, Security, and Identification, Xiamen, China, 25–27 October 2019. [Google Scholar] [CrossRef]
  45. Xu, D.; Wu, Y. Improved YOLO-V3 with DenseNet for Multi-Scale Remote Sensing Target Detection. Sensors 2020, 20, 4276. [Google Scholar] [CrossRef]
  46. Huang, G.; Liu, Z.; Van Der Maaten, L.; Weinberger, K.Q. Densely Connected Convolutional Networks. arXiv 2016, arXiv:1608.06993. [Google Scholar]
  47. Xu, Z.; Shi, H.; Li, N.; Chao, X. Vehicle Detection Under UAV Based on Optimal Dense YOLO Method. In Proceedings of the 2018 5th International Conference on Systems and Informatics (ICSAI), Nanjing, China, 10–12 November 2018. [Google Scholar] [CrossRef]
  48. Zhu, Y.; Newsam, S. DenseNet for Dense Flow. In Proceedings of the 2017 24th IEEE International Conference on Image Processing, Beijing, China, 17–20 September 2017; pp. 790–794. [Google Scholar] [CrossRef]
  49. Li, Y.; Pei, X.; Huang, Q.; Jiao, L.; Shang, R.; Marturi, N. Anchor-Free Single Stage Detector in Remote Sensing Images Based on Multiscale Dense Path Aggregation Feature Pyramid Network. IEEE Access 2020, 8, 63121–63133. [Google Scholar] [CrossRef]
  50. Lin, T.Y.; Dollar, P.; Girshick, R.; He, K.; Hariharan, B.; Belongie, S. Feature Pyramid Networks for Object Detection. In Proceedings of the 2017 IEEE Conference on Computer Vision and Pattern Recognition (CVPR), Honolulu, HI, USA, 21–26 July 2017; IEEE Computer Society: Washington, DC, USA, 2017. [Google Scholar] [CrossRef] [Green Version]
  51. Liu, S.; Qi, L.; Qin, H.; Shi, J.; Jia, J. Path Aggregation Network for Instance Segmentation. In Proceedings of the 2018 IEEE/CVF Conference on Computer Vision and Pattern Recognition (CVPR), Salt Lake City, UT, USA, 18–22 June 2018; IEEE: Piscataway, NJ, USA, 2018. [Google Scholar] [CrossRef] [Green Version]
  52. Project of the Dark-Net Framework. Available online: https://github.com/AlexeyAB/darknet (accessed on 25 October 2020).
  53. Tao, X.; Zhang, D.; Wang, Z.; Liu, X.; Zhang, H.; Xu, D. Detection of Power Line Insulator Defects Using Aerial Images Analyzed with Convolutional Neural Networks. IEEE Trans. Syst. Man Cybern. Syst. 2018, 1486–1498. [Google Scholar] [CrossRef]
  54. Insulator Data Set—Chinese Power Line Insulator Dataset (CPLID). Available online: https://github.com/InsulatorData/InsulatorDataSet (accessed on 15 September 2020).
Figure 1. Insulators in aerial images with diverse background interference. Each column (from rows 1–5) depicts aerial backgrounds containing vegetation, rivers, sky, power towers, and buildings, respectively.
Electronics 10 00771 g001
Figure 2. The structure of the You Only Look Once (YOLO)v3 network.
Electronics 10 00771 g002
Figure 3. The entire structure of the YOLOv3-dense network.
Electronics 10 00771 g003
Figure 4. The structure of Dense-Blocks.
Electronics 10 00771 g004
Figure 5. Clustering result on dataset CCIN_detection.
Electronics 10 00771 g005
Figure 6. The precision-recall (P-R) curves of four networks.
Electronics 10 00771 g006
Figure 7. Experimental results with different scenes conducted by YOLOv3-dense. The first through fifth rows show experimental scenes with backgrounds of sky, rivers, power towers, vegetation, and buildings, respectively.
Electronics 10 00771 g007aElectronics 10 00771 g007b
Figure 8. Experimental results of multiscale detection with sky backgrounds.
Electronics 10 00771 g008
Figure 9. Experimental results of multi-scale detection with river backgrounds.
Electronics 10 00771 g009
Figure 10. Experimental results of multi-scale detection with power tower backgrounds.
Electronics 10 00771 g010
Figure 11. Experimental results of multi-scale detection with vegetation backgrounds.
Electronics 10 00771 g011
Figure 12. Experimental results of multi-scale detection with buildings in the backgrounds.
Electronics 10 00771 g012
Table 1. The feature extraction network of YOLOv3.
TypeFiltersSizeOutput
Convolutional323 × 3/1416 × 416
Convolutional643 × 3/2208 × 208
Convolutional321 × 1/1
Convolutional643 × 3/2
Residual 208 × 208
Convolutional1283 × 3/2104 × 104
Convolutional641 × 1/1
Convolutional1283 × 3/2
Residual 104 × 104
Convolutional2563 × 3/252 × 52
Convolutional1281 × 1/1
Convolutional2563 × 3/2
Residual 52 × 52
Convolutional5123 × 3/226 × 26
Convolutional2561 × 1/1
Convolutional5123 × 3/2
Residual 26 × 26
Convolutional10243 × 3/213 × 13
Convolutional5121 × 1/1
Convolutional10243 × 3/2
Residual 13 × 13
Table 2. The feature extraction network of YOLOv3-dense.
TypeFiltersSizeOutput
Convolutional323 × 3/1416 × 416 × 32
Convolutional643 × 3/2208 × 208 × 64
Convolutional321 × 1/1208 × 208 × 32
Convolutional643 × 3/1208 × 208 × 64
Residual unit
Convolutional1283 × 3/2104 × 104 × 128
Convolutional641 × 1/1104 × 104 × 64
Convolutional1283 × 3/1104 × 104 × 128
Residual unit
Convolutional2563 × 3/252 × 52 × 256
Convolutional1281 × 1/152 × 52 × 128
Convolutional321 × 1/1
Convolutional323 × 3/1
Dense Block1 52 × 52 × (128 + 32 × 4)
Convolutional1281 × 1/152 × 52 × 128
Convolutional2563 × 3/152 × 52 × 256
Residual
Convolutional2563 × 3/226 × 26 × 256
Convolutional641 × 1/1
Convolutional643 × 3/1
Dense Block2 26 × 26 × (256 + 64 × 4)
Convolutional2561 × 1/126 × 26 × 256
Convolutional5123 × 3/126 × 26 × 512
Residual unit
Convolutional5123 × 3/213 × 13 × 512
Convolutional1281 × 1/1
Convolutional1283 × 3/1
Dense Block3 13 × 13 × (512 + 128 × 4)
Convolutional5121 × 1/113 × 13 × 512
Convolutional10243 × 3/113 × 13 × 1024
Residual unit
Table 3. The structure of feature mapping modules.
TypeFiltersSizeOutput
Convolutional1281 × 1/1
Convolutional2563 × 3/1
Residual 52 × 52 × 256
Convolutional2561 × 1/1
Convolutional5123 × 3/1
Residual 26 × 26 × 512
Convolutional5121 × 1/1
Convolutional10243 × 3/1
Residual 13 × 13 × 1024
Table 4. Experimental environment.
ParametersConfiguration
CPUIntel(R) Core(TM) i9-9900 K, CPU/3.6 GHz, RAM/32 G
GPUNvidia GeForce GTX 3080(10 G)
Accelerated EnvironmentCUDA 11.1, cuDNN 8.0.5
Visual Studio FrameworkVisual Studio 2017, Open CV 3.4.0
Operating SystemWindows 10
Training FrameworkDark-net
Table 5. The insulator dataset CCIN_detection.
Images NumberTraining SetTesting SetImage SizeInsulators Number
500030002000416 × 4169900
Table 6. Experimental parameters configuration.
Batch SizeSubdivisionsMomentumDecayLearning Rate
64160.90.00050.001–0.00001
AngleSaturationExposureHueIterations
01.51.50.138,000
Table 7. The experimental results of different networks.
NetworksPrecisionRecallAPRunning Times (ms)
YOLOv287%83%83.43%4.5
YOLOv390%91%90.31%8.0
Method in [45]94%90%91.70%8.0
Our network94%96%94.47%8.5
Publisher’s Note: MDPI stays neutral with regard to jurisdictional claims in published maps and institutional affiliations.

