1. Introduction
Passive intermodulation (PIM) has an important impact on wireless communication systems [
1,
2,
3]. The PIM source is generated by non-linear factors in radio frequency (RF) systems. It mainly includes contact non-linearity [
4,
5] and material non-linearity [
6,
7]. When signals of multiple frequencies are mixed into non-linear passive components, corresponding PIM signals are generated. If the frequencies of the PIM signals are in the operating frequency band of the receiver, it will create interference in the system. The sensitivity and channel capacity of the system will thereby be reduced. Therefore, for satellite [
8], base station [
9], indoor-distributed antennas, and other wireless systems, PIM is an important technical indicator. With the development of 5G and autonomous vehicles, achieving the highest possible sensitivity has become extremely important. Hence, the importance of PIM cannot be ignored.
The antenna is one of the most important components in wireless communication systems, and is also one of the components that could most easily be a source of PIM [
10,
11,
12,
13]. The design of antennas is highly related to the structure, and therefore structural design and processing technology are the key to controlling the PIM levels of antennas. The purpose of structural design is to minimize PIM levels, such as avoiding direct metal-metal contact and reducing solder joints. The actual PIM level is directly related to the processing technology. The same products may have different PIM levels owing to small differences in processing. For example, the tightness of contact between metals [
5] or a lack of uniformity in solder joints [
14] will result in different PIM levels. Therefore, it is difficult to predict whether a product is qualified or not from a theoretical perspective. For antennas with tight PIM specifications, measurement is the most effective means of evaluation.
As PIM levels are very low compared to the power of carrier, the test results are prone to interferences from external signal sources. Therefore, it is necessary to ensure that there are no interfering signals in the environment during measurement. In reality, it is difficult to guarantee a completely interference-free environment. Hence, the device under test (DUT) is usually measured in a shielded anechoic chamber. The anechoic chamber shields the interference from external signals and reduces the space reflection, which is widely used in microwave measurements [
15,
16,
17,
18,
19,
20]. The use of an anechoic chamber can also greatly improve the accuracy of the PIM measurement, especially for radiating components such as antennas.
In addition, the shielding enclosure and absorber of the chamber could also generate PIM signals [
7]. The shielding enclosure of the PIM measurement chamber is made of several metal plates, and the connections of the metal plates can be fixed by welding, screws, etc. However, no matter which method is used, contact non-linearity will inevitably occur at the connections and will become a potential source of PIM. The absorber generally consists of polyurethane foam (commonly referred to as sponge) and carbon black or graphite powder. The shaped absorber is obtained by mixing, soaking, and drying the materials, which can lead to the uneven distribution of materials. In addition, there may be incomplete contact between large-sized carbon particles, which form loose clusters. Therefore, the absorber is another potential source of PIM, while the part in contact with the shielding enclosure may also create PIM products.
The antenna under test (AUT) radiates electromagnetic waves during measurement. When electromagnetic waves are transmitted to the absorbers, the absorbers may generate PIM. At the same time, a portion of the energy will produce another PIM product on the shielding enclosure. These PIM products can be received by the AUT and increase with increases in the gain of the antenna, which could artificially inflate the measured PIM of the AUT. In this situation, some antenna products that originally meet the PIM performance indicators will be mistakenly regarded as substandard products, resulting in a reduction in the efficiency of industrial production and a waste of resources. Currently, the manufacturers of PIM measurement chambers only provide a single residual PIM index. This indicator is not a problem in the measurement of non-radiating devices; however, it is not appropriate for antennas, as the increase in the gain of the AUT could cause an increase in the residual PIM level of the chamber. Therefore, for antennas, a reasonable residual PIM level of the chamber should be accompanied by some sort of index related to AUT gain. We thus propose an index denoted the maximum measurable gain (MMG). The AUT should not produce a PIM value higher than the residual PIM index in the PIM test chamber. The MMG can then be defined as the maximum antenna gain that satisfies this condition. The novel concept of MMG proposed in this paper is critical for the evaluation of the PIM performance of a chamber for antenna PIM measurements. However, according to our knowledge, the recent research on PIM is mainly focused on analyses of PIM models [
21,
22,
23] and PIM test devices [
24,
25,
26,
27]. At present, no one has proposed a similar idea of defining the MMG of the PIM measurement chamber, and thus there is no corresponding method of estimating the MMG.
The direct method of evaluating the MMG of a PIM measurement chamber is to measure corresponding high-gain, low-PIM antennas. However, this is not a simple task. First, designing high-gain antennas with low PIM is difficult, as high-gain antennas often have complex metal structures and feeding networks. Solder joints, metal connections, and substrates can cause non-linearity, and generate more PIM products. Secondly, high-gain antennas typically have a more narrowly radiated main lobe. It would be extremely laborious to scan the entire chamber with a high-gain antenna. Finally, the size of a high-gain antenna is large, which is not convenient for measurement. Hence, we present here a method for evaluating the MMG of a shielded anechoic chamber with a single low-PIM medium-gain directional antenna. The medium-gain directional antenna has three advantages. First, the gain of a medium-gain antenna is generally around 10 dBi, which can be achieved by a smaller unit. Low PIM levels can be achieved owing to its simple structure. Secondly, the beam of a medium-gain antenna has a certain directivity, and its side lobes and back lobes are small, which can clearly detect the differences in performance in different positions within the anechoic chamber. Thirdly, the results of the measurements of the medium-gain antenna can be directly used to judge whether the chamber can be used to measure an antenna with a smaller gain, which reduces the workload. Finally, a medium-gain antenna can be equivalent to a high-gain antenna by changing the measurement distance. Therefore, the present paper proposes a method to compensate for gain based on the path loss. In addition, a scanning method for evaluating the chamber based on the main lobe of the antenna is also provided. Using this method, the residual PIM level of the system from measuring antennas with different gains can be also measured and the MMG at the required noise floor can be evaluated.
This paper is organized as follows. In
Section 2, a PIM measurement system is introduced. The method for determining the MMG is proposed in
Section 3. In
Section 4, experiments, performed using two chambers, are presented to verify the proposed method. Lastly, conclusions are provided.
2. PIM Measurement System
As previously mentioned, PIM is caused by the non-linearity of components. Considering a mixed signal with two frequencies, the possible frequencies of the PIM products are determined by the following formula:
in which
and
are positive integers. When it is an even number, the frequency of
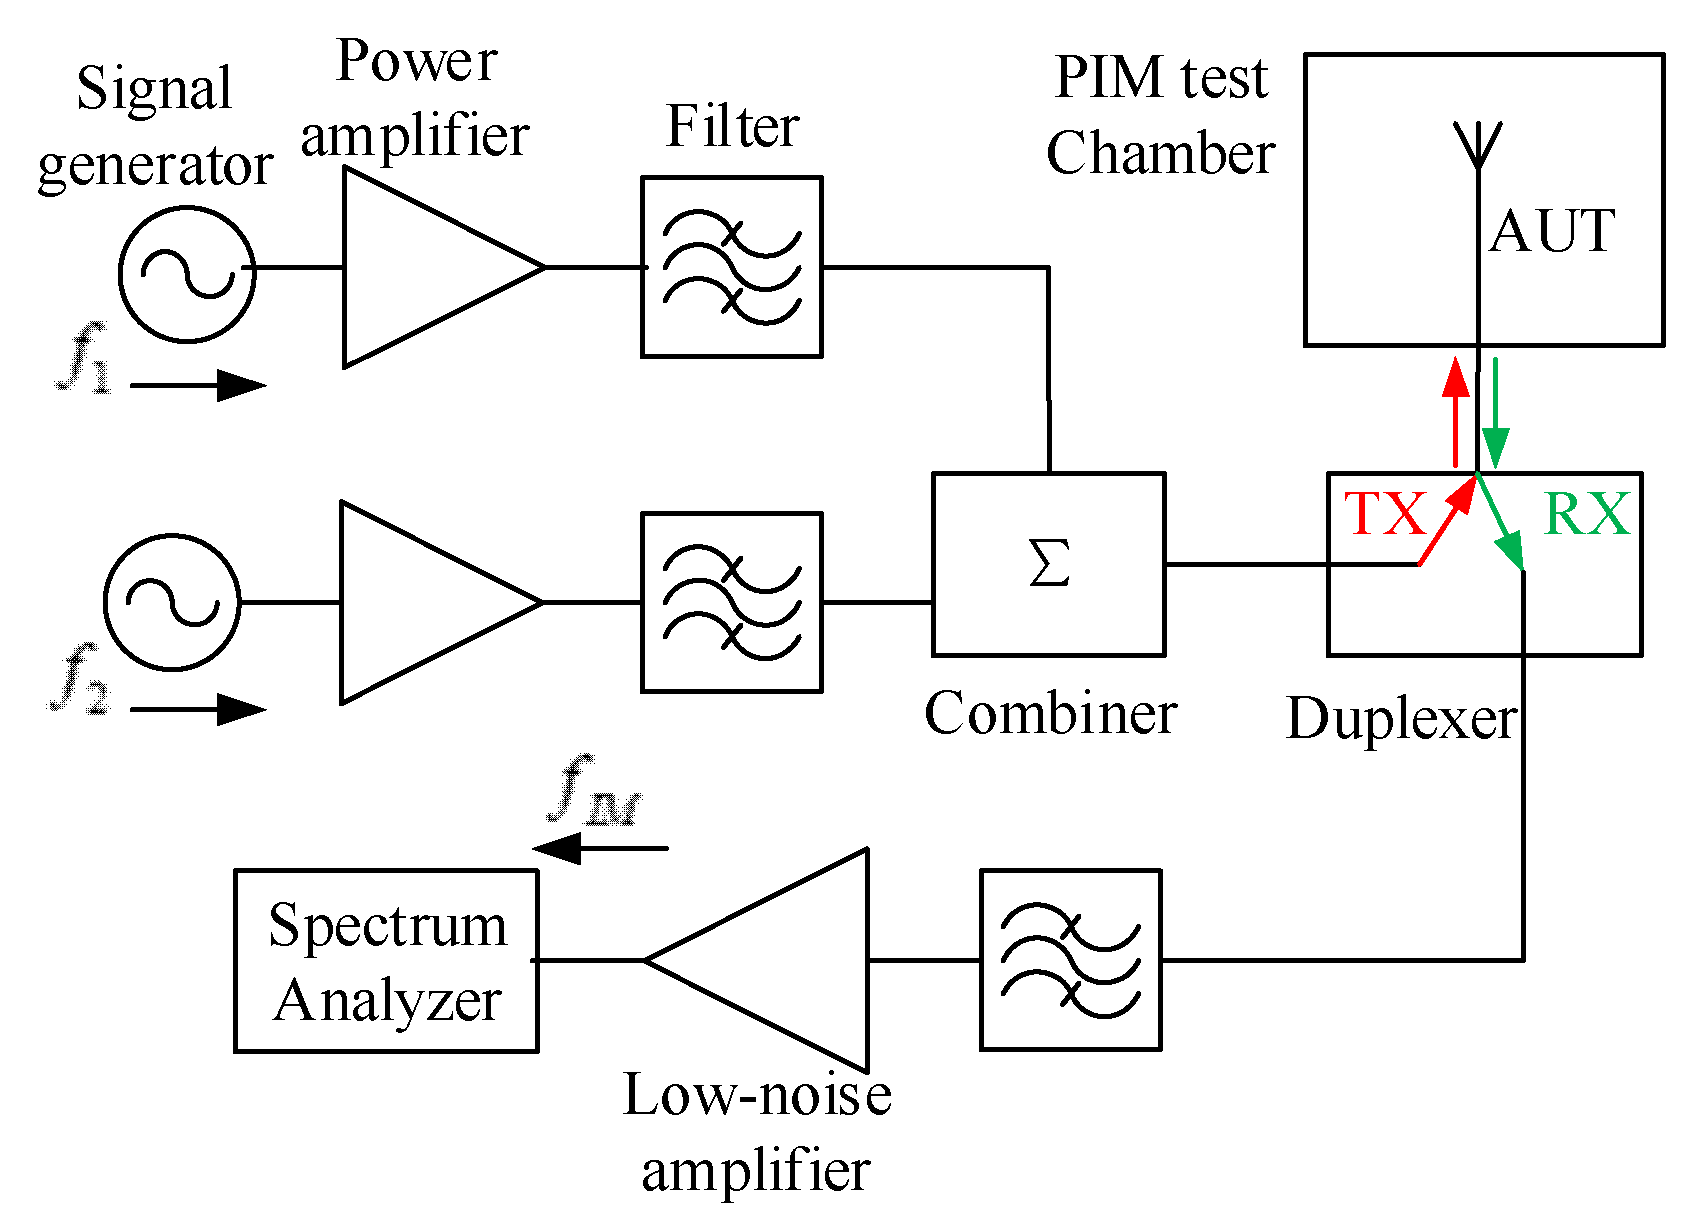
is usually so far from the operating frequency band of the system that it can be ignored. Of the odd PIM signals, the amplitude of the third-order PIM is the largest. Therefore, PIM measurement usually detects the magnitude of the third-order PIM, and the measured results are used to estimate the value of the higher-order PIM. The system architecture for measuring the level of PIM is shown in
Figure 1.
Two single-frequency carrier signals, and , are combined into one channel after being amplified and filtered. The mixed signal can be transmitted to the AUT through the duplexer. A signal with two frequencies will generate PIM signals on the AUT. The PIM products can be received by the test instrument via the duplexer. After processing by filter, low-noise amplifier, and other components, the level of the received PIM signal can be detected by the spectrum analyzer. The PIM level of each component in the system must be very low.
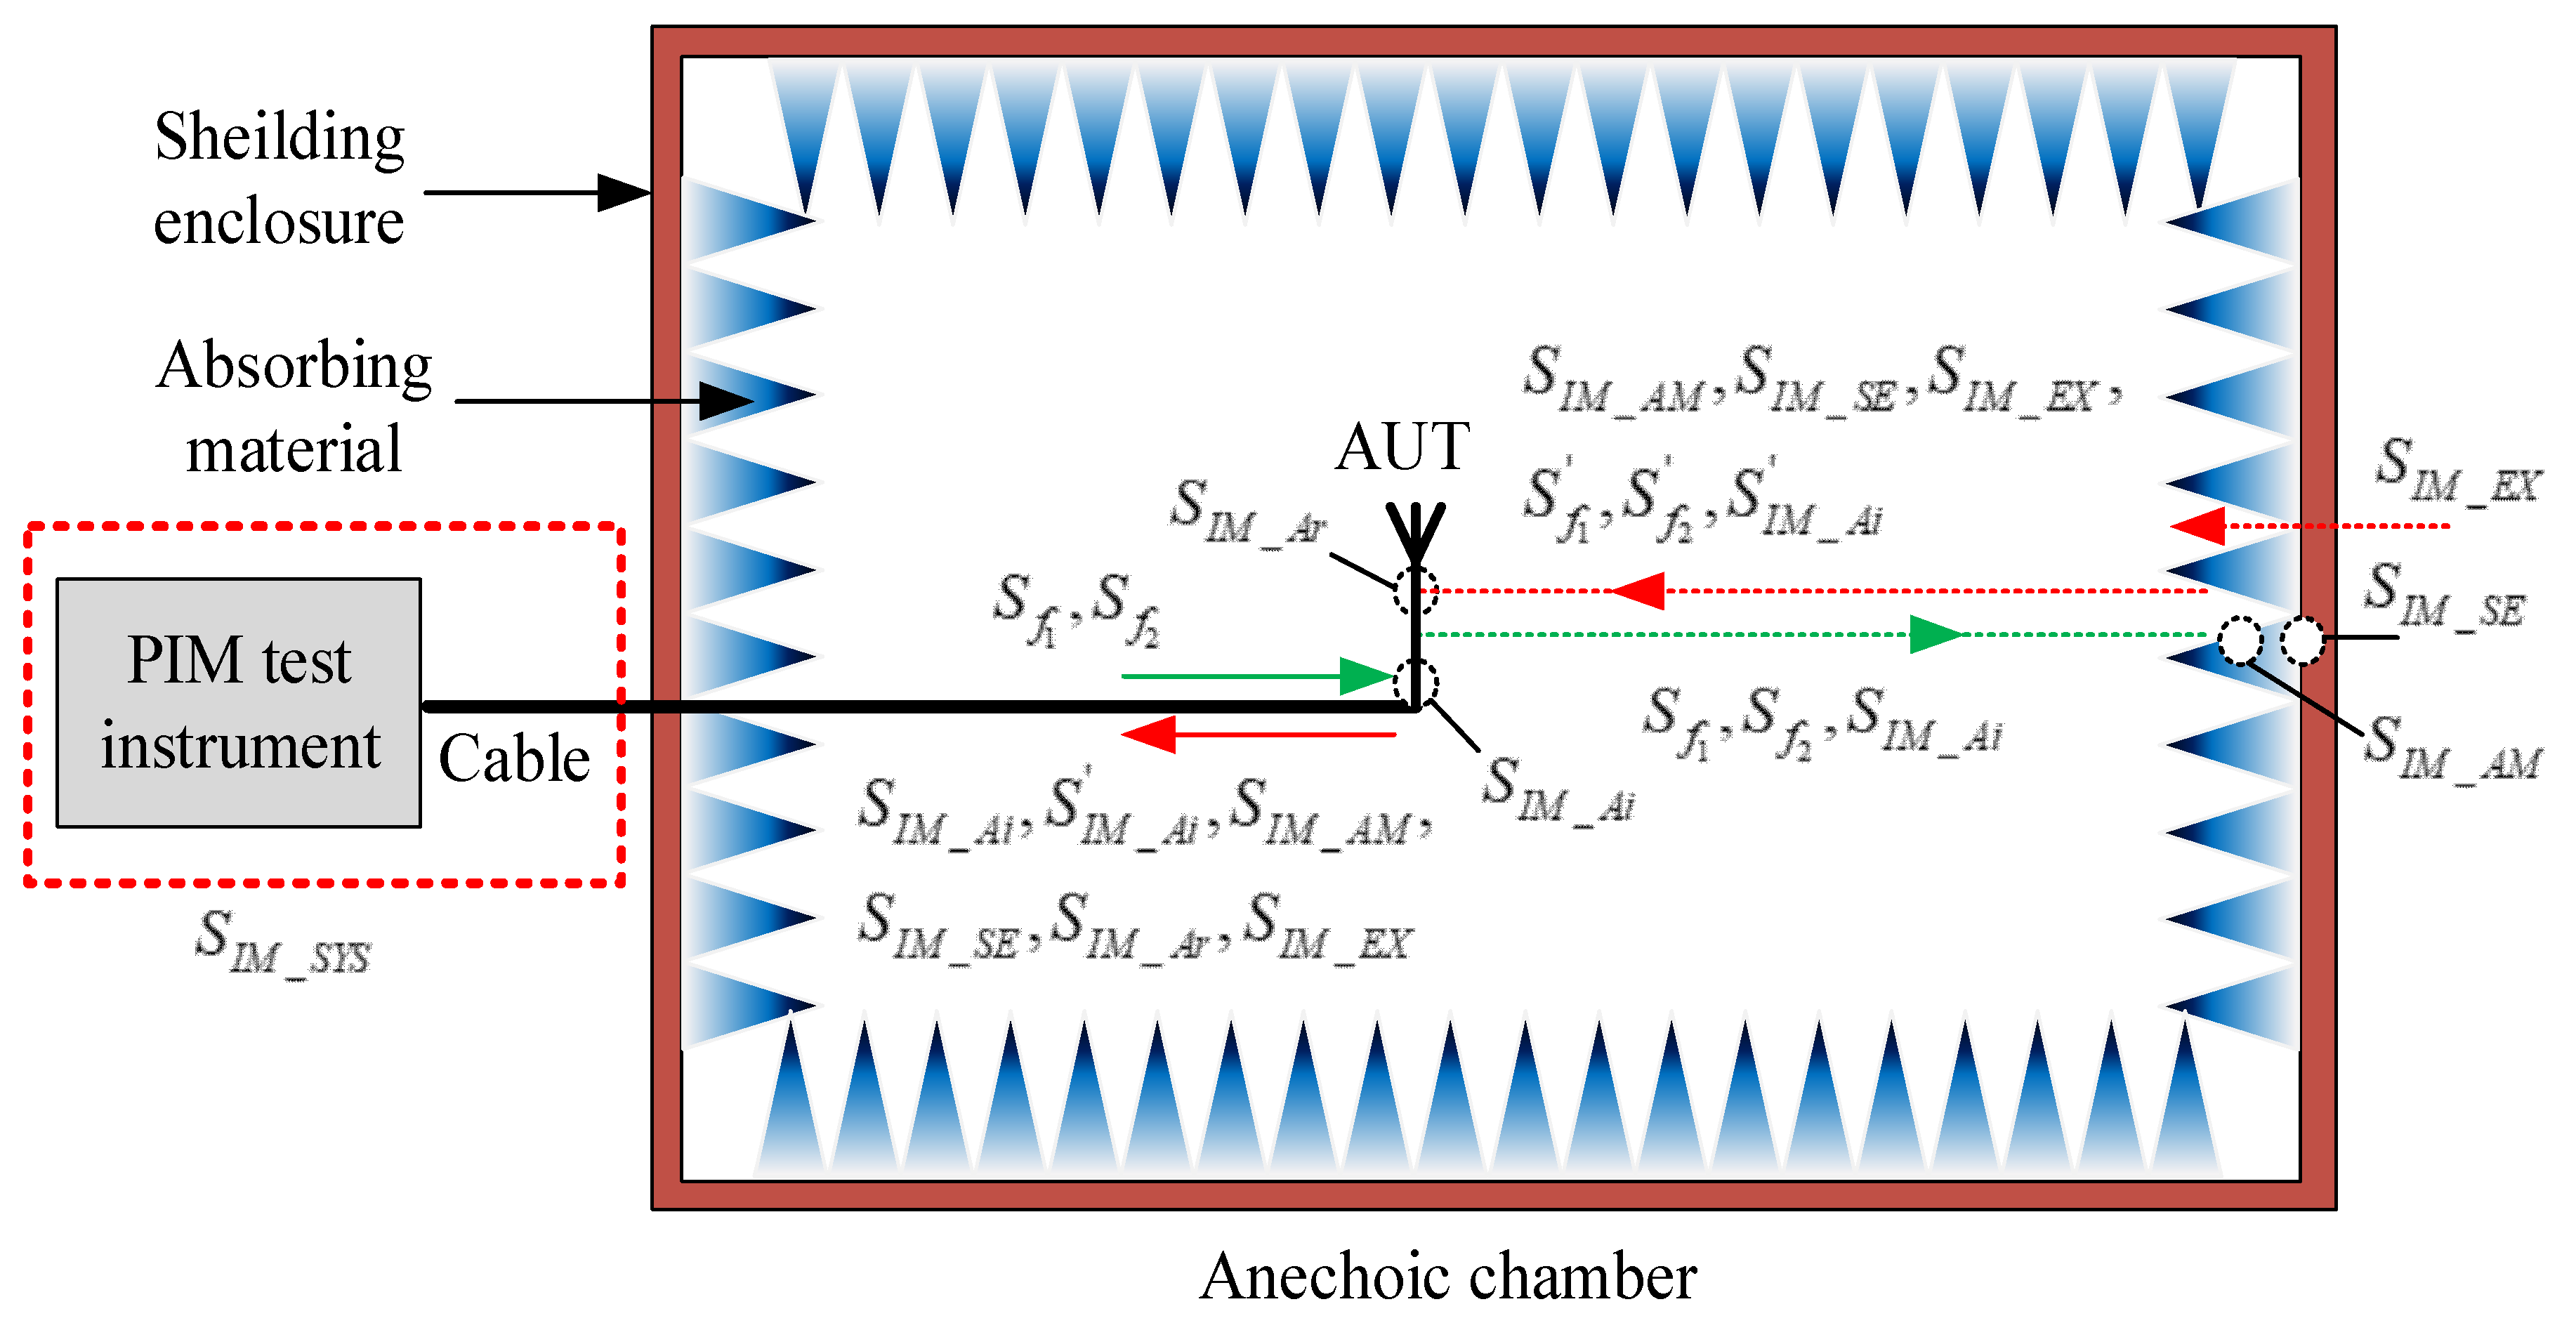
The PIM signals that may be generated during the PIM test is shown in
Figure 2.
and
, are the frequencies of two working signals.
is the PIM signal generated by the AUT as a result of the mixed transmitting signals
and
;
is also generated by the AUT but is a result of the receiving signals
and
;
is the reflected signal of
;
and
are the PIM products generated by the absorbing material and chamber wall, respectively;
is the signal from the outside owing to the ineffective shielding of the anechoic chamber; and
is the PIM signal from the test instrument owing to non-linear devices, such as amplifier, filter, duplexer, cable, and so on.
According to
Figure 2, the PIM level actually measured by the instrument is the sum of all of the aforementioned PIM signals:
where
The symbols in Equation (2) indicate the power level of the corresponding subscripted PIM signals in
Figure 2. Of the seven PIM signals in Equation (2),
is the actual PIM value of AUT, while the others are the sources of error. The value of
is decided by the performance of the PIM test instrument and test cable. The level of the remaining five signals depends on the performance of the PIM measurement chamber. All the PIM signals in Equation (2) will be included in the measurement results.
3. The Method for Evaluating the MMG of a PIM Measurement Chamber
As analyzed previously during the PIM measurement, there are five interference signals in the PIM anechoic chamber, which will increase with increases in the gain of the AUT. Therefore, it is necessary to define the MMG under the corresponding noise floor. The most ideal way to evaluate the performance of a large PIM measurement chamber is to place a low-PIM, high-gain antenna in the quiet zone, rotate the antenna to scan the whole sphere, and measure the PIM value at each location. However, in reality, high-gain antennas usually have complex structures and feeding systems. They will introduce more non-linear factors, such as more solder joints and metal connections, creating even more sources of PIM. It is difficult to achieve a low PIM for a high-gain antenna. Thus, a low-PIM, medium-gain directional antenna can be considered as an alternative.
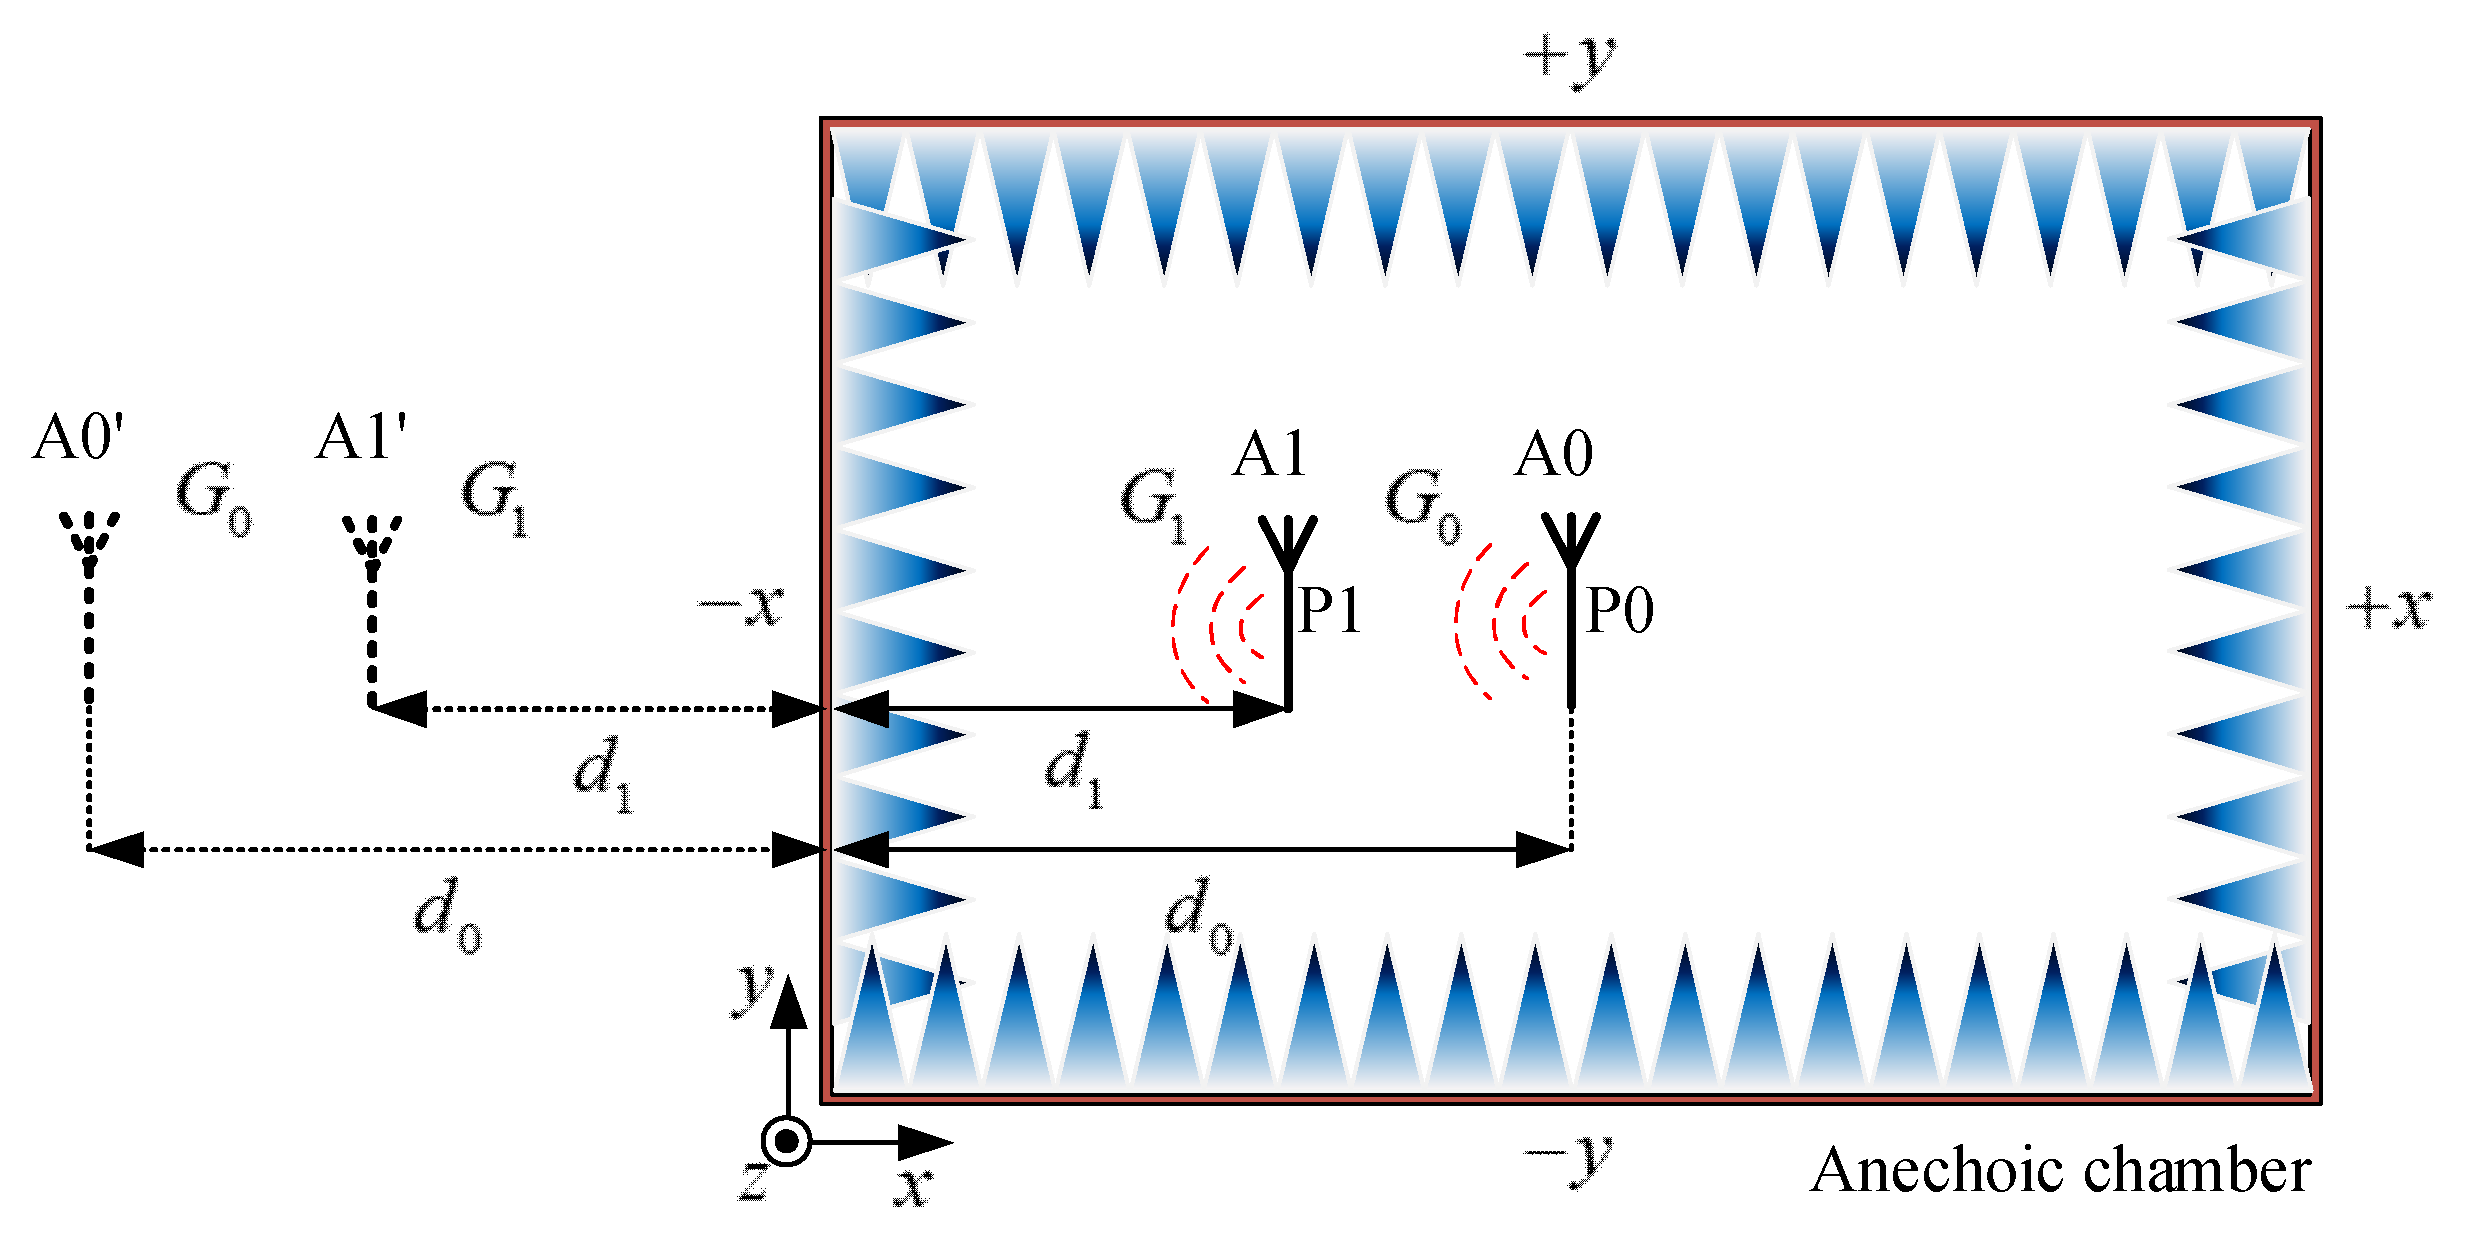
The PIM level that the antenna can receive depends on the received power of the AUT. As shown in
Figure 3, the reflection of the absorbers is small. It is usually ignored when analyzing the reflection level of an anechoic chamber [
7,
28]. Thus, the absorbers can be seen just as a loss constant. In addition, the metal wall of the chamber can be approximated as a total reflection surface. It has a mirror effect. For example, for the antenna
A0, its effect can be equivalent to placing an antenna
A0′ that is the same as
A0 at a symmetrical position of the metal wall and removing the metal wall at the same time [
29]. At this time, the Friis formula can be used:
where
is the transmitting power of the antenna,
is the received power of the virtual antenna, which is equal to the reflected power received by the AUT when there is a metal plane,
and
are the gain of the transmitting antenna and the receiving antenna, respectively,
is the wavelength in free space, and
is the distance between the transmitting and receiving antennas. In the PIM measurement chamber, both the transmitting and receiving antennas are the AUT itself. In other words,
. The absorption loss of the absorbing material needs to be considered. Then, Equation (4) can be modified as:
in which
represents the reflection ratio of the absorbing material. For the same type of absorber,
can be considered to be a fixed value [
7,
30]. Thus, it can be multiplied by Equation (4) as a constant. According to Equation (5), there are three factors affecting the received power of the antenna: the transmitting power, the gain of the antenna, and the distance of the transmitting and receiving antennas. Changes in power will cause changes in the heating effect of the antenna, and changes in temperature will affect the PIM level. Therefore, the transmitting power and antenna gain exert different effects on PIM. A high-gain antenna cannot be created simply by increasing the power. Thus, it is necessary to reduce the distance
to compensate for the received power. In Equation (5), when keeping the transmitting power constant, only
is a variable. As long as
stays the same, an equal amount of power can be received.
As shown in
Figure 3, the position
P0 is the center of the PIM measurement chamber. In reality, the antenna is usually placed at this position for measurement in order to achieve minimal reflection. It is assumed that the PIM of a directional antenna
A0 with a gain of
G0 is measured at position
P0, and that the PIM of a directional antenna
A1’ with a gain of
G1 is measured at position
P1. The main radiation directions of both antennas are toward the
direction. Since most of the energy of a directional antenna is concentrated in the main radiation direction, only the reflection from the
plane needs to be considered, and the reflection from other surfaces can be ignored. Then, Equation (5) can be used in this situation. The following two formulas can be obtained:
Letting
, we can get:
Equation (8) can be written in dB units as:
Obviously , but the received power of the two antennas in the two states are the same. The measured result of A1 at P1 can be equivalent to the measured result of A0 at P0. The purpose of replacing the high-gain antenna with a medium-gain antenna can be achieved. In this case, the received power of the PIM signals and for a high-gain antenna is also can be replaced by a medium-gain antenna due to the reduced path loss. We can also use Equations (6)–(9) approximately. Regardless of the loading effect of the absorbers, the minimum value of is the height of the absorbers. Therefore, the highest gain that can be compensated can be approximated as , where is the height of the absorbers.
Since there are no complicated devices such as probes and turntables in the PIM measurement chamber, replacing the antenna does not introduce other variables that could affect results in the process of moving the antenna except the change in the reflection level owing to distance change.
Since the Friis formula can only be used under the far-field conditions, it is inaccurate using the Friis formula when
where,
is the maximum physical size of the antenna.
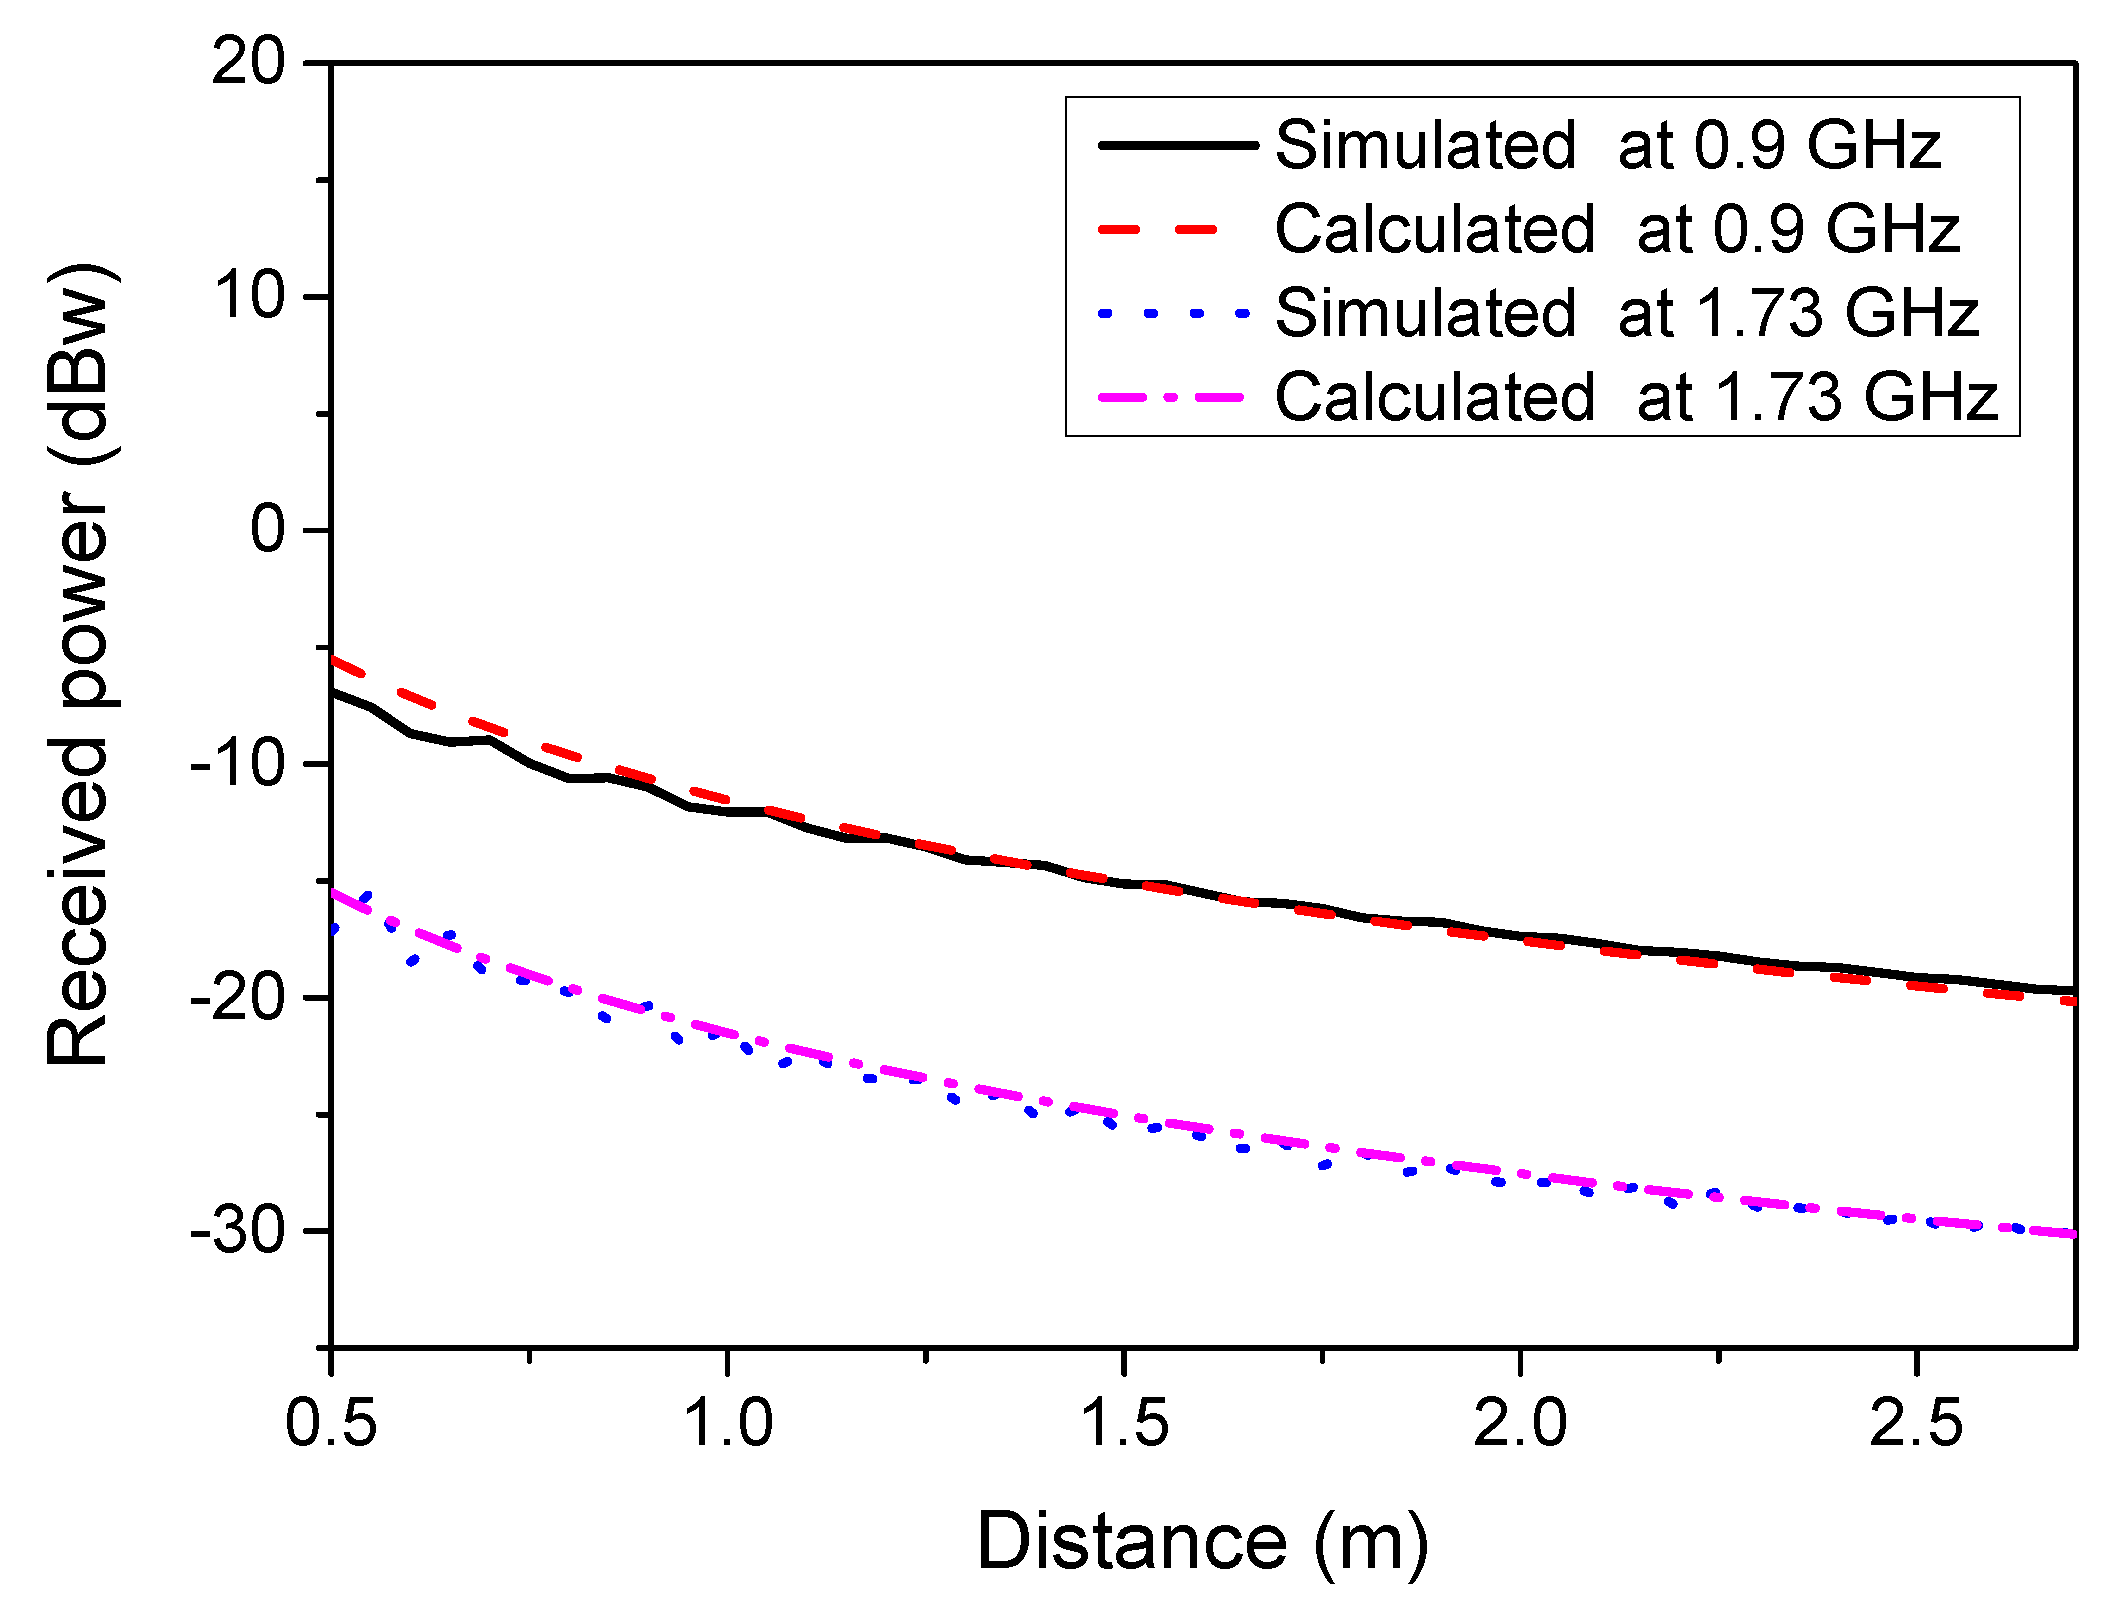
When the distance is short, simulation results can be used to assist the calculation. The simulator used in this paper is the High Frequency Structure Simulator (HFSS).
Figure 4 shows the received power obtained by simulation and calculated by the Friis formula. The horizontal axis is the distance from the transmitting antenna to the receiving antenna. Antennas used in
Section 4 are calculated with a gain of 10.5 dBi at 0.9 GHz and 8 dBi at 1.73 GHz. The transmitted power is set to 0 dBw. Thus, the Friis formula is consistent with the simulation when the distance is long. The Friis formula is less accurate when the distance is short, and the simulated received power can be used to calculate the correct measurement distance
using Equations (6) and (7).
The method of compensating for gain is discussed above, but no method is given to evaluate the residual PIM of the whole chamber. As the placement of the AUT is uncertain during the actual measurements, the direction of radiation is random. The PIM value is closely related to the structure, and small changes in the structure will result in changes in the PIM level. The structural consistency of the absorbers and the shielding enclosures of the chamber at various locations is difficult to ensure. Therefore, the entire anechoic chamber needs to be scanned. In short, the measured results of a single location cannot be used to define the noise floor of a PIM measurement chamber.
Owing to the peculiarity of PIM measurements, it is impossible to use mechanical rotating devices in the PIM measurement chamber (new sources of PIM would be introduced). Only discrete scanning can be achieved. Here, a method is proposed to scan various positions of the PIM measurement chamber based on the main lobe of a low-PIM directional antenna. Since most energy from a directional antenna is contained in the 3-dB main beamwidth, it can be considered that the PIM generated by the other radiation directions of the antenna will be much smaller than the PIM generated by the main lobe radiation. In this way, the worst case of each position in the anechoic chamber can be reflected without major deviations by main lobe scanning.
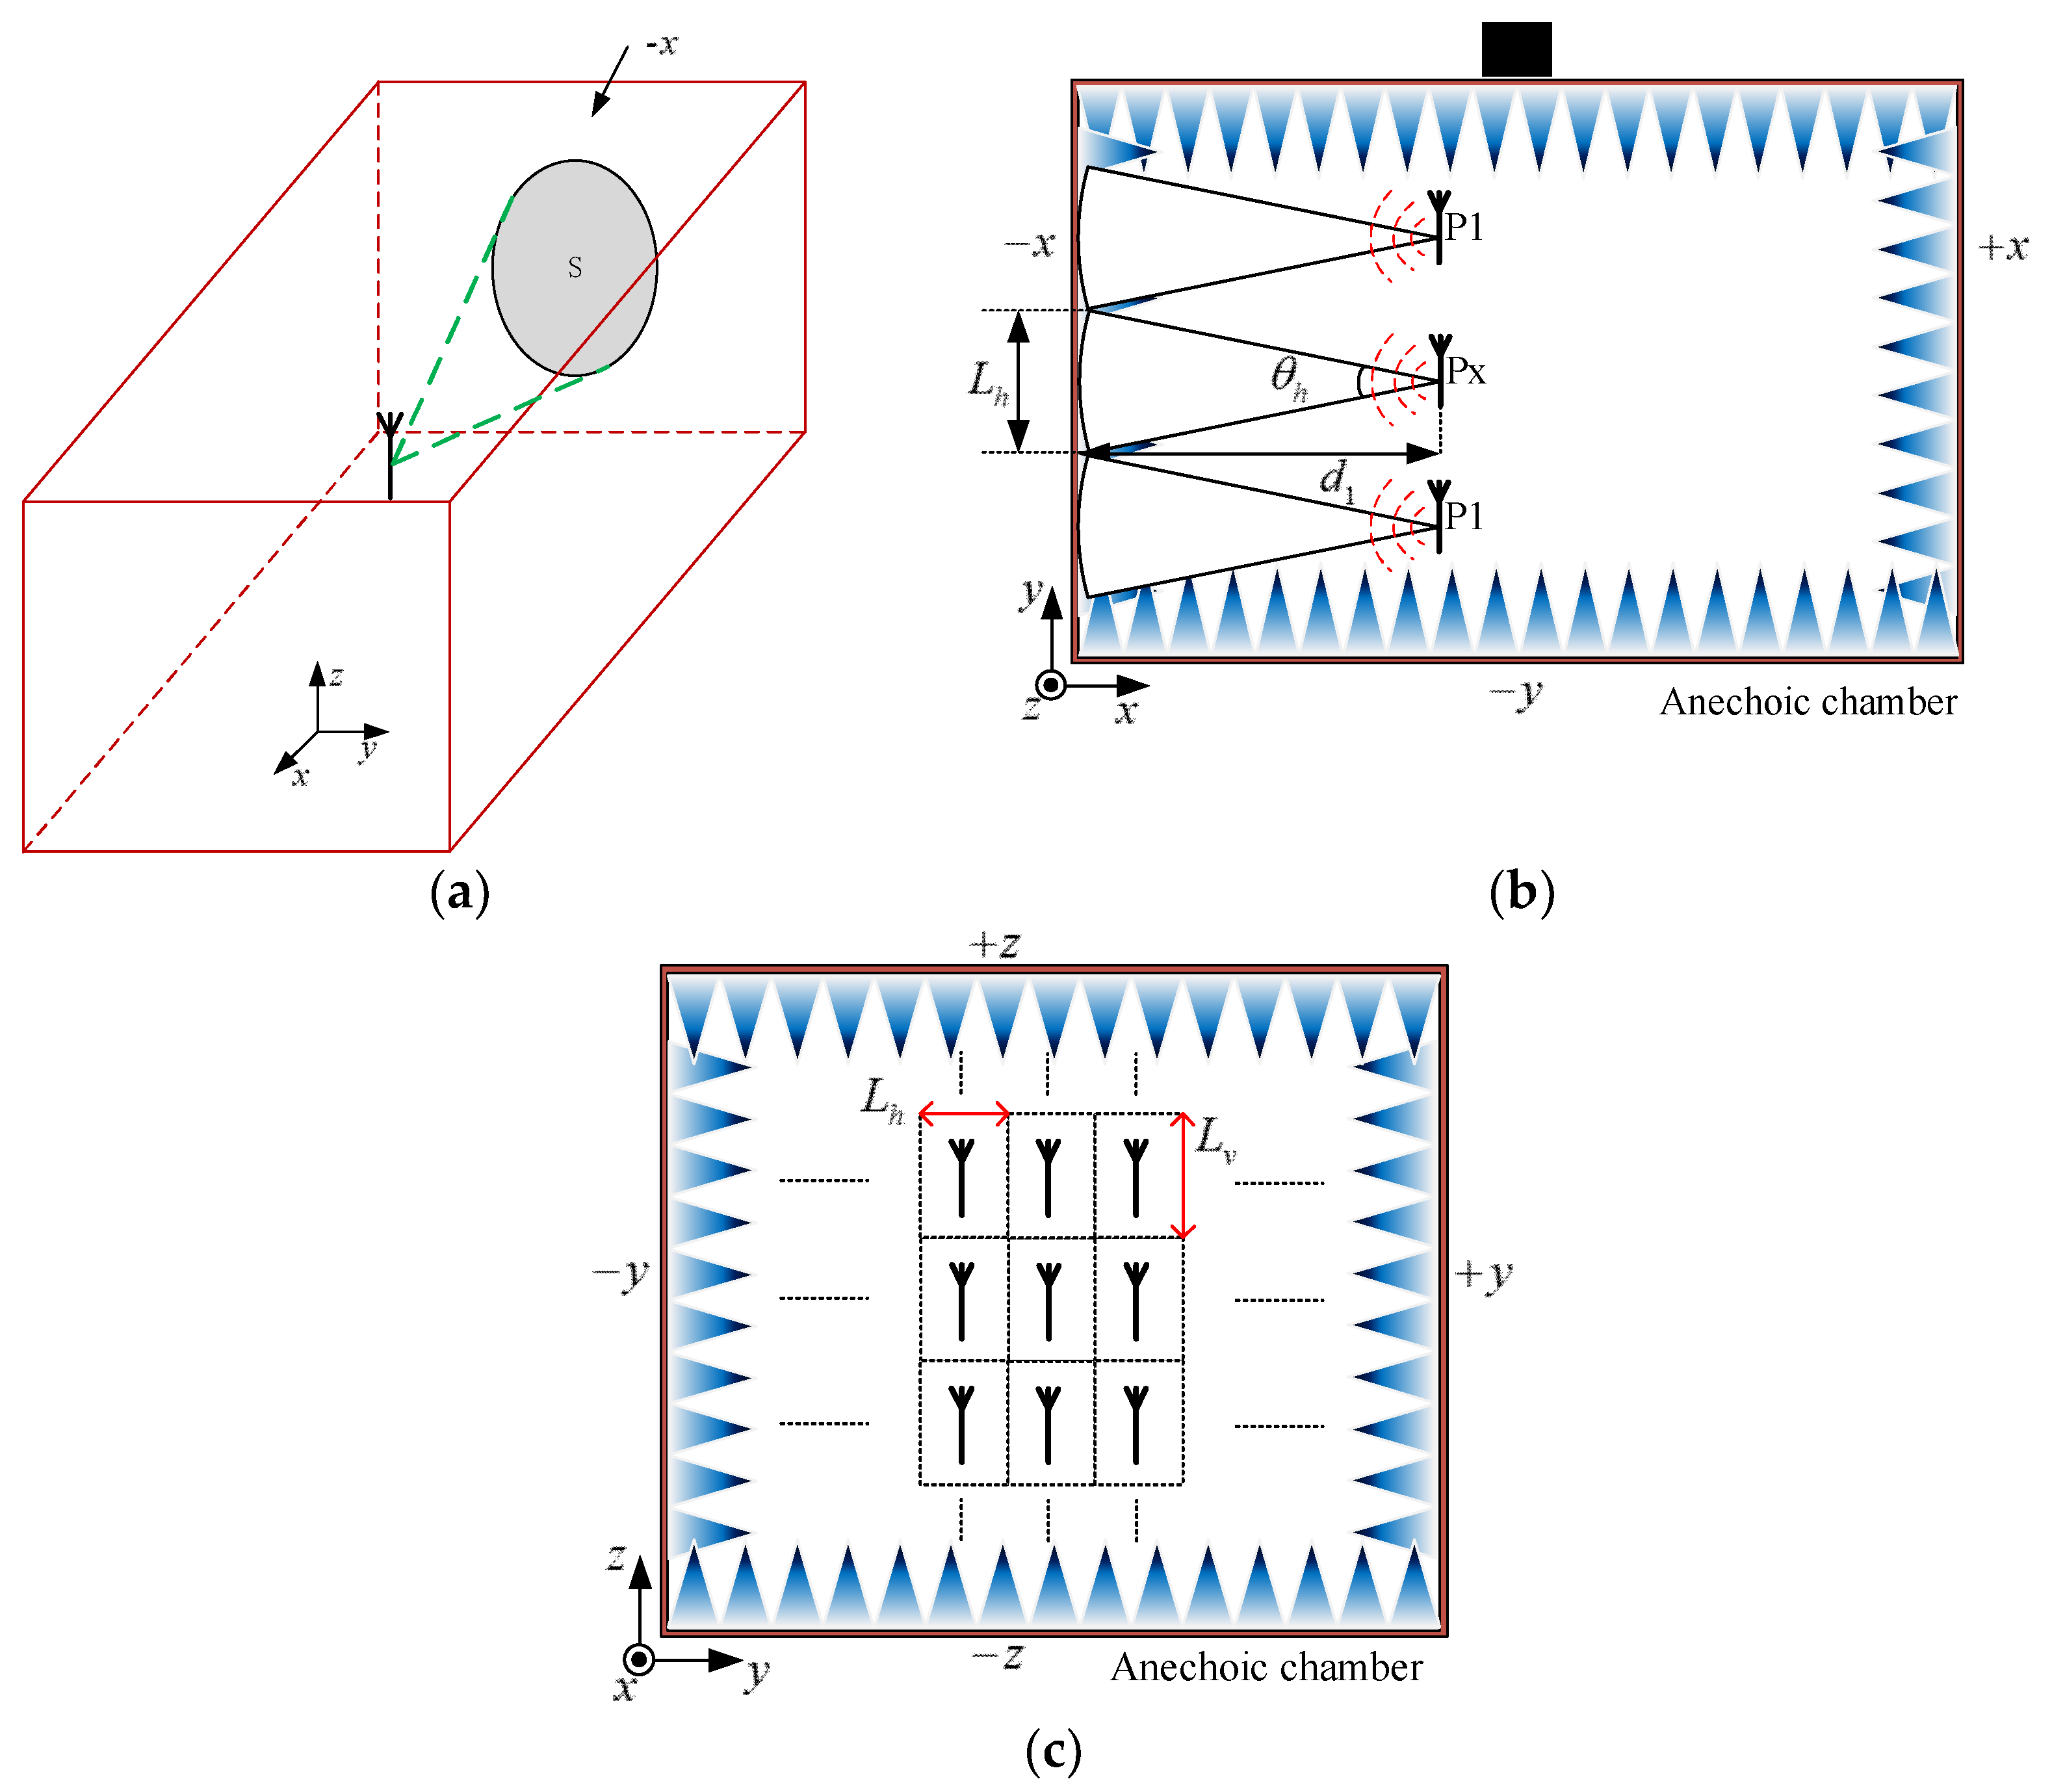
The selection of specific locations for measurement is shown in
Figure 5. Suppose there is a low-PIM directional antenna with a known gain, and the chamber residual PIM level when the AUT gain is
needs to be defined. The equivalent measurement distance
can be obtained according to Equation (9), or simulation results.
is the distance from the antenna to one wall of the chamber. Taking the
plane as an example, the antenna needs to be placed
away from the
plane, and the main radiation direction should be towards the
plane. The projection of the main lobe of the antenna in the
plane is shown in
Figure 5a (marked as S), which is approximately an ellipse. To simplify the actual measurement, a rectangular area can be used instead of an ellipse to represent the main beam coverage of the antenna. The length and width of the rectangle are calculated by the horizontal and vertical 3 dB beamwidth of the antenna, respectively. As shown in
Figure 5b, the horizontal-plane beamwidth of antenna is
. According to the geometric relationships, the following formula can be obtained:
where,
can be seen as the coverage range in the horizontal plane. The measurement interval of the horizontal direction should not be less than this length. Similarly, the measurement interval in the vertical direction should not be less than the following value:
where
is the beamwidth in the vertical plane. Finally, the position to be measured for the
plane is shown in
Figure 5c. The measurement method of the remaining five walls is the same as that of the
plane.
The method for determining the MMG in the PIM measurement chamber is summarized as follows:
- (1)
First determine the PIM noise floor target of the chamber. For example, if the required residual PIM level is lower than −160 dBc at 43 dBm, the directional antenna used for measurement must have a PIM below −160 dBc. During the test, if a measurement higher than −160 dBc appears, it is considered not to meet the requirement.
- (2)
Determine the gain to be measured. The maximum gain to be measured can be directly determined according to the actual application. Generally, a stepping method can be used to determine the MMG. First determine an appropriate gain, and if the measurement results meet the requirements, increase the measurement gain appropriately until a level higher than the target noise floor is detected. Otherwise, decrease the measurement gain until the measurement results are lower than the target noise floor.
- (3)
Calculate the measurement distance according to the gain to be measured, which can be determined according to Equation (9) or simulation results.
- (4)
Determine the measurement positions according to the beamwidth and measurement distance of the antenna. The specific method is described above.
- (5)
If a result higher than the target noise floor appears during the measurement, it is not necessary to continue measuring the remaining positions. It can also be assumed that the results of measurements with an antenna with this gain will be unreliable. Otherwise, the six planes should be measured completely.
In conclusion, a reasonable PIM measurement chamber floor noise index should include the following information: measurement power, measurement frequency, MMG, and a value for the level of PIM.
The phase effect on PIM with multiple PIM sources is not considered here, because the positions of the PIM sources are uncertain. However, if we can get enough results by scanning the entire chamber, we can approximately obtain the highest PIM level of the chamber.
Finally, in order to improve the reliability of the above measurement method, the antenna used should include the following two features in addition to low-PIM and medium-gain. The antenna should have a symmetrical main beam, which can reduce the measurement uncertainty and make the scanning process more convenient. The antenna cannot have a large side-lobe level and back-lobe level, which will cause the antenna to have a large reflection on all sides of chamber, resulting in errors in the gain equivalent method. Generally, the side-lobe and back-lobe should be about 10 dB lower than the main direction level.
4. Experimental Validation
Three experiments are outlined in this section to verify the feasibility of the proposed method. The PIM test instruments used in the experiments are NTPIMD-900DA and NTPIMD-1800DA, which were used for measurements of low frequency (transmitting frequency range from 925 MHz to 960 MHz, and receiving frequency range from 880 MHz to 915 MHz) and high frequency (transmitting frequency range from 1805 MHz to 1880 MHz, and receiving frequency range from 1710 MHz to 1785 MHz), respectively. Correspondingly, two low-PIM antennas were used for testing. The low-frequency antenna can cover 880–960 MHz with a gain of approximately 10.5 dBi and a beamwidth of approximately 55 degrees. The high-frequency antenna can cover 1710–1880 MHz with a gain of approximately 8 dBi and a beamwidth of approximately 70 degrees. They were originally designed as base station units with a PIM lower than −165 dBc at 43 dBm. Measurements were performed in two PIM measurement chambers with different performances to reflect the effectiveness of the evaluation method.
Since the measurement settings can substantially influence the results of measuring PIM, the test process needs to be strictly controlled. First, the placement of the cable could affect the measurement results. During the experiment, it is imperative that the cable is maintained in a straight state without unnecessary bending. Secondly, the tightness of the joint connection also affects the measurements. This uncertainty can be avoided by taking multiple measurements. Reconnect the connector before each measurement, and try to ensure that the connector is sufficiently tight (a torque wrench can be used). Finally, a prolonged measurement will cause the antenna to heat up, which will affect the PIM value. Thus, avoid continuous measurement for more than 5 min. During multiple measurements, you can cool the antenna for approximately 5 min.
It is worth noting that the experiments in this paper are only used to verify the feasibility of the proposed method, and did not follow the steps in
Section 3 to perform a complete scan of the chamber. Complete measurements are very laborious and involve many repetitive tasks. A custom support frame and low PIM cable of the appropriate length are also required to ensure measurement reliability.
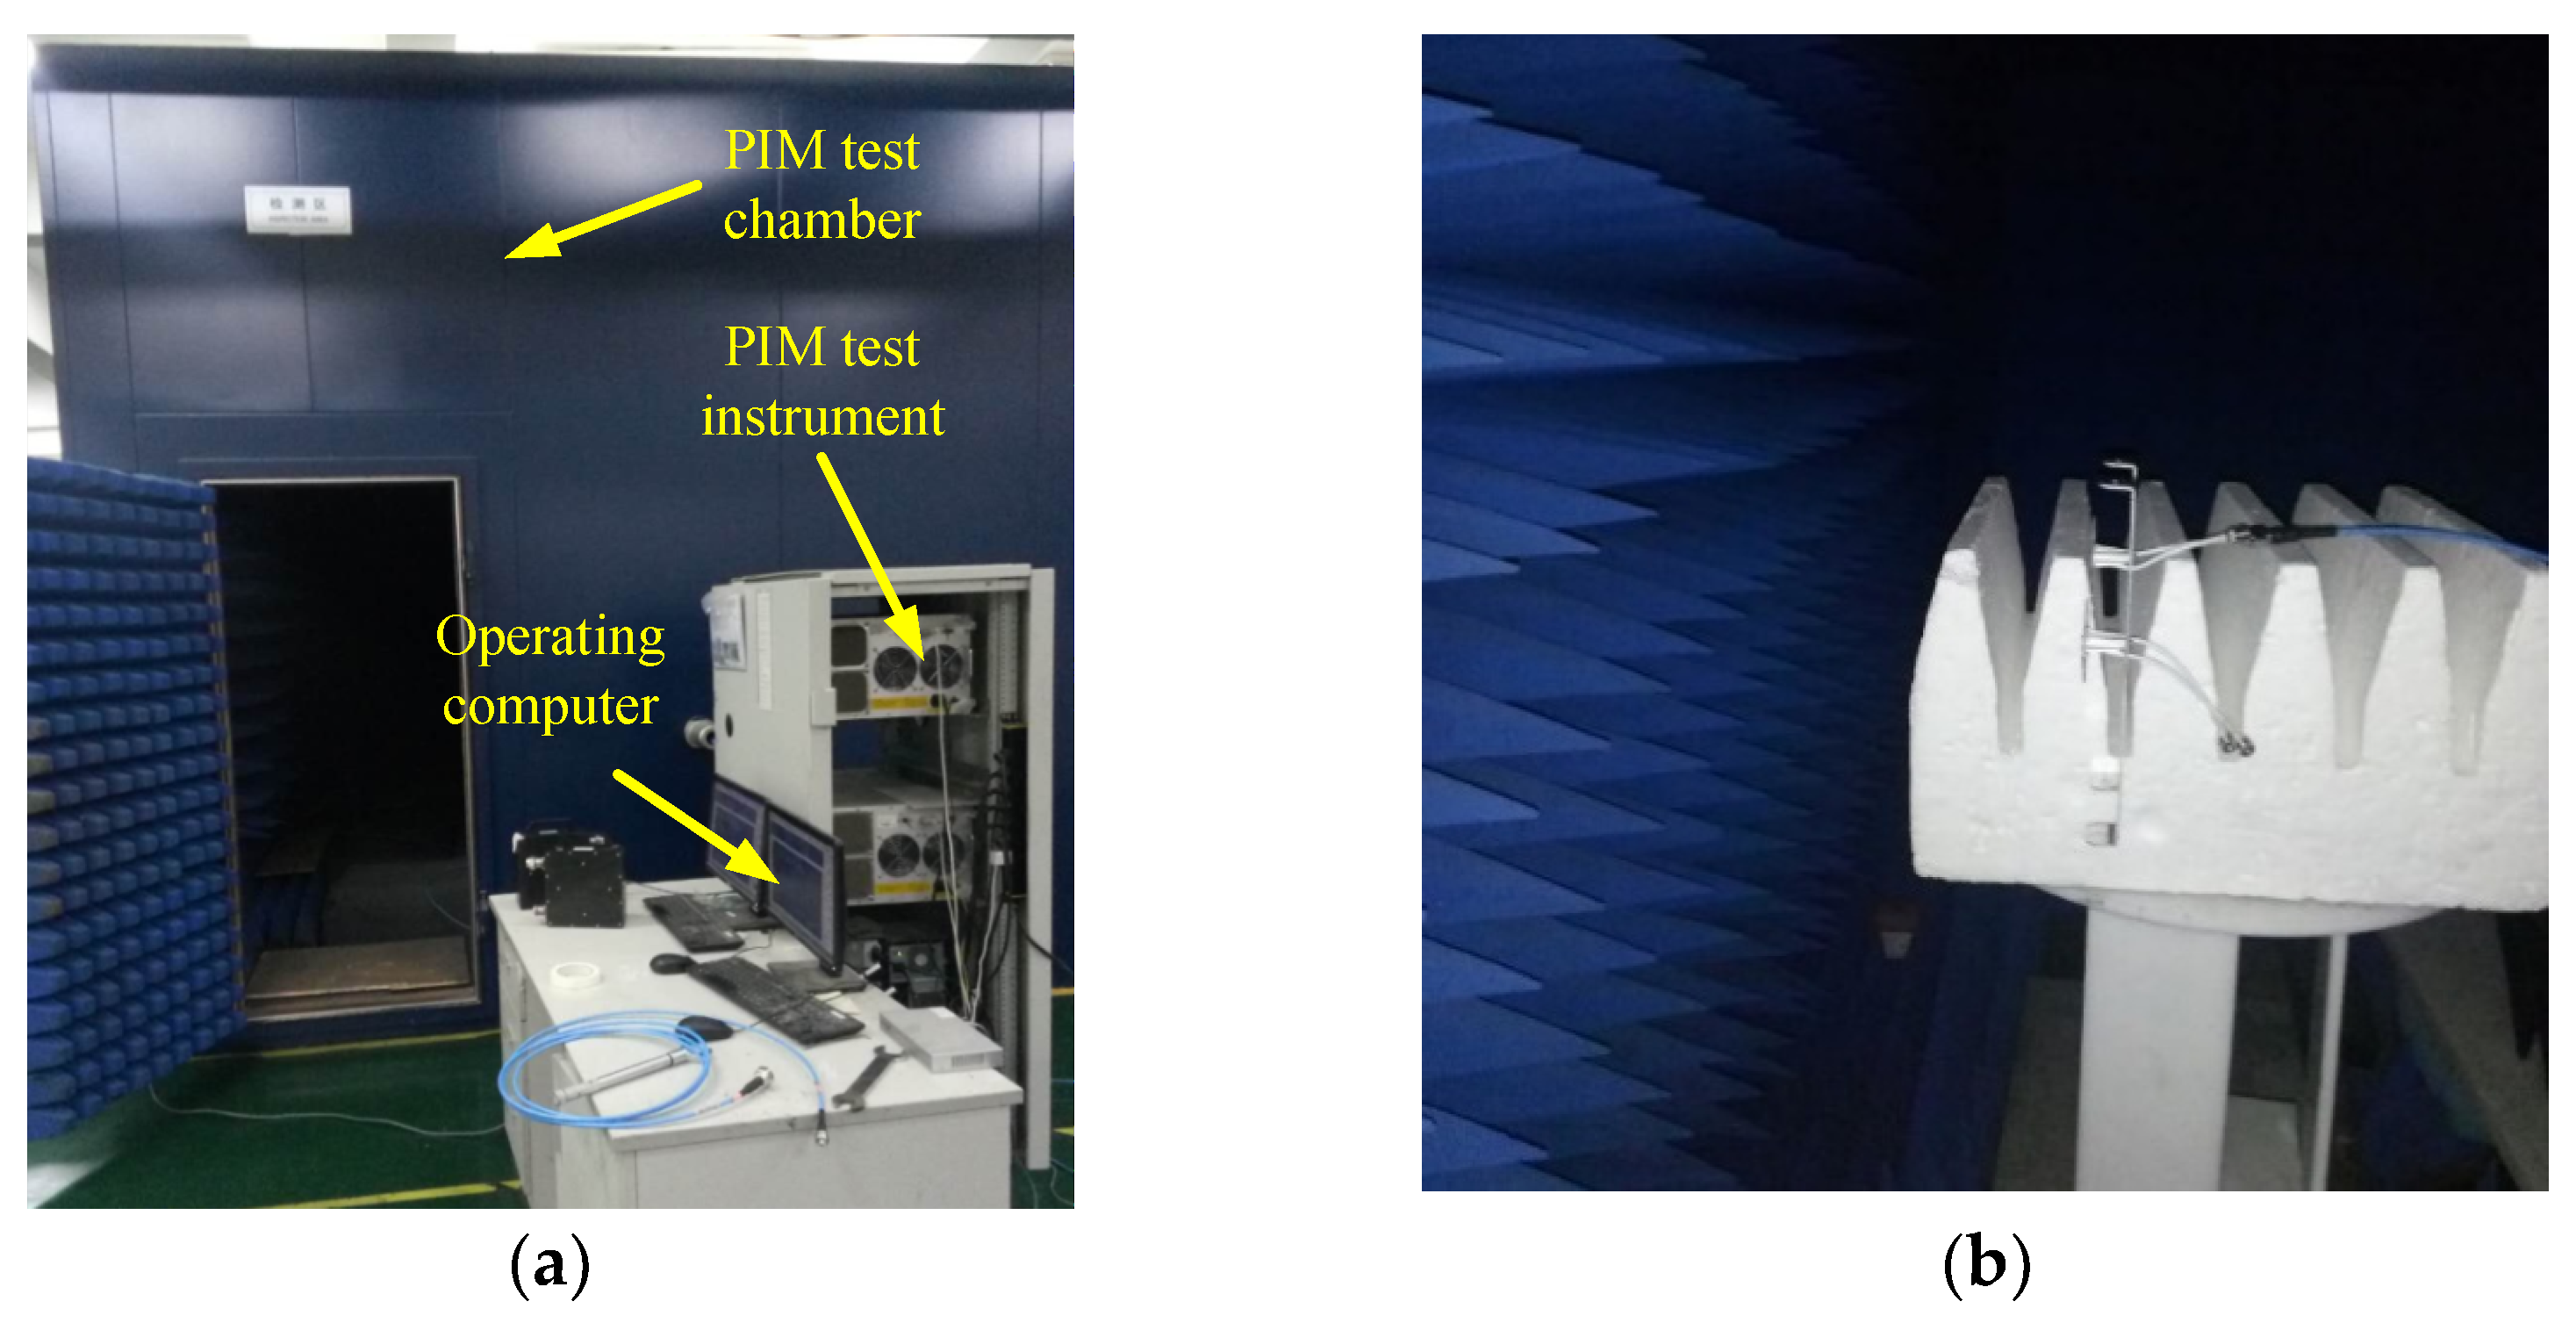
The first experiment was used to verify the feasibility of the method of changing the distance to achieve an equivalently high gain. This experiment was performed mainly in the PIM chamber A illustrated in
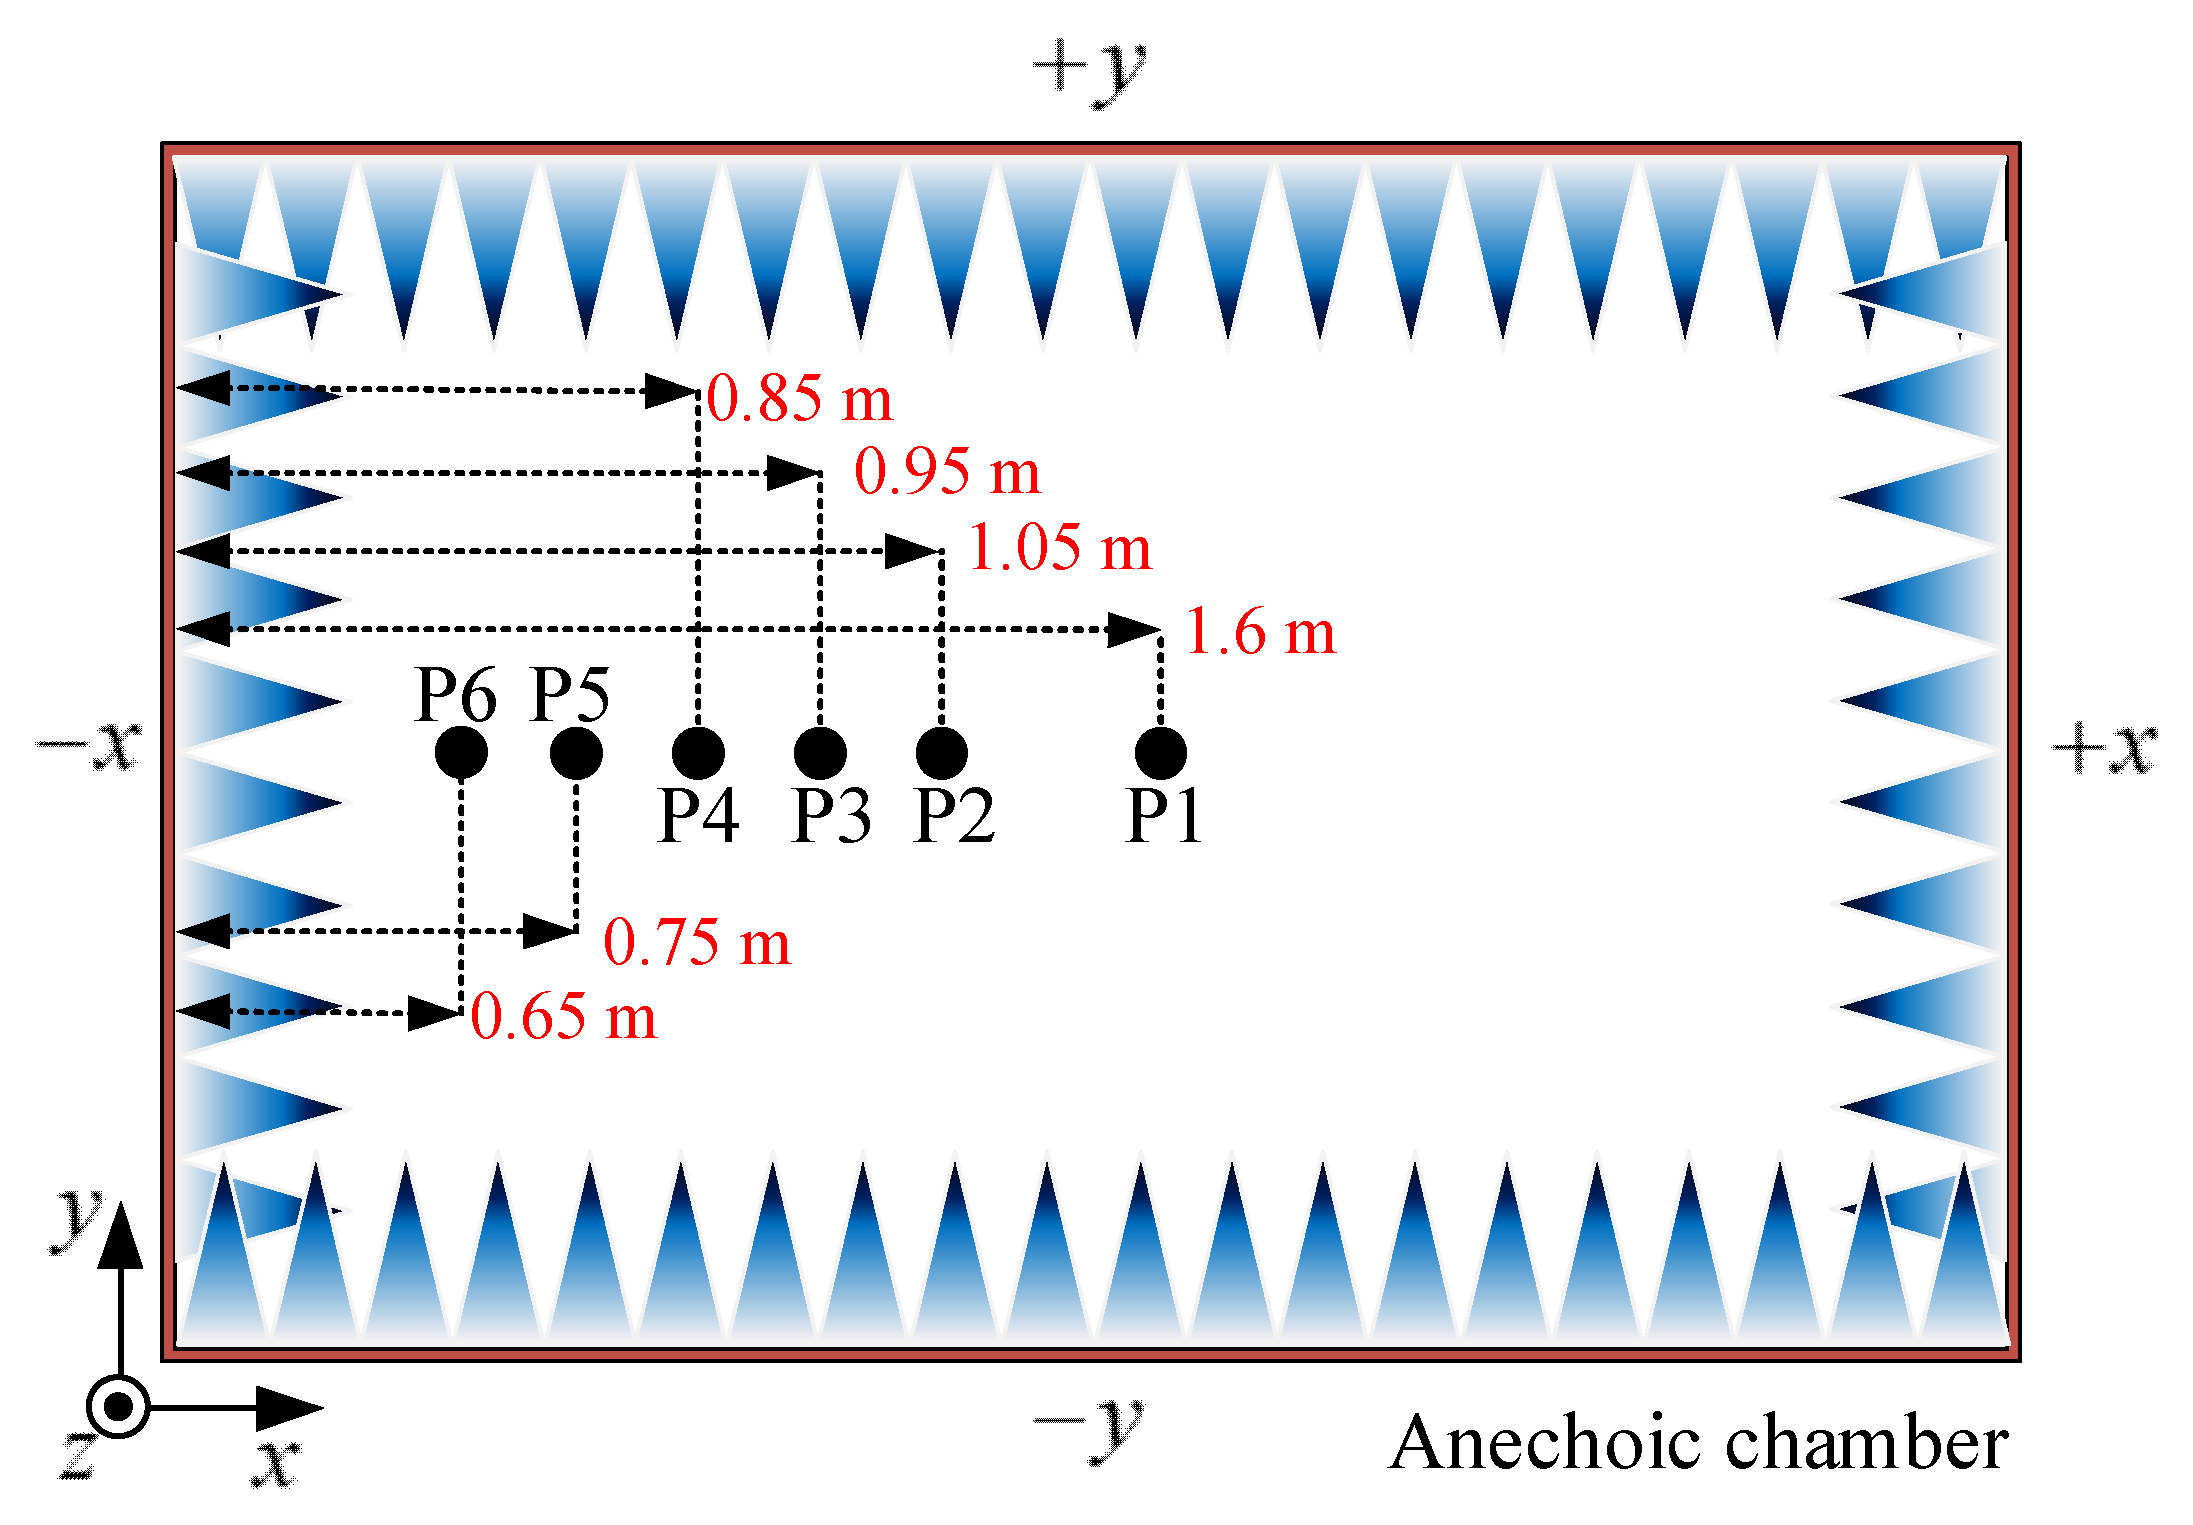
Figure 6a. As the residual PIM level is relatively large in chamber A, the measured results will more clearly reflect the change. As shown in
Figure 7, six points at different distances from one side of chamber A were selected for measurement. The six points are at the same height, and only the position in the
direction is different. The environment within the chamber is shown in
Figure 6b. Each position was measured for PIM values at three different powers. Prior to the measurement, a low PIM load without radiation was measured in the chamber to show the noise level from the test instrument and cables. The low-frequency and high-frequency measurement results are shown in
Table 1 and
Table 2, respectively. The equivalent gain is obtained by using Equation (10). It can be seen that, regardless of the frequency of the antenna, the PIM values increase as the measurement distance decreases. When the measurement distance is changed from 1.6 m to 0.65 m, the PIM level of the antenna increases by approximately 10 dB at 43 dBm (low-frequency increases by 9.98 dB, high-frequency increases by 11.85 dB), which is a large deviation. In the case of low power, the reflected signal is very weak. For example, it may be less than −130 dBm, which is the measurable minimum of the PIM test instrument. This small level will not affect the measurement results. Thus, the change caused by the distance is not obvious. These results are consistent with the analysis in
Section 3. That is, when the distance is reduced, the received power of the antenna increases, and a higher PIM level is received. It can be seen from the results of the measurements that chamber A may result in errors when measuring a high-gain antenna. For example, an antenna with a gain of 13 dBi at 900 MHz needs to be measured at 43 dBm, while the PIM index requirement is lower than −160 dBc. Any antenna that meets the index does therefore not meet the requirements, as the noise of the chamber itself is greater than −160 dBc in this situation.
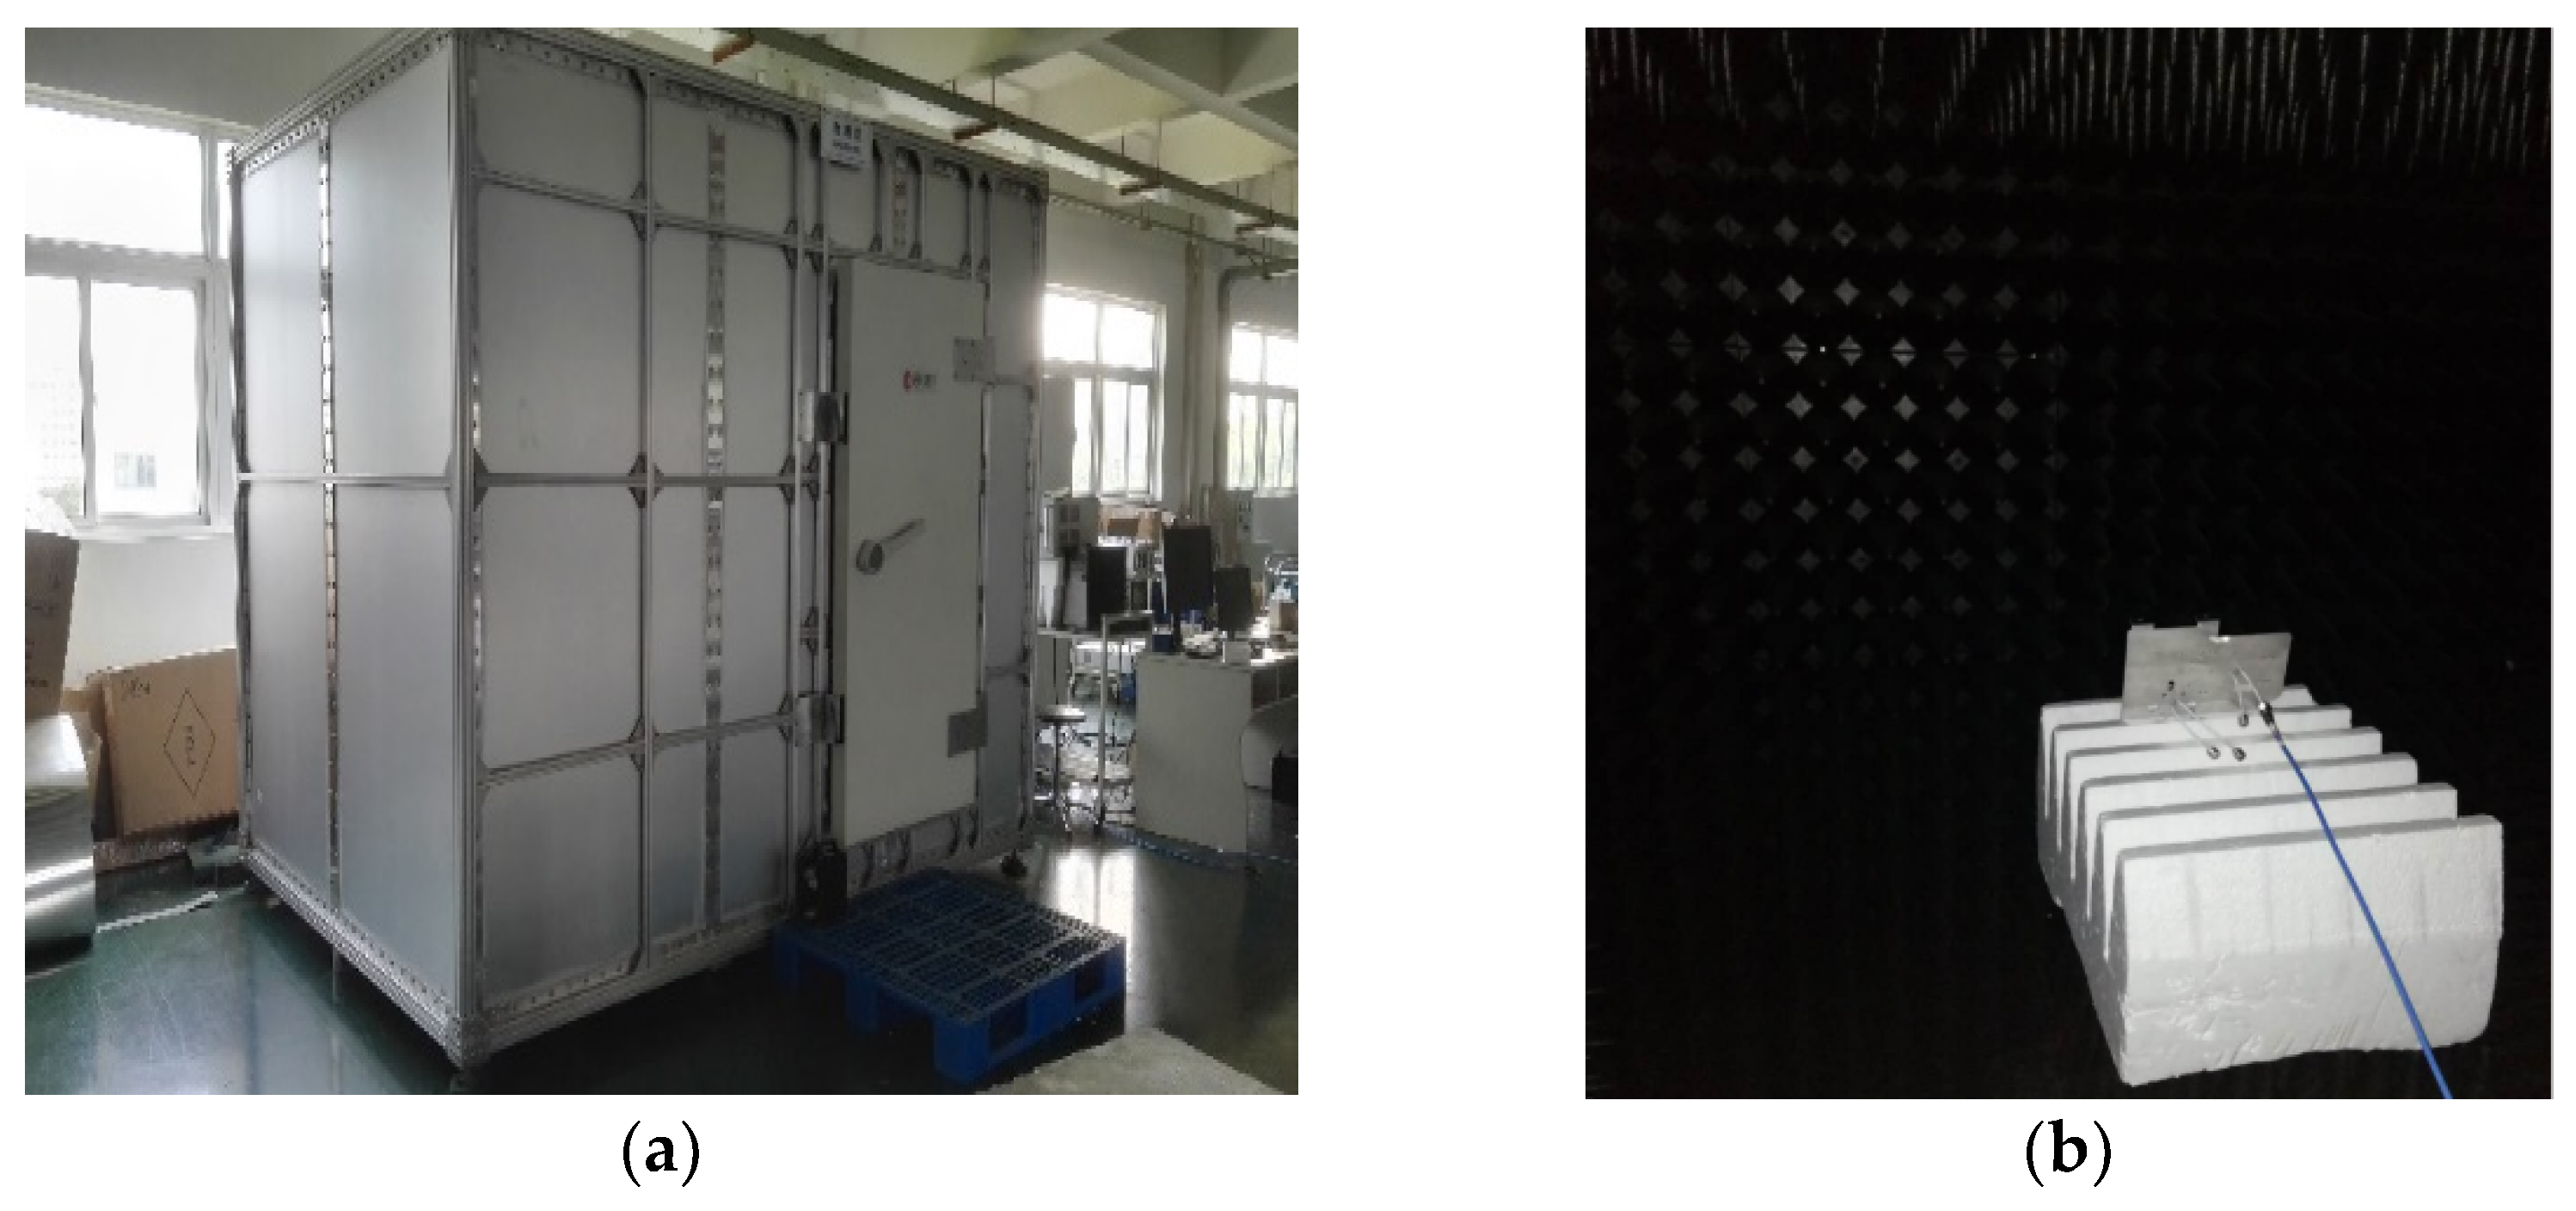
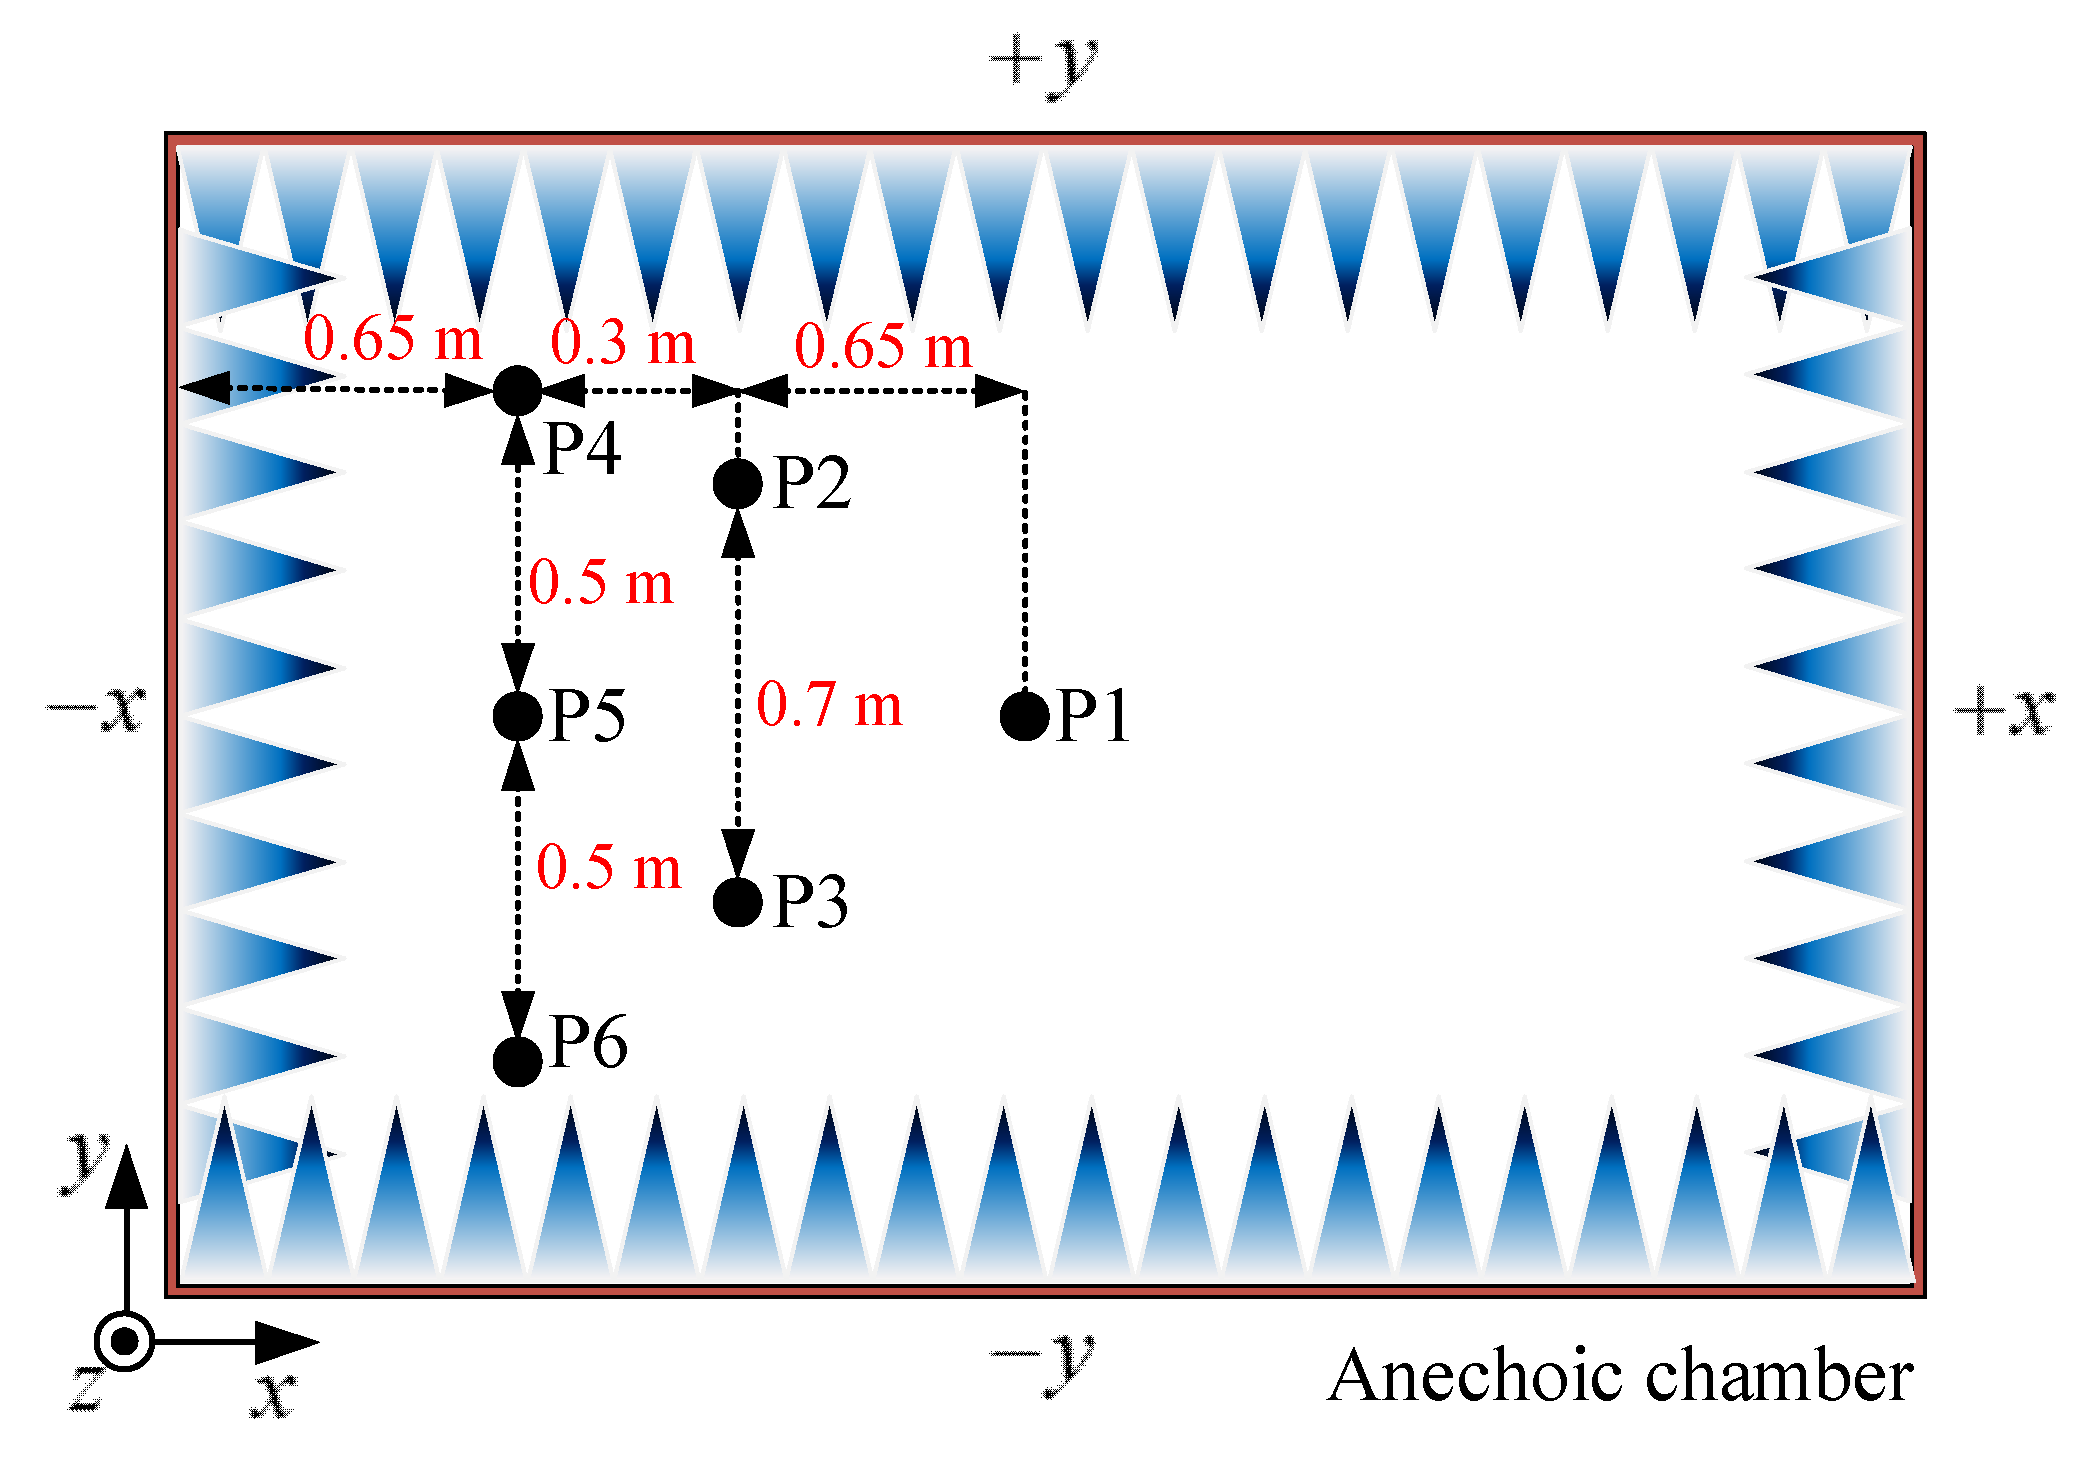
The second experiment was performed in the PIM measurement chamber B (
Figure 8), mainly for comparison and auxiliary verification. The six points shown in
Figure 9 are selected for measurement. The six points are at the same height. Three different distances can be chosen to compare with the results of chamber A. The PIM values at different positions at the same distance were measured for auxiliary verification. The measurement intervals 0.7 m and 0.5 m at the corresponding distances meet the requirements of Equation (12). The measurement setup is shown in
Figure 8b, while the results of measurements are shown in
Table 3 and
Table 4. Owing to the low PIM design of the shielding enclosure and the absorber [
7], the residual PIM level in chamber B is very small. It is evident that the measured PIM values of the six positions exhibit only small differences (less than 1.5 dB) and do not show the distance effect. These small differences can be considered as measurement error. It can thus be considered that chamber B provides more accurate measurements than chamber A when measuring antennas with high gain, such as 14 dBi.
It may be confusing that the measured results do not follow the typical relationship between the third-order PIM and the input power (with a slope of 2–3 dB/dB typically). The differences between the average values of the measurement results P1~P6 and the measurement results of the low PIM load are listed in
Table 3 and
Table 4. It can be seen that all the values are less than 2dB, indicating that the PIM value of the antenna used is close to the low PIM load. The true PIM value of antenna is lower than the system noise floor (for example −135 dBm). Therefore, the measured data is dominated by the system noise and the measurement error caused by configuration. In this case, the typical relationship between PIM level and input power cannot be reflected in the measurement results.
It can be seen from the two experiments that the method of measurement proposed herein can indeed obtain different PIM values at different distances. Furthermore, it can differentiate corresponding effects in chambers with different performances, which indicates that the method proposed here is effective.
The last experiment measured a high-gain antenna, with a gain of 16 dBi, at positions P1 in the two PIM measurement chambers in order to verify the reliability of the measurement results. The measured power is 43 dBm, and the antenna works at approximately 900 MHz. According to the test results of the two experiments outlined above, it is evident that chamber A will yield errors when measuring the 16 dBi antenna. Although the performance of the 16 dBi antenna was not verified in chamber B, the results show that the measurement results will be superior to those of chamber A. The results of measurements from the third experiment are shown in
Table 5. An outdoor measurement is used for comparison. It is evident that the measured level of PIM in chamber B is significantly lower than that of chamber A (by approx. 10 dB). The fluctuation error of the instrument is not considered for PIM measurements, and the result would only increase as a result of interference. Thus, a lower PIM measurement is definitely more accurate. The last experiment demonstrates that chamber A results in a larger error when measuring a high-gain antenna, as was expected. This indirectly illustrates the effectiveness of our proposed method for the equivalent estimation of measurable gain.
Finally, we believe that the accuracy of the proposed measurement method for MMG is close to the accuracy of the single antenna method, which is approximate ± 0.5 dB [
31], since the proposed method is derived from the single antenna method. Further study of the accuracy will be conducted in future work.
