Article

Economic and Ecological Design of Hybrid Renewable Energy Systems Based on a Developed IWO/BSA Algorithm

1
Department of Electrical Engineering, Mohammadia School of Engineers, Mohammed V University in Rabat, Ibn Sina Street P.B 765, Rabat 10090, Morocco
2
Department of Electrical Engineering, Faculty of Engineering, Aswan University, Aswan 81542, Egypt
3
LERMA Laboratory, Engineering for Smart and Sustainable Systems Research Center, Mohammadia School of Engineers, Mohammed V University in Rabat, Ibn Sina Street P.B 765, Rabat 10090, Morocco
4
Department of Electrical Engineering, College of Engineering, Majmaah University, Al-Majmaah 11952, Saudi Arabia
5
Department of Electrical Engineering, Unaizah College of Engineering, Qassim University, Unaizah 56453, Saudi Arabia
6
Department of Electrical and Electronic Engineering, Yanbu Industrial College, Yanbu 46452, Saudi Arabia
*
Author to whom correspondence should be addressed.
Electronics 2021, 10(6), 687; https://doi.org/10.3390/electronics10060687
Submission received: 8 February 2021 / Revised: 7 March 2021 / Accepted: 8 March 2021 / Published: 15 March 2021

Abstract

:
In this paper, an optimal design of a microgrid including four houses in Dakhla city (Morocco) is proposed. To make this study comprehensive and applicable to any hybrid system, each house has a different configuration of renewable energies. The configurations of these four houses are PV/wind turbine (WT)/biomass/battery, PV/biomass, PV/diesel/battery, and WT/diesel/battery systems. The comparison factor among these configurations is the cost of energy (COE), comparative index, where the load is different in the four houses. Otherwise, the main objective function is the minimization of the net present cost (NPC), subject to several operating constraints, the power loss, the power generated by the renewable sources (renewable fraction), and the availability. This objective function is achieved using a developed optimization algorithm. The main contribution of this paper is to propose and apply a new optimization technique for the optimal design of a microgrid considering different economic and ecological aspects. The developed optimization algorithm is based on the hybridization of two metaheuristic algorithms, the invasive weed optimization (IWO) and backtracking search algorithm (BSA), with the aim of collecting the advantages of both. The proposed hybrid optimization algorithm (IWO/BSA) is compared with the original two optimization methods (IWO and BSA) as well as other well-known optimization methods. The results indicate that PV/biomass and PV/diesel/battery systems have the best energy cost using the proposed IWO/BSA algorithm with 0.1184 $/kWh and 0.1354 $/kWh, respectively. The best system based on its LCOE factor is the PV/biomass which represents an NPC of 124,689 $, the size of this system is 349.55 m2 of PV area and the capacity of the biomass is 18.99 ton/year. The PV/diesel/battery option has also good results, with a system NPC of 142,233 $, the size of this system is about 391.39 m2 of PV area, rated power of diesel generator about 0.55 kW, and a battery capacity of 12.97 kWh. Otherwise, the proposed IWO/BSA has the best convergence in all cases. It is observed that the wind turbine generates more dumped power, and the PV system is highly suitable for the studied area.

1. Introduction

Increasing power demand is a logical result of the significant increase in the world population and their energy consumption and industrialization growth. Distributed systems-based-renewable energy resources appear as a practical solution compared with the traditional energy resources due to the advantages of using such renewable sources. A microgrid is a distribution system consisting of hybrid energy sources dedicated to meet a particular need for electrical energy. A microgrid can be isolated from the utility in most cases; otherwise, it can be connected to the network when the microgrid owner needs more power flexibility. The authors of [1] presented the major issues regarding the motivations and benefits of adopting hybrid renewable energy systems (HRES), mainly in sub-Sahara Africa. Different renewable energy systems that can be adopted for HRES applications for both on-grid and off-grid consumers were proposed and discussed. Detailed design and modeling of an isolated HRES have been presented in [2], including traditional and renewable energy resources using meta-heuristic algorithms. Additionally, the technical and ecological factors have been considered. Other pertinent review research, such as microgrid transactive energy [3], optimal smart energy coordination in the microgrid applications [4], multi-agent microgrid management system for single-board computers [5], and peer-to-peer energy trading in micro/mini-grids for local energy communities [6], statistical analysis of PV/wind HRES have been presented in [7].
Investing in renewable energy systems is not an easy issue as it has several aspects, including the economic aspect, which have emerged as a result of the global economic crises and the technical aspects related to the stability and continuity of energy supply from renewable sources, especially the sources which depend on variable environmental conditions (wind, sunlight).
The first and vital obstacle that must be avoided is to find the best design of the system. The optimal design of microgrid means that the project owner should evaluate the whole region and all sources available. Consequently, the design should be economical and follow many technical aspects and environmental criteria.
In the literature, many studies were presented for several locations, each promoting its appropriate system. In [8], the authors implemented different recent algorithms—whale optimization algorithm (WOA), water cycle algorithm (WCA), moth-flame optimizer (MFO), and hybrid particle swarm-gravitational search algorithm (PSOGSA)—to design a PV/wind/diesel/battery microgrid system through minimizing the cost of energy and increasing the reliability and efficiency of the system. In [9], the authors focused on wind/biomass/diesel/battery stand-alone microgrids and discussed the system operation, energy management, and dispatch issues in detail. In [10], the authors designed a microgrid system with the same load in two different countries to assess the effect of the metrological conditions and compare the cost of energy for both systems. An optimization algorithm to reduce the operational cost of a hybrid residential microgrid consisting of a diesel generator, WT and PV array, and battery energy storage system has been presented in [11]. In [12], the authors applied a grasshopper optimization algorithm to design an autonomous microgrid system containing PV/WT/battery/diesel generator. The reliability is studied using the deficiency of power supply probability (DPSP) factor, while the GOA has been compared with PSO and cuckoo search. The firefly algorithm has been used to find the optimal hybrid system configuration to feed three un-electrified remote villages [13]. The optimization method presented for minimizing the cost of energy considering the loss of load probability (LOLP) reliability index for a hybrid PV/WT/battery system. In [14], the optimal sizing of the hybrid renewable energy system (HRESs) in a remote area composed of PV/WT/battery/diesel has been developed using the social spider optimizer algorithm. The social spider optimizer (SSO) algorithm has been compared with many algorithms including Harris Hawks optimizer (HHO), grey wolf optimizer (GWO), multi-verse optimizer, antlion optimizer (ALO), and whale optimization algorithm. The IWO and BSA have been used to solve many problems, such as the unit commitment (UC) [15] and the economic environmental power dispatch problems [16]. Likewise, the IWO and BSA have been hybridized many times with other algorithms to get better performance. The IWO has been hybridized with IPSO for mobile robot’s navigation in a dynamic environment [17]. Also, it has been hybridized with the WDO algorithm for nulling pattern synthesis of uniformly spaced linear and non-uniform circular array antenna [18]. Otherwise, the BSA has been hybridized for permutation flow-shop scheduling problem [19].
Despite the development and continuous improvement in the optimization techniques, there are still continuous attempts to achieve better results by updating the existing optimization algorithms, proposing new optimization algorithms, inspired by biological or social behaviors, or hybridizing more than one algorithm advantages of all of them. In [20], a hybrid algorithm of Jaya and teaching–learning-based optimization (JLBO) named the JLBO algorithm has been proposed for the optimal unit sizing of the hybrid PV/WT/battery system to feed electricity to a remote area. In [21], a modified bonobo optimizer (BO) algorithm has been proposed to have more ability in exploitation and exploration phases. The developed version is called the quasi-oppositional BO (QOBO). The developed algorithm has been introduced to design several scenarios for the HRESs. In [22], a modified crow search algorithm (CSA) has been proposed for optimizing a hybrid PV/diesel/PHS system, considering the fuel consumption as an objective function. The proposed approach has been compared with the particle swarm optimization, genetic algorithm, and the original CSA. A multi-objective-based optimization algorithm called BOACA has been proposed in [23], to reduce cost, emissions and find the best configuration of HRESs. The results obtained by BOACA have been compared with GA, PSO, and HOMER. In [24,25], the multi-objective evolutionary algorithm has been applied for the optimal design and the optimal allocation of the HRES, respectively. In [26], the optimal design and operating schedule has been presented to meet the energy demand of Pantelleria island. In [27], a modified particle swarm optimisation algorithm has been proposed for energy management of microgrid under uncertain environments. In [28], a mathematical approach has been developed to assess the potential of electricity production, exploiting from the available sources such as solar, wind speed, and sea wave in the Balearic and Fiji islands. In [29], HOMER has been used to investigate the techno-economic feasibility analysis of several HRES in Pratas Island (Taiwan). In [30], HOMER has been used to design an optimal HRES in Muhavoor, India. Several configurations have been considered based on PV, WT, diesel and battery. In [31], HOMER has been used to design a HRES of PV, WT, diesel and battery to avoid the diesel emission problems in Malaysia. In [32], a novel energy-economic-environmental multi-criteria decision framework has been developed for a HRES optimization. In [33], a mathematical model has been proposed to get the optimal energy mix in Lampedusa, Italy. In [34], a cost-efficient optimization algorithm has been proposed to maximize the RE penetration and find the optimal sizing of the HRES.
Table 1 summarizes the usage of hybrid optimization techniques in RESs. This paper aims at optimal economic and ecological design of a microgrid using a proposed hybrid optimization technique, IWO/BSA. The proposed microgrid consists of four houses in the city of Morocco. This microgrid includes different combinations of energy resources, namely PV, wind, biomass, diesel, and battery energy storage. Besides the optimal design presented in this paper, the penetration level of HRESs, the power supply availably and continuity are considered. To assess the effectiveness and performance of the proposed optimization technique, a comparison with different optimization algorithms is presented. However, the main contribution of this paper can be summarized in the following points:
  • We propose a hybrid algorithm called IWO/BSA, with the aim of improving the performance of the original IWO and BSA algorithms by combining their advantages into an algorithm.
  • The proposed algorithm is applied to the optimal economic design of a stand-alone hybrid microgrid system in Dakhla (Morocco).
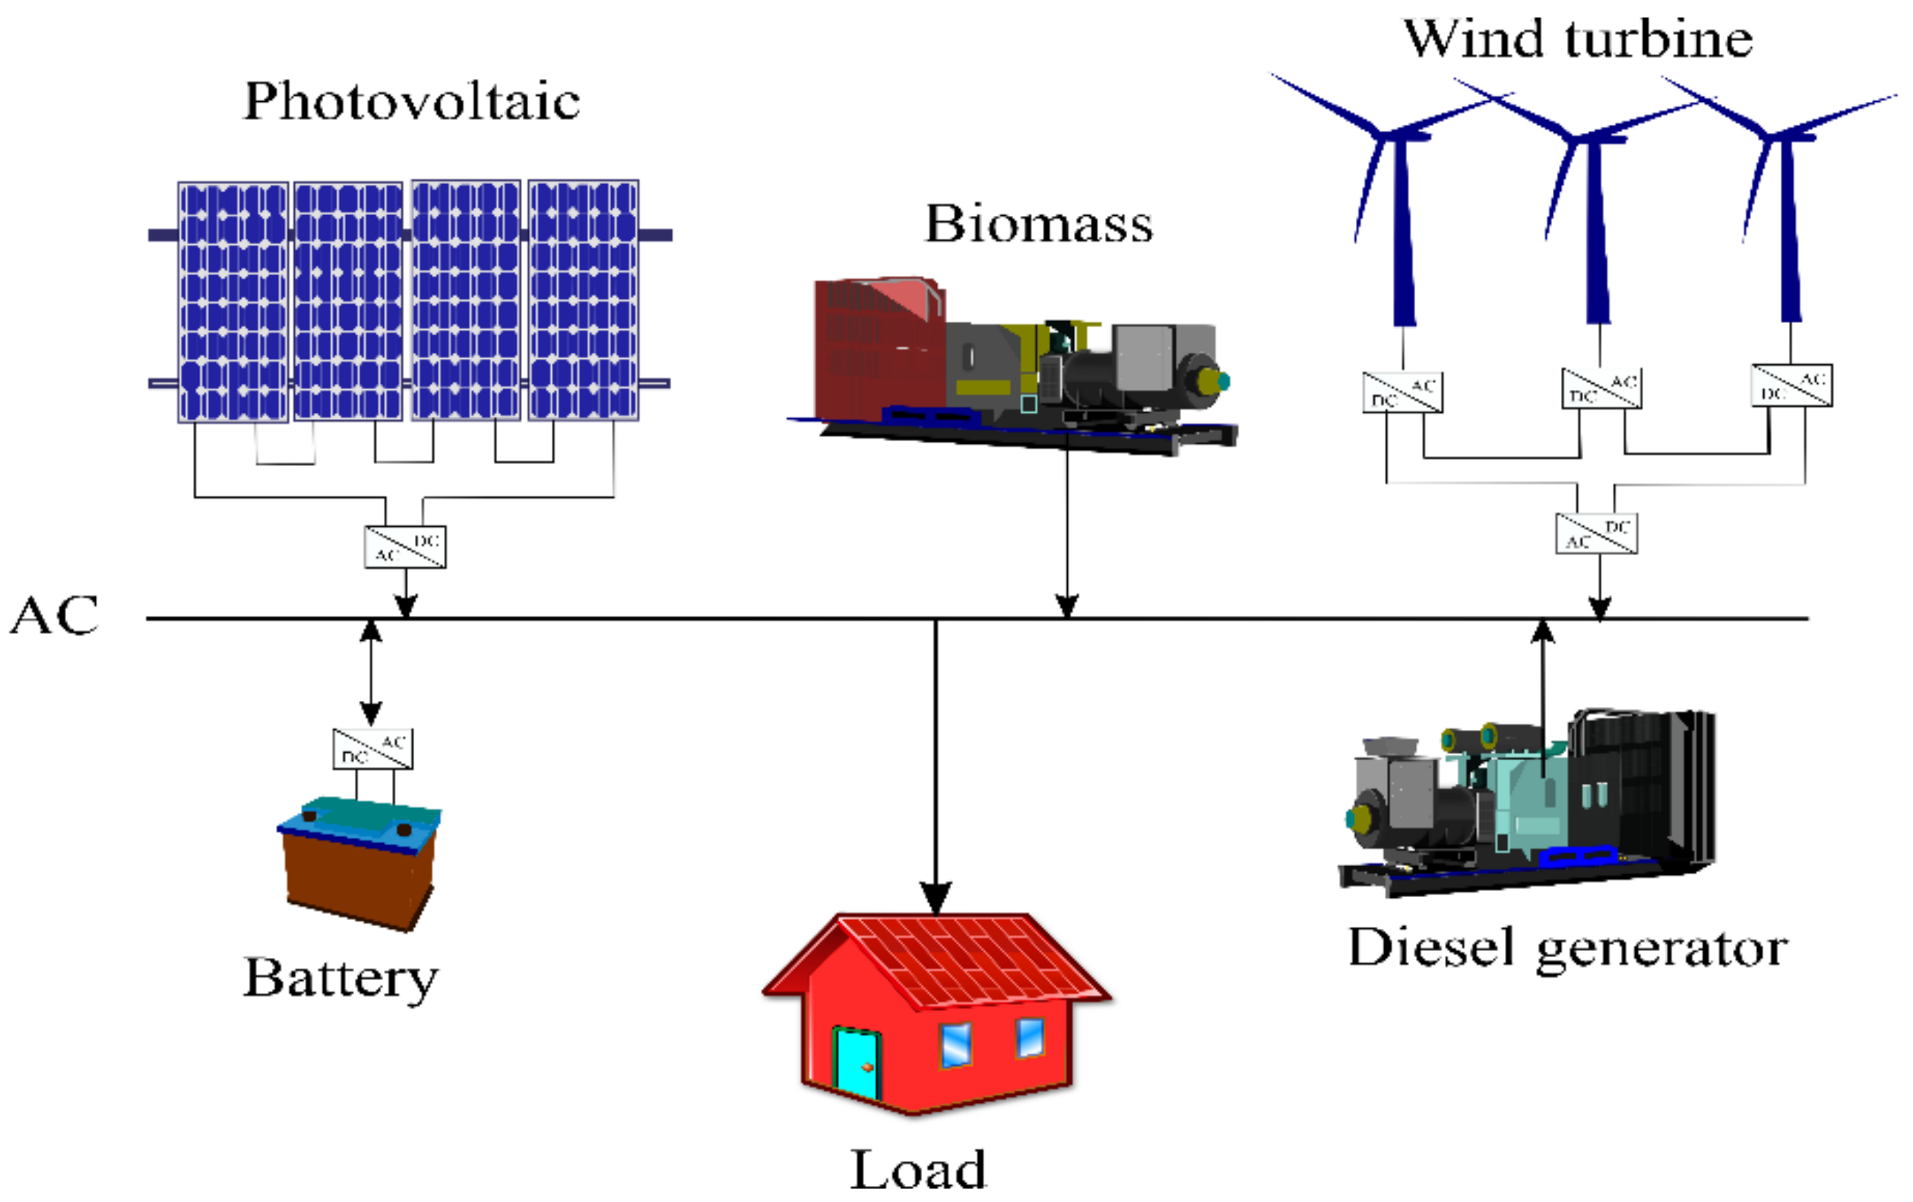
  • Four configurations consisting of RES (PV, WT and biomass) with diesel generators and battery storage systems are suggested.
  • Comparing the proposed IWO/BSA with artificial electric field (AEFA), GWO, BSA, and IWO algorithms.
The rest of the paper is organized as follows: Section 2 and Section 3 provide the modeling of the systems used in the whole scenarios and the optimization problem formulation, respectively. Section 4 discusses the proposed algorithm. Section 5 describes the case study. Section 6 presents the results and discussions. Finally, the conclusions of the paper are presented in Section 7.

2. Mathematical Description of the Proposed Hybrid System Components

The schematic diagram of the suggested HRES is shown in Figure 1. In this system, four scenarios, including the PV power plant, WT power plant, diesel generator, biomass, and BESS are considered. This microgrid is an AC system as all RESs are linked to the same AC bus. In this study, the DC sources, such as the PV, WT and BESS are linked to the AC bus through DC/AC inverters. The WTs also need a controlled inverter to regulate the output power in terms of the specified voltage and frequency.
Two strategies are adopted in this paper; in the first strategy, the combination of biomass/PV is considered, as shown in Figure 2. In the second strategy, PV or wind or both of them are considered as shown in Figure 3. For either strategy, the proposed operation of the microgrid resources is as:
  • The PV and WT are used firstly as the main power sources to feed the load needs.
  • The BESS operates when the PV and WT cannot feed the full load.
  • The biomass system starts working when the battery depletes to a minimum permissible power and the load power exceeds 30% of its nominal power.

2.1. PV System

The output power of the PV system depends on many parameters as [35]:
P p v = I t × η p v t × A p v
where, I represents the solar irradiation, A p v represents the PV area and η p v is the efficiency of the PV, which can be calculated as:
η p v t = η r × η t × 1 β × T a t T r β × I t × N O C T 20 800 × 1 η r × η t
where, N O C T is the nominal operating cell temperature (°C), η r   is the reference efficiency, η t is the efficiency of the MPPT equipment, β is the temperature coefficient of the efficiency, T a   is the ambient temperature (°C), and   T r is the photovoltaic cell reference temperature (°C).

2.2. Wind System

The output power of any WT depends mainly on the wind speed as [36]:
P w i n d = 0 , v t v c i ,   v t v c o a × V t 3   b × P r , v c i < v t < v r P r , v r v t < v c o
where, V represents the wind velocity, P r is the rated power, V c i , V c o and V r are the cut-in, cut-out and rated wind speeds, respectively, a, b are two constants expressed as:
a = P r / v r 3 v c i 3 b = v c i 3 / v r 3 v c i 3
The wind rated power is expressed as:
P r = 1 2 × ρ × A w i n d × C p × v r 3
where, ρ represents the air density, A w i n d is the swept area of the wind turbine, and C p is the maximum power coefficient ranging from 0.25 to 0.45.

2.3. Biomass System

Biomass is a renewable energy system that produces power given by the expression [37]:
P B M = T B M   ×   1000 × C V _ B M × η B M 8760 × O t
where, T B M is the total organic material of biomass (Ton/year), C V _ B M is the calorific value of the organic material, which equals 20 MJ/kg, η B M is the biomass efficiency of 24% and O t presents the operating hours each day.

2.4. Diesel System

The diesel generator is used as a back-up source of energy, and it only works when needed. The output power of the diesel generator is calculated as [38]:
P d g = F d g t   A g × P d g , o u t B g
where, F d g is the fuel consumption, P d g , o u t is the output power of diesel generator, A g and B g are constants of the linear consumption of the fuel.

2.5. BESS System

The BESS is a mandatory element for the isolated hybrid systems. The battery is charged when there is extra power and it is discharged when the load needs power more than the available from other sources. The capacity of BESS is expressed as follows [38]:
C B E S S = E l × A D D O D × η i × η b
where, E l is the load demand, A D represents the autonomy daily of the battery, D O D is the depth of discharge of the battery, η i n v and η b are the battery and inverter efficiency, respectively.

3. Formulation of the Optimization Problem

3.1. Net Present Cost

The NPC is the primary factor to be considered for any project design. It is counted as a sum of all components costs, including the capital, operation & maintenance, and replacement costs, taking into account the interest rate ( i r ), inflation rate ( δ ), and escalation rate ( μ ). NPC modeling is expressed as follows [39]:
N P C = C + O M + R + F C d g

3.1.1. PV and WT Costs

The cost modeling of PV and WT are similar. The capital cost of PV or WT ( C P V , W T ) is expressed based on the initial cost ( λ P V , W T ) and area ( A P V , W T ) as follows [40]:
C P V , W T = λ P V , W T × A P V , W T
The operation & maintenance costs ( O M P V , W T ) are expressed as:
O M P V , W T = θ P V , W T × A P V , W T × i = 1 N 1 + μ 1 + i r i
where, θ P V , W T is the annual operation & maintenance cost for any component, N is the project lifetime. The replacement costs are considered null because the project lifetime and the PV or WT lifetime are the same.

3.1.2. Diesel Costs

The costs of the diesel generator are modeled as follows [39]:
C d g = λ d g × P d g
O M d g = θ d g × N r u n × i = 1 N 1 + μ 1 + i r i
R d i e s e l = R d g × P d g × i = 7 , 14 1 + δ 1 + i r i
C f t = p f × F d g t
F C d g = t = 1 8760 C f t × i = 1 N 1 + δ 1 + i r i
where, C d g is the diesel investement cost, λ d g is the initial diesel cost, O M d g represents the operation and replacement cost, θ d g is the annual O&M cost of diesel, N r u n is the number of diesel-run in the year, R d i e s e l is the diesel replacement cost, R d g represents the annual replacement cost of diesel, p f is the cost of the fuel, F d g is the consumed quantity of fuel and F C d g is the total fuel cost.

3.1.3. BESS Costs

The initial and O&M (contain the replacement) costs of the BESS are expressed as follows [40]:
C B E S S = λ b a t × C b a t
O M B E S S = θ b a t × C b a t × i = 1 T B 1 + μ 1 + δ i _ 1 N b a t
where, λ b a t is the BESS initial cost and θ b a t is the annual O&M cost of BESS.

3.1.4. Biomass Costs

The biomass cost is represented as [35]:
C b g = λ b g × P b g
O M b g = θ 1 × P b g × i = 1 N 1 + μ 1 + i r i + θ 2 × P w × i = 1 N 1 + μ 1 + i r i
where, λ b g is the initial biomass cost, θ 1 is the annual fixed cost of O&M, θ 2 is the variable cost of O&M of biomass and P w is the annual working of the system (kWh/Year).

3.1.5. Inverter Costs

The inverter investment and O&M costs are represented as [39]:
C i n v = λ i n v × P i n v
O M I n v = θ I n v × i = 1 N 1 + μ 1 + i r i
where, λ i n v is the inverter initial cost and θ I n v is the annual O&M cost of the inverter.

3.2. Levelized Cost of Energy

Levelized cost of energy (LCOE) is a critical factor, in fact, the consumers don’t care about the project cost or its lifetime, but their interest is how much they would pay for each kilowatt-hour of energy. Therefore, the LCOE is a measure of the average NPC over its lifetime, and it is expressed as follows [38]:
L C O E = N P C × C R F t = 1 8760 P l o a d t .  
where, CRF is the capital recovery factor used to convert the initial cost to an annual capital cost, and it is expressed as:
C R F i r , R = i r × 1 + i r R 1 + i r R 1

3.3. Loss of Power Supply Probability

The loss of power supply probability (LPSP) is a technical factor used to express the reliability of the system. The LPSP is expressed as follows [38]:
L P S P = t = 1 8760 P l o a d t P p v t P w i n d t + P d g , o u t t + E b m i n t = 1 8760 P l o a d t

3.4. Renewable Energy Fraction

The transfer from the classical electricity production to the renewable energy project is not easy. The majority of previous work introduced renewable energies partially, while the objective here is to use 100% renewable energy. Therefore, the renewable energy factor is used to determine the percent of the renewable energy used. The renewable energy fraction (RF) is expressed as follows [38]:
R F = 1 t = 1 8760 P d g , o u t t t = 1 8760 P r e t × 100
where, P r e represents the total renewable energy power.

3.5. Availability Index Fraction

The availability index (A) predicts customer satisfaction, and it measures the energy converted to the load while confirming the ability of the project’s designed system. It index is calculated as [40]:
A = 1 D M N t = 1 8760 P l o a d t
D M N = P b m i n t P b t P p v t + P w i n d t + P d g , o u t t P l o a d t × u t
where, P b m i n is the battery min state, P b is the battery power at instance t, u is 1 when the load is not satisfied and 0 otherwise.

3.6. Constraints

In the suggested microgrid system, the operating constraints are:
0 A p v A p v m a x , 0 A w i n d A w i n d m a x , 0 P d g n P d g n m a x 0 P C a p _ b a t P C a p _ b a t m a x L P S P L P S P m a x R F m i n R F ,   A m i n A AD min AD  

4. Algorithms

4.1. Invasive Weed Optimization Algorithm

The IWO is a metaheuristic algorithm that has been proposed in [41]. In IWO, the social, reproductive, and competitive behaviors of the invasive weed have been modeled based on four strategies; adapting to any environment, enduring occupation of the fields, high reproduction of seeds, raise the invasive population and exclusion of the lower plant’s fitness. These strategies are subjected to the conditions of the invasive weeds and the field occupied. The mathematical modeling of IWO algorithm is presented in the following subsections.

4.1.1. Population Initialization

An invasive weed is a parasite that can be created anywhere, but it is not native to this location. In the IWO algorithm, to mimic the invasive weed, a population of weeds that stochastically spread in a search space with a random position is considered.

4.1.2. Reproduction

The reproduction of weeds is an asexual form where a seed is formed without fertilization, after that, the somatic cells in the mother plant develop into an embryo. The number of seeds produced depends on the weed density. At low densities, there may not be enough pollen to produce more seeds. After the reproduction step, the search space becomes more genetically diverse, which can involve more competition.
Each member of the weed’s population can produce seeds depending on its limits and capability. The population grows linearly with each iteration until they subject to a competitive selection if they exceed the maximum allowed plants in the colony. The number of seeds that a weed can produce S i is expressed as follows:
S i =   S m i n + S m a x S m i n f m a x f m i n × f i f m i n
where, S m a x , S m i n denote the maximum and minimum number of seeds, respectively, f m a x and f m i n present maximum and minimum fitness values of the plants in the colony, respectively, f i is the fitness of the plant i.

4.1.3. Spatial Dispersal

The spread of the seeds in the search space is randomly and distributed near the parent plant. However, the standard deviation σ of the random function will be reduced from a previously defined initial value, σ initial , to a final value, σ f i n a l , in every generation, the decrease of standard deviation will allow controlling the search space. The nonlinear alteration of the standard deviation σ i t e r is given as follows:
σ i t e r = i t e r m a x i t e r n i t e r m a x n × σ initial σ f i n a l + σ f i n a l
where, i t e r m a x is the maximum number of iterations, iter is the current iteration, and n is the nonlinear modulation index.

4.1.4. Competitive Exclusion

As explained before, the seeds result from asexual reproduction, and the plant invasive is very strong, which doesn’t give up easily. As a result, reproduction increases, and the search space becomes more overcrowded. In the IWO, the search space has a maximum allowed of plants. When reproduction becomes unsupported, a competitive exclusion operation is implemented. The competition between plants is introduced in the IWO algorithm to exclude the exceeds of the maximum allowed number from the plants included weeds and seeds in a colony. The exclusion is applied through a mechanism that eliminates the plants with low fitness in the colony based on a ranked list contains both weeds and seeds. The idea is to let just the strong weeds because they have the most chance of survival and reproduction contrariwise of the poor fitness plants.
The overall steps of IWO algorithm are shown in Algorithm 1.
Algorithm 1: IWO
Initialize a set of random weeds, w e e d B i = w e e d B 1 ,   w e e d B 2 , ,   w e e d B N within the limits w e e d m i n i w e e d B i w e e d m a x i .
Set the IWO’s parameters
Evaluate the objective function for all weeds
 While ( i t e r < i t e r m a x )
    Calculate the best and worst fitness in the colony
     Calculate the σ
     for each weed in the colony
     Calculate the number of seeds following the
     fitness of each weed
     Add the seeds to their parents in the colony
       if S i z e m a x N b p o p u l a t i o n
     Sort the new population according to their fitness
     Eliminate the worst fitness in order to achieve the S i z e m a x allowed
       end if
     end for
 Update iteration   i t e r = i t e r + 1
 end while
Return the final best solution

4.2. Backtracking Search Algorithm

BSA is a new optimization algorithm that has been proposed for solving real-valued numerical optimization problems [42]. In BSA, unlike the other evolutionary algorithms, it’s mitigating several problems as excessive sensitivity to control parameters, premature convergence, and slow computation. As a result, BSA has only one parameter. Moreover, BSA’s performance is not overly sensitive to the initial value of this parameter. BSA’s population is generated based on the genetic operators presented in the selection, mutation, and crossover. Moreover, the search-direction matrix and search-space boundaries’ amplitude control gives it potent exploration and exploitation capabilities. BSA has a particularity to use a memory containing a random population, which can share its experience for the next generation to guide the search-direction in the best way.

4.2.1. Population Initialization

The population is a sum of individuals which are spread uniformly in the search space. It can be expressed as:
P i , j   U low j ,   up j
where, i and j denote the population size and problem dimension, respectively, low and up denote the lower and upper values of each individual, U expresses the uniform distribution in each individual.

4.2.2. Selection-I

BSA’s Selection-I step is dedicated to the memory data used to get a better direction. The memory is called the historical population oldP. The initial historical population is determined randomly as:
o l d P i , j   U low j ,   up j
In BSA, the oldP is redefining at the beginning of each iteration through the ‘if-then’ expressed in (34):
i f   a < b   t h e n   o l d P   : =   P | a , b   0   ,   1
where: = is the update operation, Equation (34) ensures that BSA designates a population belonging (historical population) and remembers those until it changed. After that, the order of individuals in oldP is randomly changed using a shuffling function as in Equation (35):
o l d P   : = p e r m u t i n g o l d P

4.2.3. Mutation

The mutation is a genetic operator used to maintain the genetic diversity of chromosomes, and it is analogous to biological mutation. The mutation alters one or more gene values in the chromosome. BSA’s mutation process is expressed as follows:
M u t a n t = P + F . o l d P P
where, F controls the amplitude of the search-direction matrix, oldP-P.

4.2.4. Crossover

The crossover, also called recombination, is a genetic operator used to combine two parents’ genetic information to generate new offspring T. In BSA’s, the crossover is the last step to generate the trial offspring, it has two steps. The first step calculates the binary integer-valued matrix (map) that indicates the individuals of T to be manipulated using the relevant individuals of P, for the second one when the map equals to 1, then T update the p-value. The overall steps of BSA algorithm are shown in Algorithm 2.

4.3. Hybrid IWO/BSA Algorithm

As with any population-based algorithm, IWO has some problems concerning the competitive capability where the seeds are not taken care of their capacities. As a result, IWO has not good results in the convergence compared with the other algorithms. This proposed IWO/BSA algorithm aims to help the seeds take good fitness, which involves the competitivity in the colony of weeds. The proposed strategy is adapted to subject the seeds to the backtracking search method operators based on the genetic operators denoted in the selection, mutation, and crossover. The BSA algorithm allows involving the global exploration while IWO is giving the best exploitation.
He proposed IWO-BSA algorithm is based on the following steps, initialization, reproduction, then, the generated seeds are treated using the BSA operators as, Selection I (to select the current and historical populations), mutation, crossover, Selection II (to select the optimal population), spatial dispersal and competitive exclusion.
Algorithm 2: BSA
Initialize a set of random population   P i = X 1 , X 2 , , X N and historical population   o l d P i = X 1 , X 2 , , X N within the limits X m i n i X X m a x i .
Initialize set the only BSA parameter called the mix rate and take the best fitness at the inf value.
Evaluate the objective function for the   P i .
 While (iter <   i t e r m a x )
    Selection-I look at equations 24,25 and 26
Mutation calculates mutant using: M u t a n t = P + F . o l d P P where F = 0.6 randn
      Crossover calculates the trial population T:
     m a p i j = z e r o s
        if (c < d |c, d U 0   ,   1 ) then
         for i from 1 to N do
      m a p i , u 1 : m i x r a t e . r a n d . d i m = 0   |   u =   p e r m u t i n g 1 , 2 D
          end
       else
       for i from 1 to N do, m a p i , r a n d i D = 0
       end
     Generate the Trial population, T   : = m u t a n t
       for i from 1 to N do
         for i from 1 to N do
            if m a p i , j = 1   then T i , j   : = P i , j
         end
        end
      Appling the Boundary Control Mechanism
     Selection-II evaluate the objective function of T i
        for i from 1 to N do
if f i t n e s s   T i < f i t n e s s   P i then
              f i t n e s s   P i = f i t n e s s   T i
              P i =   T i
         end
        end
     Comparison between the actual best solution   P b e s t   and P i
   end while
Return the final best solution P b e s t

4.3.1. Initialization

The IWO/BSA algorithm population is a set of invasive plants (weeds); the population is randomly spread in the search space.

4.3.2. Reproduction

As like in the IWO algorithm, the reproduction of weeds is an operation based on an asexual generation of seeds without fertilization. The seeds number generated of each weed is calculated using Equation (30).

4.3.3. Selection I

The selection-I in IWO/BSA is dedicated to select the historical population and the current population, as presented in Equation (33). To strengthen the plants, they are modeled as chromosomes. The somatic cells of the seed each contain 24 chromosomes (12 maternal and 12 paternal).

4.3.4. Mutation and Crossover

Mutation and crossover is a genetic operator used to maintain the genetic diversity of chromosomes and it is analogous to biological mutation. The mutation alters one or more gene values in the chromosome. It is implemented like in BSA.

4.3.5. Spatial Dispersal

The dispersion of the new seeds is coming after submitting them to the BSA operators. The dispersion is randomly in the search space and distributed as an IWO algorithm. However, the standard deviation σ of the random function is also calculated using Equation (31).

4.3.6. Competitive Exclusion

After the dispersion in the search space, this later becomes more overcrowded. It has a maximum allowed of weeds, which should implement a strategy called competitive exclusion to decrease the colony’s number of elements. However, in this stage, a competitivity between weeds appears. The weeds are classed based on their own fitness, and then, the low fitness will be excluded. This strategy is used in IWO algorithm which used a mechanism to eliminate the low weeds fitness.

4.3.7. Selection II

In the Selection-II stage, a weed with a better fitness value than the others is selected as the best global solution. Also, in this stage, we upload the best local solution. The summarized process is shown in Figure 4, while Figure 5 shows the proposed IWO/BSA algorithm’s main flowchart.

5. Case Study

To validate the robustness of the proposed IWO/BSA algorithm, it is utilized for determining the optimal sizing of the proposed hybrid renewable system, which consists of different configurations. These proposed configurations are the PV/wind turbine/biomass/battery, PV/biomass, PV/diesel generator/battery, and wind turbine/diesel generator/battery systems. The proposed hybrid systems have been introduced in the isolated mode to satisfy the proposed site’s load requirements. The project is applied in Dakhla (Morocco), as shown in Figure 6. The annual load curve for one hour is shown in Figure 7. Figure 8a–d present the solar irradiation, temperature, wind speed, and pressure, respectively. Four standalone system scenarios will be evaluated for covering the load demand in that site, wherein each kind, four different configurations of the hybrid system are studied. These configurations are: (1) PV/wind/biomass/battery, (2) PV/biomass, (3) PV/diesel/battery and (4) wind/diesel/battery systems. The proposed IWO/BSA is validated on optimal sizing of these four hybrid systems, and the optimization results are comprehensively compared with the corresponding ones obtained from AEFA, GWO, BSA, and IWO algorithms. The dumped power is used in an electrical heater with the aim of heating the water for house use.

6. Results and Discussion

In this section, the optimal design of a proposed hybrid renewable system is achieved using the developed IWO/BSA algorithm. The effectiveness of the proposed algorithm on the suggested system is validated via different scenarios and cases. The optimal sizing is based on minimizing the NPC as an objective function, while the parameters of optimization are: (i) the PV area, (ii) the swept area of the wind turbine, (iii) the rated power of diesel generator, (iv) the nominal capacity of the battery, and (V) the biomass capacity. To confirm the suitability of the proposed IWO/BSA in addressing the studied optimization problem, IWO/BSA, AEFA, GWO, BSA, and IWO are launched 100 times for each configuration and a statistical study is conducted based on a set of measures like the best minimum value of the fitness function. For an in-depth analysis of the obtained results and to ensure the analysis study, four indices are calculated, the NPC, LCOE, LPSP, and the availability. In the next subsections, the optimization results are provided for the standalone system with multiple scenarios. Modeling and simulation of the optimization problem have been accomplished using MATLAB 2015a program, while the adjusted parameters are the same for all studied configurations and the input data are presented in Table A1 in the Appendix A, likewise the algorithms parameters are presented in Table A2, i.e., the number of maximum iterations is taken as 100 iterations and the search agents’ number is 10. The results of the statistical measurements for the proposed IWO/BSA and the other algorithms, AEFA, GWO, BSA and IWO are listed in Table 2 and Table 3. From these tables, the reader can conclude that the IWO/BSA technique generates the best minimum value of the fitness function in all cases. The convergence curves of the 100 iterations for all the studied configurations using IWO/BSA, AEFA, GWO, BSA, and IWO are shown in Figure 9. From this figure, it can be observed that the convergence characteristics of developed IWO/BSA are better than those obtained by the other optimization algorithms.
The results of the statistical measurements for the proposed IWO/BSA, compared with the AEFA, GWO, IWO and BSA algorithms, are listed in Table 2 and Table 3. From Table 2, the reader can conclude that the proposed IWO/BSA algorithm gives the best results for all scenarios. It can also be observed that the hybrid PV/WT/Biomass/Battery system shows a high competitivity using IWO/BSA algorithm. The NPC of the obtained optimized system is 111929 USD, with an LCOE of 0.2574 USD; likewise, the constraints are satisfied, and the project is 100% with renewable sources.
Table 2 and Table 3 present the results obtained by the developed algorithm, the net present cost function, the optimized parameters results, i.e., ( A p v , A w i n d , P d g n , P C a p _ b a t , P B M ) for all suggested configurations. From Figure 9, the reader can notice that using IWO/BSA, AEFA, GWO, BSA and IWO algorithms, the best minimum values of the objective function (NPC) is obtained for the first configuration, i.e., hybrid PV/WT/Biomass/Battery. From Table 3, it can be observed that IWO/BSA gives the minimum value of NPC in all cases. The datasheet of technologies is presented in Table A3 in the Appendix A.
Figure 10 shows the output power of the studied systems through annual power management. Figure 10a, shows the output power of the PV/WT/Biomass/Battery, where the power from the wind turbine represents the important contribution which reaches 90% as shown in Figure 11a. Otherwise, the PV represents only 9% of power contribution, and the biomass is not considered in the optimized system. Figure 10b shows the output power of the PV/biomass system, where it can be observed that the biomass is considered a back-up and presents only 1% of total power production percent Figure 11b. Figure 10c, shows the annual output power of the PV/diesel/battery system, it is observed that the main unit is the PV system with 97% as shown in the Figure 11c, while the diesel generator contributes to 1% power production. Figure 10d, shows the annual generated power of the WT/diesel/battery system, where the wind system generates 98% of the power, while the battery and diesel systems used as a back-up, and they don’t pass more than 1% of the power generation as shown in Figure 11d.
Figure 12 shows the time-response of PV, WT, battery, diesel generator, biomass, load powers obtained via the proposed IWO/BSA algorithm for all scenarios during some hours. The figures show the hourly generated power between 2200 to 2500. Figure 12a, shows the time response of the PV, wind, biomass, battery, and load powers. It is observed that the power from the wind is dumped, while the power from the PV feeds the load. Figure 12b, shows the time response of the PV, biomass, and load powers, where the dumped power is null. Figure 12c, shows the time response of the PV, diesel, battery and load powers. It is observed that the PV is the pillar of the system, while the diesel is considered as a back-up. Figure 12d, shows the time response of the wind, battery, diesel, and load powers, where it is observed a significant dumped power generated by the wind turbine.
Figure 13 shows the state of charge (SOC) in the three cases when the battery is used. In Figure 13a,c, the SOC is mostly charged because the systems have the wind turbine system. In Figure 13b, the SOC is a square signal, because the battery is charged in the sunniest time and discharge in the inverse. This frequency in each day presents a square signal form. Otherwise, Figure 14 shows the battery’s charge and discharge for the studied configurations.
The proposed IWO/BSA algorithm is extensively examined with different case studies and scenarios. The IWO/BSA algorithm gives the best results compared with alternatives for all studied scenarios. The main results can be summarized as follows; the best HMGs in the Dakhla region is the PV/biomass with an LCOE of 0.1184 $. The best algorithm in all case studies is the proposed IWO/BSA algorithm compared with AEFA, GWO, IWO, and BSA.

7. Conclusions

This paper has proposed a hybrid optimization algorithm, called IWO/BSA, with the aim of improving the performance of the original IWO and BSA algorithms by combining their advantages into an algorithm. The proposed algorithm has been applied for the optimal economic design of a stand-alone hybrid microgrid system in Dakhla (Morocco). Four configurations consist of RES (PV, WT and biomass) with diesel generators and battery storage systems have been suggested. The obtained results showed that the PV/Biomass scenario is the most cost-effective system with an LCOE of 0.1184 $/kWh; otherwise, the best configuration of the microgrid system contained 349.55 m2 of PV and 18.9940 ton/year consumed by the biomass system; the PV/diesel/BESS scenario is also cost-effective with LCOE of 0.1354 $/kWh. On the other side, the LPSP and availability index are satisfied without the need for traditional resources. Additionally, the results showed the proposed IWO/BSA algorithm’s ability to reach the optimal solution compared with the original IWO and BSA, and other recent algorithms in all studied cases. The obtained results from this study would be useful material for decision-makers working on developing the renewable energy sector in the Moroccan Sahara region in south Morocco. In the current paper, the parameter tuning of studied optimization algorithms has not been taken into account. In the future work, the parameter tuning of each algorithm could be carried out using Taguchi technique. In addition, it is suggested to apply the proposed IWO/BSA for solving other complex optimization problems.

Author Contributions

Conceptualization, M.K., S.K. and R.E.; Data curation, M.A.-A., A.S.A. and M.A.; Formal analysis, A.E., and M.I.M.; Resources, A.E., M.I.M.; Methodology, M.A.-A., A.S.A. and M.A.; Software, M.K., S.K. and R.E.; Supervision, A.E., and M.I.M.; Validation, M.K. and S.K.; Visualization, M.A.-A., A.S.A. and M.A.; Writing—original draft, M.K., S.K., R.E., M.A.-A., and A.S.A.; Writing—review & editing, M.A., A.E. and M.I.M. All authors together organized and refined the manuscript in the present form. All authors have read and agreed to the published version of the manuscript.

Funding

This research was funded by the deputyship for Research & Innovation Ministry of Education in Saudi Arabia grant number IFP-2020-06.

Institutional Review Board Statement

Not applicable.

Informed Consent Statement

Not applicable.

Acknowledgments

The authors extend their appreciation to the deputyship for Research & Innovation Ministry of Education in Saudi Arabia for funding this research work through the project number (IFP-2020-06).

Conflicts of Interest

The authors declare no conflict of interest.

Nomenclature

AEFAArtificial Electric Field Algorithm
ALOAntlion Optimizer
BESSBattery energy storage system
BOBonobo Optimizer
BOACABi-objective ant colony algorithm
BSABacktracking Search Algorithm
COECost of Energy
CSCuckoo search
CSACrow search algorithm
DGDiesel generator
FAFirefly algorithm
GAGenetic algorithm
GCGrid-Connected
GOAGrasshopper Optimization Algorithm
GWOGrey Wolf Optimizer
HHOHarris Hawks optimizer
HRES Hybrid renewable energy system
IWOInvasive Weed Optimization
JLBOJaya and teaching–learning-based optimization
MPPTMaximum Power Point Tracker
MVOMulti-Verse Optimizer
NPCNet Present Cost
PHSPumped hydro storage
PSOParticle swarm optimization
QOBOQuasi-Oppositional Bonobo Optimizer
RESRenewable energy sources
SAStand-Alone
SOCState of charge
SSOSocial spider optimizer
TORSCHETime Optimization of Resources, Scheduling
WDOWind driven optimization
WOAWhale Optimization Algorithm
WTWind turbine
Symbols
A P V , W T Area of PV and swept area of wind (m2)
A g , B g Constants of the linear consumption of the fuel (L/kW)
A p v PV area (m2)
A w i n d Swept area of the wind turbine (m2)
C B E S S Capacity of BESS (kWh)
C B E S S Initial cost of the BESS ($)
C P V , W T Investment cost of PV and wind generators ($)
C V _ B M Calorific value of the organic material (MJ/kg)
C b a t Capacity of battery (kWh)
C b g Investment cost of biomass ($)
C f t Cost of the consumed quantity of fuel ($/year)
C i n v Inverter investment cost ($)
C p Maximum power coefficient (%)
E b m i n Min battery energy in discharge (kWh)
E l Energy Load (kWh)
F C d g Fuel cost ($)
F d g Fuel consumption (L/h)
F d g t Consumed quantity of fuel (L)
N r u n Diesel run number
O M B E S S O&M (contain the replacement) costs of the BESS ($)
O M I n v O&M cost of the inverter ($)
O M P V , W T Operation & maintenance costs ($)
O M b g O&M cost of biomass ($)
O M d g Maintenance and Operation cost of diesel generator ($)
O t Operating hours (hr)
P B M Biomass power (kW)
P b g Rated capacity of biomass (kW)
P d g , o u t Output power of diesel generator (kW)
P d g Output power of diesel generator (kW)
P i n v Rated power of the inverter (kW)
P l o a d Load power (kW)
P p v Output power of PV (kW)
P r Rated power (kW)
P r e Output power of renewable energy sources (kW)
P w Annual working of system (kWh/Year)
P w i n d Output wind power (kW)
R d g Annual replacement cost of diesel ($)
R d i e s e l Diesel replacement cost ($/kW)
S i Number of seeds that a weed can produce
S m a x Maximum allowed number of seeds generated
S m i n Minimum allowed number of seeds generated
T B M Total organic material of biomass ( t / yr )
T a Ambient temperature (°C),
T r Photovoltaic cell reference temperature (°C).
f i Fitness of the plant i
f m a x Maximum fitness value of the plants in the colony
f m i n Minimum fitness value of the plants in the colony
i r Interest rate (%)
i t e r m a x Maximum iteration
p f Fuel price ($/L)
v c i Cut-in speed (m/s)
v c o Cut-out speed (m/s)
v r Rated wind speed (m/s)
η B M Biomass efficiency (%)
η b Efficiency of the battery (%)
η i Efficiency of the inverter (%)
η p v Efficiency of the PV (%)
η r Reference efficiency, η t is the efficiency of the MPPT equipment,
θ 1 Annual fixed cost of O&M of biomass ($/kW/year)
θ 2 Variable cost of O&M of biomass ($/kWh)
θ I n v Annual O&M cost of the inverter ($/year)
θ P V , W T Annual operation & maintenance of PV and wind ($/m2/year)
θ b a t Annual O&M cost of BESS ($/m2/year)
θ d g Annual O&M cost of diesel ($/hr)
λ P V , W T Initial cost of PV and wind ($/m2)
λ b a t BESS initial cost ($/kWh)
λ b g Biomass initial cost ($/kW)
λ d g Diesel initial cost ($/kW)
λ i n v Inverter initial cost ($/m2)
σ initial Initial standard deviation
σ f i n a l Final standard deviation
σ i t e r Standard deviation
A Availability index (%)
A D Autonomy daily of the battery (day)
C Investment cost ($)
C R F Capital recovery factor
D O D Depth of discharge (%)
I Solar irradiation (kW/m2)
L C O E Levelized cost of energy ($/kWh)
L P S P Loss of power supply probability (%)
N O C T Nominal operating cell temperature (°C),
N P C Net Present Cost ($)
O M Operation and maintenance cost ($)
R Replacement cost ($)
R F Renewable Fraction (%)
n Nonlinear modulation index
v Wind velocity (m/s)
β Temperature coefficient of the efficiency
δ Inflation rate (%)
μ Escalation rate (%)
ρ Air density (Kg/m3)

Appendix A

Table A1. Summary of the HRES parameters.
SymbolQuantityConversion
NProject lifetime20 year
i r Interest rate13.25%
μ Escalation rate2%
δ Inflation rate12.27%
λ p v PV initial cost300 $/m2
θ p v Annual O&M cost of PV 0.01 λ p v $/m2/year
η r Reference efficiency of the PV25%
η t Efficiency of MPPT100%
T r PV cell reference temperature25 °C
β Temperature coefficient0.005 °C
NOCTNominal operating cell temperature47 °C
N p v PV system lifetime20 year
λ w i n d Wind initial cost125 $/m2
θ w i n d Annual O&M cost of wind 0.01 λ w i n d $/m2/year
C p _ w i n d Maximum power coefficient48%
V c i Cut-in wind speed2.6 m/s
V c o Cut-out wind speed25 m/s
V r Rated wind speed9.5 m/s
N w i n d Wind system lifetime20 year
λ d g Diesel initial cost250 $/kW
θ d g Annual O&M cost of diesel0.05 $/h
R d g Replacement cost210 $/kW
p f Fuel price in Egypt0.43 $/L
N d i e s e l Diesel system lifetime7 year
λ b a t Battery initial cost100 $/kWh
θ b a t Annual operation & maintenance cost of Battery 0.03 λ b a t $/m2/year
D O D Depth of discharge80%
η b Battery efficiency97%
S O C m i n Minimum state of charge20%
S O C m a x Maximum state of charge80%
N b a t Battery system lifetime5 year
λ i n v Inverter initial cost400 $/m2
θ i n v Annual O&M cost of inverter20 $/year
η i n v Inverter efficiency97%
Table A2. Used parameters of Algorithms.
AlgorithmsParameters
AEFA K 0   =   500; ⍺ = 30; Population size = 10; Maximum iteration = 100
GWOa = Linear reduction from 2 to 0; Search agents = 10; Maximum iteration = 100
IWO S e e d m i n   =   1; S e e d m a x   =   3; σ i n i t i a l   =   0.5; σ f i n a l   =   0.001; Population Size = 10; Maximum Population Size = 25; Exponent = 1; Maximum iteration = 100
BSADIM_RATE = 1; Population size = 10; Maximum iteration = 100
IWO/BSA S e e d m i n   =   1; S e e d m a x   =   3; σ i n i t i a l   =   0.5; σ f i n a l   =   0.001; Exponent = 1; DIM_RATE = 1; Population Size = 10; Maximum Population Size = 25; Maximum iteration = 100
Table A3. Datasheet of technologies.
SystemDatasheet
PVManufacture: Solar World; Model: Submodule Plus SW 255 poly; Rated power: 255 W; Area: 1.68 m2
Wind
Biomass
Manufacture: Siemens; Model: SWT-3.0-113; Rated power: 3 kW; Area: 10,029 m2 Community Power Corporation (CPC)
Diesel Rated power: 140 W
BatteryModel: Lead Acid, Rated power: 1.85 kWh
InverterManufacture: Sunny Swiss, Model: SB2000HF, Nominal power: 8000 W

References

  1. Babatunde, O.M.; Munda, J.L.; Hamam, Y. A Comprehensive State-of-the-Art Survey on Hybrid Renewable Energy System Operations and Planning. IEEE Access 2020, 8, 75313–75346. [Google Scholar] [CrossRef]
  2. Kharrich, M.; Mohammed, O.H.; Mohammed, Y.S.; Akherraz, M. A Review on Recent Sizing Methodologies for Hybrid Microgrid Systems. Int. J. Energy Convers. 2019, 7, 230–240. [Google Scholar] [CrossRef]
  3. Zia, M.F.; Benbouzid, M.; Elbouchikhi, E.; Muyeen, S.M.; Techato, K.; Guerrero, J.M. Microgrid Transactive Energy: Review, Architectures, Distributed Ledger Technologies, and Market Analysis. IEEE Access 2020, 8, 19410–19432. [Google Scholar] [CrossRef]
  4. Mbungu, N.T.; Naidoo, R.M.; Bansal, R.C.; Vahidinasab, V. Overview of the Optimal Smart Energy Coordination for Microgrid Applications. IEEE Access 2019, 7, 163063–163084. [Google Scholar] [CrossRef]
  5. Gomes, L.; Vale, Z.A.; Corchado, J.M. Multi-Agent Microgrid Management System for Single-Board Computers: A Case Study on Peer-to-Peer Energy Trading. IEEE Access 2020, 8, 64169–64183. [Google Scholar] [CrossRef]
  6. Shrestha, A.; Bishwokarma, R.; Chapagain, A.; Banjara, S.; Aryal, S.; Mali, B.; Thapa, R.; Bista, D.; Hayes, B.P.; Papadakis, A.; et al. Peer-to-Peer Energy Trading in Micro/Mini-Grids for Local Energy Communities: A Review and Case Study of Nepal. IEEE Access 2019, 7, 131911–131928. [Google Scholar] [CrossRef]
  7. Mazzeo, D.; Matera, N.; de Luca, P.; Baglivo, C.; Congedo, P.M.; Oliveti, G. A literature review and statistical analysis of photovoltaic-wind hybrid renewable system research by considering the most relevant 550 articles: An upgradable matrix literature database. J. Clean. Prod. 2021, 295, 126070. [Google Scholar] [CrossRef]
  8. Diab, A.A.Z.; Sultan, H.M.; Mohamed, I.S.; Kuznetsov, O.N.; Do, T.D. Application of Different Optimization Algorithms for Optimal Sizing of PV/Wind/Diesel/Battery Storage Stand-Alone Hybrid Microgrid. IEEE Access 2019, 7, 119223–119245. [Google Scholar] [CrossRef]
  9. Zhou, Z.; Ge, L. Operation of Stand-Alone Microgrids Considering the Load Following of Biomass Power Plants and the Power Curtailment Control Optimization of Wind Turbines. IEEE Access 2019, 7, 186115–186125. [Google Scholar] [CrossRef]
  10. Kharrich, M.; Mohammed, O.; Akherraz, M. Design of Hybrid Microgrid PV/Wind/Diesel/Battery System: Case Study for Rabat and Baghdad. EAI Endorsed Trans. Energy Web 2018, 7, 162692. [Google Scholar] [CrossRef]
  11. Tooryan, F.; HassanzadehFard, H.; Collins, E.R.; Jin, S.; Ramezani, B. Optimization and energy management of distributed energy resources for a hybrid residential microgrid. J. Energy Storage 2020, 30, 101556. [Google Scholar] [CrossRef]
  12. Bukar, A.L.; Tan, C.W.; Lau, K.Y. Optimal sizing of an autonomous photovoltaic/wind/battery/diesel generator microgrid using grasshopper optimization algorithm. Solar Energy 2019, 188, 685–696. [Google Scholar] [CrossRef]
  13. Sanajaoba, S. Optimal sizing of off-grid hybrid energy system based on minimum cost of energy and reliability criteria using firefly algorithm. Solar Energy 2019, 188, 655–666. [Google Scholar] [CrossRef]
  14. Fathy, A.; Kaaniche, K.; Alanazi, T.M. Recent Approach Based Social Spider Optimizer for Optimal Sizing of Hybrid PV/Wind/Battery/Diesel Integrated Microgrid in Aljouf Region. IEEE Access 2020, 8, 57630–57645. [Google Scholar] [CrossRef]
  15. Saravanan, B.; Vasudevan, E.R.; Kothari, D.P. Unit commitment problem solution using invasive weed optimization algorithm. Int. J. Electr. Power Energy Syst. 2014, 55, 21–28. [Google Scholar] [CrossRef]
  16. Bhattacharjee, K.; Bhattacharya, A.; Dey, S.H.N. Backtracking search optimization based economic environmental power dispatch problems. Int. J. Electr. Power Energy Syst. 2015, 73, 830–842. [Google Scholar] [CrossRef]
  17. Panda, M.R.; Das, P.; Pradhan, S. Hybridization of IWO and IPSO for mobile robots navigation in a dynamic environment. J. King Saud Univ. Comput. Inf. Sci. 2020, 32, 1020–1033. [Google Scholar] [CrossRef]
  18. Mahto, S.K.; Choubey, A. A novel hybrid IWO/WDO algorithm for nulling pattern synthesis of uniformly spaced linear and non-uniform circular array antenna. AEU Int. J. Electron. Commun. 2016, 70, 750–756. [Google Scholar] [CrossRef]
  19. Lin, Q.; Gao, L.; Li, X.; Zhang, C. A hybrid backtracking search algorithm for permutation flow-shop scheduling problem. Comput. Ind. Eng. 2015, 85, 437–446. [Google Scholar] [CrossRef]
  20. Khan, A.; Javaid, N. Jaya Learning-Based Optimization for Optimal Sizing of Stand-Alone Photovoltaic, Wind Turbine, and Battery Systems. Engineering 2020, 6, 812–826. [Google Scholar] [CrossRef]
  21. Kharrich, M.; Mohammed, O.H.; Kamel, S.; Selim, A.; Sultan, H.M.; Akherraz, M.; Jurado, F. Development and Implementation of a Novel Optimization Algorithm for Reliable and Economic Grid-Independent Hybrid Power System. Appl. Sci. 2020, 10, 6604. [Google Scholar] [CrossRef]
  22. Makhdoomi, S.; Askarzadeh, A. Optimizing operation of a photovoltaic/diesel generator hybrid energy system with pumped hydro storage by a modified crow search algorithm. J. Energy Storage 2020, 27, 101040. [Google Scholar] [CrossRef]
  23. Abo-Elyousr, F.K.; Elnozahy, A. Bi-objective economic feasibility of hybrid micro-grid systems with multiple fuel options for islanded areas in Egypt. Renew. Energy 2018, 128, 37–56. [Google Scholar] [CrossRef]
  24. Ming, M.; Wang, R.; Zha, Y.; Zhang, T. Multi-Objective Optimization of Hybrid Renewable Energy System Using an Enhanced Multi-Objective Evolutionary Algorithm. Energies 2017, 10, 674. [Google Scholar]
  25. Mohamed, A.A.; Ali, S.; Alkhalaf, S.; Senjyu, T.; Hemeida, A.M. Optimal Allocation of Hybrid Renewable Energy System by Multi-Objective Water Cycle Algorithm. Sustainability 2019, 11, 6550. [Google Scholar] [CrossRef] [Green Version]
  26. Crainz, M.; Curto, D.; Franzitta, V.; Longo, S.; Montana, F.; Musca, R.; Riva Sanseverino, E.; Telaretti, E. Flexibility Services to Minimize the Electricity Production from Fossil Fuels. A Case Study in a Mediterranean Small Island. Energies 2019, 12, 3492. [Google Scholar] [CrossRef] [Green Version]
  27. Hossain, M.A.; Chakrabortty, R.K.; Ryan, M.J.; Pota, H.R. Energy management of community energy storage in grid-connected microgrid under uncertain real-time prices. Sustain. Cities Soc. 2021, 66, 102658. [Google Scholar] [CrossRef]
  28. Curto, D.; Franzitta, V.; Viola, A.; Cirrincione, M.; Mohammadi, A.; Kumar, A. A renewable energy mix to supply small islands. A comparative study applied to Balearic Islands and Fiji. J. Clean. Prod. 2019, 241, 118356. [Google Scholar] [CrossRef]
  29. Tsai, C.-T.; Beza, T.M.; Molla, E.M.; Kuo, C.-C. Analysis and Sizing of Mini-Grid Hybrid Renewable Energy System for Islands. IEEE Access 2020, 8, 70013–70029. [Google Scholar] [CrossRef]
  30. Rehman, S.; Natrajan, N.; Mohandes, M.; Alhems, L.M.; Himri, Y.; Allouhi, A. Feasibility Study of Hybrid Power Systems for Remote Dwellings in Tamil Nadu, India. IEEE Access 2020, 8, 143881–143890. [Google Scholar] [CrossRef]
  31. Hossain, M.; Mekhilef, S.; Olatomiwa, L. Performance evaluation of a standalone PV-wind-diesel-battery hybrid system feasible for a large resort center in South China Sea, Malaysia. Sustain. Cities Soc. 2017, 28, 358–366. [Google Scholar] [CrossRef]
  32. Mazzeo, D.; Baglivo, C.; Matera, N.; Congedo, P.M.; Oliveti, G. A novel energy-economic-environmental multi-criteria decision-making in the optimization of a hybrid renewable system. Sustain. Cities Soc. 2020, 52, 101780. [Google Scholar] [CrossRef]
  33. Curto, D.; Favuzza, S.; Franzitta, V.; Musca, R.; Navia, M.A.N.; Zizzo, G. Evaluation of the optimal renewable electricity mix for Lampedusa island: The adoption of a technical and economical methodology. J. Clean. Prod. 2020, 263, 121404. [Google Scholar] [CrossRef]
  34. Ahmad, S.; Ullah, I.; Jamil, F.; Kim, D. Toward the Optimal Operation of Hybrid Renewable Energy Resources in Microgrids. Energies 2020, 13, 5482. [Google Scholar] [CrossRef]
  35. Heydari, A.; Askarzadeh, A. Optimization of a biomass-based photovoltaic power plant for an off-grid application subject to loss of power supply probability concept. Appl. Energy 2016, 165, 601–611. [Google Scholar] [CrossRef]
  36. Guangqian, D.; Bekhrad, K.; Azarikhah, P.; Maleki, A. A hybrid algorithm based optimization on modeling of grid independent biodiesel-based hybrid solar/wind systems. Renew. Energy 2018, 122, 551–560. [Google Scholar] [CrossRef]
  37. Sawle, Y.; Gupta, S.C.; Bohre, A.K. Socio-techno-economic design of hybrid renewable energy system using optimization techniques. Renew. Energy 2018, 119, 459–472. [Google Scholar] [CrossRef]
  38. Ramli, M.A.M.; Bouchekara, H.R.E.H.; Alghamdi, A.S. Optimal sizing of PV/wind/diesel hybrid microgrid system using multi-objective self-adaptive differential evolution algorithm. Renew. Energy 2018, 121, 400–411. [Google Scholar] [CrossRef]
  39. Movahediyan, Z.; Askarzadeh, A. Multi-objective optimization framework of a photovoltaic-diesel generator hybrid energy system considering operating reserve. Sustain. Cities Soc. 2018, 41, 1–12. [Google Scholar] [CrossRef]
  40. Ghiasi, M. Detailed study, multi-objective optimization, and design of an AC-DC smart microgrid with hybrid renewable energy resources. Energy 2019, 169, 496–507. [Google Scholar] [CrossRef]
  41. Mehrabian, A.R.; Lucas, C. A novel numerical optimization algorithm inspired from weed colonization. Ecol. Inform. 2006, 1, 355–366. [Google Scholar] [CrossRef]
  42. Civicioglu, P. Backtracking Search Optimization Algorithm for numerical optimization problems. Appl. Math. Comput. 2013, 219, 8121–8144. [Google Scholar] [CrossRef]
Figure 1. Isolated microgrid system components used for different scenarios.
Electronics 10 00687 g001
Figure 2. Power management of the PV/Biomass HRES.
Electronics 10 00687 g002
Figure 3. Power management of the PV/WIND/DIESEL/BESS.
Electronics 10 00687 g003
Figure 4. Proposed IWO/BSA algorithm process.
Electronics 10 00687 g004
Figure 5. Flowchart of the proposed IWO/BSA algorithm.
Electronics 10 00687 g005
Figure 6. Dakhla map.
Electronics 10 00687 g006
Figure 7. Hourly load power in the four houses.
Electronics 10 00687 g007aElectronics 10 00687 g007b
Figure 8. Meteorological conditions.
Electronics 10 00687 g008
Figure 9. The NPC convergence using the proposed AEFA, GWO, BSA, IWO and the proposed IWO/BSA for all scenarios, (a) PV/WT/biomass/battery, (b) PV/biomass, (c) PV/diesel/battery, (d) WT/diesel/battery.
Electronics 10 00687 g009
Figure 10. Annual contribution of PV, wind, battery, diesel, and biomass obtained by the proposed IWO/BSA algorithm, for scenarios (a) PV/WT/biomass/battery, (b) PV/biomass, (c) PV/diesel/battery, (d) WT/diesel/battery.
Electronics 10 00687 g010
Figure 11. Annual contribution of PV, WT, battery, and diesel and biomass obtained by the proposed IWO/BSA algorithm, (a) PV/WT/biomass/battery, (b) PV/biomass, (c) PV/diesel/battery, (d) WT/diesel/battery.
Electronics 10 00687 g011
Figure 12. Time-response of PV, WT, battery, diesel generator, biomass, load powers obtained via the proposed IWO/BSA algorithm for all scenarios during some hours, (a) PV/WT/Biomass/Battery, (b) PV/Biomass, (c) PV/Diesel/Battery, (d) WT/Diesel/Battery.
Electronics 10 00687 g012
Figure 13. State of charge of battery in scenarios, (a) PV/WT/biomass/battery, (b) PV/diesel/battery, (c) WT/diesel/battery.
Electronics 10 00687 g013
Figure 14. Charge and discharge of battery in scenarios, (a) PV/WT/biomass/battery, (b) PV/diesel/battery, (c) WT/diesel/battery.
Electronics 10 00687 g014
Table 1. Summary of reported methods in optimizing HRESs.
ReferenceYearHybrid RESsAlgorithm/ToolOFAdvantagesPotential Improvements
Tooryan et al. [11]2020PV/wind/diesel/batteryPSO, GANPCClear and simple studyClassical approach methods are used.
Bukar et al. [12]2019PV/wind/diesel/batteryGOA, CSA, PSOCOEApplication of GOA algorithmSystem credibility such as uncertainty and availability should be enhanced.
Sanajaoba et al. [13]2019PV/wind/batteryFA, GA, PSOCOEThe developed model is applied for three remote unelectrified villagesThe sensitivity analysis is not included.
Fathy et al. [14]2020PV/wind/battery/dieselGWO, MVO, ALO, WOA, SSOCOEDetailed study with many resultsThe proposed SSO could be further explored
Khan and Javaid [20]2020-PV/wind/battery
-PV/battery
-Wind/battery
Jaya, TLBO, JLBO, GATACProposed a new hybrid algorithm named JLBOThe uncertainty for the wind and PV should be considered.
Kharrich et al. [21]2020-PV/wind/diesel/battery
-PV/biomass
-PV/diesel/battery
-wind/diesel/battery
QOBO, BO, HHO, AEFA, IWONPCProposed a new developed algorithm called QOBO The uncertainty parameter is missing.
Makhdoomi and Askarzadeh [22]2020PV/diesel/PHSGA, PSO, CSA, CSAAC-APFuel consumptionProposing a modified CSA The operation time-span of the study is only 24 h.
Abo-Elyousr and Nozh [23]2018PV/wind/biomass/NGFC/NGTBOACA, GA, PSO, HOMER-COE
-GHG
Developing a BOACA algorithm offers optimal HMG system configuration and sizingThe LPSP results should be further examined and analyzed.
Hossain et al. [31]2016PV/wind/diesel/batteryHOMERNPCPerformance evaluation of standalone hybrid systemThe study is only based on commercial software application. Other meta-heuristic algorithms could be included and examined.
Heydari and Askarzadeh [35]2016PV/biomassHSANPCProving the disadvantage of the HOMER software compared to the meta-heuristic algorithms.Algorithm comparison is required to confirm that the best results could be found from HS algorithm.
Guangqian et al. [36]2018-Wind/PV/diesel/battery
-Wind/diesel/battery
-PV/diesel/battery
HSA, SAA, HHSSAALCCProposing a hybrid algorithm for determining the optimal size of grid-independent system.The reliability and other factors are should be considered.
Sawle et al. [37]2018-PV/biomass/diesel/battery
-PV/diesel/battery
-Wind/biomass/diesel/battery
-Wind/diesel/battery
-PV/wind/diesel/battery
-PV/wind/biomass/diesel/battery
GA, PSO, BFPSO, TLBOCOEI + LPSPI + (1/RFI) + (1/HDI) + PMI + (1/JCI)Considering social, technical, and economic indices in only one objective function.Adding the uncertainty will bonus and improve this study.
Ramli et al. [38]2018PV/wind/diesel/batteryMOSaDE-COE
-LPSP
Detailed studyComparison with another multi-objective algorithm is necessary. Otherwise, the knee point should be used to define a compromise solution.
Movahediyan and Askarzadeh [39]2018PV/dieselMO-CSA, MOPSO-LPSP
-NPC-CO2 emission
Considering the operating reserve impact in the sizing problem.Other systems need to be included in the study.
Ghiasi [40]2018PV/wind/battery grid connectedMOPSO, MOGA-Availability
-Cost
The use of the availability factor in the inter-connected system. The reliability could be considered for extending this method.
Table 2. Optimal sizing obtained by the proposed algorithm for the studied scenarios.
Hybrid Power SystemAlgorithmPV (m2)WT (m2)Diesel (kW)Battery (kWh)Biomass (t/Year)
AEFA67.5137702.9344//4.788832.1741
GWO77.4342780.7906//9.208227.5612
PV/WT/Biomass/BatteryBSA75.7053576.7633//4.87530.3522
IWO234.6187890.4494//6.891319.6979
IWO/BSA89.7678554.205//4.787730.0000
AEFA355.5057//////32.3361
GWO357.6068//////34.2460
PV/BiomassBSA390.6575//////0.6572
IWO386.4402//////50.2505
IWO/BSA349.5524//////18.9940
AEFA414.1790//0.697913.1553//
GWO436.8411//0.573221.4832//
PV/Diesel/BatteryBSA385.4886//0.536711.5347//
IWO488.2624//0.569727.8874//
IWO/BSA391.3988//0.556512.9746//
AEFA//7440.80180.094911.9624//
GWO//8481.70170.976623.9765//
WT/Diesel/BatteryBSA//2237.768848.290411.9192//
IWO//2124.236954.186429.9514//
IWO/BSA//1850.816220.873741.5201//
Table 3. Indices obtained by the proposed algorithm of all scenarios.
Hybrid Power SystemAlgorithmNPC ($)LCOE ($/kWh)LPSPAvailability (%)Renewable Energy (%)Battery Autonomy (Day)
AEFA132,5290.30480.048796.7275//0.5025
GWO147,6450.33950.049496.9305//0.9663
PV/WT/Biomass/BatteryBSA112,3240.25830.049695.8039//0.5116
IWO201,9120.46430.037297.3849//0.7232
IWO/BSA111,9290.25740.049895.7752//0.5024
AEFA127,3390.12100.048496.0199////
PV/BiomassGWO128,0090.12160.047796.1075////
BSA130,6110.12410.050095.1179////
IWO136,3440.12950.039396.9598////
IWO/BSA124,6890.11840.049995.6296////
AEFA164,6950.15650.043397.163698.62700.5703
PV/Diesel/BatteryGWO166,5400.15820.045697.384898.94960.9313
BSA151,6670.14410.049896.608998.83300.5000
IWO168,3050.15990.027898.758799.14021.2089
IWO/BSA142,2330.13540.025098.610998.83300.5635
AEFA839,7540.79770.049195.657899.99950.5186
WT/Diesel/BatteryGWO967,6110.91920.049796.006199.99591.0394
BSA1,084,2831.03000.049499.603798.61160.5167
IWO1,178,6301.11970.023499.809198.28911.2984
IWO/BSA590,0970.56060.012896.561999.19541.7999
Publisher’s Note: MDPI stays neutral with regard to jurisdictional claims in published maps and institutional affiliations.

