1. Introduction
The recent increase in the use of light-emitting diodes (LEDs) has encouraged research on real-time wireless communication between two devices both equipped with an optical source and image sensor. Optical camera communication (OCC) [
1,
2,
3] which uses camera image sensors to receive light signals, has acquired important relevance within the visible light communication (VLC) [
4,
5,
6] field due to its unique feature of ability to separate incident light into spatial and color domains. This trend has attracted researchers and industries for its potential application in overtaking traditional radio frequency (RF) communications, given that the OCC bandwidth requirement and installation cost are lower than those of RF systems.
Display-to-camera (D2C) communication falls under the OCC category where the information is sent from an electronic display to a camera-equipped receiver. Each display pixel serves as a transmitting antenna, and the camera image sensor captures millions of pixels to retrieve the transmitted information. Given the increasing use of multimedia and ubiquitous computing, D2C technology could facilitate the transfer of various types of information in a line-of-sight (LOS) environment, where seamless services are routinely required. In a D2C system, the amount of embedded data is irrespective to the size of the display, and the inserted data should not affect the viewing experience of the user. In addition, data retrieval problems in the receiver must be dealt with, even when the information is sent over a noisy, wireless optical channel. The D2C system that satisfies these requirements is a promising candidate for 6G communications in addition to RF-based communications for all possible device-to-access networks.
Previous D2C approaches [
7,
8,
9,
10] mainly considered data embedding in the image spatial domain. In [
7], the alpha channel was used to embed data into the translucency change of image pixels; the pixel RGB values were kept unchanged. The INFRAME [
8] system enabled “dual-mode full-frame communication” between devices and the human eye. Here, data multiplexing into the full frame of a display unit was achieved by exploiting the concept of complementary frames, where two frames were mutually complementary in terms of the pixel luminance level. Similarly, in the DisCo system [
9], data were transmitted by temporally modulating the brightness of the digital display at a very high frequency. Using a rolling shutter camera, transmitted messages were acquired by converting the temporally modulated incident light into a spatial flicker pattern. The SoftLight system [
10] used a channel-coding approach that automatically adapts the data transmission rate to different scenarios; suggestions on how to exploit expanded color modulation and coding of bit-level rate-less transmissions of low computational complexity were provided. Quick response (QR) codes [
11] and two-dimensional (2D) color barcodes [
12,
13] are also considered as a D2C technology where barcoding can be used to embed data. In the COBRA system [
12], data were encoded using specially designed 2D color barcodes and streamed between a small screen and the low-speed camera of a smartphone. The size and layout of the code blocks were designed to deal with image blurring during capture in mobile environments; the system allowed for real-time decoding and image processing. Similarly, in the Rainbar system [
13], a high-capacity barcode layout allows for flexible frame synchronization and accurate code extraction. Here, to enhance the robustness of the system, “progressive code locator detection” and color recognition were incorporated.
Generally, spatial embedding is vulnerable to various circumstances occurring in a wireless optical channel. The spatial component of an image is described by the pixel intensity, which can be severely affected by ambient lighting and noise present in the wireless optical channel. This noise alters the color intensity of image pixels. The variation in pixel intensity severely compromises the embedded data, which therefore must be explicitly placed in perceptually significant components of the image. When an image is transformed into the spectral domain, its frequency coefficients provide vital information about the image. These coefficients determine the rate of change in pixel values in the spatial domain (i.e., the edges and smooth regions of the image). Therefore, instead of direct manipulation of image pixels, it is preferred to insert data into the coefficients that are robust under all available frequency coefficients. In this manner, the data are spread over many frequency coefficients. The data energy associated with a single coefficient becomes small and thus is not readily detectable in the spatial domain. This renders the data less susceptible to the noise while being transmitted over a wireless optical channel. This situation is analogous to that of spread-spectrum communications, which states that the signal energy at any single frequency is completely undetectable when any narrowband signal is transmitted over a massive bandwidth. Thus, frequency-based embedding is an attractive method to robustly embed data into an image for a D2C link. To embed data, the various types of frequency transformation such as Fourier, wavelet, and cosine transform are considered. Since the maintenance of visual quality of the data embedded image is crucial, the frequency coefficients must be selected such that the visual content of the original image remains unaffected despite data embedding. This topic was previously studied in the context of watermarking and steganography [
14,
15,
16]. In [
14], a robust hybrid watermarking algorithm was presented. Here, a discrete Wavelet transform (DWT) was combined with singular value decomposition (SVD); data were embedded into the DC coefficients of the high-low (HL) and low-high (LH) sub-bands. Similarly, in [
15], a fast-discrete Cosine transform (FDCT) algorithm was used to enhance the computational performance of watermarking. Likewise, Cox et al.[
16] presented a secure algorithm for image watermarking that can be generalized to multimedia data, such as audio files and video clips. The embedding principle of digital watermarking is identical to that of D2C frequency-based data embedding. However, conventional watermarking does not consider the effect of the wireless optical channel, which greatly affects the reliability of communication performance.
Previous studies [
17,
18,
19] explored various methods by which data could be embedded into the frequency domain of an image; a display and a camera served as the transmitter and receiver respectively. In [
17], discrete Fourier transform (DFT) coefficients were used to embed data by exploiting wireless orthogonal frequency division multiplexing (OFDM) modulation. The effects of perspective distortion of the transmitted image on the performance of the D2C system were evaluated under various vision transformation parameters. Similarly, Mushu et al. [
18,
19] explored data embedding into specific frequency regions of an image using a parallel transmission VLC system. Popular transformation methods, including DWT and discrete cosine transform (DCT) [
20], were evaluated. However, these studies have not explored how different types of encoding methods can be achieved in the spectral domain images by utilizing specific embedding factors. The details regarding the selection of frequency coefficients, the effects of the transmission distance
D, angle of capture
AOC, and wireless optical channel on D2C performance were not investigated either. Specifically, the generalization of these approaches with respect to the changes in the testing environment were not examined.
In this paper, we explore various DCT-based data-embedding schemes in a D2C system. Unlike conventional spectral data-embedding schemes that do not consider the effects of the wireless transmission channel, we derive several data-embedding mechanisms using the DCT coefficients of an image. We consider the nature of the optical wireless channel and embed data into the robust spectral coefficients of the image, which is displayed on an electronic screen and captured by a camera at the receiver side. The decoder at the receiving end performs a geometric correction of the captured image, which is followed by a DCT to extract the embedded data from the frequency coefficients of the captured image. To consider the actual implementation of the proposed scheme, we assessed the effects of the optical wireless channel on the communication performance of the D2C system by conducting various experiments according to multiple parameters. Using software simulations and several real-world experiments, we compare and analyze the performance of our proposed data-embedding schemes in terms of the peak signal-to-noise ratio (PSNR), bit error rate (BER), and achievable data rate (ADR). Our work demonstrates successful data embedding and extraction via a D2C link, which facilitates robust data communication without significantly compromising the visual quality of the display. The main contributions of this research can be summarized as follows:
Three types of spectral data-embedding mechanisms are presented, and their performance in real-world environments are analyzed.
The effect of the wireless optical channel on the system performance is assessed under various capture orientations of the receiver camera.
The performance of the proposed system is assessed according to the data embedding in various positions within the mid-frequency (MF) region of a DCT image.
The remaining of the paper is organized as follows. In
Section 2, we provide detailed explanation the D2C architecture, with an emphasis on frequency coefficient selection, encoding, and decoding, where the various types of DCT-based data-embedding mechanisms are discussed. Then,
Section 3 presents the performance analysis and evaluation of the proposed model based on both simulations and real-world experiments. Finally, the conclusions are reported in
Section 4.
2. Display to Camera Communication System
The basic D2C system includes an electronic display on the transmitter side and a commercial camera on the receiver side. A wireless optical channel acts as a medium to transmit information between the two devices.
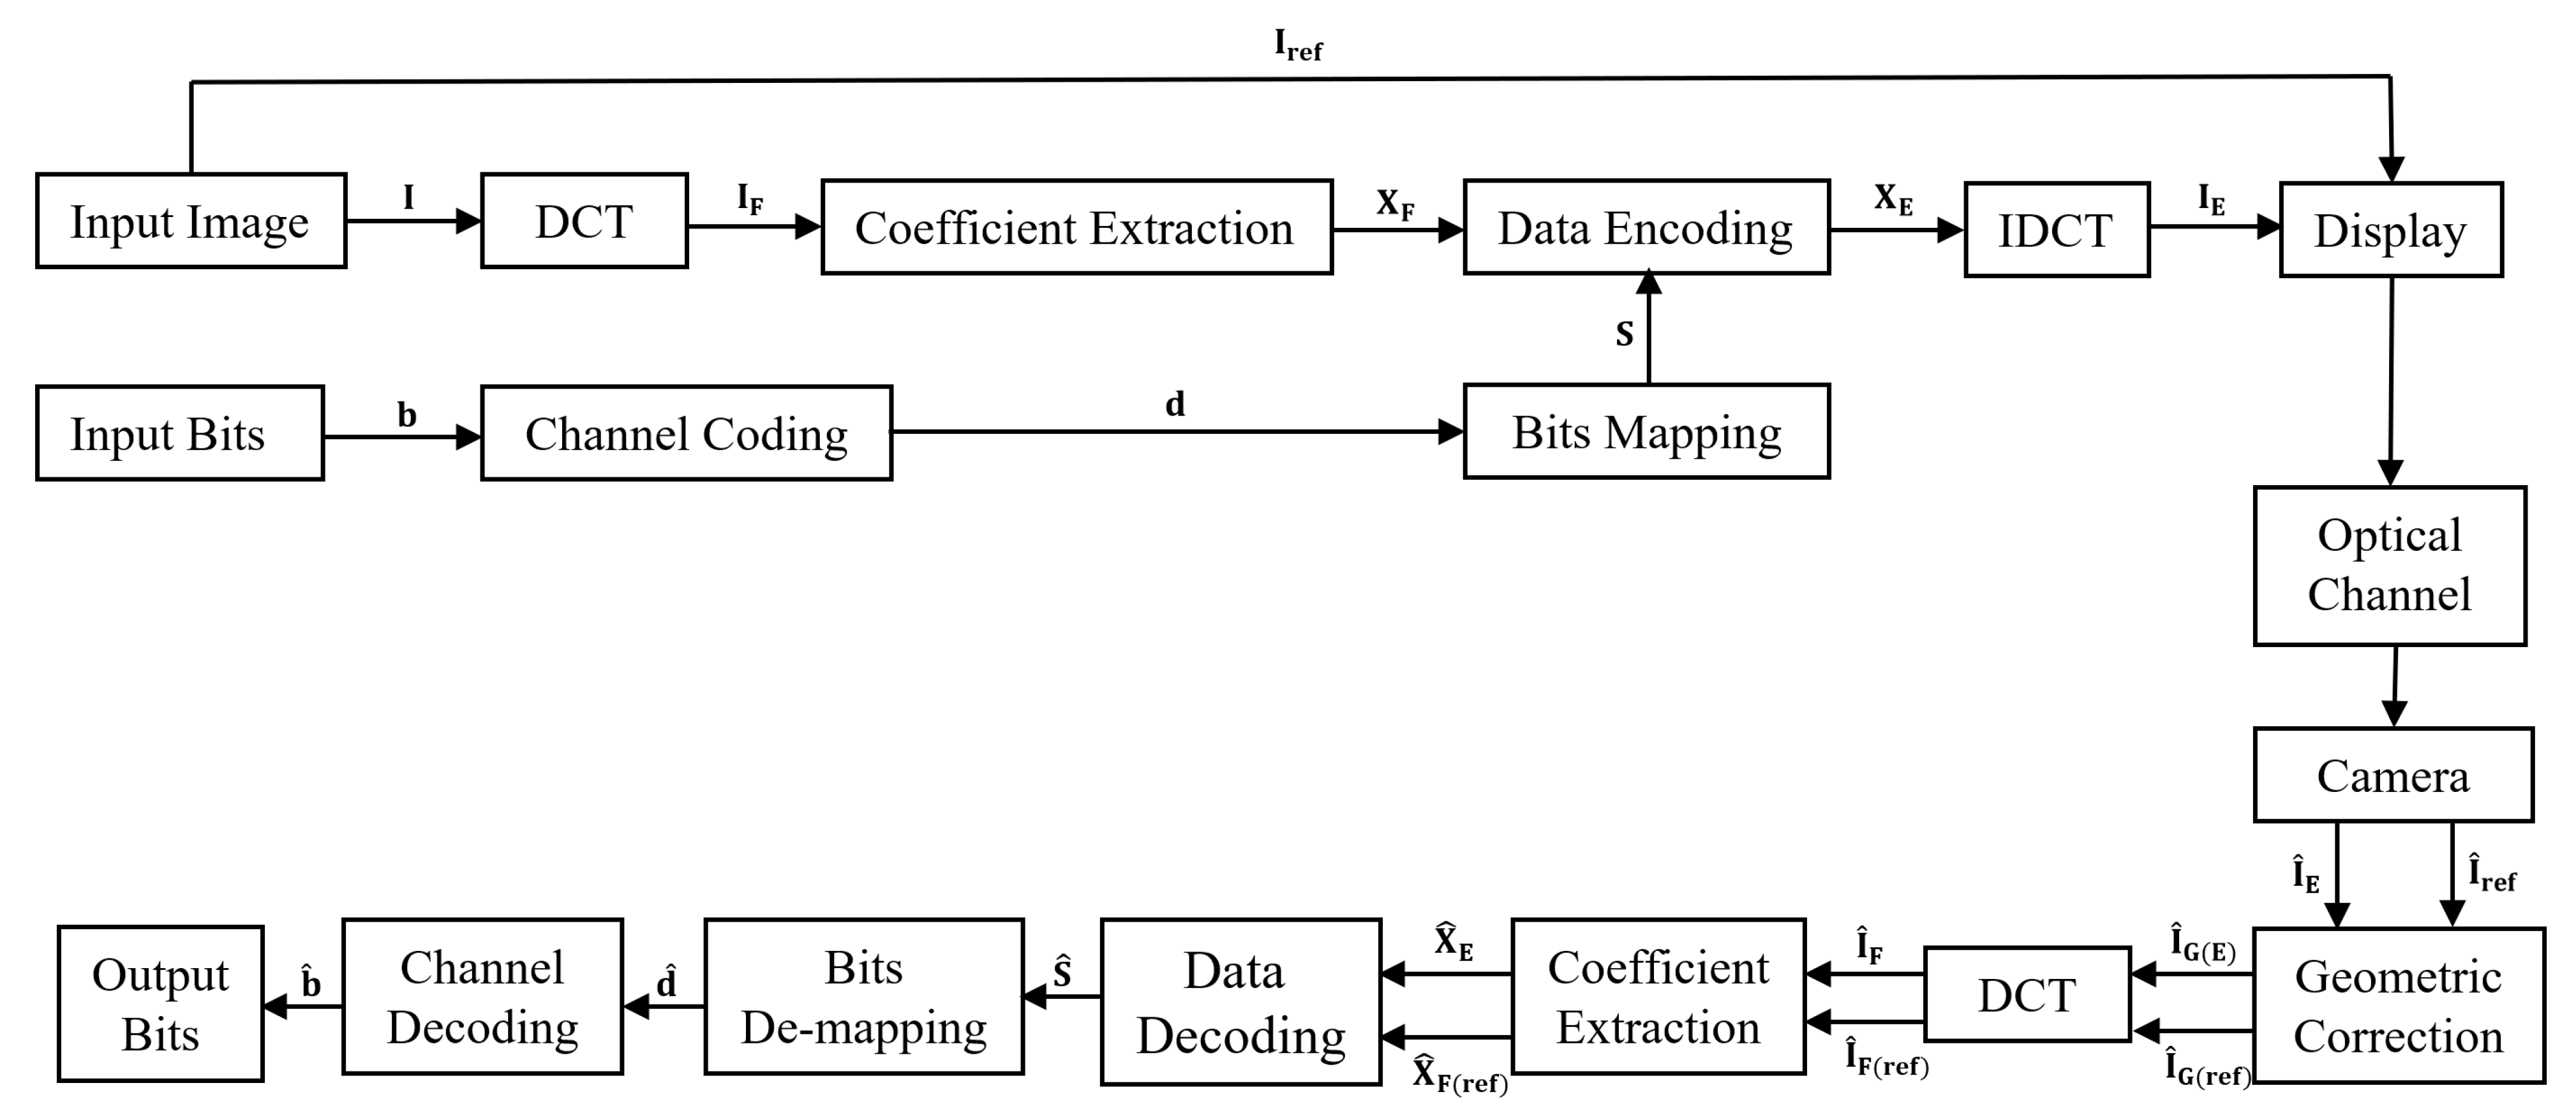
Figure 1 shows a schematic block diagram of the proposed D2C model. First, the input data vector
b is converted into symbol
S via channel-coding and bits mapping. At the same time, the input image
I is subjected to DCT to obtain its frequency coefficients. Subsequently, a coefficient vector
XF is selected from the DCT image
IF, where
XF contains the frequency coefficients preferred for embedding. The data are encoded into the coefficient vector using one of three different mechanisms: M1, additive; M2, multiplicative; or M3, exponential. After data embedding is completed, the embedded coefficient vector
XE and the other frequency coefficients are concurrently transformed back into the spatial domain via the inverse discrete cosine transform (IDCT) to obtain the data-embedded image
IE. The image quality of
IE is preserved despite the insertion of additional data; thus, the visual difference between
IE and
Iref is negligible. Later,
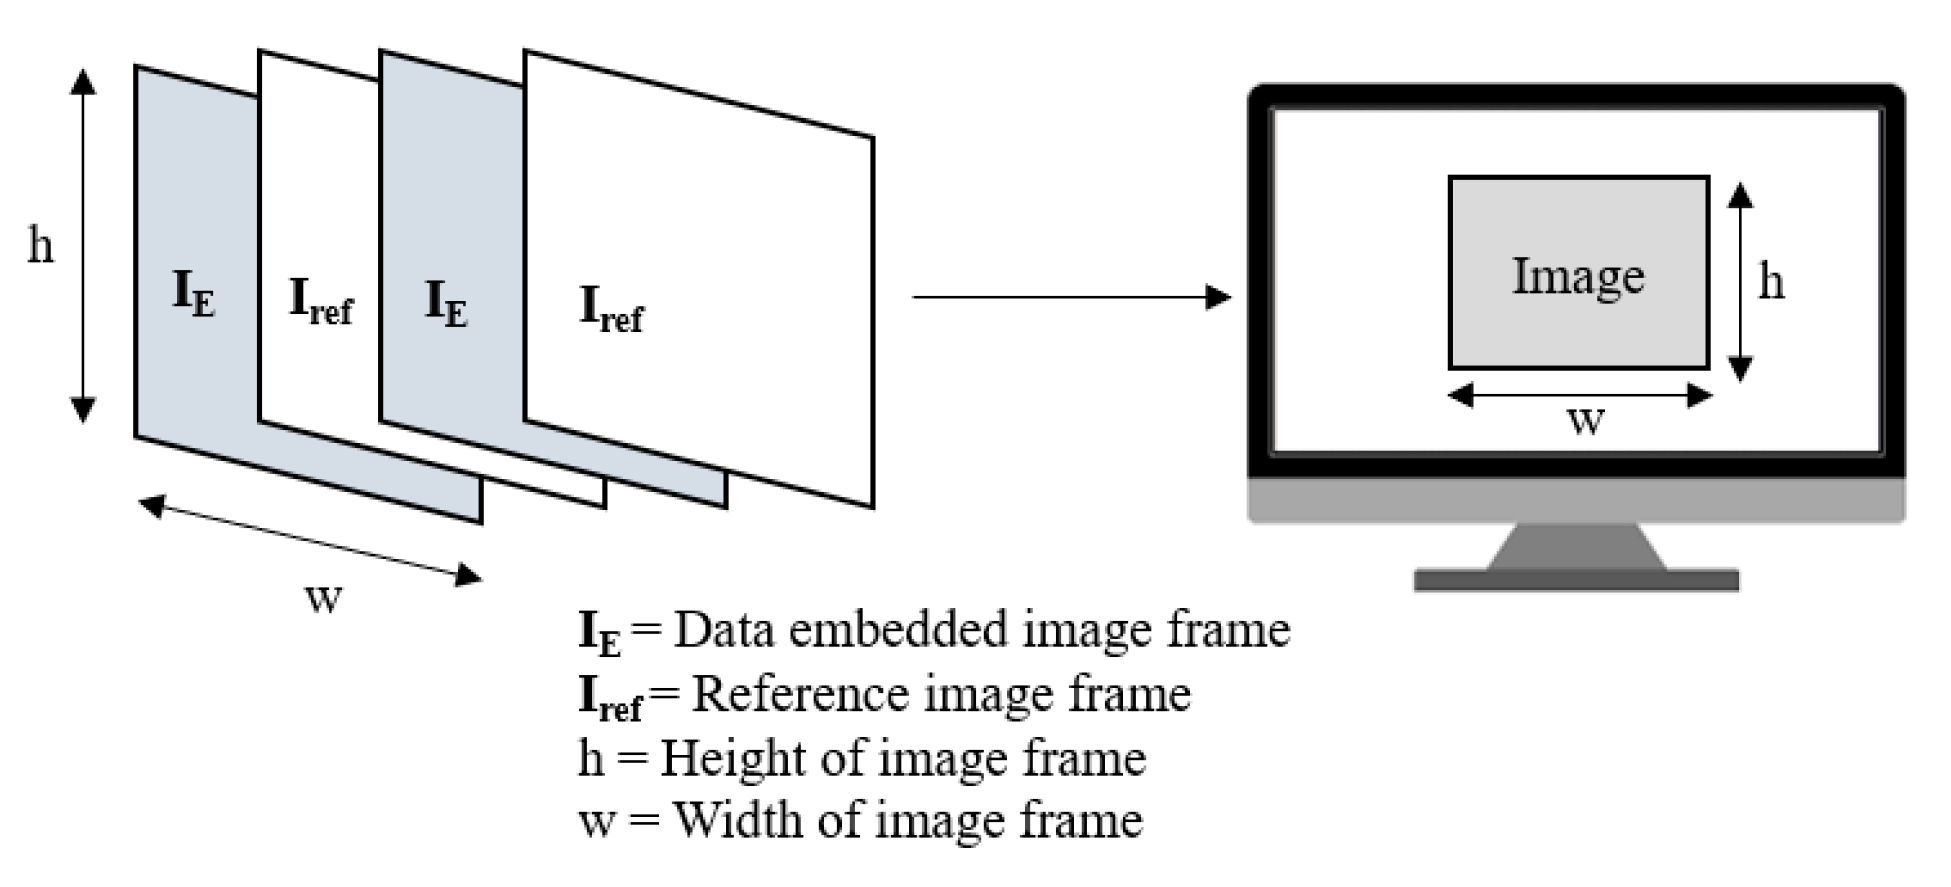
IE and the reference image
Iref are sequentially transmitted via the electronic screen as shown in
Figure 2. These image frame sequences are displayed on the screen as a visual content for the human eye. The human vision system has a temporal resolution of 40–50 Hz, beyond which the flickers cannot be perceived [
8]. Taking this into consideration, the transmit rate of the display,
RD must be higher than the maximum threshold of the temporal resolution of human vision. Therefore, the image frames are sequentially transmitted through the display without any noticeable artifacts or flickers. Note that the purpose of sending
Iref, which is adjointly placed with
IE, is to support the decoding at the receiver. The frequency coefficients of the reference image are used to extract the embedded data from the frequency coefficients of the received data-embedded image.
At the receiver side, a rolling shutter camera captures the intensity of display pixels that have passed through a noisy optical wireless channel. Due to the rolling shutter effect, a camera cannot capture all the transmitted image frames if
RD is faster than the capture rate,
RC, of the camera [
8]. Therefore, frame synchronization is achieved by capturing the transmitted image frames at least twice; i.e.,
. By doing so, the camera is able to capture all the displayed frames without losing any of them, and the decoding becomes easier. The noises in the channel affect the pixel intensity of the image, which varies markedly from the original ones. The captured images
and
are subjected to a degree of geometric distortion and are susceptible to other distortions such as rotation, scaling, and translation (RST) effects. Therefore, a geometric correction technique is utilized to correct the image distortions. As the data are present in the frequency coefficients of the image, the corrected images
and
are subjected to DCT. Next, the coefficient vectors
and
are extracted from the frequency-domain images
and
, respectively, and used for data decoding. The frequency coefficients of the reference image are simply subtracted from those of the data-embedded image. In this manner, the data can be extracted in the form of symbols
, which are de-mapped and channel-decoded to obtain the output message in the form of a binary data vector
.
2.1. Frequency Coefficient Extraction
The entire image requires DCT prior to embedding data into the frequency coefficients of
I.
Figure 3 shows the positions of the DCT coefficients for an image of size M × N. The top left corner is the DC component representing the average color of the entire frequency-transformed region. The remaining coefficients represent the changes in color when moving from the top left to the bottom right corner of the DCT transformed image. As the DC component preserves the average color of the entire DCT image, data embedding in this region can cause visual artifacts noticeable to the normal human eye. Embedding data in the low-frequency (LF) region (with large-valued coefficients) degrades the visual quality of the image. Likewise, embedding data in the high-frequency (HF) region (with small-valued coefficients) renders the embedded data susceptible to noise present in the channel. This is because JPEG compression in the image capture process is associated with large data loss in the HF spectral region. Therefore, to ensure robust communication in the presence of various types of noises in the optical wireless channel, we embed the data into the MF coefficients. The MF regions are less perceptually significant and carry comparatively less vital information of the image than the HF and LF regions. Therefore, embedding data in this region does not noticeably impact image quality or communication performance.
To select the MF coefficients, all elements from the M × N-sized
IF matrix are arranged in descending order. Then, after excluding the first 10,000 coefficients underlying in the DC and LF region, the next
m highest coefficients are selected for data embedding;
m is the total number of input bits. Note that the number of excluded coefficients that occupy the DC component and the LF regions was determined according to the analysis of the value distribution of the frequency coefficients. The selected
m highest coefficients positioned under the MF region are termed the coefficient vector
XF and modeled as follows:
2.2. Encoding
Before encoding, the input binary data
are first channel-coded and then mapped to the embedding symbols
S of length
n. Subsequently, the data bits are mapped to two symbol levels, which are represented as:
Utilizing both
XF and
S from Equations (1) and (2), we applied three different spectral data-embedding mechanisms: M1, additive; M2, multiplicative; and M3, exponential. They are represented by the equations below:
where
is the MF coefficient vector selected for embedding, as shown in Equation (1).
is the coefficient vector after data embedding, and
α is a predetermined embedding factor that affects the visual quality of the data embedded image. More generally,
α can be viewed as a relative measure of the amount of adjustment needed to alter the visual quality of the image. We denote the three different mechanisms as follows: M1, additive embedding; M2, multiplicative embedding; and M3, exponential embedding. M1 is the most general type of data-embedding technique and is widely used for digital image watermarking and steganography. In such cases, the coefficient vector is directly added to the product of
α and S. M2 is a special case of M1, where
, and M3 can be expressed as
. This is equivalent to M1 but uses the logarithms of the original values of the coefficient vectors.
As the mathematical forms of data-embedding mechanisms differ, their values of α also differ. For M1, a large α is preferred for encoding, whereas M2 and M3 use comparatively smaller values. This is because α variation for M1 minimally impacts the embedding results but significantly affects the results of M2 and M3.
Figure 4 presents the data-embedded images obtained using the three different mechanisms.
Figure 4a is the original image, and
Figure 4b is the data-embedded image using M1 with a relatively large value of
α.
Figure 4c,d are data-embedded images using M2 and M3, which are respectively encoded with small values of
α. Although their PSNR values differ, encoded images do not contain any obvious artifact when viewed by the normal human eyes. Thus, the proposed data-embedding method of a D2C system can transmit data while maintaining the original purpose of the display.
2.3. The Wireless Optical Channel
D2C systems operating in the visible light spectrum (380 to 740 nm) use light-emitting sources to transmit information. These systems operate using a wireless optical channel, where transmission occurs over an unguided medium via visible optical carriers. The wireless optical channel is relatively secure and immune to electromagnetic interference. In addition, the optical channel does not emit harmful radiation, and it operates on inexpensive and readily available transceivers.
The communication performance of a D2C system significantly depends on the orientation and position of the transceiver components, i.e., the AOC and D. The AOC is the angle at which the display plane and camera are mutually aligned. An AOC of 90° affords excellent D2C communication, while a large D between the display and camera limits the image resolution at the receiver. Furthermore, the performance of a D2C system is seriously affected by interference from opaque objects in the path of the visual components.
In a D2C system, the information signal is modulated by the light intensity. This is termed intensity-modulated direct detection (IM/DD), where the transmitted signal is proportional to the light intensity. Similarly, on the receiver side, the camera captures the pixel intensity of the display. The pixel is the primary unit for detection of received power, which corresponds to the photon arrival rate at the receiver. In OCC, the photon arrival rate is usually considered to be stochastic and is modeled using Poisson’s distribution. Therefore, the signal received via an optical wireless channel is affected by several types of noise. The amount of noise captured by the receiver, along with the display content, is affected principally by the room configuration, reflective characteristics of the display, AOC, transmission range, and position and orientation of the receiver. For an indoor D2C system, performance is limited by background illumination and external light sources, such as bulbs and incandescent lamps. Such sources induce a constant shot noise element at the receiver side, thus degrading the overall communication performance.
Although both the display and camera are digital devices, the transmission medium is analog and completely wireless. This means that digital-to-analog (D/A) and analog-to-digital (A/D) conversion are performed during both transmission and reception, which tends to degrade the transmitted signals. In addition, depending on the capture position of the camera, complex phenomena such as blurring and geometrical distortion may be evident in a captured image. Since a D2C system should consider all these operating conditions of the optical wireless channel, it differs from traditional image watermarking systems.
2.4. Decoding
The receiver camera captures the transmitted image sequence while looking at the electronic display. The captured images
and
undergo geometric correction to nullify spatial domain distortions, such as geometrical distortions and RST effects instigated by the transmission channel.
Figure 5a,b shows the captured image
and reconstructed image
after geometric correction, respectively. The corners of
are irregular, and the image is geometrically distorted. For geometric correction, we employed a perspective transformation technique using the four corners of the region of interest (ROI) in the captured image. This process was also applied to the captured reference image
to generate the same-sized image. Next, the corrected images
and
were subjected to DCT and transformed into their respective spectral domains
and
. From the available coefficients, the MF region was selected in a manner as described in
Section 2.1, and the respective coefficient vectors
and
were extracted. Finally, by subtracting
from
, the data were extracted in the form of symbols as:
The symbol
obtained from the above simple subtraction contains information on the optical wireless channel of the D2C link, the original signal, and the embedding strength. Since the original symbol
S has levels of −1 and 1, the decoding process can be performed through the sign of
. The acquired symbol is a real number and is de-mapped to binary values
and channel-decoded into output message vector
as follows:
Note that the proposed decoding method requires a very simple operation; thus, it can be easily applied to a communication service requiring a small-scale and complexity-constrained receiver hardware.
3. Performance Evaluation and Results
In this section, we describe the results of simulations and real-world experiments of the proposed model, and performance evaluations in terms of BER, PSNR, and ADR. The real-world experiment was performed in an indoor environment considering a wireless optical channel between the display and camera. The parameters used in the real-world experiments are shown in
Table 1. The frame synchronization problem was alleviated by setting the capture rate of the camera to twice the transmitting rate of the display. To observe the feasibility of the proposed model with varying input data size, we set the length of data vector to 250 and 500 bits. Embedding was performed in such a way that all bits were successfully encoded in the preferred position of spectral domain image, signifying a 100% embedding rate.
Figure 6 shows actual experimental environments under various lighting conditions.
Figure 6a–c shows experiments performed under normal lighting conditions with
D = 15 cm,
AOC = 90°;
D = 20 cm,
AOC = 90°; and
D = 15 cm,
AOC = 30°, respectively. Similarly,
Figure 6d shows an experimental environment in the presence of ambient lighting with
D and
AOC set to 20 cm and 90°, respectively. For the input image, a 256 × 256 grayscale Lenna image was used to embed the data. The data bits were encoded using the three different embedding mechanisms described in
Section 2.2. For M1,
α was set in the range [10, 50], and for M2 and M3, the
α values were in the range [0.1, 0.3]. For error correction, we used the ½ convolution code in the experiment.
3.1. BER vs PSNR
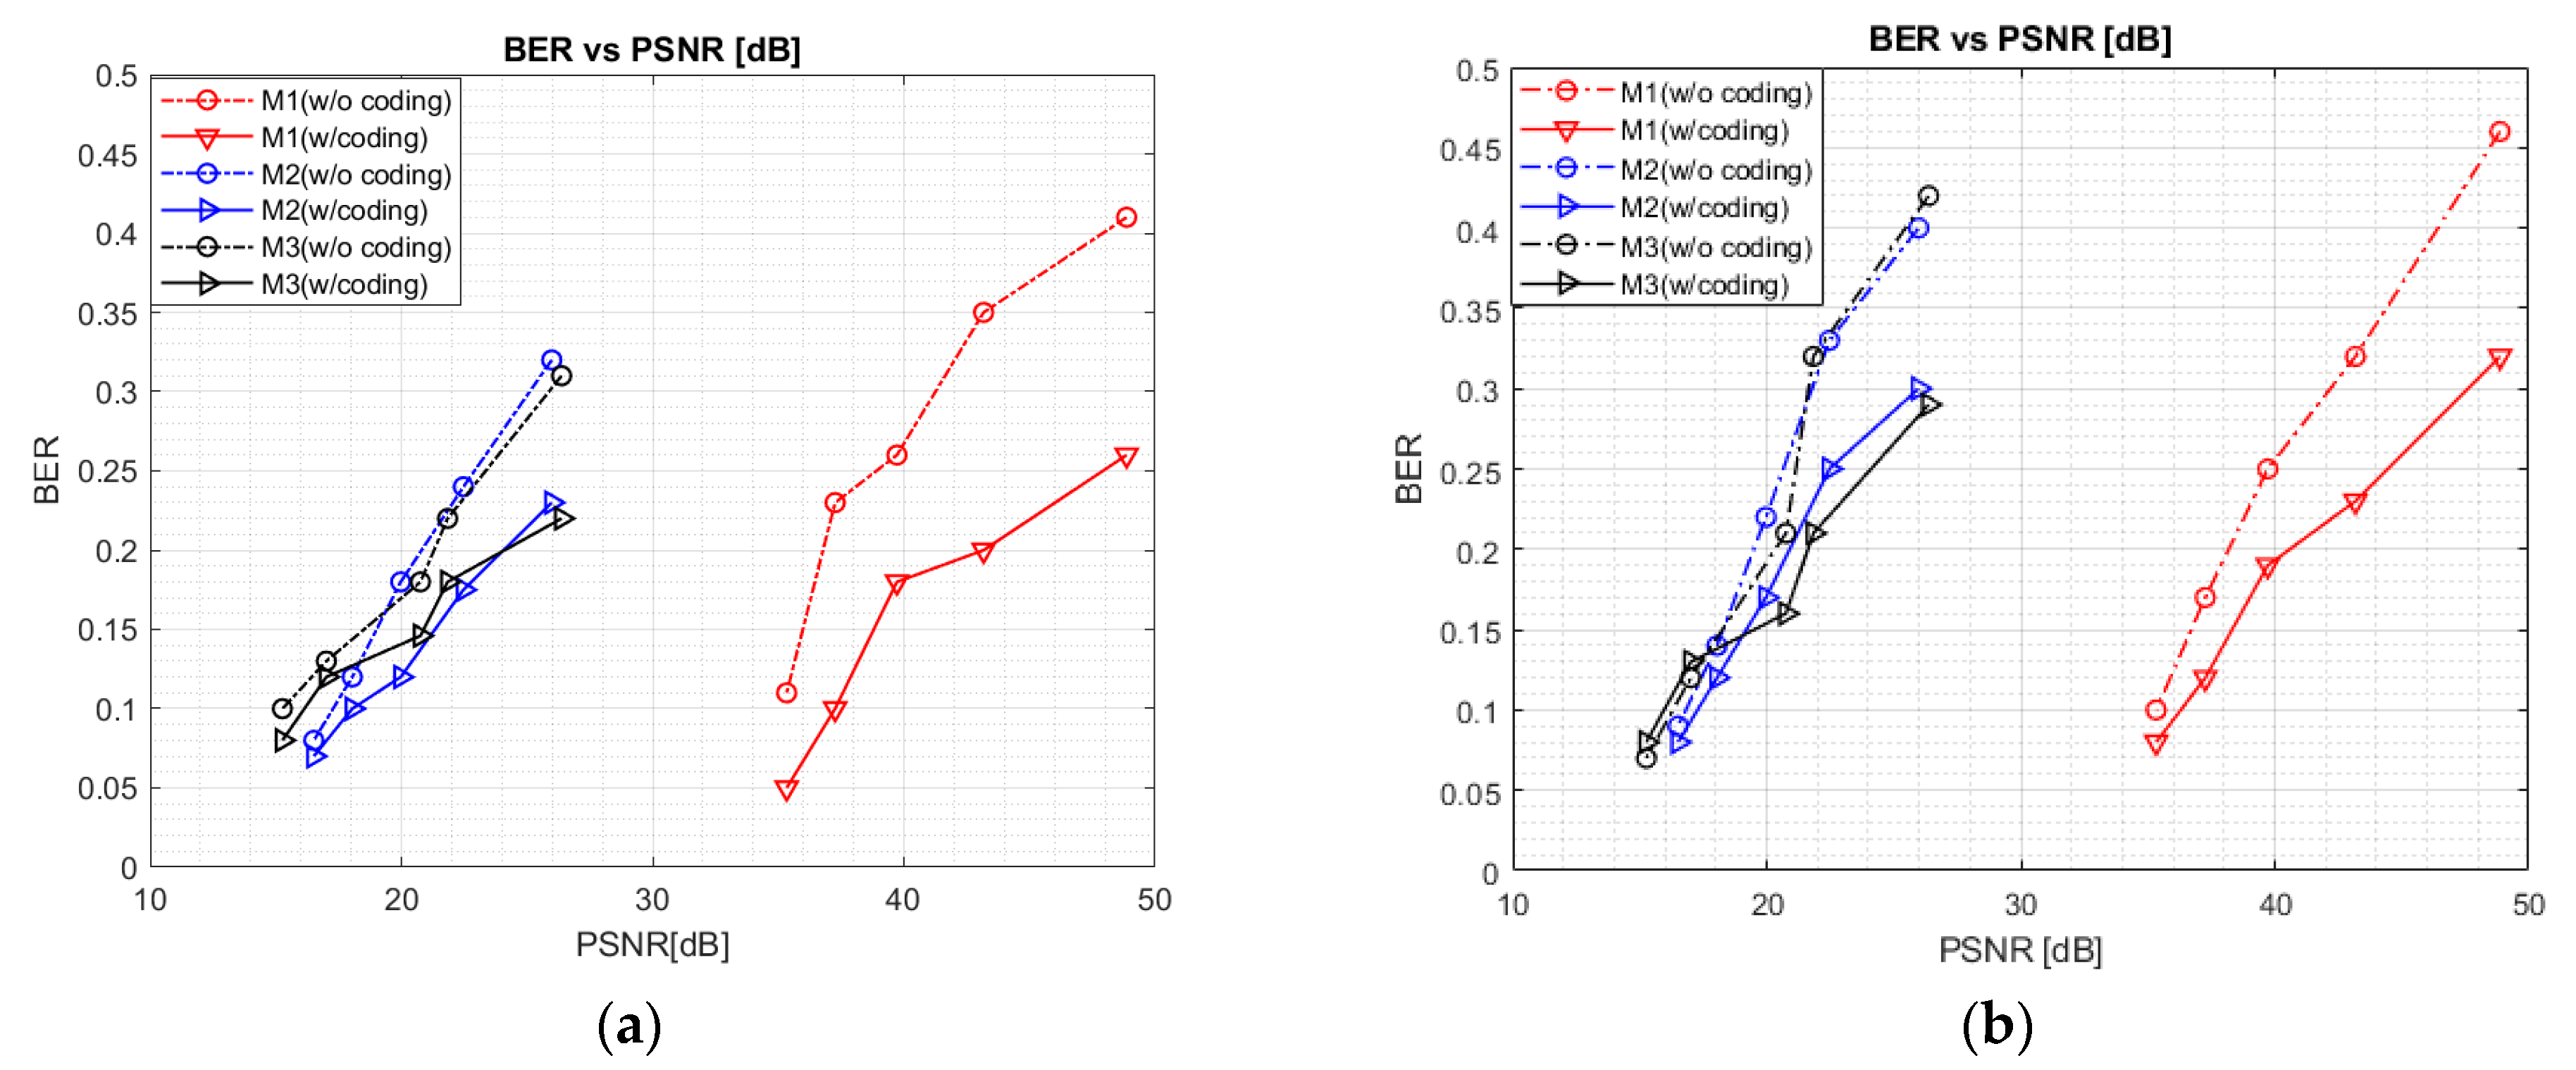
Figure 7a presents the simulated BER performance of all three data-embedding mechanisms with respect to the PSNR values. For this simulation, we considered the scenario in which the data-embedded images were not affected by channel noise. To observe the effect of geometric image rotation on BER performance, we rotated the data-embedded images by 10°. In all three mechanisms, we can observe the degradation of BER performance with increasing PSNR. However, at similar BER values, M1 outperformed M2 and M3 in terms of PSNR. When data were directly added to the selected frequency coefficients, the intensity of image pixel was less affected, and thus the PSNR of M1 was better than others. Furthermore, we can observe a significant increment of BER for all mechanisms when the PSNR increased along the x-axis. Although a higher PSNR indicates better image quality, it is achieved in the cost of degraded communication performance. From Equations (3)–(5), we can note that the PSNR has an inverse relationship with
α. With a small value of
α, the visual quality of the data-embedded image is well preserved, and the PSNR value is high. On the other hand, a larger
α tends to degrade image quality and the PSNR value becomes low. In
Figure 7b, when the size of
b was increased from 250 to 500, we can see that BER performance is slightly degraded. However, since this result is caused by sending data twice as much, the user can control this trade-off relationship according to the communication requirements of the target system.
Figure 8 depicts the BER performance under real-world conditions with optical wireless channel, using a commercial display and off-the-shelf smartphone camera. It can be seen from the figure that the trend of the overall curves is similar to that of
Figure 7. For M1, M2, and M3, the BER is observed to be poorer for a higher PSNR level, resulting in a degradation of communication performance. As a wireless optical channel was introduced between the display and camera during the real-world experiment, the system was more resilient to errors, leading to a much greater deterioration of the BER than in the previous experimental results of
Figure 7.
3.2. ADR vs PSNR
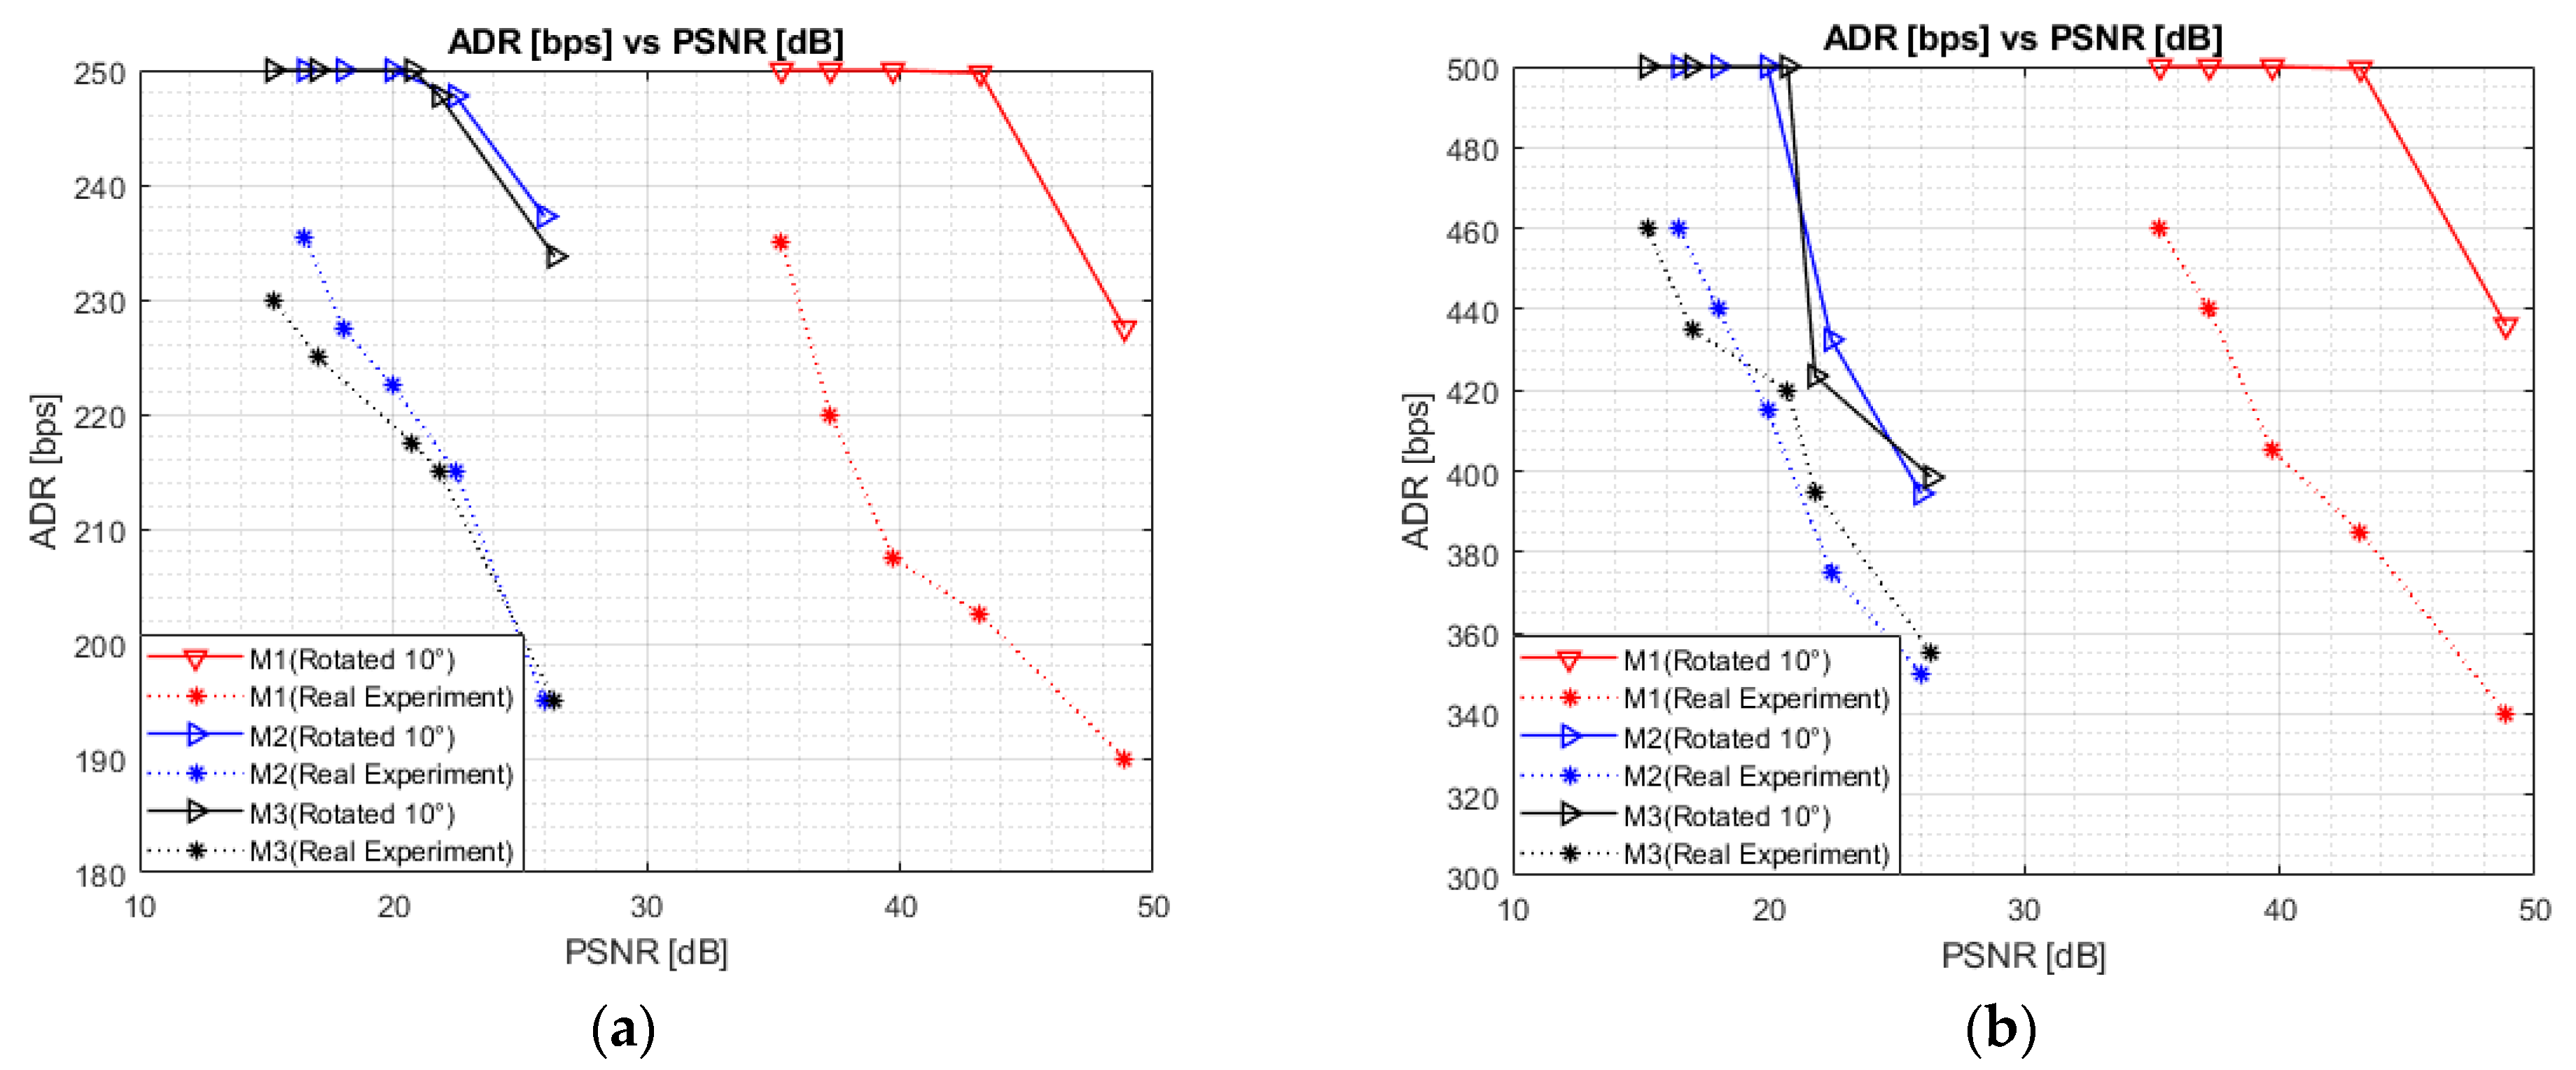
Figure 9 presents the ADR of the proposed D2C model with respect to the PSNR values for all three mechanisms of data embedding. We performed a real-world experiment and image rotation simulation respectively, with and without considering the optical wireless channel. We can observe that the system yields relatively higher ADR values at a lower PSNR level. This is because the ADR is directly related to the BER, i.e.,
. For all three data-embedding mechanisms, a maximum ADR of approximately 460 bps was achieved under real-world conditions for all perspective parameters.
3.3. Transmission Distance and the AOC
Figure 10 shows the BER performance of all three data-embedding mechanisms with respect to
D and
AOC. For the experiment,
α for M1 was set to 30, and that for M2 and M3 was set to 0.2. To investigate the BER performance with distance,
D was increased from 10 to 30 cm. The
AOC was set to 90°, representing a perfect angular alignment between the display and camera.
Figure 10a shows that the BER performance is degraded with increasing
D. This is attributable to image blurring and an out-of-focus effect introduced when capturing images over a large distance. Blurring introduces phase noise, which impairs the transmitted data; blur is usually modeled as additive white Gaussian noise (AWGN) in wireless communication scenarios. Similarly,
Figure 10b shows the effect of the
AOC on the BER performance of the D2C system. To observe the effect of the
AOC on communication performance, we varied the angle from 30° to 150° at a constant transmission distance of 15 cm. We can observe an excellent BER performance for an
AOC of 90°, but errors occurred as the
AOC was significantly varied around 90°. BER performance is completely dependent on the transmission distance and angle at which the camera captures the display content. Therefore, to optimize D2C communication performance, the display and camera must be close, and the
AOC should be set as close to 90° as possible.
3.4. D2C Performance According to Changes in Ambient Lighting
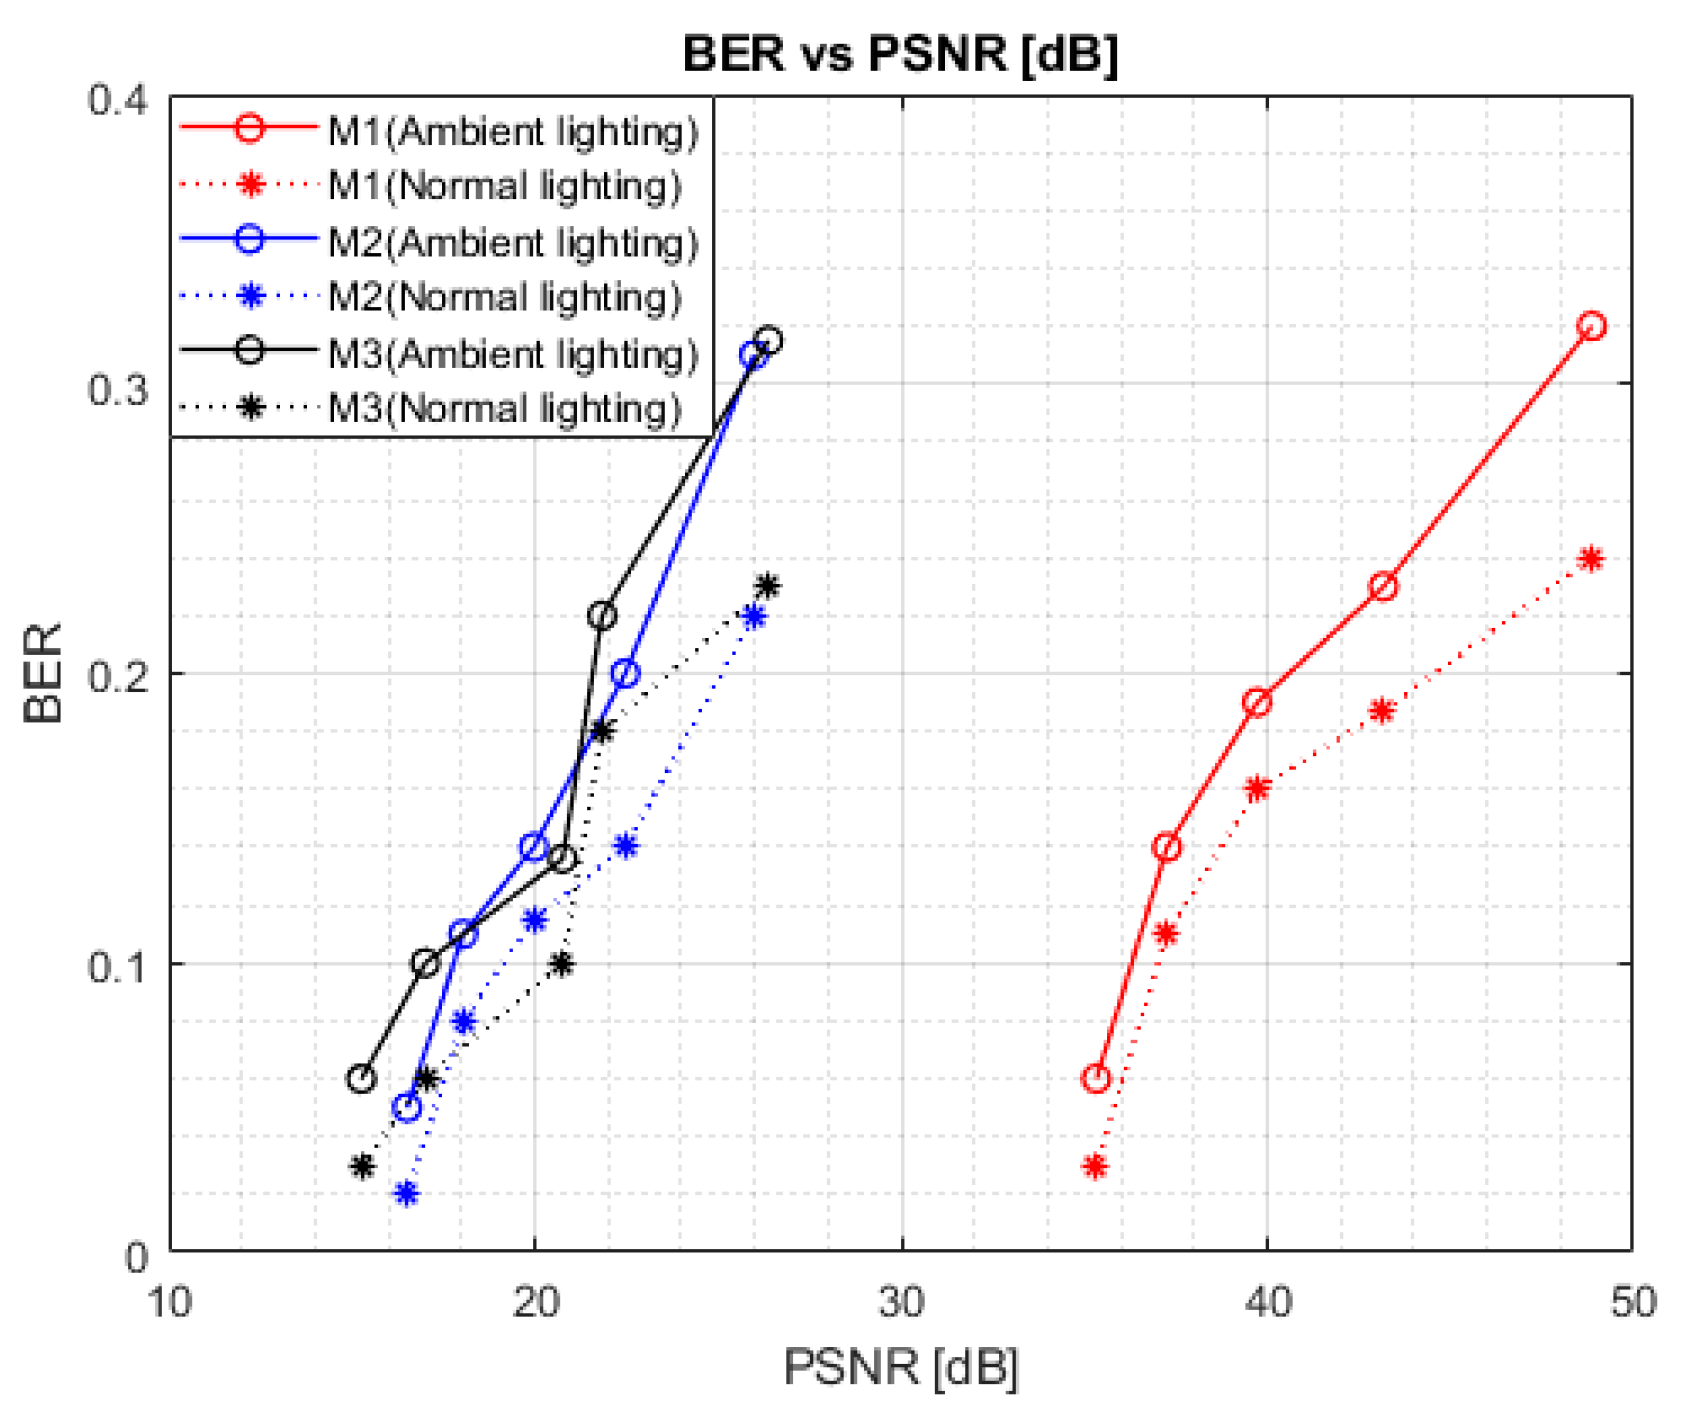
Figure 11 shows the BER performance of the proposed D2C system under ambient lighting. Experiments were performed inside a closed room with “normal” and “ambient” lighting. To achieve normal lighting, the room lights were turned off and only the natural light was provided. On the other hand, under the ambient lighting condition, all room lights were turned on. For all data-embedding mechanisms, under the similar PSNR levels, we can observe that the BER performance is relatively poorer when images are captured with “ambient” lighting compared to “normal” lighting. This is because the captured images under “ambient” lighting were overexposed to light and their intensities were thus much greater than usual. This lowers the probability of successful decoding when data is extracted from the captured image. It is also clear from the figure that of the three data-embedding mechanisms, M1 can provide an optimal BER performance of 0.06 with a PSNR of approximately 35 dB when tested under “ambient” lighting conditions. Therefore, regardless of the transmission environment under unfavorable lighting conditions, it is certainly possible to choose data embedding with M1 in order to achieve robust communication performance and higher image reconstruction quality. Note that the ultimate BER performance of the proposed system under frequently changing lighting conditions is significantly dependent on the amount of variation or alteration in the pixel intensities of the captured image.
3.5. Embedding in Different Areas of the MF Region
In this sub-section, we evaluate the performance of the proposed D2C model by embedding data into different areas within the MF region of a DCT image. The MF region was split into three sub-regions, each of which holds 200 bits of . Here, the α value for M1 was set to 30, and those for M2 and M3 were set to 0.15. D and AOC were set to 15 cm and 90°, respectively. To assign embedding positions for the sub-regions (A, B, and C), the coefficients of the MF region were sorted in descending order. The bit capacity for each sub-region was specified based on the sorted coefficients, where a total of 600 highest coefficients were selected (200 for each sub-region). Sub-region A contained the top 200 coefficients and so on for sub-regions B and C.
Embedding data in different sub-regions did not alter the BER performance of any mechanisms. However, the visual quality of the data-embedded image was affected instead.
Table 2 shows the PSNR data of the three data-embedding mechanisms. In each case, three different sub-regions within the MF region were selected for embedding. Here, each sub-region acts as a separate coefficient vector of length 200. We can observe that the PSNR levels of the three sub-regions differed significantly, even though the data-embedding mechanism was identical. M1 exhibited the highest PSNR level when the data were embedded into sub-region C. With M1, the smaller coefficients of this region are directly added to the product of
α and
. Whenever such values are selected for embedding, the difference between the input image and data-embedded image is minimal, leading to a better PSNR. On the other hand, for M2, the PSNR increased significantly when data were embedded into sub-region C of the MF region. Here, the smaller coefficients of the sub-region are multiplied by
, yielding very small differences between the input and data-embedded images, and thus a higher PSNR. Similarly, for M3, the PSNR was highest when sub-region C was selected for embedding. Here,
is exponentially multiplied by the selected coefficient vector, which presents also small values. Thus, a higher PSNR can be maintained, given only the slight difference between the input and data-embedded images. Note that these sub-regions tend to reside on the lower part of the MF coefficients, close to the HF region. The insertion of data into such regions prevails successful data embedding with less visual artifacts and the higher PSNR level.


