Article

Robust Active Shape Model via Hierarchical Feature Extraction with SFS-Optimized Convolution Neural Network for Invariant Human Age Classification

1
Department of Computer Science, Air University, Islamabad 44000, Pakistan
2
Department of Computer Science and Software Engineering, United Arab Emirates University, Al Ain 15551, United Arab Emirates
3
Department of Human-Computer Interaction, Hanyang University, Ansan 15588, Korea
*
Author to whom correspondence should be addressed.
Electronics 2021, 10(4), 465; https://doi.org/10.3390/electronics10040465
Submission received: 22 January 2021 / Revised: 8 February 2021 / Accepted: 11 February 2021 / Published: 14 February 2021
(This article belongs to the Special Issue Evolutionary Machine Learning for Nature-Inspired Problem Solving)

Abstract

:
The features and appearance of the human face are affected greatly by aging. A human face is an important aspect for human age identification from childhood through adulthood. Although many traits are used in human age estimation, this article discusses age classification using salient texture and facial landmark feature vectors. We propose a novel human age classification (HAC) model that can localize landmark points of the face. A robust multi-perspective view-based Active Shape Model (ASM) is generated and age classification is achieved using Convolution Neural Network (CNN). The HAC model is subdivided into the following steps: (1) at first, a face is detected using aYCbCr color segmentation model; (2) landmark localization is done on the face using a connected components approach and a ridge contour method; (3) an Active Shape Model (ASM) is generated on the face using three-sided polygon meshes and perpendicular bisection of a triangle; (4) feature extraction is achieved using anthropometric model, carnio-facial development, interior angle formulation, wrinkle detection and heat maps; (5) Sequential Forward Selection (SFS) is used to select the most ideal set of features; and (6) finally, the Convolution Neural Network (CNN) model is used to classify according to age in the correct age group. The proposed system outperforms existing statistical state-of-the-art HAC methods in terms of classification accuracy, achieving 91.58% with The Images of Groups dataset, 92.62% with the OUI Adience dataset and 94.59% with the FG-NET dataset. The system is applicable to many research areas including access control, surveillance monitoring, human–machine interaction and self-identification.

1. Introduction

Despite changes in lifestyle and environment, the first signs of human facial aging show up between the ages of 25–30 years. It is a progressive transformation in the skin, soft tissue and the skeletal structure of the face. The face and neck appearance typically changes in the late 30s. The face appears more flabby or drooping over time due to the loss of muscle tone and thinning skin whereas in some people, a double chin appears on the face due to the sagging jowls. To some extent, wrinkles cannot be avoided [1]. The skin smoothness and tightness decrease with age which causes the appearance of wrinkles, crow’s feet around the eyes and bags under the eyes become more prominent. Normally, changes in the growth of the bones occur in childhood whereas in puberty changes in the texture of the skin are the most intense and noticeable [2]. Aging-related changes allow humans to estimate the age of an individual just by looking at their face. However, some researchers in this field conclude that humans cannot predict the age of the persons accurately. Thus, an efficient automated system that can estimate the human age correctly is required [3].
The aim of automated human age classification (HAC) models is to estimate a person’s age with information derived from his/her face image by using dedicated algorithms. The problem encountered during age classification is the shared similarities with other typical face image interpretation tasks in which the execution phase includes the method of face detection, locating characteristics of face, formulation of feature vectors and age classification. According to the age estimation system applicability, the classification result can be an estimate of the exact age of a person or the age group of an individual or even a binary result indicating whether the age of a subject is within a certain age range. Among those three variations listed above, the classification into age-groups is used in several applications. Despite this, it is important to have a rough estimate of an individual’s age rather than his/her exact age. Another prominent problem encountered during age estimation is the range of ages considered. This parameter is important because different aging signs appear in different age groups; hence, the system that is only trained with specific age groups may not be applicable to more diverse age ranges [4].
The information depicted from the face has drawn the research attention in the image processing research field [5,6,7,8,9]. Human age estimation or age group classification [10] using images has vast applicability potential in age-invariant face identification, face recognition across ages, commercial and law enforcement areas [11,12,13,14,15], security control and surveillance, e-learning, biometrics, human–machine interaction [16,17,18,19,20] and electronic customer relationship management (ECRM). The main goal of HAC study is to draw out the different patterns and variations that occurred in the appearance of the face from childhood till adulthood to best characterize an aging face for accurate age or age group estimation. Although many researches have been carried out to estimate human age, still automated age estimation accuracies of current systems are far below the accuracy achieved by humans [21].
The facial aging of an individual is based on several aspects from lifestyle, psychology and occupation to environmental factors. Human age can be categorized into two factors; intrinsic and extrinsic. In extrinsic factors the human face is affected by the environment and occupation whereas the intrinsic factor includes components like bone symmetry and genetic influences which occur naturally over time [22]. During childhood, the main variations that occur on the face are due to the craniofacial development which causes changes in shape of the face due to the rapid growth and development of facial tissue. This can cause changes in the proportions of the face [23]. Facial bones lose volume as the years pass and this causes the appearance of aging on the face. In older females, the eye bone socket is larger than in younger years, the lower jaw bone angle and the angle of the eyebrow is reduced. With the passage of time, the forehead slope releases space on the cranium. During childhood, the bone structure of the face drifts causing changes in face shape. In adulthood, different texture changes like wrinkling and loss of skin elasticity occur on the face. Aging is common in all males and females but it can appear faster in females than males; however, it is yet not clear whether this is caused by the rate of aging or by sexual dimorphism [24]. Differences in male facial aging include manifestations of facial hair like beards, increased thickness of bones, facial vascularity, sebaceous content and potential differences in fat and bone absorption rates. The formation of deeper wrinkles around the mouth area is common in women as compared to men since women’s skin has fewer appendages like wrinkling and freckling compared to men [25].
Our proposed work is subdivided into the following steps. At first, the face is detected using the YCbCr color segmentation model. Second, 35 landmarks are plotted on the face using a connected components and ridge contour method. An Active Shape Model (ASM) is generated over the face using two approaches, namely, three-sided polygon mesh and perpendicular bisection of triangle. Feature extraction is achieved using two techniques, namely, image representation and aging patterns. The Sequential Forward Selection (SFS) technique is used before classification to select the ideal features for classification. Finally, CNN is used to achieve accurate age group classification.
The main contributions in our HAC system are enlisted here:
  • Texture feature vectors are not enough for better age classification accuracy. For accurate and robust age classification results, we have specified 35 landmark facial features points.
  • We map a multi-perspective views Active Shape Model (ASM) on the face for better age classification accuracy.
  • Our salient texture and landmarks localization feature vectors provide far better accuracy than other state-of-the art techniques.
  • The selection of the ideal set of features is achieved using a Sequential Forward Selection (SFS) algorithm along with the CNN classifier for human age classification.
This article is subdivided into the following sections. Section 2 describes the previous literature on human age classification approaches. Section 3 describes the methods and materials used in our robust HAC model. Section 4 describes the performance evaluation and experimental results obtained on three benchmark datasets while Section 5 present the conclusion and future work.

2. Related Work

Recently, a lot of research has been carried out on the age classification of individuals and age groups using 2D and 3D images. Facial age estimation is divided into two groups. The first group is from infancy to adulthood when most changes occur; the second stage is from the teenage to old age where skin color, texture and elasticity changes are most likely to occur. Various age estimation methods have been investigated. Recently, age estimation using multiple faces has been carried out by researchers. In this research article, we discuss age classification using single and multi-face datasets.

2.1. Age Classification via Classical Machine Learning Algorithms

Several age classification studies have been done using single face datasets as in [26] where the authors proposed an age estimation model in which features are extracted using LBP, active appearance model, and HOG. Age groups are categorized into three classes: child, adult and senior. For classification K-Nearest Neighbors, Support Vector Machine and Gradient Boosting Tree models are used. The system is evaluated on an FG-Net aging database and it achieved an accuracy rate of 82%. In [27], Principal Component Analysis (PCA) was used to predict the age. The system was classified into 7 age classes ranging from 10 to 60 years old. PCA and geometric features were used to extract the features. The system achieved 92.5% accuracy. The drawback of this system is they had only used the Euclidean distance between two points for feature extraction which may vary between distant images and close-up images. The technique for feature points localization does not give promising results in other datasets. To classify the human age from facial images, biologically inspired features are explored. Previously, a Gabor filters pyramid was used in biologically inspired models for all image points but the authors found that the use of pre-trained models for the S2 layer which are then developed to the C2 layer did not perform up to the mark in age estimation. In response, the authors in [28] proposed an STD operator to encode the ages of faces. The system evaluation experiment used two benchmark datasets, namely, YGA and FG-Net datasets. Both of these datasets are publicly available and the results were improved using these advanced methods.
Using multi-face datasets, the authors in [29] estimated the age of real-life faces, Local Binary Pattern (LBP) and Gabor features were extracted. For classification, SVM was used. The system was evaluated using a large dataset named The Images of Groups dataset and achieved an accuracy rate of 87.7%. The drawback of this model is that it can only deal with high resolution single faced images. In [30], the authors used the Gallagher benchmark dataset to estimate the age. LBP and FPLBP were used for feature extraction whereas SVM was used to classify seven age classes and an accuracy of 66.6% was achieved. The drawback of this model is that only MB-LBP is used for feature extraction which is not sufficient to get all the necessary information from the face image and thus achieves less accuracy. In [31], authors developed an automatic age and gender classification system using The Images of Groups dataset. The features were extracted using Multi-level Local Binary Pattern (ML-LBP); SVM with non-linear RBF kernel was used to classify the correct age.

2.2. Age Classification via Classical Deep Learning Algorithms

Age classification using deep learning methods promises to produce better classification results compared to machine learning techniques. This section describes age estimation or classification using deep learning methods on both single and multi-face age datasets. In [32], authors proposed a system to estimate age groups categorized in 4 classes: babies, young, middle age and old adults. The system is divided into three phases, namely, location, feature extraction and classification. The location phase can determine the positioning of the eyes, nose and mouth regions while the Sobel edge detector is used to estimate the symmetry of the facial features and the face. As a result, three wrinkle features and two geometric features are obtained. A neural network is used for the classification of the age groups. Two classifiers are used in this system. The first classifier uses geometric features in order to predict the age class, i.e., whether it belongs to the baby class, and, if not, then another classifier uses wrinkle features to accurately predict which of the remaining three age group classes it belongs. The system achieved and accuracy rate of 81.58%. In [33], the authors developed an age estimation system based on age manifold analysis. Different learning methods are applied to achieve sufficient embedding space. A multiple linear regression function is used to solve the low-dimensional manifold data. The experiments were done on a large number of dataset images and the results obtained show that the system was very effective in age estimation. The drawback of this system is that it requires a large amount of data during age manifold analysis to train the system enough in order to predict the age correctly.
In [34], the authors proposed two novel approaches for age estimation. The first approach is simple fusion-based effective descriptors on local appearance and texture to extract the features. The second approach is based on deep learning to estimate age. The two approaches are evaluated simultaneously using two big datasets namely FGRC and MORPH. Experimental results show better accuracy compared to the previous work. In [35], age estimation is entirely based on the local and global features. An active appearance model is used to obtain the global features. On the other hand, dimensional discrete cosine transform is used to extract the local features. The local and global features extracted from the FGNET aging database are combined and regression is used to predict the exact age of an individual. The drawback of this system is that AAM can only fit on frontal face images. In [36], the authors developed a system in which the features are extracted and classified using the CNN. The system is tested on an OUI Adience dataset and it achieved an accuracy rate of 62.34%. The system has some loop-holes in that it produces mis-labeling of old people as young and young people as old. Secondly, no pre-processing is done which can lead to mis-prediction of human faces in an image.
Our proposed system provides promising results in both single and multi-faces datasets. We have pre-processed the datasets’ images to remove the noise in all images in order to avoid any mis-classification. Our proposed robust ASM works well in different views of the face. Multi-texture-based and point-based features extraction methods boost the classification accuracy of our system.

3. Materials and Methods

This section is subdivided into six phases. First, the face is detected using a YCbCr color segmentation model; second, 35 landmarks are specified on the face using the connected components and ridge contour methods; third, an Active Shape Model (ASM) is generated on the face using two approaches—three-sided polygon mesh and perpendicular bisection of a triangle; fourth, feature extraction is done using two techniques—image representation consisting of a three sub-phase anthropometric model, carnio-facial development and interior angle formulation and feature extraction using aging patterns which are subdivided into two phases; wrinkles detection and heat maps. Fifth, the Sequential Forward Selection (SFS) technique is used in order to select the most ideal set of features. Finally, the CNN model is used to classify into accurate age groups. Figure 1 depicts the overall proposed architecture of the HAC system.

3.1. Pre-Processing and Face Detection

The goal of image pre-processing is to avoid redundancy in the images and to suppress undesirable distortion. This enhances image features which are required for further processing in later phases. In The Images of Groups and OUI Adience datasets, some of the images are not perfectly aligned. To horizontally set the alignments of the faces of both datasets, we have used the [37] code available on github. Secondly, the background subtraction in the images of both datasets is done by median filtering to remove the noise using a 5 × 5 window. Then, the filtered image is labeled and noisy regions are removed.
The literature reveals that many segmentation techniques have been developed. A binary decision in the color space representation can be defined by a skin detector. The threshold can be defined for each color component for a controlled acquisition.
YCbCr color segmentation is not affected by any variation of illumination in the Y (luma) factor. The description of the skin representation is based on two components: Cb(blue difference) and Cr (red difference) of the chrominance components. Other color segmentation models like HSV and RGB are not appropriate for skin detection. In RGB color segmentation models, the skin color region varies in all three channels. The histogram clearly shows that the skin color region is uniformly distributed across a large spectrum. The hue channel in HSV space shows a clear discrimination of the skin color regions. The range of the H component (hue) in HSV skin color segmentation mostly lies between 0 and 0.1 and between 0.9 and 1.0 with a normalized scale of 0 to 1.
Each individual’s skin color is unique. To get the full coverage of skin pixels, the RGB image is converted to YCbCr color segmentation model. This can provide exact coverage of skin pixels and easily distinguish between skin and non-skin pixels without being affected by illumination levels. The YCbCr skin color segmentation model is formulated as [38]
Y l u m = 0.299 R + 0.287 G + 0.11 B
C r = R Y l u m , C b = B Y l u m

3.2. Landmark Localization

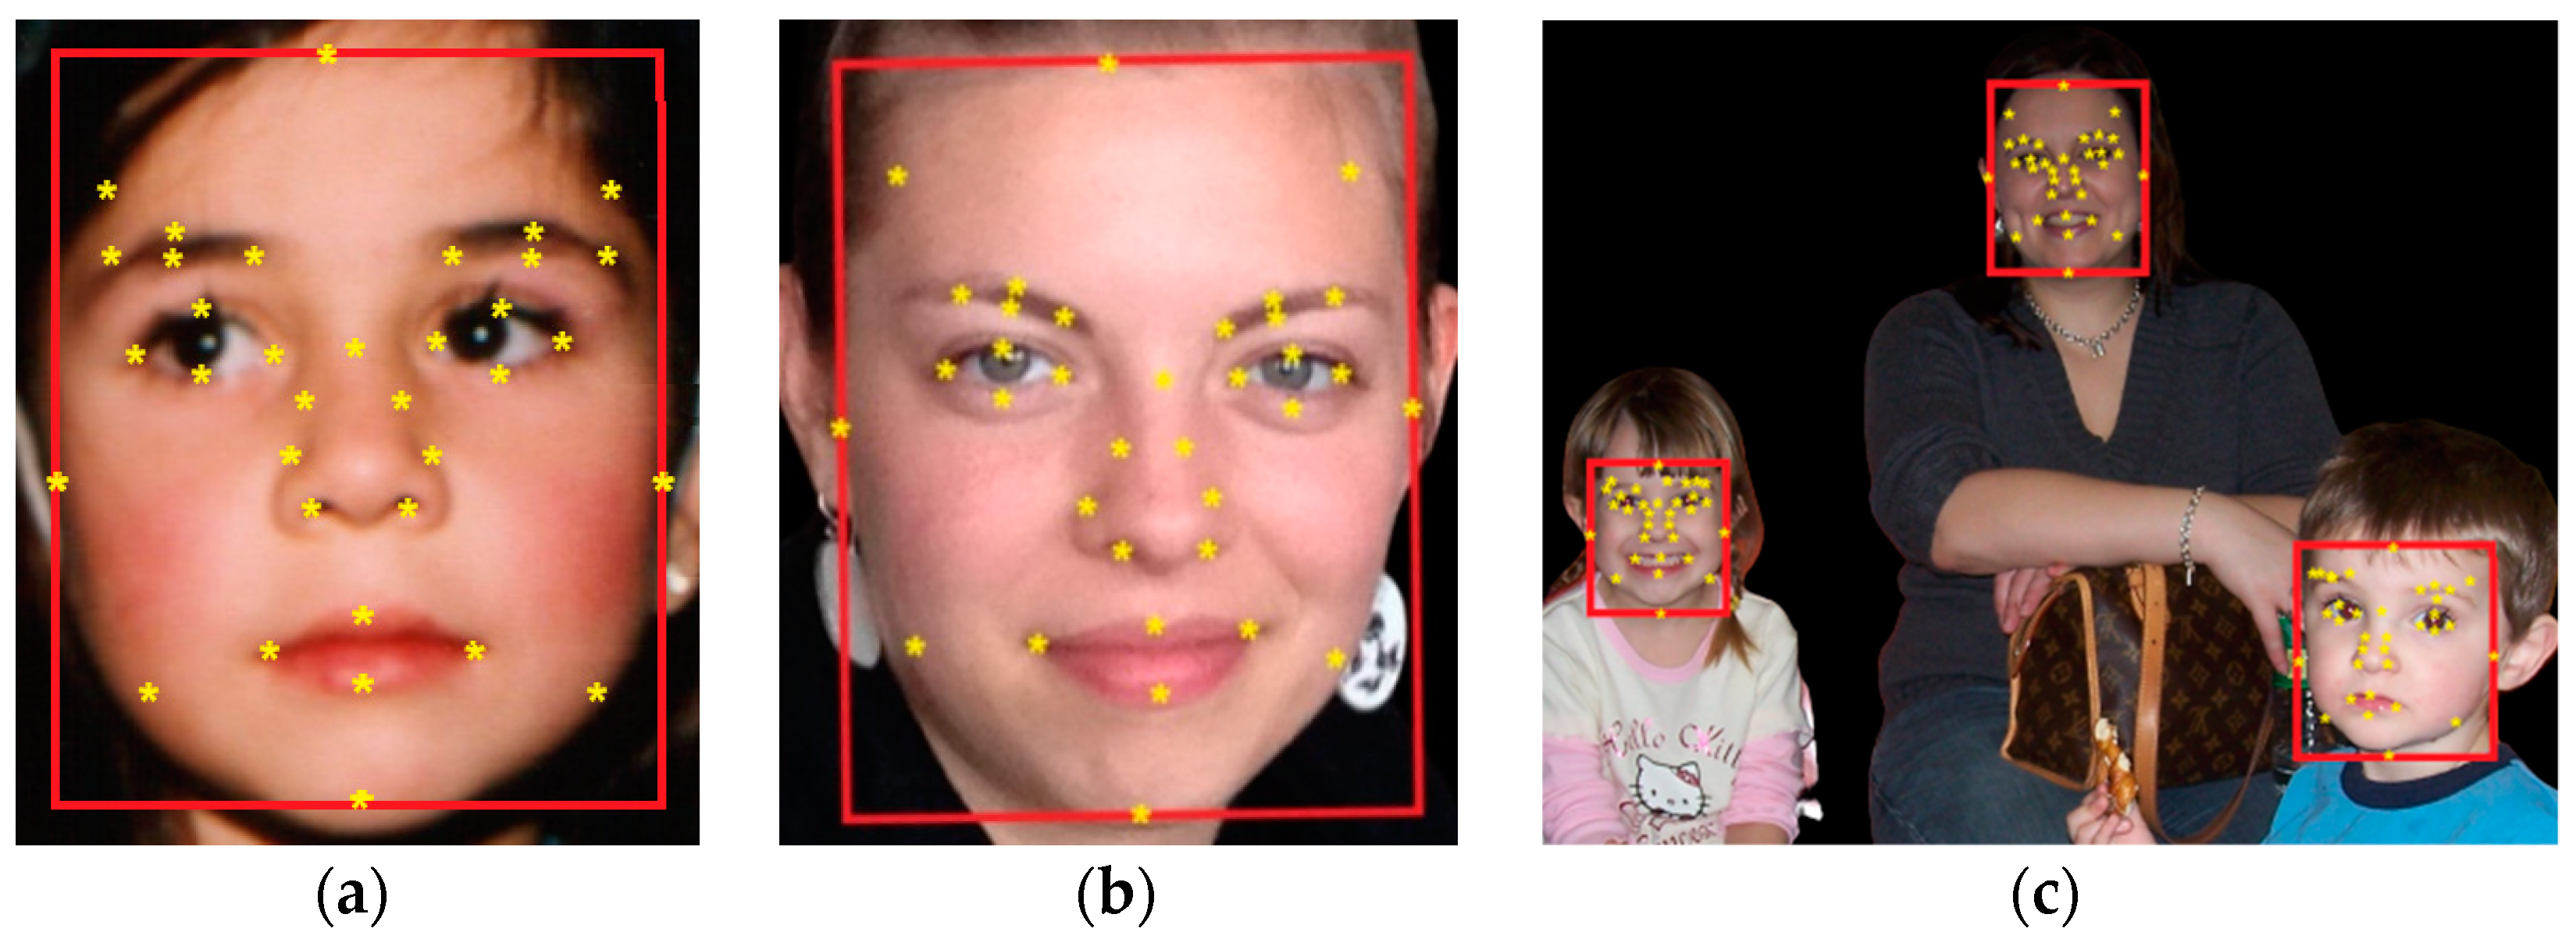
After face detection, the next phase is landmark localization on face features including the jaw area. Figure 2 shows the results obtained for face detection and landmark localization on the FG-NET dataset, the OUI Adience dataset and The Images of Groups dataset.
To plot the landmarks on eyebrows, eyes and lips, the image is first converted to a binary image [39]. A certain range is allotted to obtain the maximum connected face region. The above-mentioned facial features are then bounded by a blob, and the landmarks are localized on those features using the blob edge plotting technique [38] via Equation (3). For the nose, the ridge contour method [40] is used to mark the nose with the 7 landmarks. For the chin, jaw area and head area, the blob edges middle point is evaluated using Equation (4). Figure 3 represents landmark localization points ranging from 1 to 35.
In the following equation, p, q, r and s represent the edges of the bounding box and the midpoint of each edge is calculated as [38]:
a 1 = p 2 ;   a 2 = q 2 ; a 3 = r 2 ; a 4 = s 2
The midpoints between the above four points can be calculated as;
a n = ( a i + a j ) 2

3.3. Active Shape Model

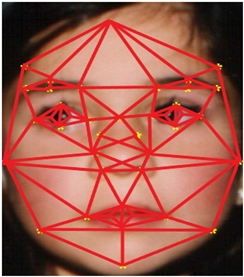
An Active Shape Model (ASM) is generated on the face using the 35 landmark points. In our proposed model, novel techniques are used for the generation of ASM which are three sided polygon meshes and the perpendicular bisector of a triangle. An ASM is a robust technique to determine the age of an individual. ASM is a successful method used in various areas such as face recognition, face detection, face aging development, etc. Given the image of a face and corresponding landmark localization points, a multivariate model of shape variation can be generated from the points by using polygon meshes and perpendicular bisectors of triangles. Basically, the shape of an Active Shape Model changes across age changes and this fact can be used to accurately classify individuals into age groups. For facial features like eyebrows, eyes and lips, the perpendicular bisection of a triangle technique is used to highlight the changes that occurred in facial features from childhood till adulthood. Figure 4 shows the ASM on different images of theFG-NET dataset. Algorithm 1 shows the Active Shape model formulation.
Algorithm 1. Active Shape Model
1:Input: Y: Position of 35 landmark points on face named Q={qi, i=0,1,2,…,n−1};
2: Output: Triangular Mesh of Q: TM(Q);
3: begin
4: Find the three outside points of a triangle (q1,q2,q3);
5: TM(Q):=[q1,q2,q3];
6: /*initialize TM(Q) to a large triangle.*/
7: Compute the random permutation of q0,q1,q2,…,qn-1 of Q;
8: for a=0 to n1 do
9: begin
10: /*insert qr into TM(Q).*/
11: Locate the triangle points qiqjqk TM(Q) containing qr;
12: If qr lies inside the interior of qiqjqk then;
13: begin
14: Add edges from qr to the vertices qiqjqk and Subdivide qiqjqk into smaller three triangles;
15: Localize_edge(qr,qiqj,TM(Q));
16: Localize_edge(qr,qjqk,TM(Q));
17: Localize_edge(qr,qkqi,TM(Q));
18: end;
19: end;
20: Remove q1,q2,q3 and all incident triangles and edges from TM(Q);
21: end;
After the Active Shape Model is mapped on a face, we proceed to the feature extraction step. This includes ASM features, anthropometric features, carnio-facial development features, interior angle formulation features [41,42], heat maps and wrinkles detection. Section 3.3 and Section 3.4 describe feature extraction using image representation and aging patterns, respectively. Algorithm 2 explains the overall definition of the salient features extracted and the ensuing process.

3.4. Feature Extraction Using Image Representation

In this section, feature extraction using image representation is discussed in detail. This section includes modeling techniques, i.e., the anthropometric model, carnio-facial development and the interior angles formulation of polygons. Features are extracted based on the landmark localization points. These modeling techniques will be described in detail in the subsequent sections.
In anthropometric modeling, the distances between the facial features are measured. Face anthropometry is all about the study of face sizes and proportions [43,44,45]. The landmark points are known by anatomical names. For instance, the midpoint between the inner corners of the eyebrows is known as Nasion and is denoted by n; the nostril points are known as alare, which is denoted by al; the front of the ear is known as the tragion and it is denoted by t; lip corners are known as cheilion and they are denoted by ch; the chin point is known as mental protuberance and it is denoted by mp.
Facial dimensions are taken by measuring the distance between the facial features and angles of inclination. The shortest distance between the landmark points is measured using the Euclidean distance. These distances cover the eight facial feature dimensions which are Bizygomatic breadth, Bigonial breadth, Menton-subnasale length, Subnasale-nasal root length, nose width, lip length, Bitragion-subnasale arc and Bitragion- menton arc [44]. Figure 5 shows all the anatomical names and facial dimensions. We take each landmark point as the reference point from which the distance is to be measured from one landmark point to the other. The shortest distance between landmarks is calculatedusing the following distance formula [44];
X = ( x 1 y 1 ) 2 + ( x 2 y 2 ) 2
where x1, x2, y1 and y2 are the pixels location along x and y coordinates.
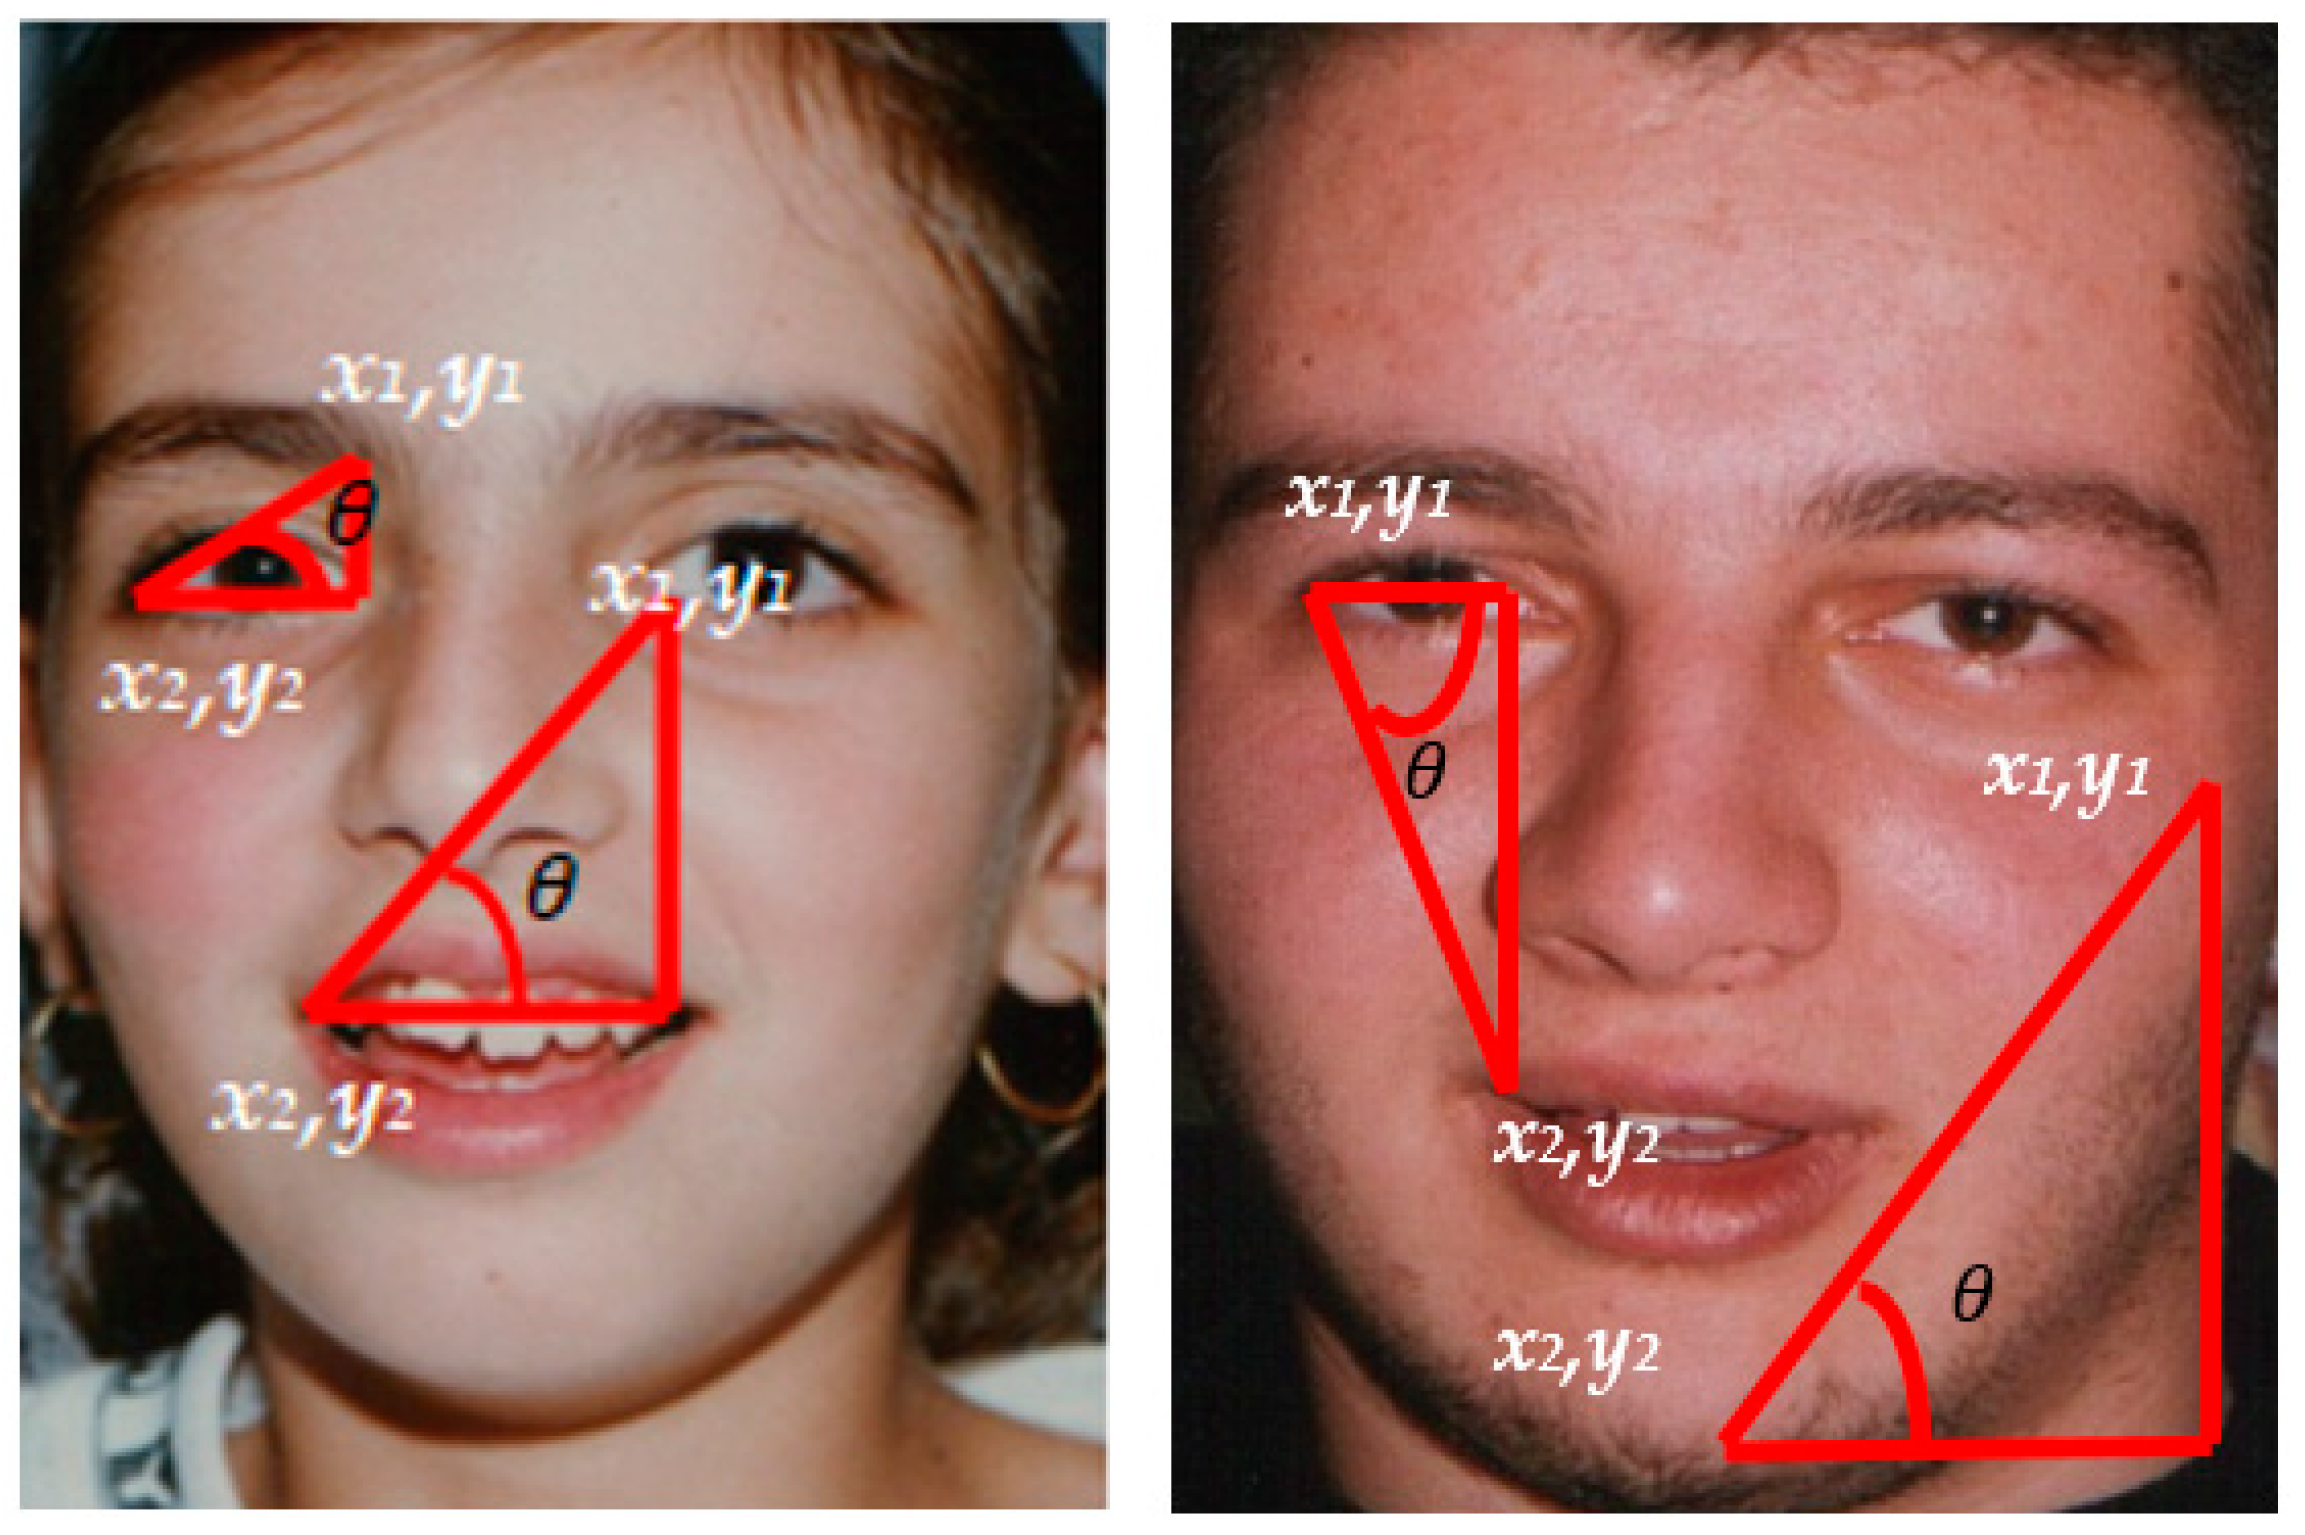
The angle of inclination is the angle between the line and the x-axis which is measured in a counterclockwise direction from the part of the x-axis to the right of the line [45,46]. The angle of inclination between the eyes and chinbone point and two chin points is calculated. The angle of inclination is measured as;
θ = t a n 1 ( y 2 y 1 x 2 x 1 )
where x1, x2, y1 and y2 are the coordinate points of the triangle. Figure 6 shows the angle of inclination.
Carnio-facial development theory is the study of a human face growth from infancy to adulthood. With the passage of time, changes in bone growth and development, soft tissue morphology and skeletal patterns are clearly visible. The physiochemical process by which an organism becomes large over time happens from childhood till adulthood. At birth, the largest to smallest dimensions of the face are depth, height and width. Naturally, the growth of the face is more rapid in depth, followed by the height, with slowest rate of growth found in the width.
From infancy to adulthood, a person’s facial development can be measured using the cardioidal strain transformation mathematical model. In this model, a circle is defined on the face to track the growth of the face by finding variations in the radius and circumference of the face. By taking the nose tip point as the central point of the face and then finding the radius of the circle, major changes in the radius values of the faces of all ages of individual are revealed. The radius of the circle is measured as in [43];
C = C ( 1 + k ( 1 c o s θ ) )
where C is the circle’s initial radius, k is the parameter that increases with time and   θ is the initial angle formed with the vertical axis. Figure 7 shows carnio-facial development across ages.
An ASM is a mesh of polygons. From infancy to childhood, the shape of these polygons changes along with their angles. In order to calculate the interior angles θ 1 ,   θ 2 ,   θ 3 of these polygons, we have used the law of cosine. For any number of the given sides in a regular polygon, all the interior angles are the same whereas for an irregular polygon the angles would be different. The interior angle of a polygon can be formulated as [18]
θ 1 = c o s 1 ( a 2 + b 2 c 2 2 a b )
θ 2 = c o s 1 ( a 2 + c 2 b 2 2 a c )
θ 3 = c o s 1 ( b 2 + c 2 a 2 2 b c )
where a, b and c are the sides of a triangle. Figure 8 shows the different interior angles measurements on two different age groups over OUI Adience dataset.

3.5. Feature Extraction Using Aging Pattern

Over time, the texture of an individual’s skin changes due to different factors like environment, stress, health and age. Age is the primary reason for texture changes which can manifest as wrinkles, baggy skin, under eye puffiness and many other signs. In this section, we discuss how changes in these aging patterns, from childhood till adulthood, can be measured by two techniques, namely, wrinkle detection and heat maps. These two aging detecting techniques will be described in detail in the subsequent sections.
For wrinkle detection, edges are the outside limits of an image. Wrinkles are detected on face images using the canny edge detection method. This provides the wrinkle edges in a binary image [47]. The wrinkles present in the binary image are the white pixels, so the quantity of the white pixels is equal to the quantity of edges in the regions of the face. Wrinkle information on the forehead area, around left and right eyelids, under the eyes and lips are calculated first. These wrinkle features (WF) are calculated as in [48];
W F = N F N 1 + N L E N 2 + N R E N 3 + N U N 4 + N L N 5
where NF is the number of white pixels on the forehead, NLE is the number of white pixels around left eyelid, NRE is the number of white pixels around right eyelid, NU is the number of white pixels under the eyes, NL is the number of white pixels around lips and N1, N2, N3, N4, N5 are the total number of pixels on the forehead, left eyelid, right eyelid, under the eyes and the lips, respectively. Figure 9 shows the wrinkles formation on face images over The Images of Groups dataset.
Heat maps are an effective way to extract useful information which helps in accurate age classification. Other global feature extraction methods lose useful information. In the heat map, HeatMap(z) calculates changes in the texture of the human face in the form of heat map matrix values categorized into dark colors to light colors over the identified face image. Dark colors identify parts of the image that contribute to the predicted class. Light colors show parts contradicting the predicted class. After the extraction of heat map values, we collect only dark color values that exhibit the correct class prediction using the heuristic thresholding technique and we place all extracted values in a 1D array. The heat map is calculated using Equation (12) and the example results of the heat map are represented in Figure 10.
H e a t M a p ( z ) = 0 w R G B ( u ) ,
where HeatMap(z) specifies the heat map array vector, u expresses index values and R G B   represents the index value of certain RGB pixels.
Algorithm 2. Feature Extraction
1: Input: Y: Position of 35 landmark points on face;
2: Output: Generated Features;
3: /* Active Shape Model*/
4: /* Anthropometric features*/
5: /* Carnio facial development*/
6: /* Interior angle formulation*/
7: /* Heat Maps*/
8: /*Wrinkle detection*/
9: Active Shape Model
10: /*Polygon meshes andperpendicular bisection of triangles are evaluated*/
11: TM(Q):=[q1,q2,q3];
12: Localize_edge(qr,qiqj,TM(Q));
13: Localize_edge(qr,qjqk,TM(Q));
14: Localize_edge(qr,qkqi,TM(Q));
15: Anthropometric features:
16: /* Distancebetweendifferent anatomical named features and angle of inclination is calculated*/
17: D i s t a n c e = X = ( x 1 y 1 ) 2 + ( x 2 y 2 ) 2
18: A n g l e o f i n c l i n a t i o n = θ = t a n 1 ( y 2 y 1 x 2 x 1 ) ;
19: Carnio-facial development:
20: /* Finding the variation on the growth of the face by measuring the radius and circumference from infancy to adulthood*/
21: C = C ( 1 + k ( 1 c o s θ ) ) k = c a r n i a l s t r a i n ;
22: Interior angle formulation
23: /* Finding the variation in the interior angles formed on face by using the face mask. */
24: θ 1 = c o s 1 ( a 2 + b 2 c 2 2 a b ) ;
25: θ 2 = c o s 1 ( a 2 + c 2 b 2 2 a c ) ;
26: θ 3 = c o s 1 ( b 2 + c 2 a 2 2 b c ) ;
27: Heat Map
28: H e a t _ M a p ( z ) = 0 w R G B ( u ) ;
29: Wrinkle detection
30: /* Finding the variation of wrinkles over different facial features and finding the accumulative score of the wrinkles detected */
31: W F = N F N 1 + N L E N 2 + N R E N 3 + N U N 4 + N L N 5 ;
32: Augment all features extracted;
33: A = | A S M | | X | | θ | | C | | θ 1 | | θ 2 | | θ 3 | | I | | H e a t M a p | | W F | ;
34: Project A on Sequential Forward Selection (SFS);
35: Z = 1 N 2 i = 1 N j = 1 N S i , j ;
36: Project Z features on CNN;
37: Return Q;
38: end;

3.6. Feature Selection Using Sequential Forward Selection (SFS)

The SFS technique allows us to select the highest distinctive features and filter out irrelevant and redundant data which can decrease the overall classification accuracy of the age estimation model. This is a bottom-up approach that can take an empty feature set S and gradually add new features that are selected by an evaluation function. This can reduce the mean square error and produce extended features. The feature selection method has been widely used in biometrics and surveillance applications.
This feature selection technique helps to minimize the original feature space. The SFS feature selection procedure depends upon the selection criteria or an objective function to extract the ideal features helpful in the age estimation process. In this proposed work, two validation criteria are used. The first is used to approximate different clusters of the age groups. In this work, the Bhattacharyya distance measure is used. It can measure the separation score Sa,b between two classes a and b given which are calculated as [49];
S a . b = ( m a m b ) ( Σ a Σ b 2 ) 1 ( m a m b ) T
where m a and Σ a are the mean and covariance of class a. For N number of classes, the separations core is computed as [49];
Z = 1 N 2 i = 1 N j = 1 N S i , j
For the estimation of different age groups for a given image, a validation-based evaluation criterion is proposed in order to derive feature subsets that can be guaranteed to reduce classification errors and provide higher inter-class separability across different age groups. For the OUI Adience dataset, the ideal features are: (1) ASM, (2) anthropometric model, (3) carnio-facial development, (4) interior angles and (5) wrinkle detection. For Images from the Group dataset, the ideal features selected are: (1) ASM, (2) anthropometric model, (3) carnio-facial development, (4) wrinkle detection and (5) heat maps. Figure 11 shows the number of ideal features selected using the SFS algorithm.

3.7. Age Estimation Modeling

The salient features extracted by the above-mentioned techniques are passed to a Convolution Neural Network (CNN) to classify in the correct age groups over three benchmark datasets. CNN is mostly used for image-based deep learning applications [50,51,52]. CNN provides higher classification accuracies than other deep learning methods due to its ability to extract and learn image-based features. CNN also uses a small amount of bias and weights to achieve high classification accuracy.
In our proposed 1-D CNN model, the feature set extracted from The Images of Groups dataset is organized as 5080 × 536 which is used as an input to the CNN where 5080 is the number of images and 536 is the feature vectors. Figure 12 depicts the structure of a 1-D CNN in the proposed work. The proposed CNN model has three convolution layers, three pooling layers and one fully connected layer. The result obtained by the CNN is the prediction of the individual’s age from different age groups via a fully connected layer. The input matrix in the first convolution layer Conv1 is convolved with the 32 kernels with a size of 1 × 7. A matrix of 5080 × 530 × 32 is generated as a result. The matrix convolution on the convolution layer is calculated as [53]
C o n v b ( a + 1 ) ( c , d ) = R e L U ( u )
R e L U ( u ) = i = 1 y Ω ( c , ( d i + y + 1 2 ) ) W b a ( i ) + α b a
where C o n v b ( a + 1 ) ( c , d ) produces the convolution results for the coordinates (c, d) of the a + 1 layer with the bth convolution map. Ω is the previous layer map and y is the kernel size [54]. W b a is the bth convolution kernel for the ath layer. α b a is the bth bias values for the ath layer.
Activation function ReLU, which is the sum of the weights of the previous layer passed to the next layer, is used. The second layer is the pooling layer Pool1. Pooling layer down samples the result produced at the first convolution layer Conv1 to a matrix size of 5080 × 265 × 32 via 1 × 2 max-pooling. In the pooling layer, a 1 × 2 sliding window is applied to the result produced by the previous convolution layer by selecting the maximum value. Thus, the pooling results of the (a + 1) thlayer, b kernel, x row and y column can be represented as [53];
P o o l b ( a + 1 ) ( x , y ) =   m a x ( C o n v b a ( x , ( ( y 1 ) × ( m + n ) ) )
where 1 ≤ mn and z is the pooling window size. Following the same method for the second convolution layer Conv2 with 64 convolution kernels with the size of 1 × 6. In the same way, 1 × 2 max-pooling is applied in the second and third pooling layers. The third pooling layer generates an output matrix size of 5080 × 63 × 128. At the end, a fully connected layer is obtained as;
F u l l y _ C o n n e c t e d q ( o + 1 ) = R e L U ( a x o a W a q o + α q o )
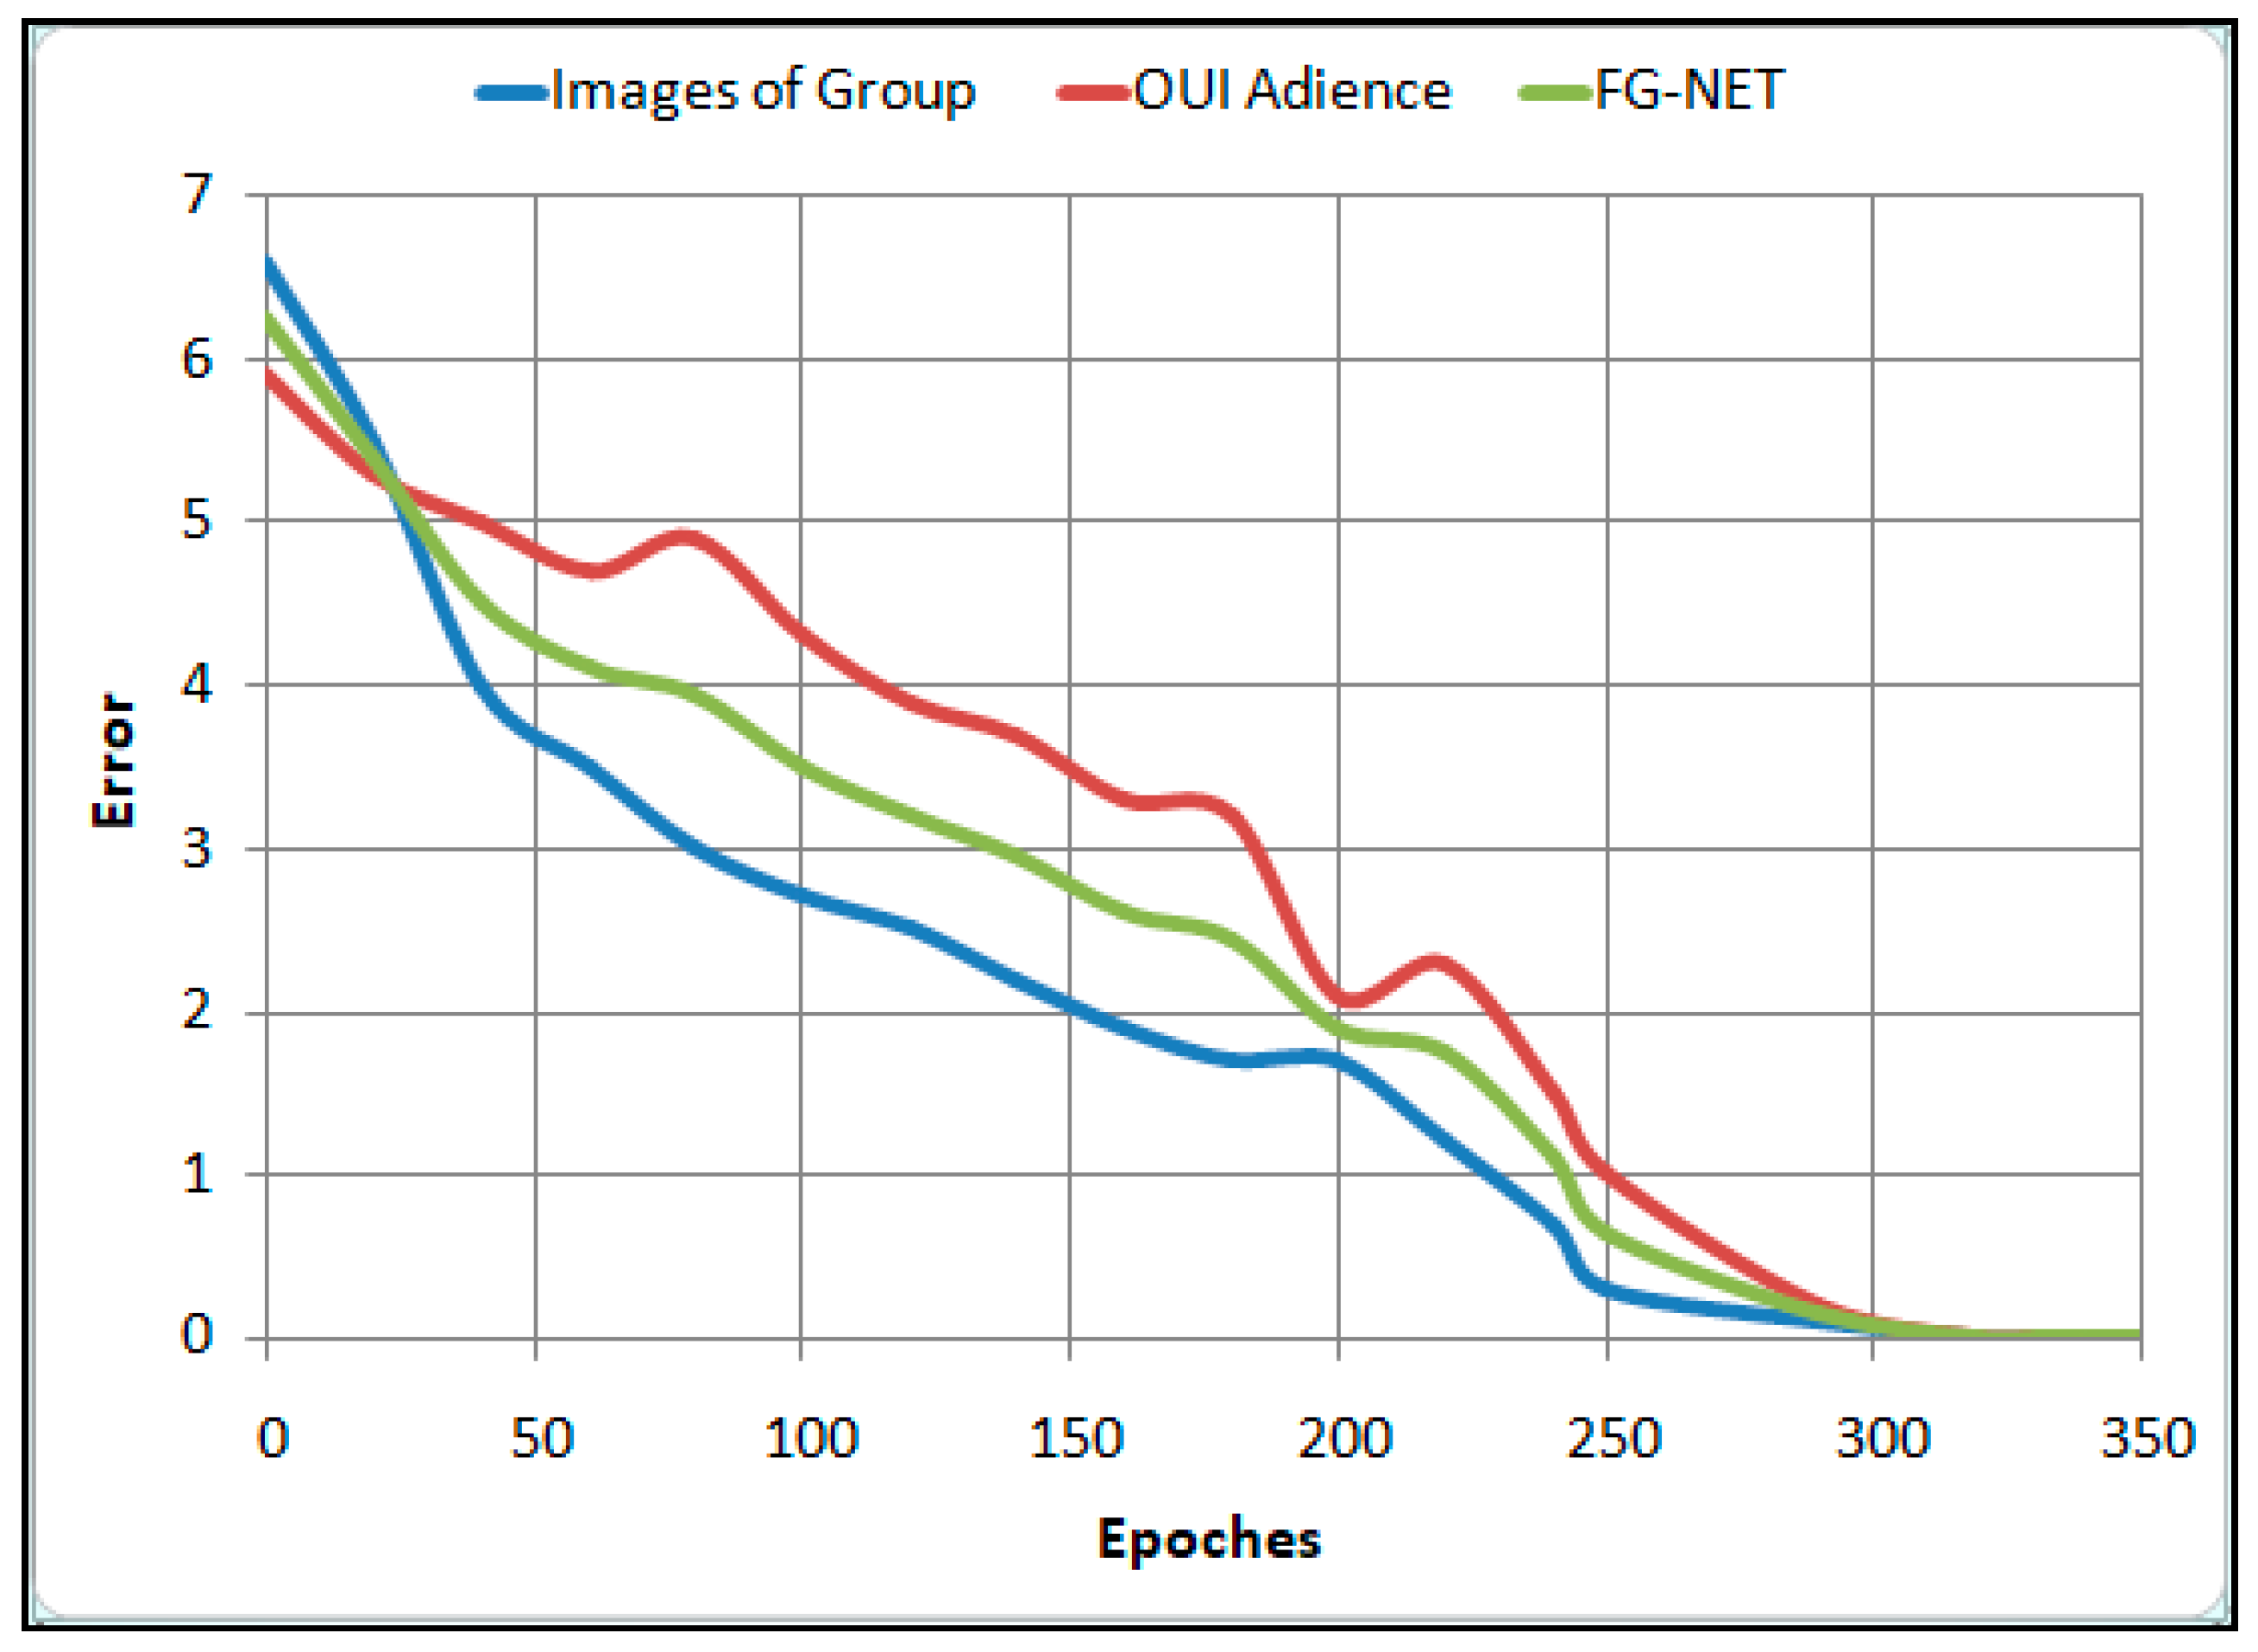
where W a q o w a q o is the matrix having weight values from the ath node of the oth layer to the qth node of the (o + 1)th layer. x o a denotes the content of the ath node at oth layer. Figure 13 shows the convergence plot of the CNN using 350 epochs over the age features of different age groups.

4. Experimental Results

This section is organized into five sub-sections. First, the details of the three benchmark datasets are described in detail. Second, age classification accuracy is discussed. Third, our proposed work is compared with other state-of-the-art deep learning techniques. Fourth, the error resilience of our proposed Active Shape Model is compared with other ASM models and, finally, classification accuracy rates with respective sets of features are described using the CNN classifier.

4.1. Datasets’ Descriptions

The Images of Groups dataset [55] is a multi-face dataset. It contains a total of 5080 images with 28,231 faces labeled with ages. This is the largest multi-face dataset. Each face in the dataset is labeled according to one of seven age groups: 0–2, 3–7, 8–12, 13–19, 20–36, 37–65 and 66+. Some images of this dataset are shown in Figure 14.
The second dataset used is the OUI Adience dataset [38] consisting of 26,580 images having 2284 cropped numbers of individuals. Each face is labeled according to one of eight age groups; 0–2, 4–6, 8–13, 15–20, 25–32, 38–43, 48–53, 60–. Figure 15 shows some of the examples of the OUI Adience dataset.
The third dataset is the FG-NET dataset consisting of 1002 images with ages from 1–69. The dataset is divided into four age groups, i.e., 0–13, 14–21, 22–39 and 40–69. Examples from the FG-NET dataset are shown in Figure 16.

4.2. Experiment I: Experimental Results Obtained Using the Proposed Model and the Other Three Competing Approaches over Benchmark Datasets

For age classification, we have used a Convolution Neural Network as an age classifier, and the proposed system is evaluated by the Leave One Person Out (LOPO) cross-validation technique. Our proposed model is evaluated using Leave One Person Out (LOPO) over three datasets, namely, The Images of Group, OUI Adience and FG-NET. By using LOPO, we repeatedly split the extracted features by randomly selecting one data feature for testing purposes while the other features are used for the training model. This procedure is repeated until all the features are divided into training and testing data. This model efficiently predicts the existing model and also the status of new individuals. Figure 17 presents the average accuracy of all three dataset on 105 folds.
Table 1 scores are calculated using Equations (19)–(21) of the proposed model and other competing approaches over The Images of Groups dataset with a mean accuracy of 91.58%.
Precision =   TruePositive ( TruePositive + FalsePositive )
Recall =   TruePositive ( TruePositive + FalseNegative )
F 1 =   2 × Precision × Recall Precision + Recall
After this, we applied the Convolution Neural Network and other competing approaches over the OUI Adience dataset and the FG-NET dataset to find the age classification results. Table 2 shows the results of age classification over the OUI Adience datasetwith a 92.62% mean accuracy rate and Table 3 shows the results overthe FG-NET datasetwith a mean accuracy of 94.59%.

4.3. Experiment II: Error Resilience between the Proposed Active Shape Model with Other Well-Known Face Masking Techniques

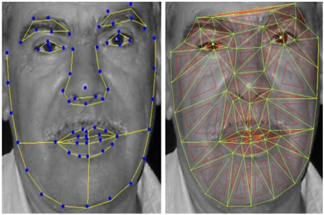
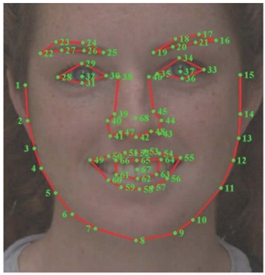
In this experiment, our proposed Active Shape Model (ASM) is compared with other Active Appearance Models (AAM) or Active Shape Models (ASM). These models are compared in Table 4 on the basis of landmark points, shape of the model and mean absolute error (MAE). The results show that our proposed Active Shape Model (ASM) provides lower MAE than other well-known models.

4.4. Experiment III: Comparison of Age Classification Performance Using CNN in Different Features Sets

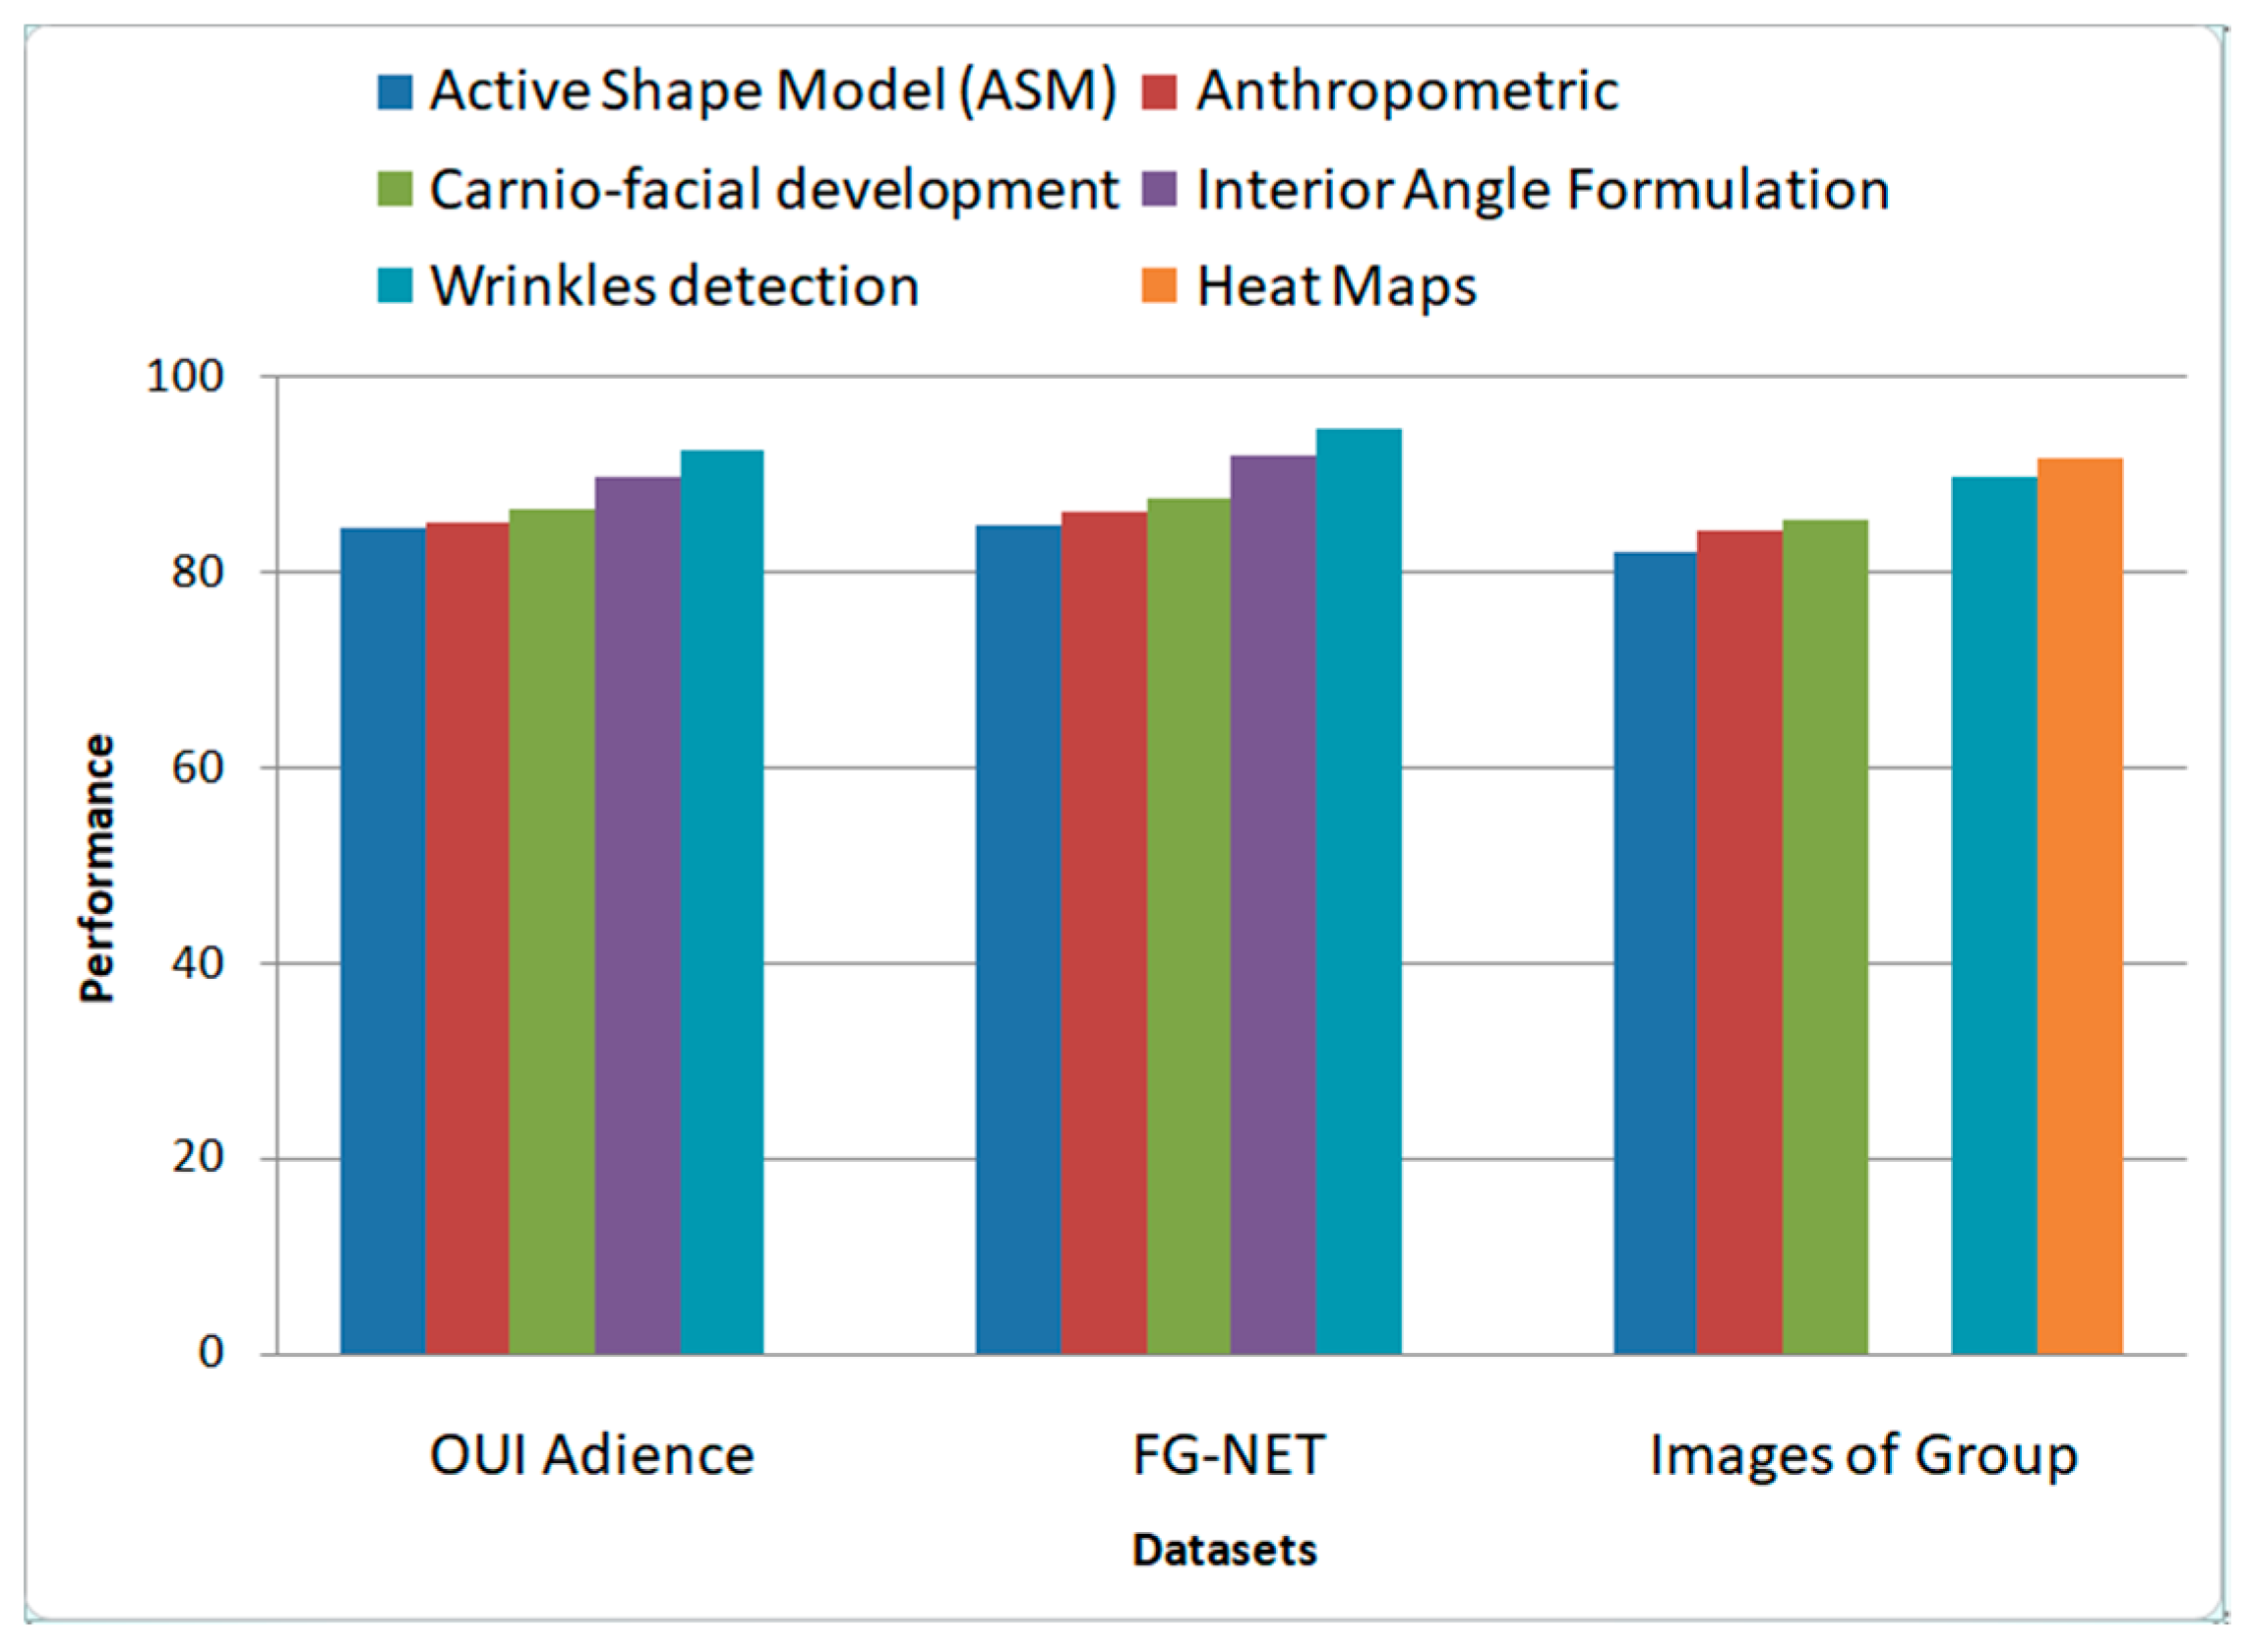
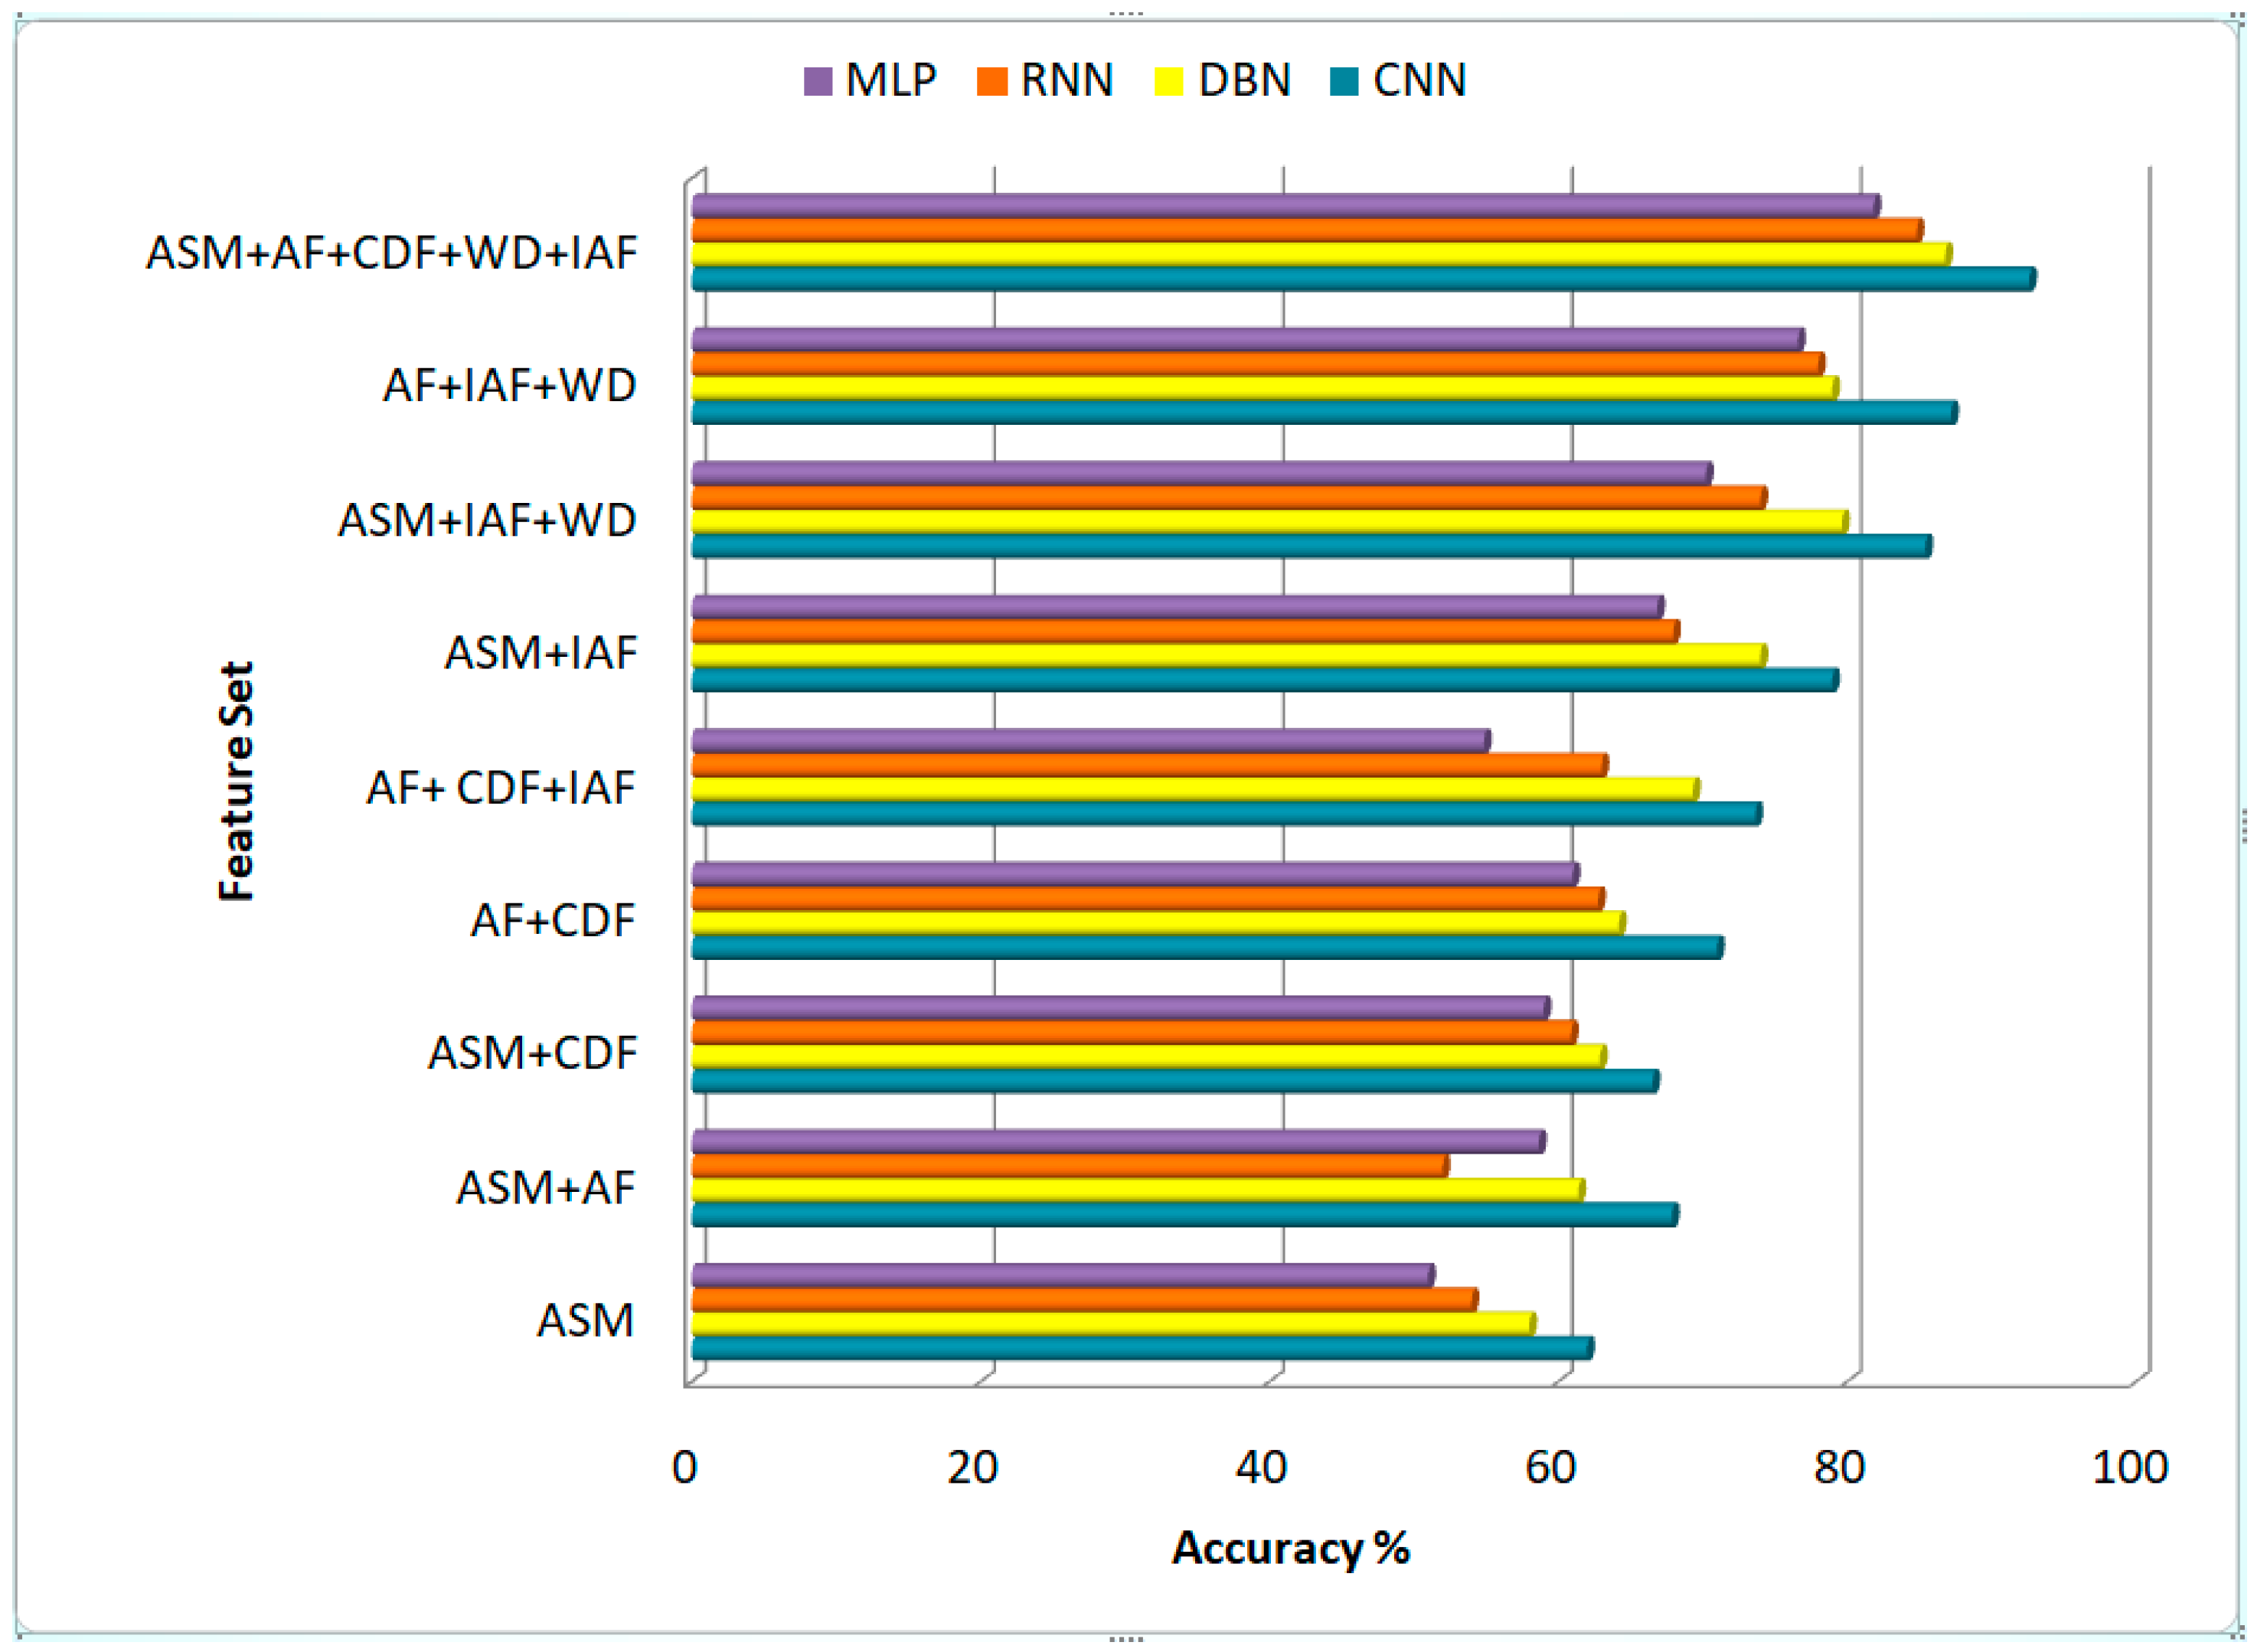
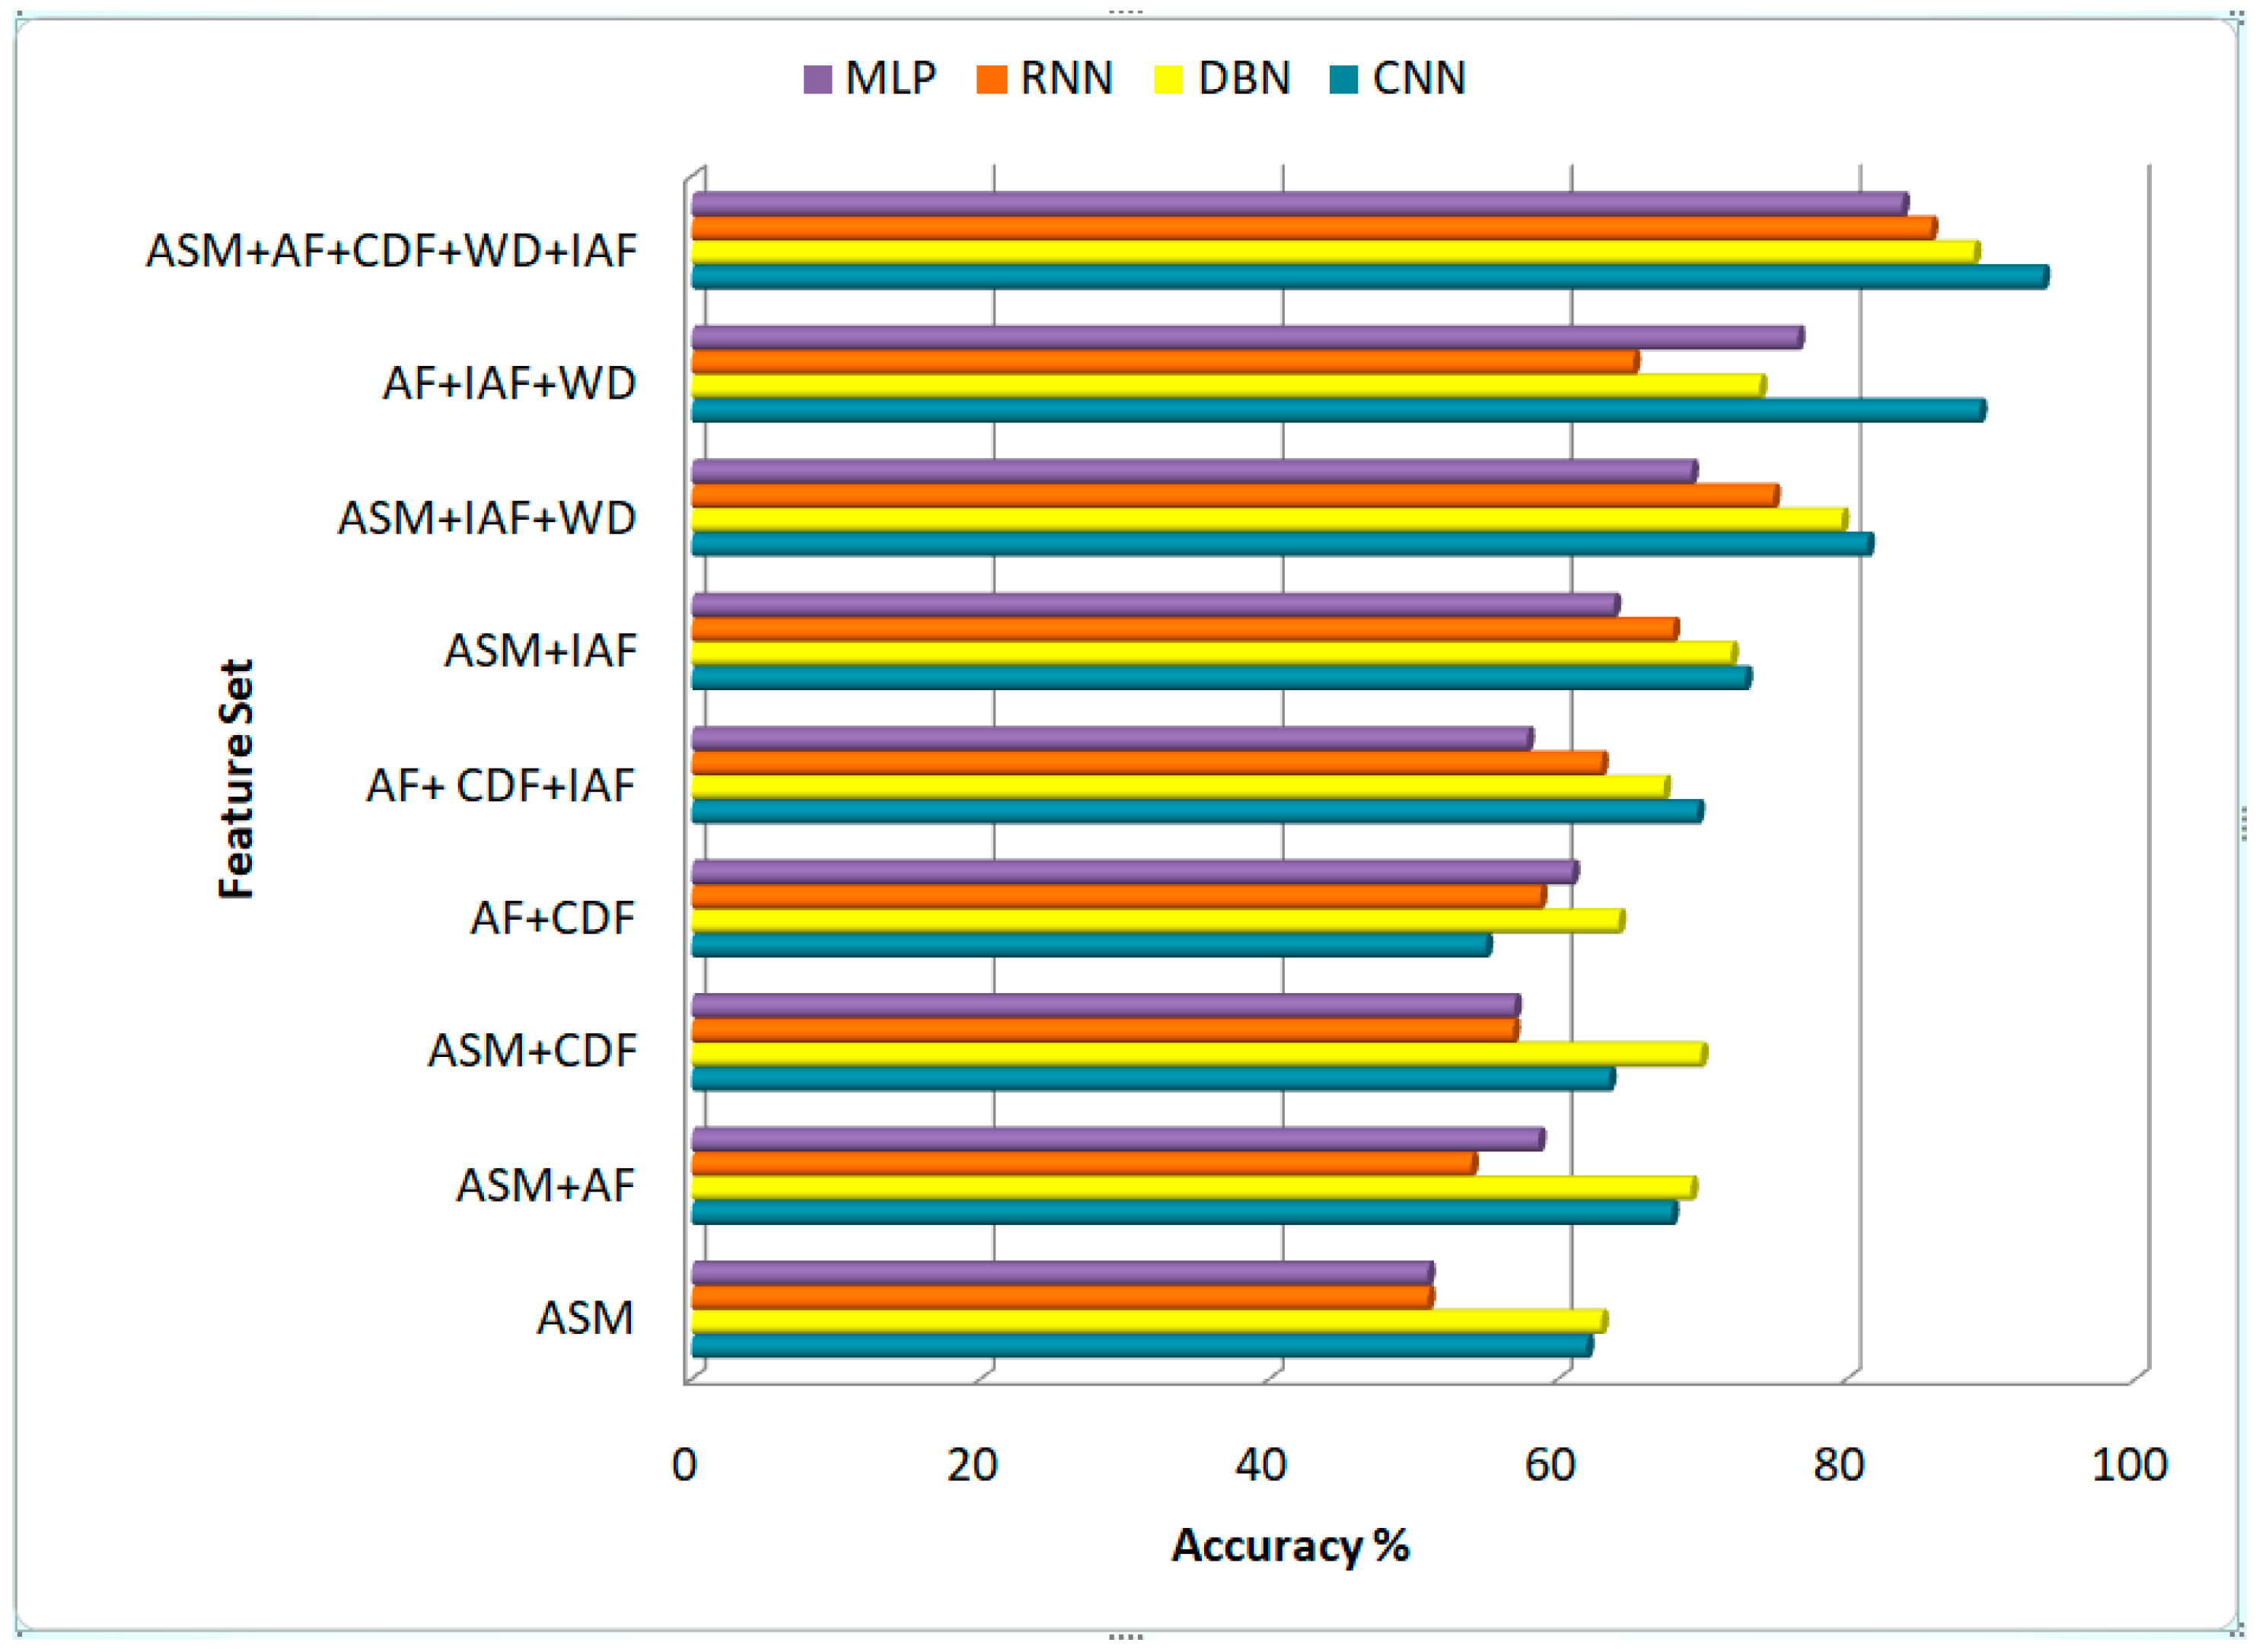
In experiment III, different sets of features are compared using the CNN classifier for age classification. Results show that combining ASM + anthropometric features (AF) + carnio-development features (CDF) + interior angles features (IAF) and wrinkles detection (WD) provides better accuracy than the other sets of features over the OUI Adience dataset and the FG-NET dataset. For the Images of Groups dataset, results have shown that combining ASM + anthropometric features (AF) + carnio-development features (CDF), wrinkles detection (WD) and heat maps (HM) provides better accuracy than the other sets of features. Figure 18, Figure 19 and Figure 20 show the results obtained for age classification using different sets of features over the OUI Adience dataset, the FG-NET dataset and The Images of Groups dataset, respectively.

5. Conclusions

In this research, we proposed a novel approach to determine and classify age from images of human faces. First, an image is pre-processed and faces are detected. After face detection, 35 landmark points are plotted on the face. With the help of these landmarks, an Active Shape Model (ASM) is mapped on the face. A six feature sets is used for further for feature extraction. These feature sets are: Active Shape Model (ASM), anthropometric model, carnio-facial development, interior angle formulation, wrinkles detection and heat maps. After the feature extraction step, these features are passed to a Sequential Forward Selection algorithm so that the most ideal set of features can be selected for better age classification. Finally, Convolution Neural Network (CNN) helps to classify the correct age of an individual. The system was evaluated over three benchmark datasets named The Images of Groups dataset which is a multi-face dataset, the OUI Adience dataset and the FG-NET dataset. The mean accuracies achieved on these datasets are 91.58%, 92.62% and 94.59%, respectively. In the future, we will evaluate these techniques to estimate age using RGB-D age datasets.

Author Contributions

Conceptualization, S.A.R.; methodology, S.A.R., M.G. and A.J.; software, S.A.R.; validation, M.G. and A.J.; formal analysis, K.K. and M.G.; resources, A.J. and K.K.; writing—review and editing, A.J. and K.K.; funding acquisition, A.J. and K.K. All authors have read and agreed to the published version of the manuscript.

Funding

This research was supported by the Basic Science Research Program through the National Research Foundation of Korea (NRF), funded by the Ministry of Education (No. 2018R1D1A1A02085645). This work was supported by the Korea Medical Device Development Fund grant funded by the Korea government (the Ministry of Science and ICT, the Ministry of Trade, Industry and Energy, the Ministry of Health & Welfare, the Ministry of Food and Drug Safety) (Project Number:202012D05-02).

Conflicts of Interest

The authors declare no conflict of interest.

References

  1. Park, U.; Tong, Y.; Jain, A.K. Age Invariant Face Recognition. Int. J. Trend Sci. Res. Dev. 2019, 3, 971–976. [Google Scholar]
  2. Albert, A.; Ricanek, K.; Patterson, E. A review of the literature on the aging adult skull and face: Implications for forensic science research and applications. Forensic Sci. Int. 2007, 172, 1–9. [Google Scholar] [CrossRef]
  3. Rhodes, M. Age estimation of faces: A review. Appl. Cogn. Psychol. 2009, 23, 1–12. [Google Scholar] [CrossRef]
  4. Ramanathan, N.; Chellappa, R.; Biswas, S. Computational methods for modeling facial aging: A survey. J. Vis. Lang. Comput. 2009, 20, 131–144. [Google Scholar] [CrossRef]
  5. Tahir, S.; Jalal, A.; Kim, K. Wearable Inertial Sensors for Daily Activity Analysis Based on Adam Optimization and the Maximum Entropy Markov Model. Entropy 2020, 22, 579. [Google Scholar] [CrossRef]
  6. Shokri, M.; Tavakoli, K. A Review on the Artificial Neural Network Approach to Analysis and Prediction of Seismic Damage in Infrastructure. Int. J. Hydromechatron. 2019, 2, 178–196. [Google Scholar] [CrossRef]
  7. Quaid, M.; Jalal, A. Wearable sensors based human behavioral pattern recognition using statistical features and reweighted genetic algorithm. Multimed. Tools Appl. 2019, 79, 6061–6083. [Google Scholar] [CrossRef]
  8. Jalal, A.; Quaid, M.; Tahir, S.; Kim, K. A Study of Accelerometer and Gyroscope Measurements in Physical Life-Log Activities Detection Systems. Sensors 2020, 20, 6670. [Google Scholar] [CrossRef]
  9. Jalal, A.; Kamal, S.; Kim, D. A Depth Video Sensor-Based Life-Logging Human Activity Recognition System for Elderly Care in Smart Indoor Environments. Sensors 2014, 14, 11735–11759. [Google Scholar] [CrossRef]
  10. Yun, F.; Guo, G.; Huang, T. Age Synthesis and Estimation via Faces: A Survey. IEEE Trans. Pattern Anal. Mach. Intell. 2010, 32, 1955–1976. [Google Scholar] [CrossRef]
  11. Tingting, Y.; Junqian, W.; Lintai, W.; Yong, X. Three-stage network for age estimation. CAAI Trans. Intell. Technol. 2019, 4, 122–126. [Google Scholar] [CrossRef]
  12. Choi, S.; Lee, Y.; Lee, S.; Park, K.; Kim, J. Age estimation using a hierarchical classifier based on global and local facial features. Pattern Recognit. 2011, 44, 1262–1281. [Google Scholar] [CrossRef]
  13. Txia, J.; Huang, C. Age Estimation Using AAM and Local Facial Features. In Proceedings of the 5th International Conference on Intelligent Information Hiding and Multimedia Signal Processing, Kyoyo, Japan, 12–14 September 2020; pp. 885–888. [Google Scholar]
  14. Choi, S.; Lee, Y.; Lee, S.; Park, K.; Kim, J. A Comparative Study of Local Feature Extraction for Age Estimation. In Proceedings of the 2010 11th International Conference on Control Automation Robotics & Vision, Singapore, 7–10 December 2010; pp. 1280–1284. [Google Scholar]
  15. Gunay, A.; Nabiyev, V. Automatic Age Classification with LBP. In Proceedings of the 2008 23rd International Symposium on Computer and Information Sciences, Istanbul, Turkey, 27–29 October 2008; pp. 1–4. [Google Scholar]
  16. Jalal, A.; Quaid, M.; Kim, K. A Wrist Worn Acceleration Based Human Motion Analysis and Classification for Ambient Smart Home System. J. Electr. Eng. Technol. 2019, 14, 1733–1739. [Google Scholar] [CrossRef]
  17. Nadeem, A.; Jalal, A.; Kim, K. Accurate Physical Activity Recognition using Multidimensional Features and Markov Model for Smart Health Fitness. Symmetry 2020, 12, 1766. [Google Scholar] [CrossRef]
  18. Jalal, A.; Sarif, N.; Kim, J.; Kim, T. Human Activity Recognition via Recognized Body Parts of Human Depth Silhouettes for Residents Monitoring Services at Smart Home. Indoor Built Environ. 2012, 22, 271–279. [Google Scholar] [CrossRef]
  19. Jalal, A.; Batool, M.; Kim, K. Sustainable Wearable System: Human Behavior Modeling for Life-Logging Activities Using K-Ary Tree Hashing Classifier. Sustainability 2020, 12, 10324. [Google Scholar] [CrossRef]
  20. Jalal, A.; Batool, M.; Kim, K. Stochastic Recognition of Physical Activity and Healthcare Using Tri-Axial Inertial Wearable Sensors. Appl. Sci. 2020, 10, 7122. [Google Scholar] [CrossRef]
  21. Angulu, R.; Tapamo, J.; Adewumi, A. Age estimation via face images: A survey. EURASIP J. Image Video Process. 2018, 2018, 42. [Google Scholar] [CrossRef]
  22. Taister, M.; Holliday, S.; Borrman, H. Comments on Facial Aging in Law Enforcement Investigation. Forensic Sci. Commun. 2000, 2, 1463–1469. [Google Scholar]
  23. Fuller, H. Multiple factors influencing successful aging. Innov. Aging 2019, 3, S618. [Google Scholar] [CrossRef]
  24. Gunn, D.; Rexbye, H.; Griffiths, C.; Murray, P.; Fereday, A.; Catt, S.; Tomlin, C.; Strongitharm, B.; Perrett, D.; Catt, M.; et al. Why Some Women Look Young for Their Age. PLoS ONE 2009, 4, e8021. [Google Scholar] [CrossRef] [PubMed] [Green Version]
  25. Tin, K.; Htake, D. Gender and Age Estimation Based on Facial Images. Acta Tech. Napoc. 2011, 52, 37–40. [Google Scholar]
  26. Reade, S.; Veriri, S. Hybrid Age Estimation Using Facial Images. In International Conference Image Analysis and Recognition. ICIAR 2015, ICIAR 2015: Image Analysis and Recognition; Lecture Notes in Computer Science, 9164; Springer: Cham, Switzerland, 2015; pp. 239–246. [Google Scholar]
  27. Tin, H. Subjective Age Prediction of Face Images Using PCA. Int. J. Inf. Electron. Eng. 2012, 2, 296–299. [Google Scholar] [CrossRef]
  28. Dib, M.; Saban, M. Human Age Estimation Using Enhanced Bio-Inspired Features (EBIF). In Proceedings of the 2010 IEEE International Conference on Image Processing, Hong Kong, China, 26–29 September 2010; pp. 1589–1592. [Google Scholar]
  29. Zhang, K.; Gao, C.; Guo, L.; Sun, M.; Yuan, X.; Han, T.; Zhzo, Z.; Li, B. Age Group and Gender Estimation in the Wild With Deep RoR Architecture. IEEE Access 2017, 5, 22492–22503. [Google Scholar] [CrossRef]
  30. Bekhouche, S.; Ouafi, A.; Benlamoudi, A.; Ahmed, A.T. Automatic Age Estimation and Gender Classification in the Wild. In Proceedings of the International Conference on Automatic Control, Telecommunications and Signals (ICATS15), Annaba, Algeria, 16–18 November 2015. [Google Scholar]
  31. Levi, G.; Hassncer, T. Age and Gender Classification Using Convolutional Neural Networks. In Proceedings of the IEEE Conference on Computer Vision and Pattern Recognition Workshops (CVPRW), Boston, MA, USA, 7–12 June 2015; pp. 34–42. [Google Scholar]
  32. Horng, W.; Lee, C.; Chen, C. Classification of Age Groups Based on Facial Features. Tamkang J. Sci. Eng. 2001, 4, 183–191. [Google Scholar]
  33. Fu, Y.; Xu, Y.; Huang, T. Estimating Human Age by Manifold Analysis of Face Pictures and Regression on Aging Features. In Proceedings of the International Conference on Multimedia and Expo, Beijing, China, 2–5 July 2007; pp. 1383–1386. [Google Scholar]
  34. Huerta, I.; Fernandez, C.; Segura, C.; Hernando, J.; Prati, A. A deep analysis on age estimation. Pattern Recognit. Lett. 2015, 68, 239–249. [Google Scholar] [CrossRef] [Green Version]
  35. Yılmaz, A.G.; Nabiyev, V. Age Estimation Based on AAM and 2D-DCT Features of Facial Images. Int. J. Adv. Comput. Sci. Appl. 2015, 6, 113–119. [Google Scholar]
  36. Eidinger, E.; Enbar, R.; Hassner, T. Age and Gender Estimation of Unfiltered Faces. IEEE Trans. Inf. Forensics Secur. 2014, 9, 2170–2179. [Google Scholar] [CrossRef]
  37. Shan, C. Learning Local Features for Age Estimation on Real-Life Faces. In Proceedings of the 1st ACM International Workshop on Multimodal Pervasive Video Analysis, Firenze, Italy, 25–29 October 2010; pp. 23–28. [Google Scholar]
  38. Rizwan, S.; Jalal, A.; Kim, K. An Accurate Facial Expression Detector using Multi-Landmarks Selection and Local Transform Features. In Proceedings of the 2020 3rd International Conference on Advancements in Computational Sciences (ICACS), Lahore, Pakistan, 17–19 February 2020; pp. 1–6. [Google Scholar]
  39. Jalal, A.; Khalid, N.; Kim, K. Automatic Recognition of Human Interaction via Hybrid Descriptors and Maximum Entropy Markov Model Using Depth Sensors. Entropy 2020, 22, 817. [Google Scholar] [CrossRef]
  40. Jalal, A.; Kim, Y.; Kim, D. Ridge Body Parts Features for Human Pose Estimation and Recognition from RGB-D Video Data. In Proceedings of the Fifth International Conference on Computing, Communications and Networking Technologies (ICCCNT), Hefei, China, 11–13 July 2014; pp. 1–6. [Google Scholar]
  41. Mahmood, M.; Jalal, A.; Kim, K. WHITE STAG model: Wise human interaction tracking and estimation (WHITE) using spatio-temporal and angular-geometric (STAG) descriptors. Multimed. Tools Appl. 2019, 79, 6919–6950. [Google Scholar] [CrossRef]
  42. Jalal, A.; Uddin, M.; Kim, T. Depth video-based human activity recognition system using translation and scaling invariant features for life logging at smart home. IEEE Trans. Consum. Electron. 2012, 58, 863–871. [Google Scholar] [CrossRef]
  43. Ahmed, M.; Viriri, S. Age Estimation Using Facial Images: A Survey of the State-of-the-Art. In Proceedings of the Sudan Conference on Computer Science and Information Technology (SCCSIT), Elnihood, Sudan, 17–19 November 2017; pp. 1–8. [Google Scholar]
  44. Lee, W.; Lee, B.; Yang, X.; Jung, H.; Bok, I.; Kim, C.; Kwon, O.; You, H. A 3D anthropometric sizing analysis system based on North American CAESAR 3D scan data for design of head wearable products. Comput. Ind. Eng. 2018, 117, 121–130. [Google Scholar] [CrossRef]
  45. Ballin, A.; Carvalho, B.; Dolci, J.; Becker, R.; Berger, C.; Mocellin, M. Anthropometric study of the caucasian nose in the city of Curitiba: Relevance of population evaluation. Braz. J. Otorhinolaryngol. 2018, 84, 486–493. [Google Scholar] [CrossRef] [PubMed]
  46. Osterland, S.; Weber, J. Analytical analysis of single-stage pressure relief valves. Int. J. Hydromechatron. 2019, 2, 32–53. [Google Scholar] [CrossRef]
  47. Susan, S.; Agrawal, P.; Mittal, M.; Bansal, S. New shape descriptor in the context of edge continuity. CAAI Trans. Intell. Technol. 2019, 4, 101–109. [Google Scholar] [CrossRef]
  48. Jana, R.; Basu, A. Automatic Age Estimation from Face Image. In Proceedings of the 2017 International Conference on Innovative Mechanisms for Industry Applications (ICIMIA), Bangalore, India, 21–23 February 2017; pp. 87–90. [Google Scholar]
  49. Bouchrika, I.; Harrati, N.; Ladjailia, A.; Khedairia, S. Age Estimation from Facial Images Based on Hierarchical Feature Selection. In Proceedings of the 16th International Conference on Sciences and Techniques of Automatic Control and Computer Engineering (STA), Monastir, Tunisia, 21–23 December 2015; pp. 393–397. [Google Scholar]
  50. Ahmed, A.; Jalal, A.; Kim, K. A Novel Statistical Method for Scene Classification Based on Multi-Object Categorization and Logistic Regression. Sensors 2020, 20, 3871. [Google Scholar] [CrossRef] [PubMed]
  51. Ahmed, A.; Jalal, A.; Kim, K. Region and Decision Tree-Based Segmentations for Multi-Objects Detection and Classification in Outdoor Scenes. In Proceedings of the 2019 International Conference on Frontiers of Information Technology (FIT), Islamabad, Pakistan, 16–18 December 2019; pp. 209–295. [Google Scholar]
  52. Jalal, A.; Akhtar, I.; Kim, K. Human Posture Estimation and Sustainable Events Classification via Pseudo-2D Stick Model and K-ary Tree Hashing. Sustainability 2020, 12, 9814. [Google Scholar] [CrossRef]
  53. Uddin, M.; Khaksar, W.; Torresen, J. Facial Expression Recognition Using Salient Features and Convolutional Neural Network. IEEE Access 2017, 5, 26146–26161. [Google Scholar] [CrossRef]
  54. Zhu, C.; Miao, D. Influence of kernel clustering on an RBFN. CAAI Trans. Intell. Technol. 2019, 4, 255–260. [Google Scholar] [CrossRef]
  55. Gallagher, A.; Chen, T. Understanding Images of Groups of People. In Proceedings of the 2009 IEEE Conference on Computer Vision and Pattern Recognition, Miami, FL, USA, 22–24 June 2009; pp. 256–263. [Google Scholar]
  56. Pontes, J.; Britto, A.; Fookes, C.; Koerich, A. A flexible hierarchical approach for facial age estimation based on multiple features. Pattern Recognit. 2016, 54, 34–51. [Google Scholar] [CrossRef]
  57. Luu, K.; Seshadri, K.; Savvides, M.; Bui, T.; Suen, C. Contourlet Appearance Model for Facial Age Estimation. In Proceedings of the 2011 International Joint Conference on Biometrics (IJCB), Washington, DC, USA, 11–13 October 2011; pp. 1–8. [Google Scholar]
  58. Luu, K.; Ricanek, K.; Bui, T.; Suen, C. Age Estimation Using Active Appearance Models and Support Vector Machine Regression. In Proceedings of the 2009 IEEE 3rd International Conference on Biometrics: Theory, Applications, and Systems, Washington, DC, USA, 28–30 September 2009; pp. 1–5. [Google Scholar]
Figure 1. The proposed model of our human age classification system.
Electronics 10 00465 g001
Figure 2. The results of face detection and landmark localization on (a) the FG-NETdataset, (b) the OUIAdience dataset and (c) The Images of Groups dataset.
Electronics 10 00465 g002
Figure 3. Landmark localization points ranging from 1 to 35.
Electronics 10 00465 g003
Figure 4. (a) Active Shape Model on FG-NET dataset; (b) the perpendicular bisection rule on a triangle used on facial features.
Electronics 10 00465 g004
Figure 5. The anatomical names of facial landmarks and facial dimensions.
Electronics 10 00465 g005
Figure 6. Angle of inclination formed between the points of different features.
Electronics 10 00465 g006
Figure 7. (a) Carnio-facial developments across agesw.r.t difference of cardioidal strain ‘k’. (b) cardioidal strain w.r.t radius of the circle.
Electronics 10 00465 g007
Figure 8. Different measurements of interior angles on (a) 2 years old child and (b) 50 years old adult over OUI Adience dataset.
Electronics 10 00465 g008
Figure 9. Wrinkle formation on face images on The Images of Groups dataset.
Electronics 10 00465 g009
Figure 10. Example results of some heat map features over the OUI Adiencedataset.
Electronics 10 00465 g010
Figure 11. Number of ideal features selected using Sequential Forward Selection (SFS) algorithm over the OUI Adience dataset and FG-NET dataset.
Electronics 10 00465 g011
Figure 12. The structure of a 1-D Convolution Neural Network (CNN) for human age classification using the images of thedataset.
Electronics 10 00465 g012
Figure 13. The convergence plot of CNN using 350 epochs over the age features of different age groups.
Electronics 10 00465 g013
Figure 14. Some examples of the Images of Groups dataset.
Electronics 10 00465 g014
Figure 15. Some examples of theOUI Adience dataset.
Electronics 10 00465 g015
Figure 16. Some examples of theFG-NET dataset.
Electronics 10 00465 g016
Figure 17. Results of 105-fold cross validation over three datasets.
Electronics 10 00465 g017
Figure 18. Comparison of the different features sets for age classification over the OUI Adience dataset.
Electronics 10 00465 g018
Figure 19. Comparison of the different features sets for age classification over FG-NET dataset.
Electronics 10 00465 g019
Figure 20. Comparisonof the different features sets for age classification over the Images of Groups dataset.
Electronics 10 00465 g020
Table 1. Result comparison of precision, recall and F1 measure over The Images of Groups dataset.
Age ClassesCNNDBNRNNMLP
The Images of Groups Dataset
AgePrecisionRecallF1
Measure
PrecisionRecallF1
Measure
PrecisionRecallF1
Measure
PrecisionRecallF1
Measure
0–20.930.940.930.890.810.840.780.780.780.890.800.84
3–70.940.920.930.7500.7500.7500.700.700.700.750.760.75
8–120.940.960.950.790.700.740.650.770.700.690.750.72
13–190.910.910.90.900.880.900.800.610.690.900.810.85
20–260.910.900.910.760.760.760.500.750.600.760.760.76
37–650.940.870.900.670.820.740.530.720.540.570.620.59
66+0.890.970.930.800.800.800.750.690.710.800.800.80
Table 2. Result comparison of precision, recall and F1 measure over theOUI Adience dataset.
Age ClassesCNNDBNsRNNsMLPs
OUI Adience Dataset
AgePrecisionRecallF1
Measure
PrecisionRecallF1
Measure
PrecisionRecallF1
Measure
PrecisionRecallF1
Measure
0–20.950.960.950.880.880.880.680.580.630.720.720.72
4–60.930.930.930.750.750.750.700.700.700.670.820.74
8–130.920.930.920.790.790.790.720.770.740.690.750.72
15–200.920.940.930.900.880.900.800.610.690.790.700.74
25–320.950.950.950.720.720.720.600.670.600.900.880.90
38–430.940.890.910.670.820.740.530.720.540.760.760.76
48–530.920.880.900.850.850.850.750.690.710.780.780.78
60–0.91.00.970.780.740.760.690.900.810.880.680.58
Table 3. Result comparison of precision, recall and F1 measure over the FG-NET dataset.
Age ClassesCNNDBNsRNNsMLPs
OUI Adience Dataset
AgePrecisionRecallF1
Measure
PrecisionRecallF1
Measure
PrecisionRecallF1
Measure
PrecisionRecallF1
Measure
0–130.590.960.730.890.810.840.780.780.780.670.820.74
14–210.960.580.730.670.820.740.700.700.700.690.750.72
22–390.960.960.960.850.850.850.750.750.750.690.750.72
40–690.960.980.970.900.880.900.790.790.790.900.810.85
Table 4. Error resilience between the proposed Active Shape Model and other face masking techniques.
S,NoWell Known ASMTotal Landmark PointsShape of the ModelMean Absolute Error (MAE)
1JK.Pontes [56]68 points Electronics 10 00465 i00110.95
2K.Luu [57]68 points Electronics 10 00465 i0026.77
3K.Luu [58]68 points Electronics 10 00465 i0034.37
4Proposed35 points Electronics 10 00465 i0043.98
Publisher’s Note: MDPI stays neutral with regard to jurisdictional claims in published maps and institutional affiliations.