Article

Understanding the Thermal Time Constants of GaN HEMTs through Model Order Reduction Technique

by
Anass Jakani
1,
Raphael Sommet
1,*,
Frédérique Simbélie
2 and
Jean-Christophe Nallatamby
1
1
XLIM Laboratory, CNRS, UMR 7252, University of Limoges, 19100 Brive, France
2
AMCAD Engineering Bâtiment Galiléo, 20 rue d’Atlantis, 87068 Limoges, France
*
Author to whom correspondence should be addressed.
Electronics 2021, 10(24), 3138; https://doi.org/10.3390/electronics10243138
Submission received: 8 November 2021 / Revised: 7 December 2021 / Accepted: 13 December 2021 / Published: 16 December 2021
(This article belongs to the Section Microelectronics)

Abstract

:
This paper described a comparison between a numerical Finite Element Analysis (FEA) and an analytical approach in order to extract the thermal time constants and the thermal resistances of simple but realistic structures. Understanding the complex contribution of multidimensional thermal spreading, the effect of multiple layers, and the correlation with the heat source length is mandatory due to the severe mismatch of thermal expansion in different epitaxial layers and high operating temperatures. This is especially true on GaN HEMT (High Electron Mobility Transistor) with the continuous decrease of the gate length and the increase of the power density. Moreover, in this paper, we extracted the time constants with a Model Order Reduction (MOR) technique based on the Ritz vector approach with inputs coming from the FE matrices. It was found that the time constants obtained by an analytical solution and a model order extraction from FEA were exactly the same. This result validated the idea that our MOR technique provides the real time constants and resistances for our device structures and in this case unified the analytical world with the numerical one.

1. Introduction

In recent years, the gallium nitride (GaN) technology has gained increasing interest in high-frequency power amplifier and high-voltage power conversion applications [1]. The high-power density present in GaN HEMTs technology leads to a high temperature in the transistor channel. This self-heating phenomenon degrades the performance and the reliability of the device. Knowing the channel temperature under operating conditions, the location of the hotspot and transient temperature response have become mandatory in the RF electronic industry.
Thermal issues of GaN HEMTs have been studied from various aspects. A large number of analytical models for thermal resistance have been developed. However, they are in many cases restricted to simple geometries, uniform boundary conditions, and linear thermal conductivity. Albers [2] and Yovanovich [3] used Fourier series-based formulation to calculate the surface temperature solution for a 3D rectangular structure with an arbitrary number of layers. Geer et al. [4] developed a semi-analytical approach that considers general boundary and interface conditions as well as internal heat sources. Masana solved the surface temperature for a 2D structure [5], and in [6], Darwish proposed a closed-form analytical model based on a prolate spheroidal and ellipsoid coordinate system to determine the thermal resistance of multi-finger AlGaN-GaN devices. These models have focused on the issue of steady-state temperature and thermal resistance; however, few works have been published on the understanding of the thermal time constants. Bagnall [7,8] solved the heat equation for a single layer with the heat flux evenly distributed at the top and a constant temperature at the bottom. He also provided an analytical formula for thermal time constants. In all these approaches, the Fourier’s Law is only considered. It is known that the Fourier’s approach may be limited for nanoscale devices [9,10], but our focus of approach was to address and improve thermal models for electronics industry beyond a simple RC cell for real devices.
In this paper, a comparison between the thermal time constants and thermal resistances obtained both using the analytical model [7] and numerical model (ANSYS software) coupled with MOR [11] was carried out. This work can be considered as an extended study of [7]. However, in our article, the time constants were extracted through model order reduction from a numerical Partial Differential Equation. The excellent part is that this model order reduction technique was based on a numerical approach, thereby yielding the real physical time constants. The way of extracting the thermal time constants was found to be quite different in [7], because the authors used a fitting procedure associating with a modeling equation and a minimization of an error function.
The motive of this work was essentially to prove that the real physical time constants can be determined by using our MOR technique.
The flow presented in Figure 1 represents the process used to obtain the paired values ( Ri ,   τ i ) .
Part 2 presents the process of extracting the thermal time constants as well as the thermal resistance with our MOR technique.
In part 3, a one-dimensional analysis was performed for single-layer and two-layer structures. A comparison between the analytical approach and the numerical one is detailed.
In part 4, we consider a two-dimensional approach that takes into account the length of the heat source.
In part 5, some simulation results are compared with the experimental data in order to validate the approach proposed in this article.

2. Extraction of Real Thermal Time Constants with Ritz Model Order Reduction Technique

Nonlinear Model order Reduction is a very complex task. The assumption for the following development was that thermal properties are constant, either isotropic or orthotropic, but not temperature dependent. In that case, the formulation of the Finite Element problem is linear.

Finite Element Linear Formulation of the Heat Equation

The thermal model was obtained from the Finite Element formulation of the classical heat equation based on the Fourier phenomenological approach. The assumptions were adiabatic conditions on lateral directions, uniform heat flux on the surface that represents the gate of the device, and a fixed baseplate temperature. The linear finite element expression of Laplace’s heat equation led to the semi-discrete heat Equation:
M . T ˙ + K T = F
where K the conductivity matrix and M the specific heat matrix are (n-by-n) symmetric and positive-definite matrices, T is (n-by-1) temperature vector at the mesh nodes, and F is the (n-by-1) load vector that accounts for both power generation and Dirichlet boundary conditions.
n is the total number of mesh nodes.
In our approach, ANSYS simulation software was solely used to extract the conductivity matrix K, the specific heat matrix M, and the load vector F using the excellent tricks proposed in [12]. Then, a reduced thermal equivalent model (τi; Ri) was obtained using the MOR method based on the Ritz vector approach detailed in [11,13].
The idea here was not to discuss the various MOR techniques that can be found in the literature, but to present our approach. The MOR has been extensively studied in the past years; however, to the best of our knowledge, this is the first time that it has been used to demonstrate the extraction of thermal time constants with MOR, which provides the real thermal time constants obtained by the analytical solution of the heat equation.
The main advantages of the Ritz vector method are that important response modes are not neglected and the accuracy with fewer vectors is improved compared with the use of eigenvectors. Moreover, using this method, the steady state temperature is always exacted. Indeed, the first Ritz vector is obtained by solving the steady state KT = F. The other vectors originate from orthogonal projections. When the time is infinite, their contribution decreases and tends to zero. With a pure eigenvalue decomposition, there are several major issues:
The number n of numerical equations is very large (few 100,000), so it is very difficult to compute all the eigenvalues and the eigenvectors;
The second difficulty involves selecting the main eigenvalues;
The steady state is not reached if all the eigenvalues are not considered.
The procedure for generating orthogonal Ritz vectors leads to an m-by-n projection matrix as shown in [11], where m is the number of time constants retained for the final solution. m depends on the precision proposed for the reduced model (see, for example the influence of m in results presented Figure 5). In the generation of the transformation matrix Φm= (φ1… φm) of the m Ritz vectors, the relationships are verified:
T = Φ m p  
Φ m T M Φ m = I d
where T is the vector of the original temperatures (n) and p the vector of temperatures in the « reduced » system (m << n). During the projection stage, Φ m matrix is M normalized.
From this transformation, the heat Equation can be written in terms of reduced coordinates
p ˙ + K * p = Φ m T F  
with K* a (m-by-m) matrix
K * = Φ m T K Φ m
The next stage consists in diagonalizing this system to decouple the equations:
t ˙ + m t = ψ T Φ m T F  
t is the (m-by-1) temperature variable in the eigenspace. m is the (m-by-m) eigenvalues matrix. ψ is the transformation matrix composed of the m eigenvectors.
The solution in the initial basis can be easily computed by:
T = Φ m ψ t  
Thus:
T = Φ m ψ [ 1 j ω + λ 1 0 0 1 j ω + λ m ] ψ T Φ m T F  
The selection of the output node for Tmax for example is very easy because one only needs to select a specific coordinate in T.

3. One Dimensional (1-D) Analysis

3.1. 1-D, Single-Layer Simulation

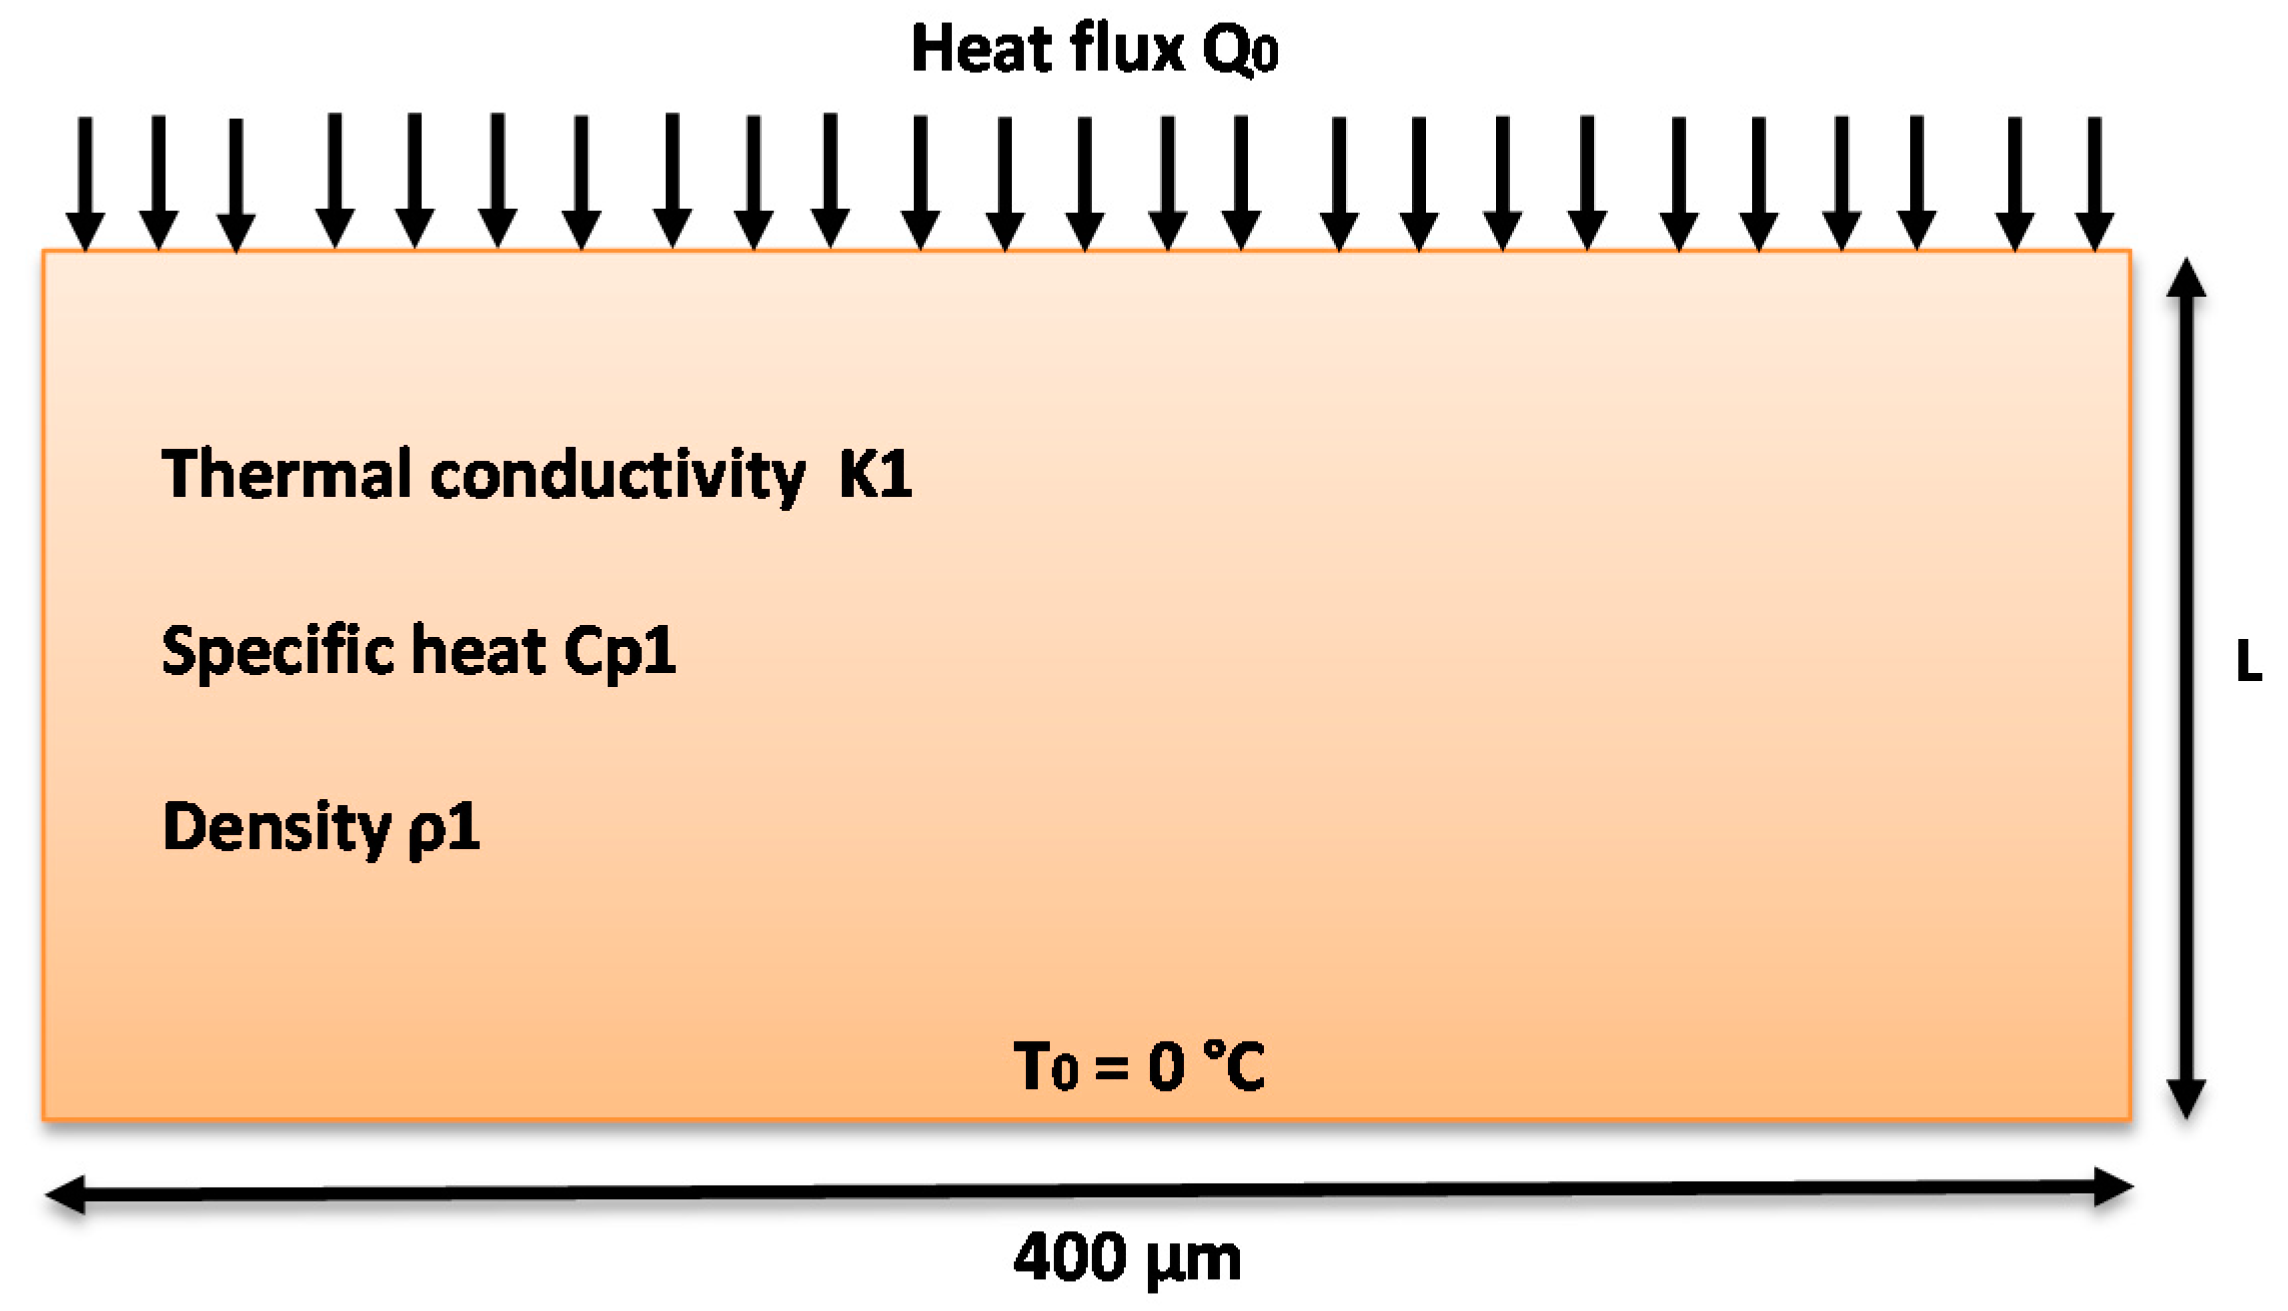
Figure 2 shows the 1-D Silicon Carbide structure implemented in ANSYS software. An evenly distributed heat flux Q0 = 1 W/m was used on the top of the structure and a constant temperature T0 = 0 °C was applied to the bottom of the layer.
Where ρ is the density, Cp is the specific heat, K is the thermal conductivity, and L is the thickness of the structure. The values are reported in Table 1.
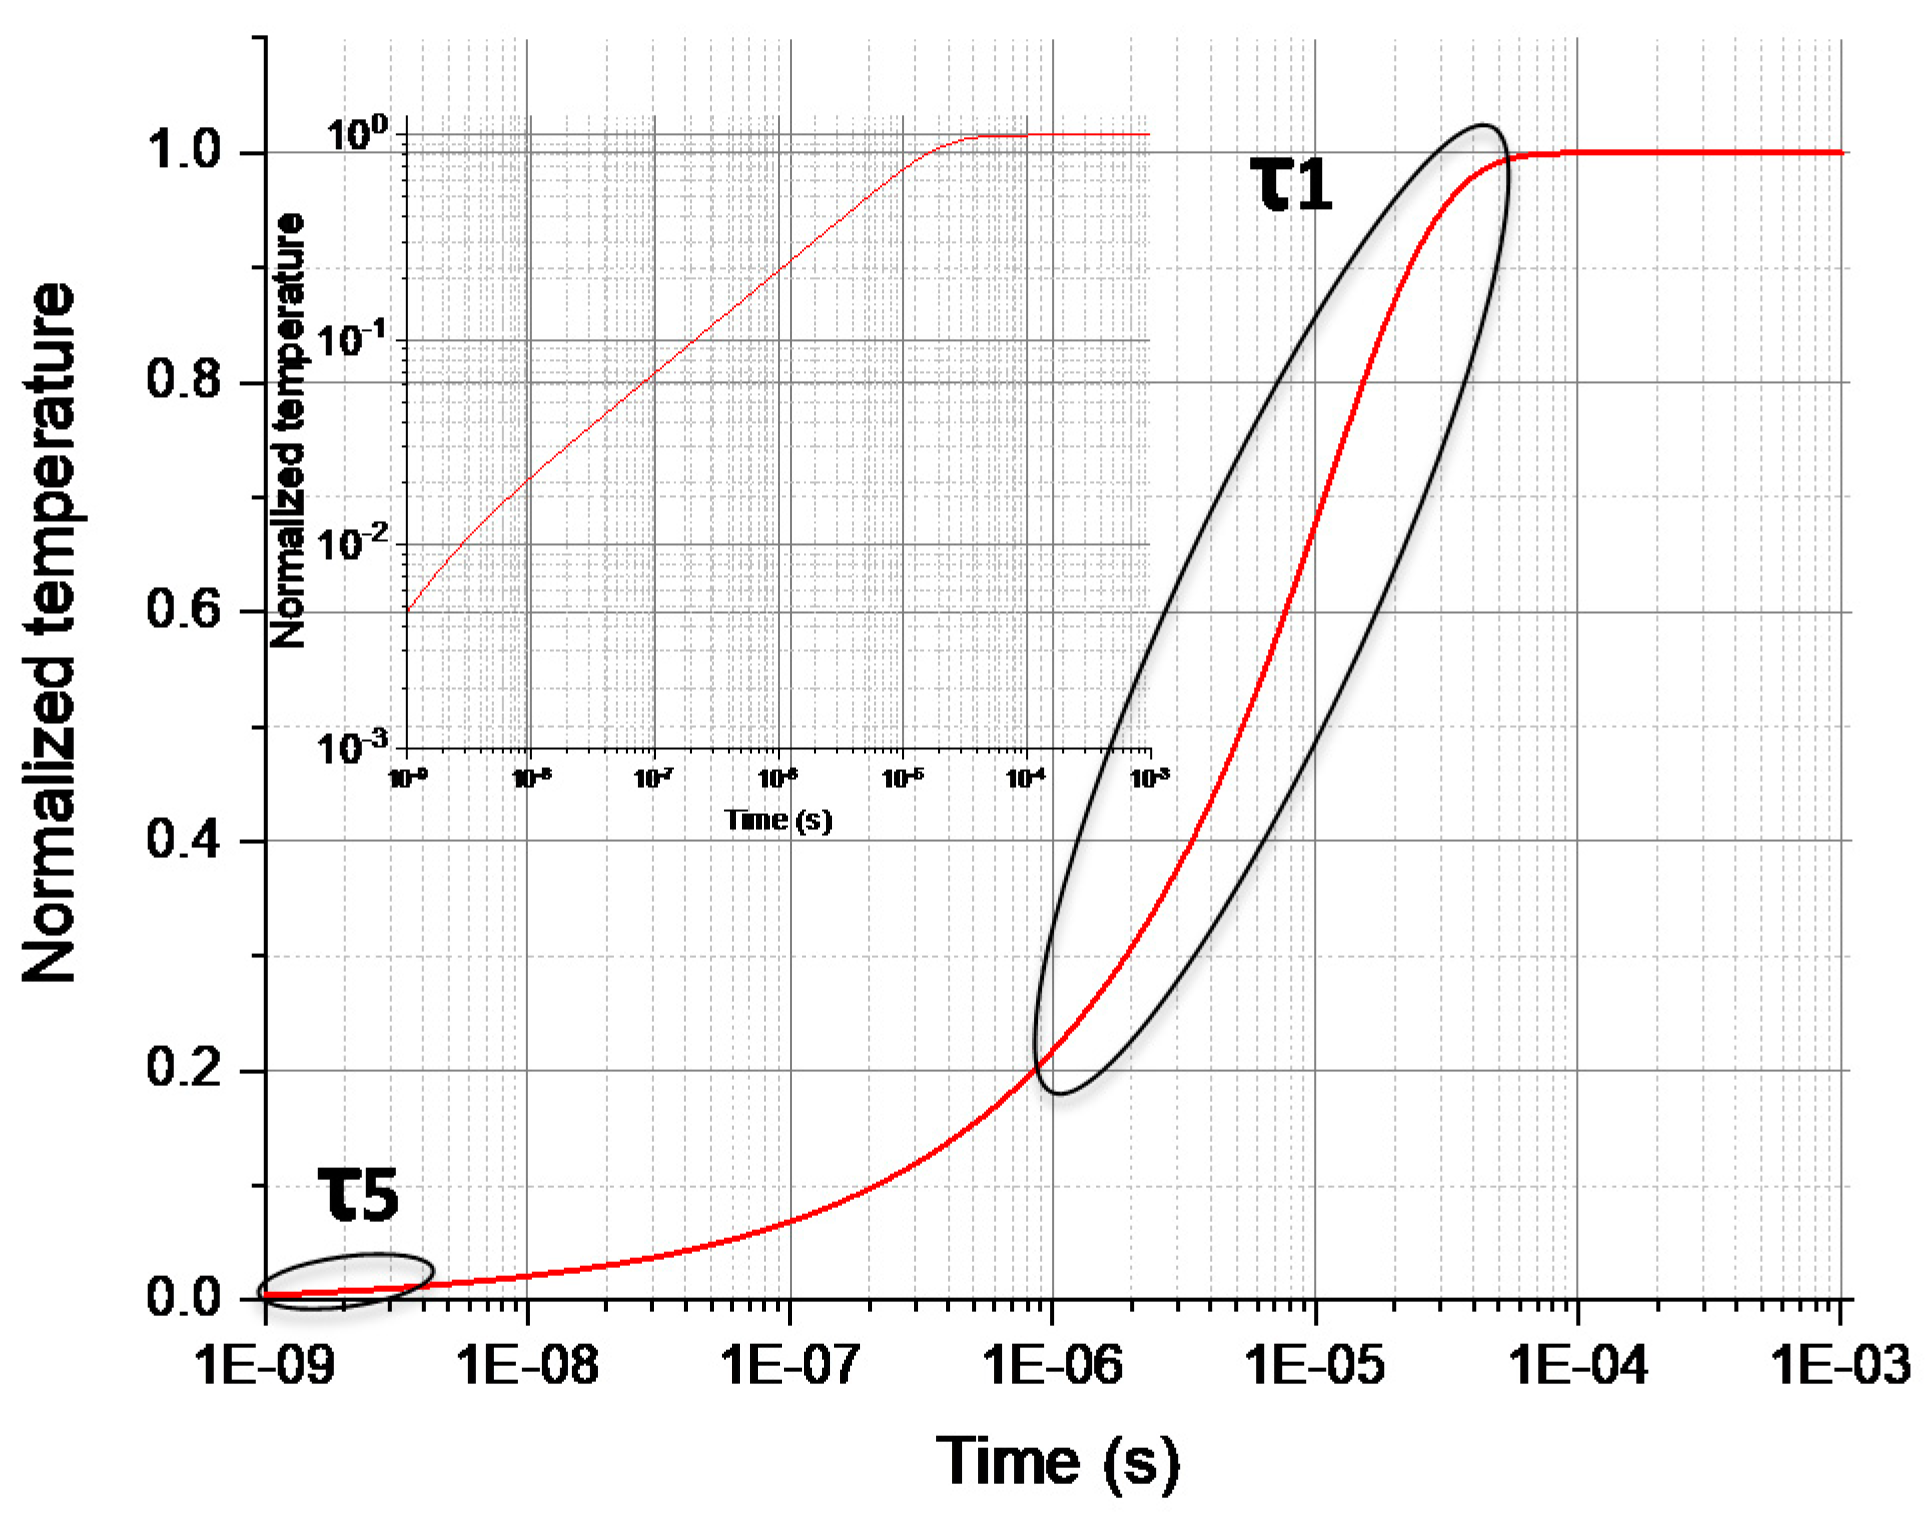
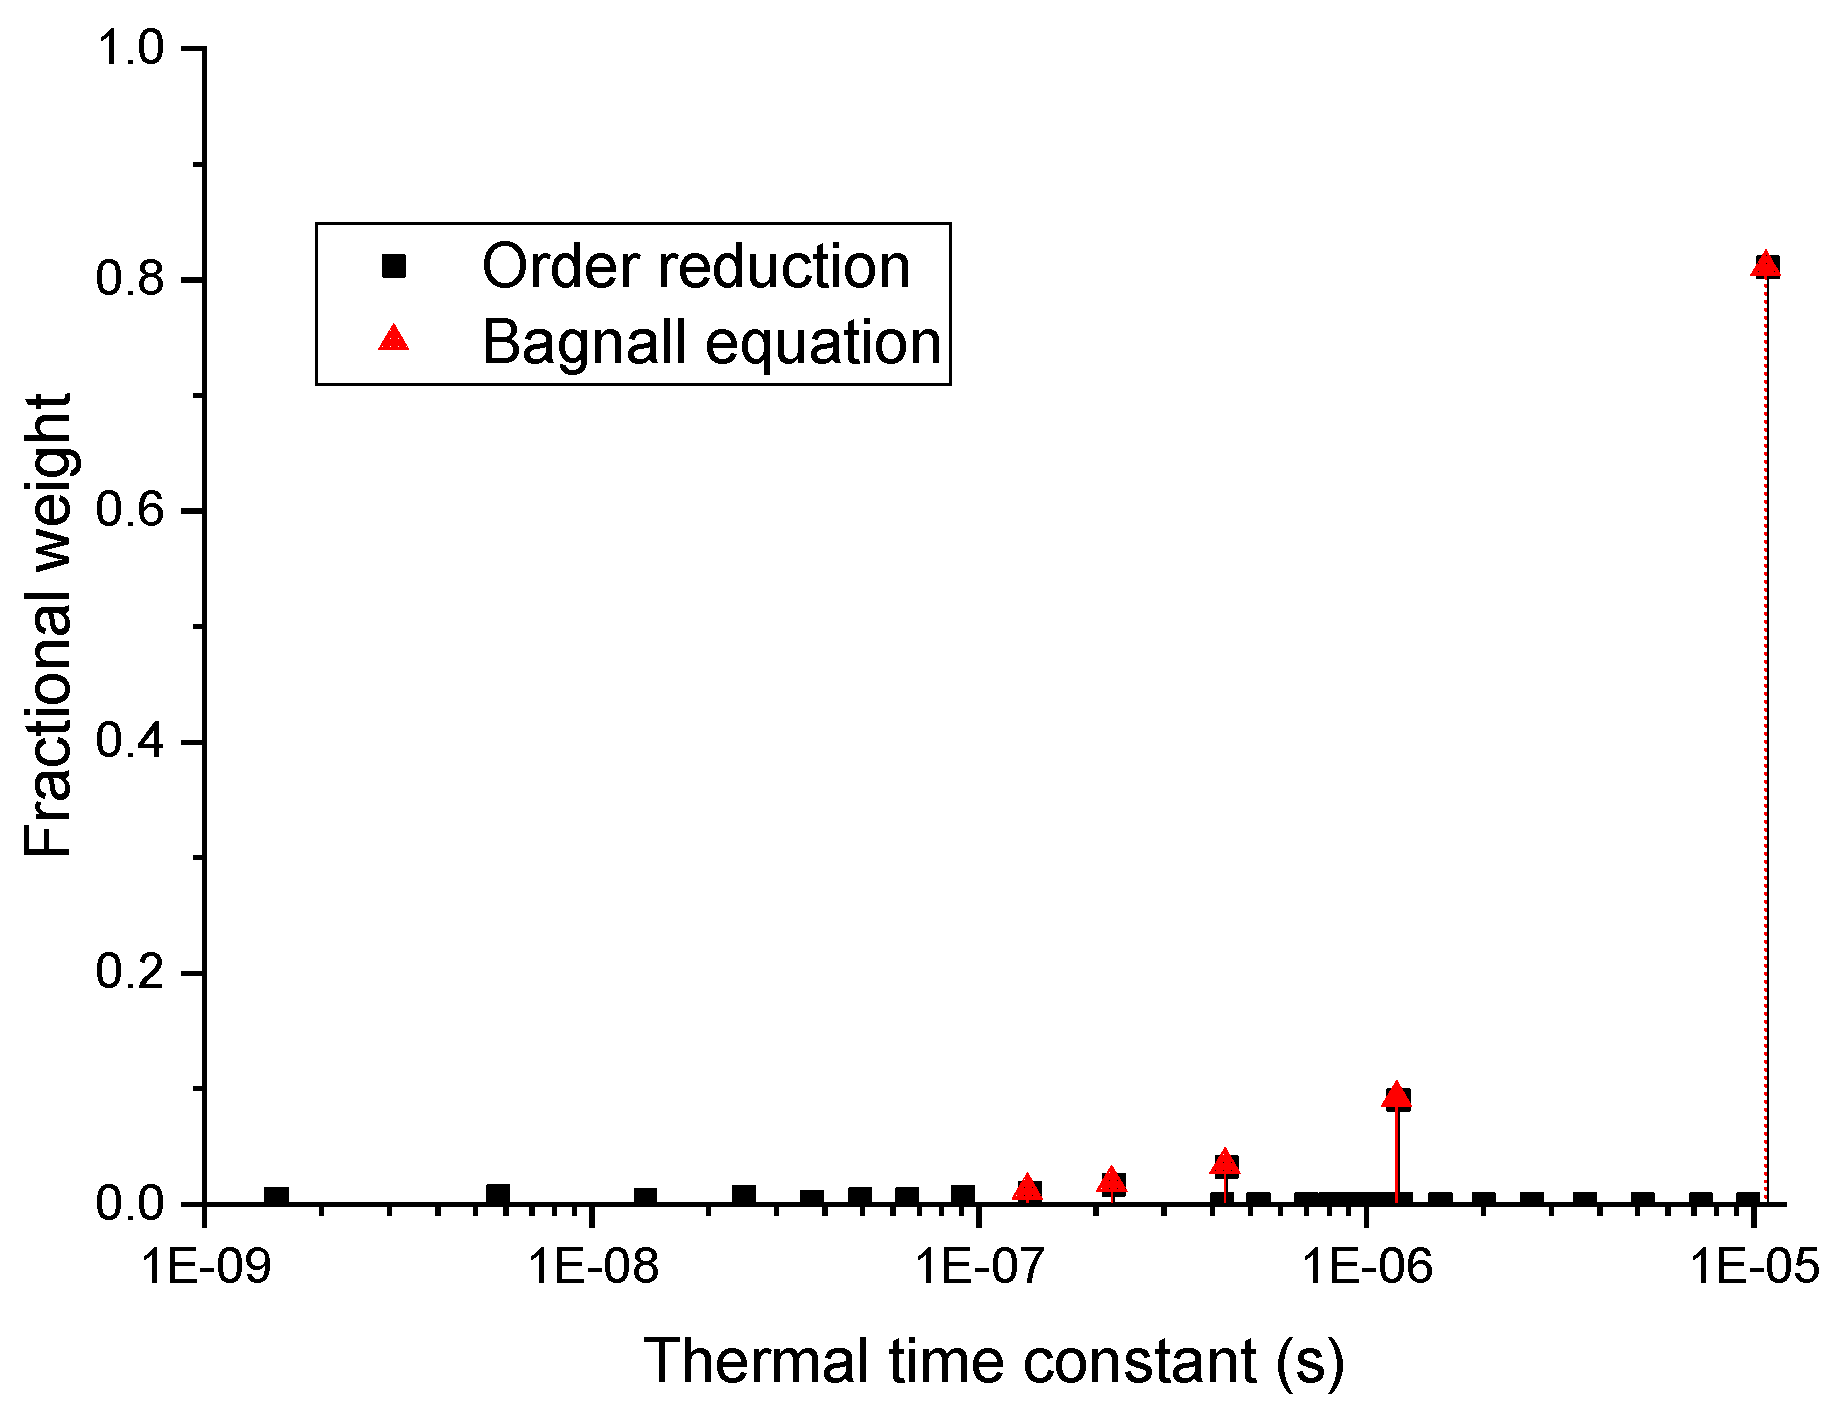
Figure 3 presents the normalized transient temperature response and the different thermal time constants region extracted by the MOR technique. Figure 4 displays the fractional weight of the normalized temperature versus the thermal time constant spectrum. The longest time constant represents 81% of the total temperature contribution.
These results highlight on one hand that more than one time constant is needed to represent the transient thermal behavior of a simple 1-D structure, and on the other hand they exhibit the difficulty and complexity of the transient approach. Furthermore, Bagnall established the analytical time constant formula for the structure presented in [7].
τ n = 4 · L 2 ( 2 n 1 ) 2 · π 2 · α  
where α is the thermal diffusivity of the layer defined by:
α = K ρ · C p
Table 2 shows an excellent agreement between the analytical method [7] used to extract the thermal time constants with their fractional weight and our numerical method based on the Ritz vector MOR theory applied to Equation (1). This investigation proves that results determined by MOR for any structure are likely to provide the real physical values for thermal time constants and thermal resistances.
Figure 5 shows the influence of the number of the Ritz values. In the first example, we can observe that with five values, a very good accuracy was obtained from 1 ns to the steady state, while this one was reached in all cases.

3.2. One-Dimension, Two-Layers Simulation

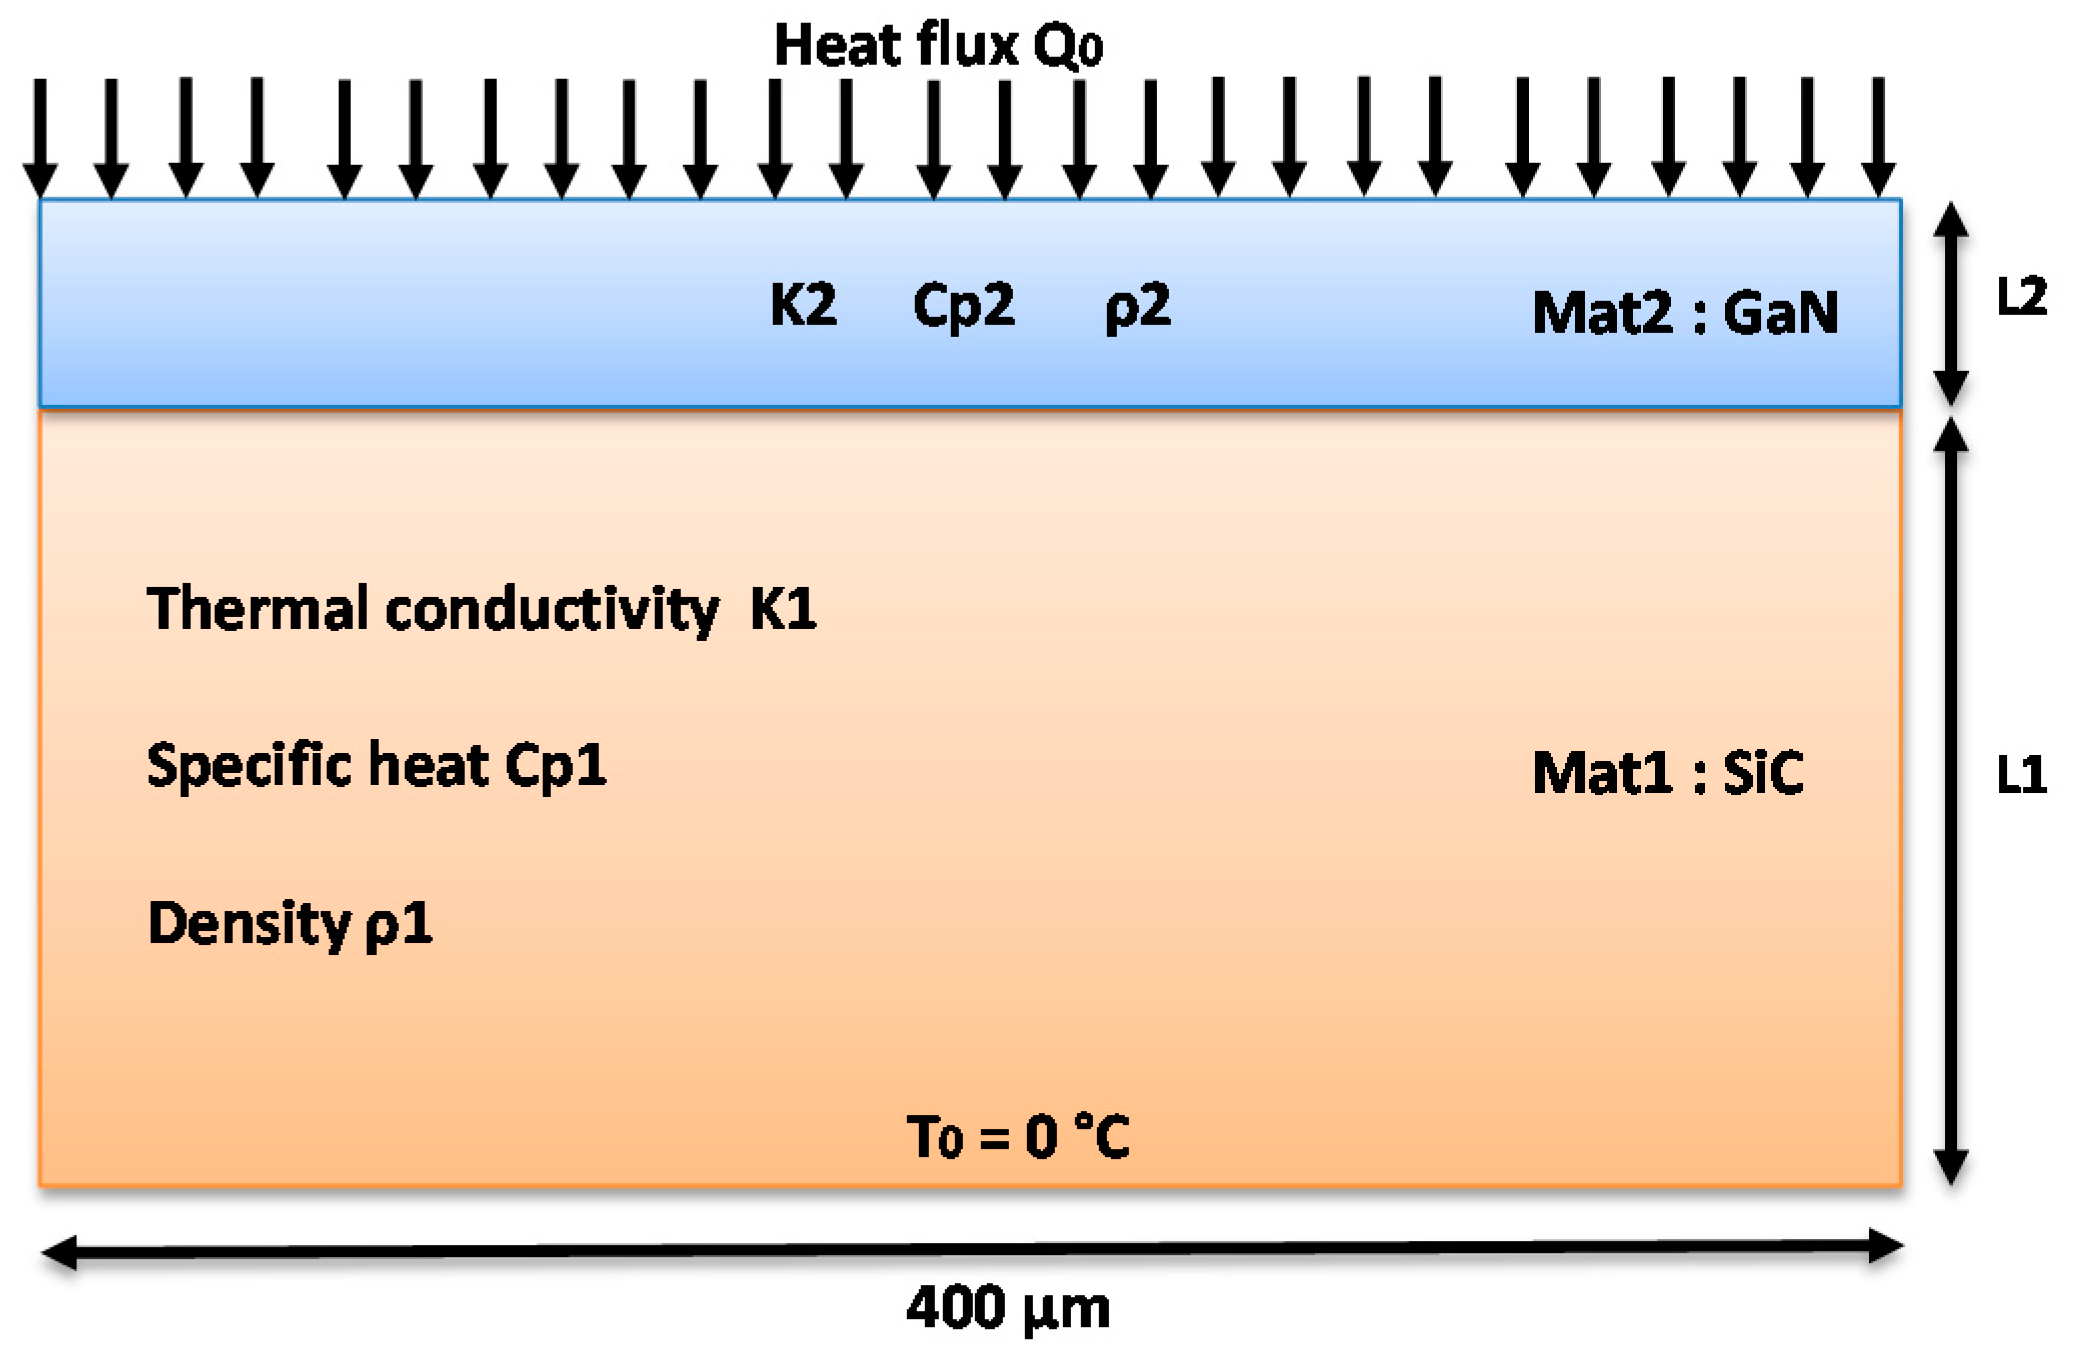
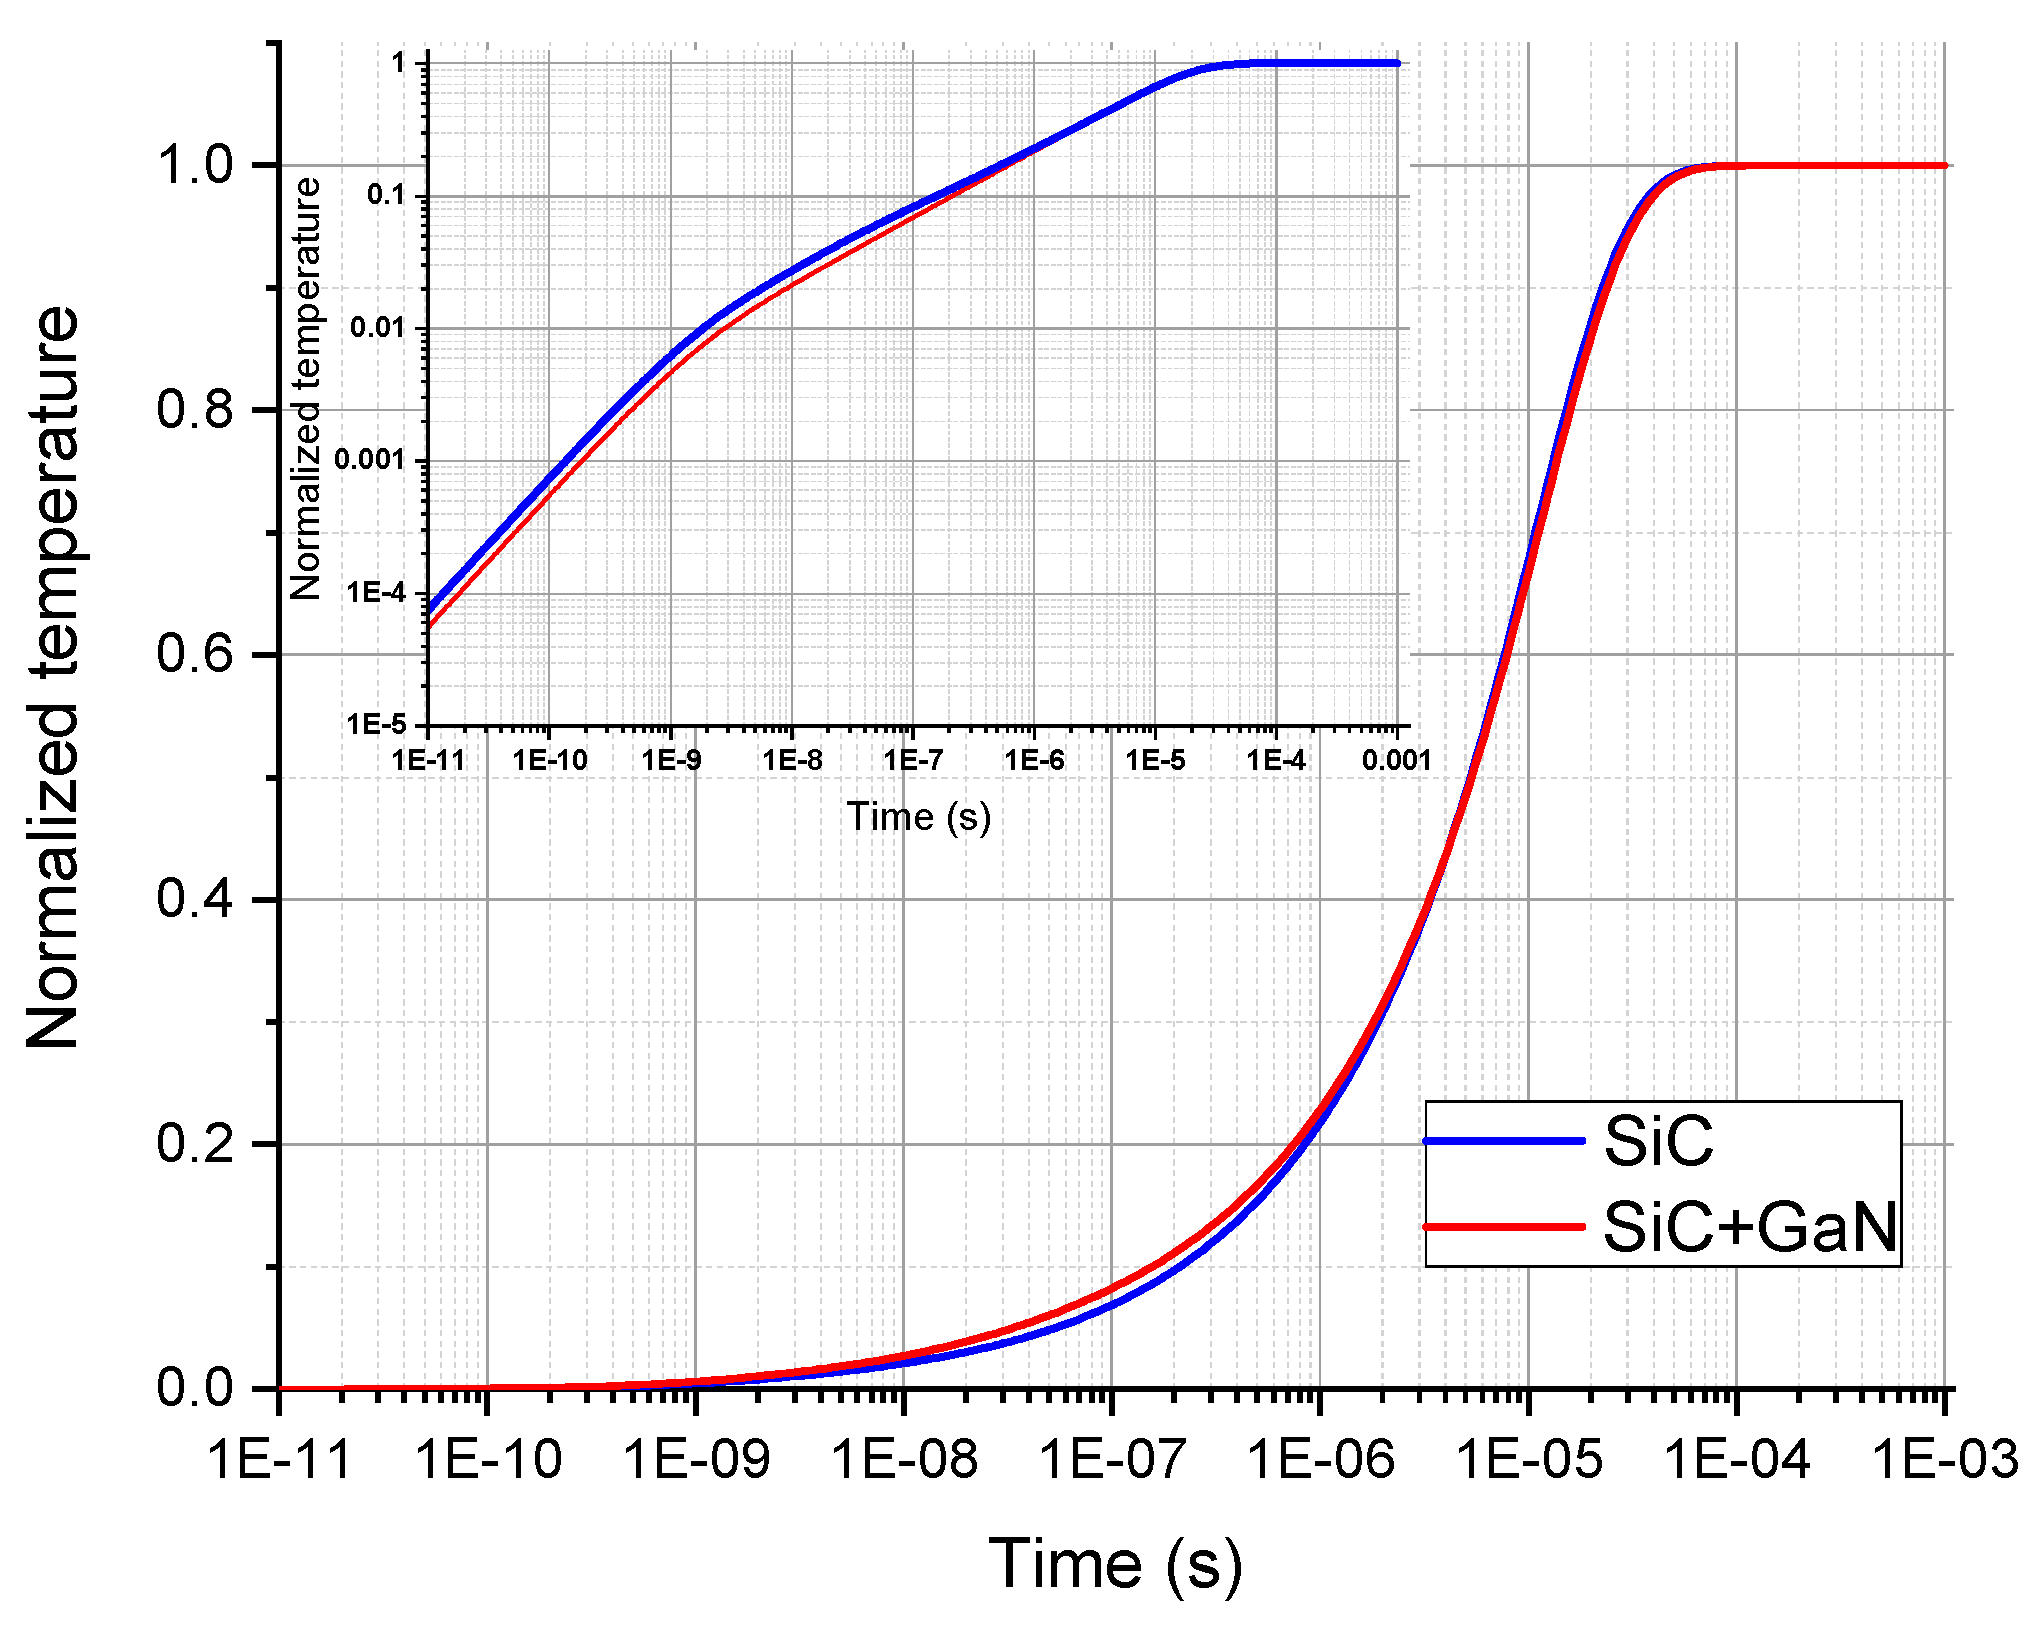
The GaN HEMTs structure may require to take into consideration more than the substrate to determine the transient response of the device. Thus, the GaN epitaxy layer was added. Figure 6 shows the structure described where t1 = 70 µm and t2 = 1.7 µm. The extraction of the different thermal time constants was performed using MOR. Parameter values for these studies are reported in Table 3. The normalized temperature is plotted Figure 7 for both structures (SiC and SiC+GaN), whereas the thermal time constant spectrum is displayed in Figure 8. In Figure 7, curves exhibit a very similar behavior with a very small error. In Figure 8, the thermal time constants have more or less the same value and the same fractional weight. This small variation is due to the small influence of the couple (GaN thickness, GaN thermal conductivity) with respect to the substrate layer.
Figure 6 can be considered as one “equivalent” layer structure where:
L e q = L 1 + L 2
α e q = α 1 · L 1 L 1 + L 2 + α 2 · L 2 L 1 + L 2
By making use of Equation (9):
τ n = 4 · ( L 1 + L 2 ) 3 ( 2 n 1 ) 2 · π 2 · ( α 1 · L 1 + α 2 · L 2 )
In general, for GaN HEMTs transistors, the width of the substrate layer is negligible compared with the width of the GaN layer (L1 >> L2).
Thus, using the Taylor expansion of this function, Equation (13) gives:
τ n = 4 · L 1 2 ( 2 n 1 ) 2 · π 2 · α 1 ( 1 + α 2 · L 2 α 1 · L 1 ) + 12 · L 1 · L 2 ( 2 n 1 ) 2 · π 2 · α 1 · ( 1 + α 2 · L 2 α 1 · L 1 )
If α 1 · L 1 α 2 · L 2 :
The thermal time constant can be expressed as:
τ n = 4 · L 1 2 ( 2 n 1 ) 2 · π 2 · α 1 + 12 · L 1 · L 2 ( 2 n 1 ) 2 · π 2 · α 1
Table 4 shows that Equations (6) and (7) found using the Taylor expansion demonstated good agreement with MOR results.

4. Two-Dimensional (2-D) Analysis

4.1. 2-D, One-Layer Simulation

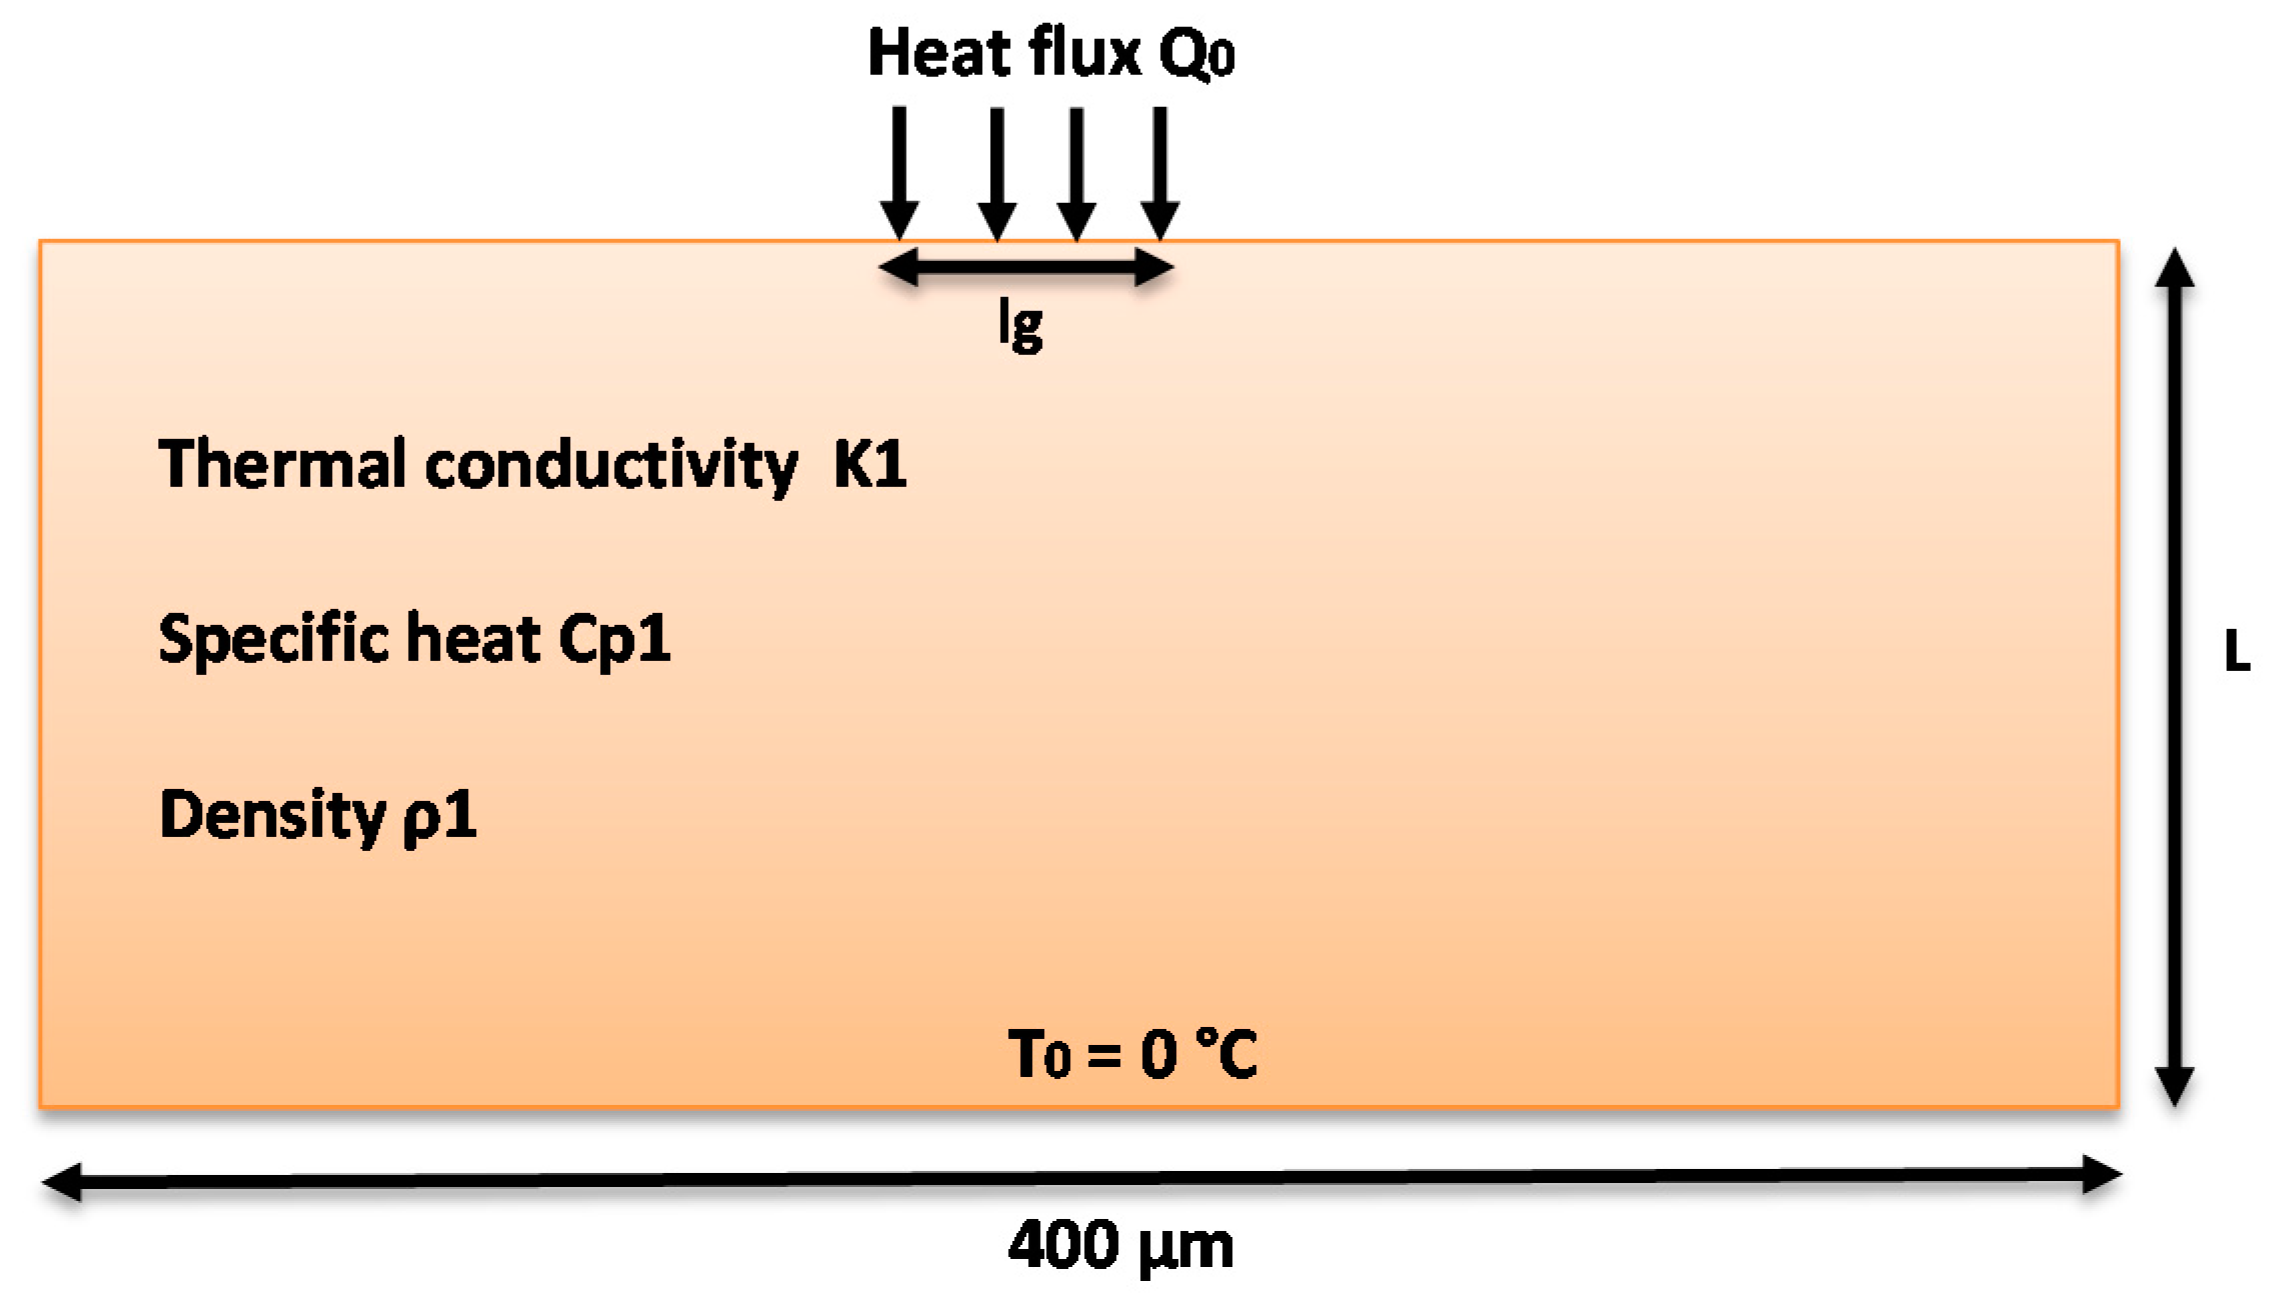
In GaN HEMT RF power devices, the gate length is typically between 0.1 and 1 µm. The structure used for the 2-D simulation is shown in Figure 9.
With the technique used previously, a 2-D simulation using ANSYS software was performed. The K and M matrices and load vector were extracted using our MOR process. Then, the different thermal time constants and thermal resistances were determined.
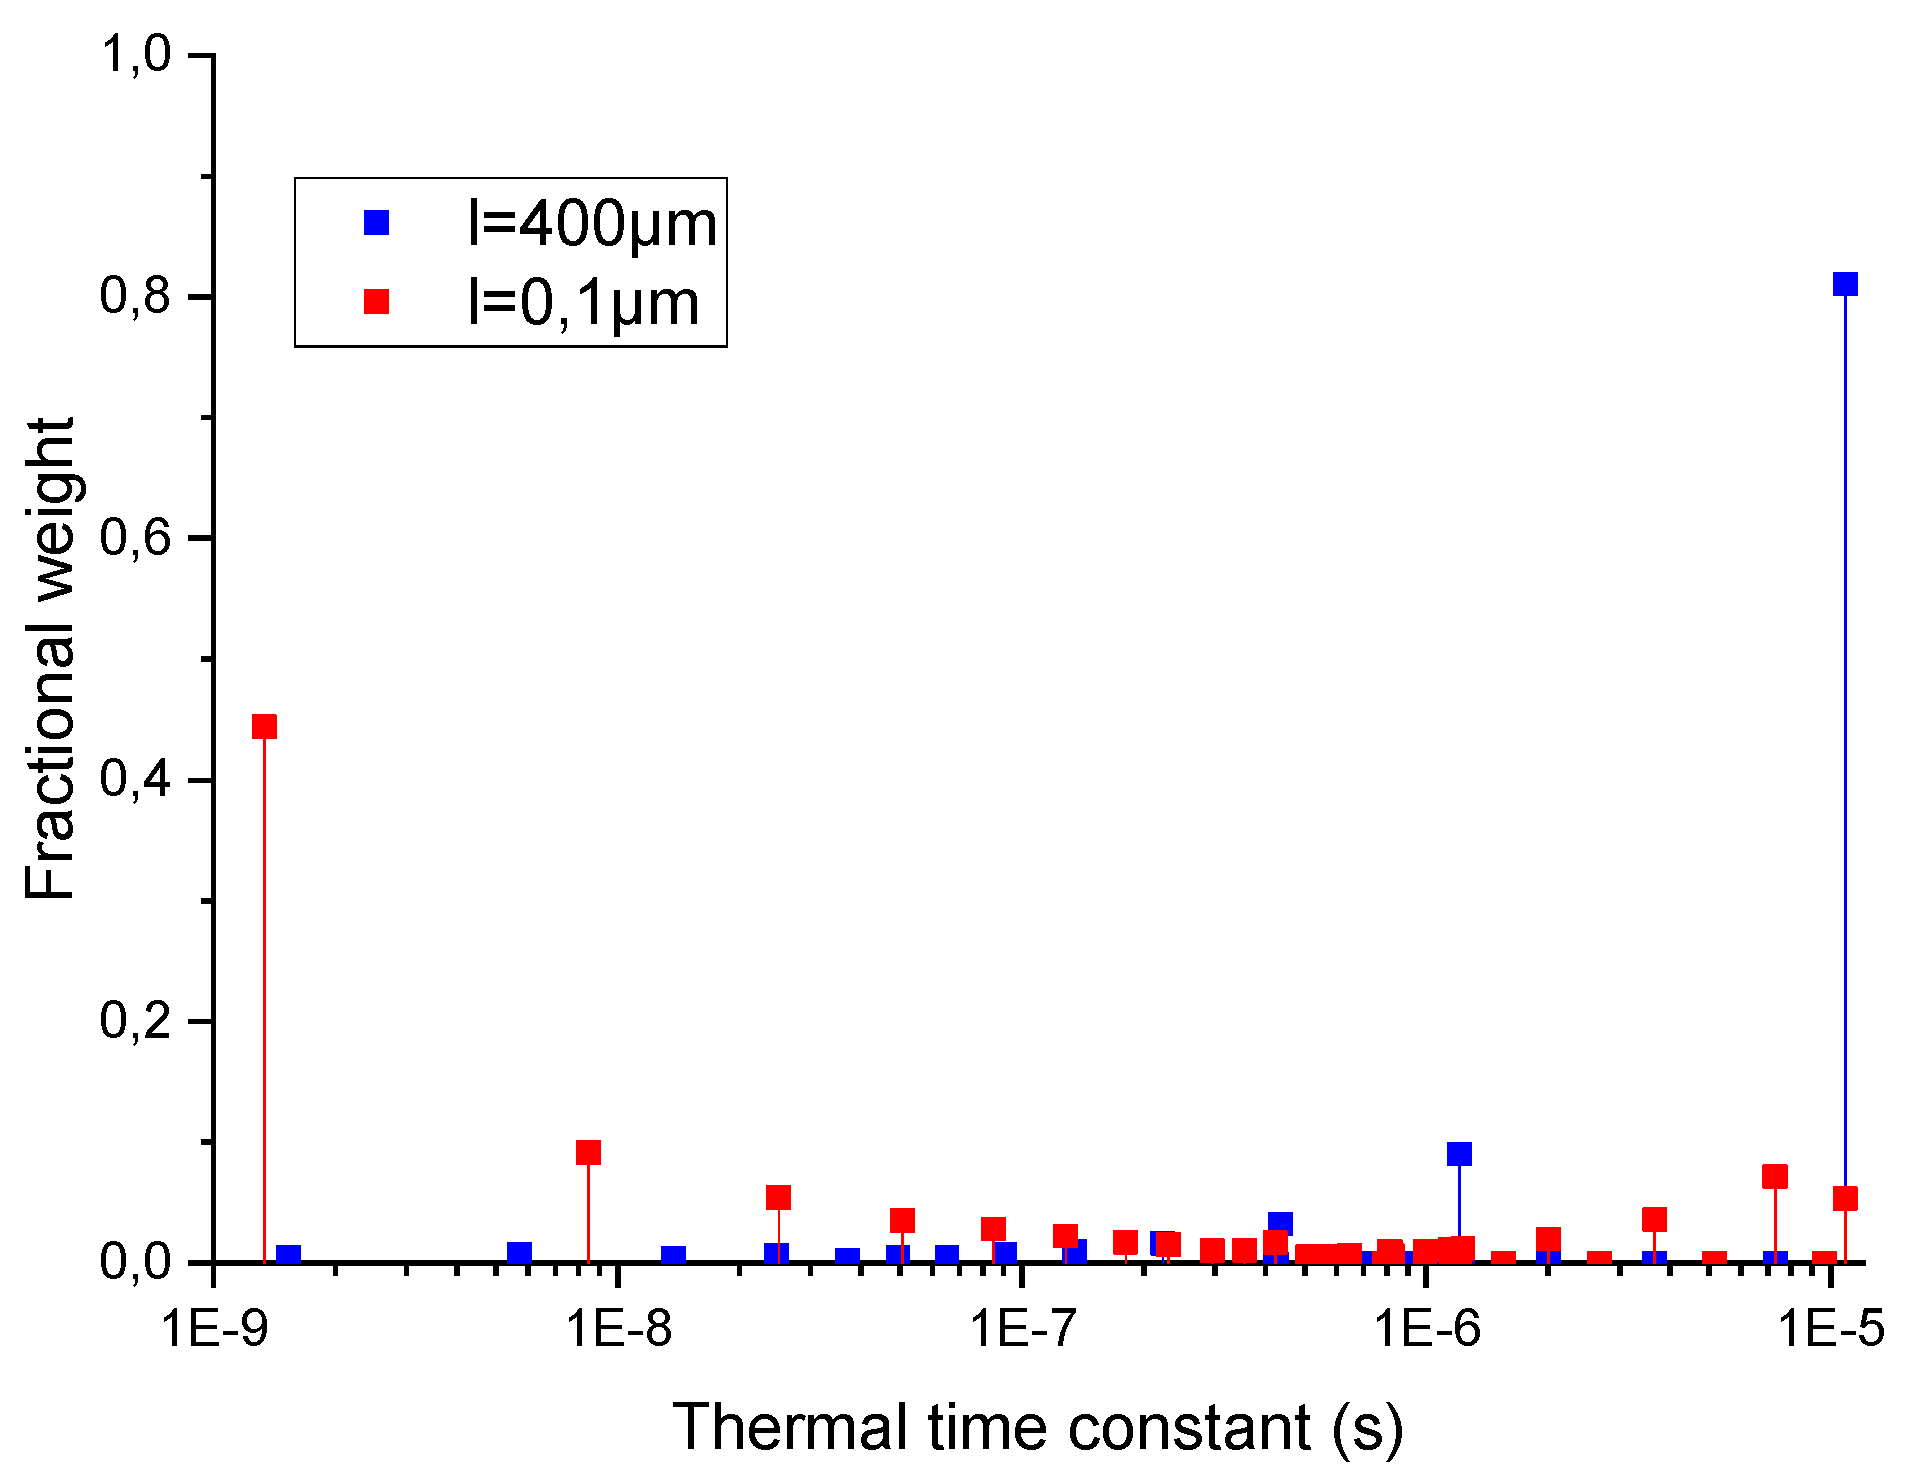
Figure 10 shows the comparison between the normalized time domain thermal response of an evenly distributed heat flux applied both on the full length (400 µm) and a length lg = 0.1 µm. The 2-D solution for lg = 0.1 µm exhibited a faster response than for lg = 400 µm. This behavior reveals the existence of more thermal time constants and a broadening of the time constant spectrum.
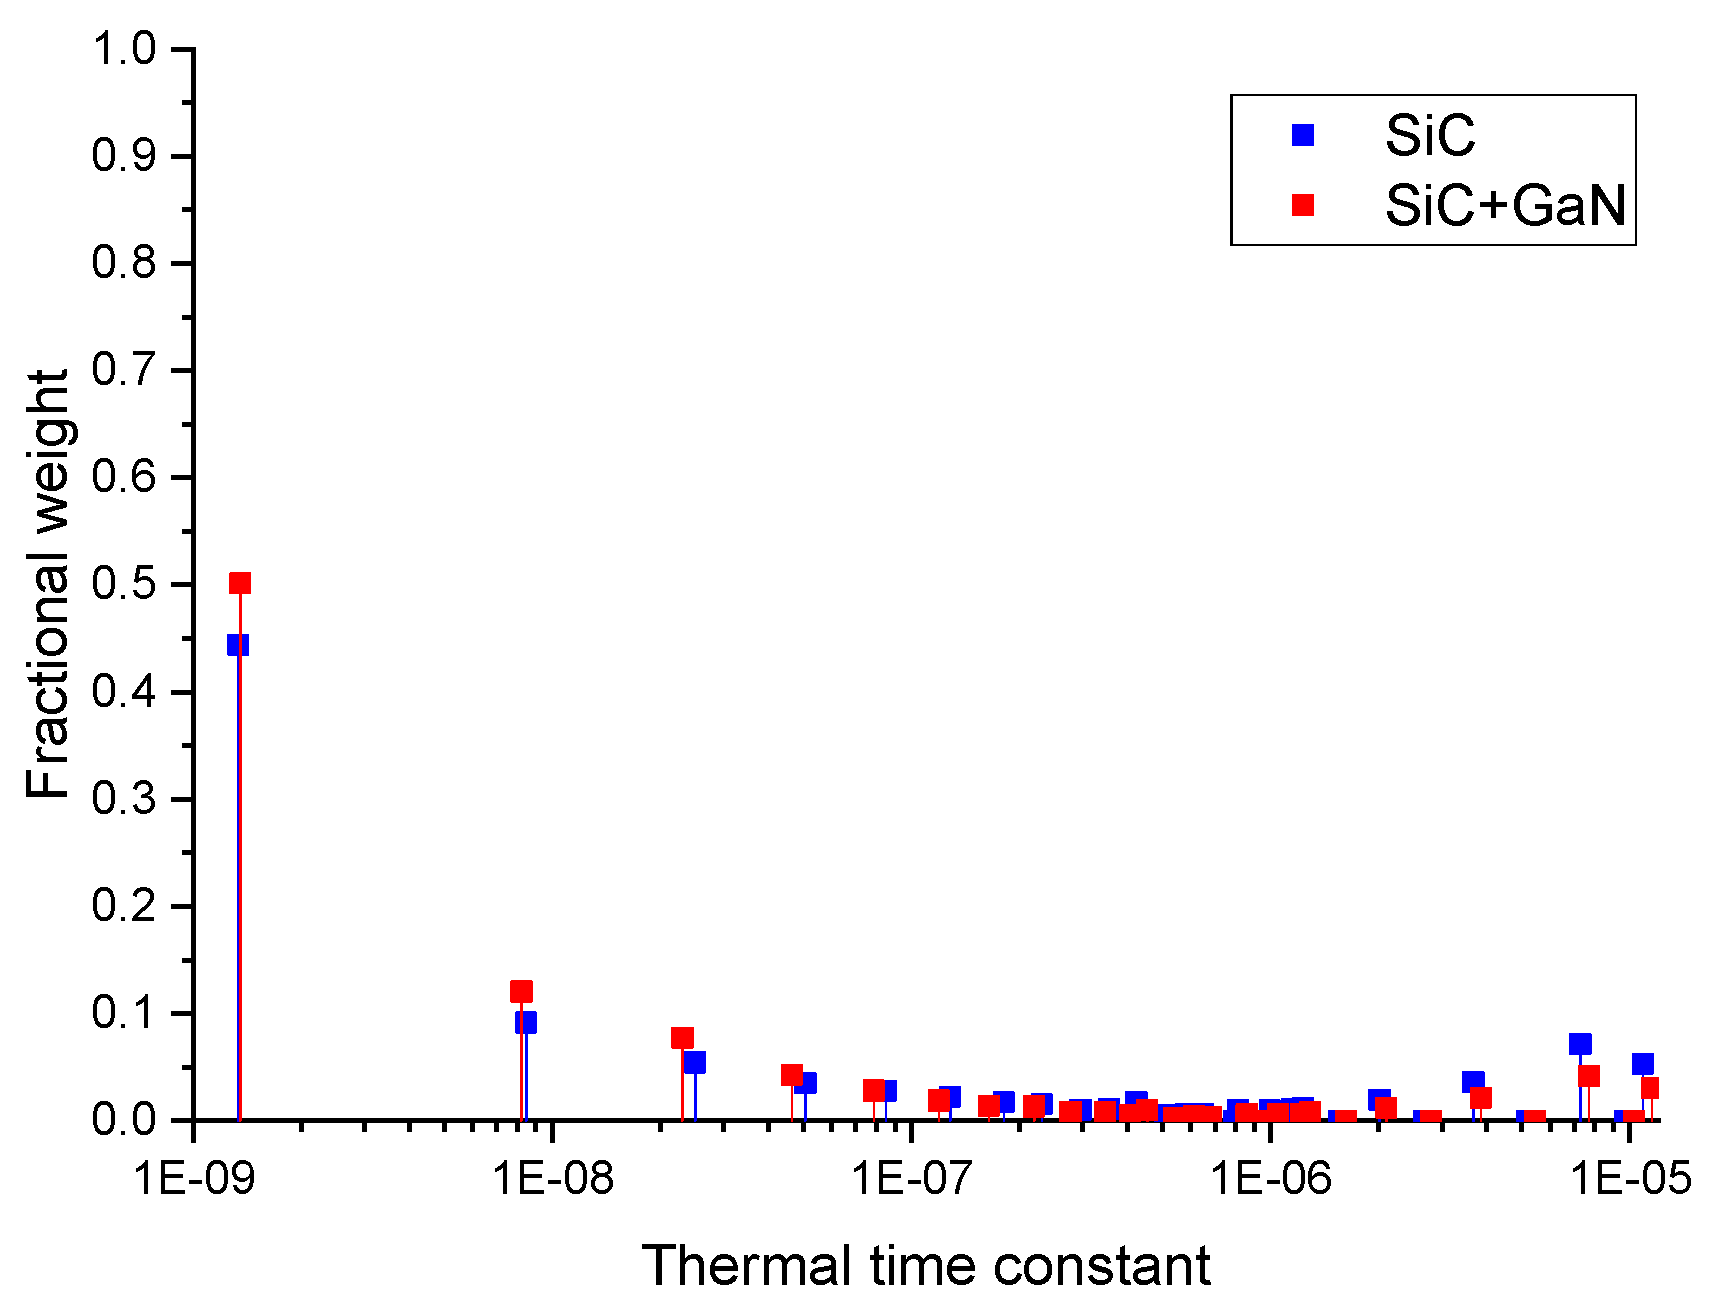
Figure 11 shows a sharp decrease in the weight fraction for the longest thermal time constant as τ1 dropped from 81% for lg = 400 µm to 5% when lg = 0.1 µm. Moreover, this figure exhibits an increase in the density of significative thermal time constants in the spectrum. The shortest one τ21 (1.33 ns) had a fractional weight equal to 44% when lg equaled 0.1 µm and did not exist when lg equaled 400 µm.
From the previous observations, complementary 2-D studies were performed for a heating region length “lg” varying from 0.1 µm to 1 µm.
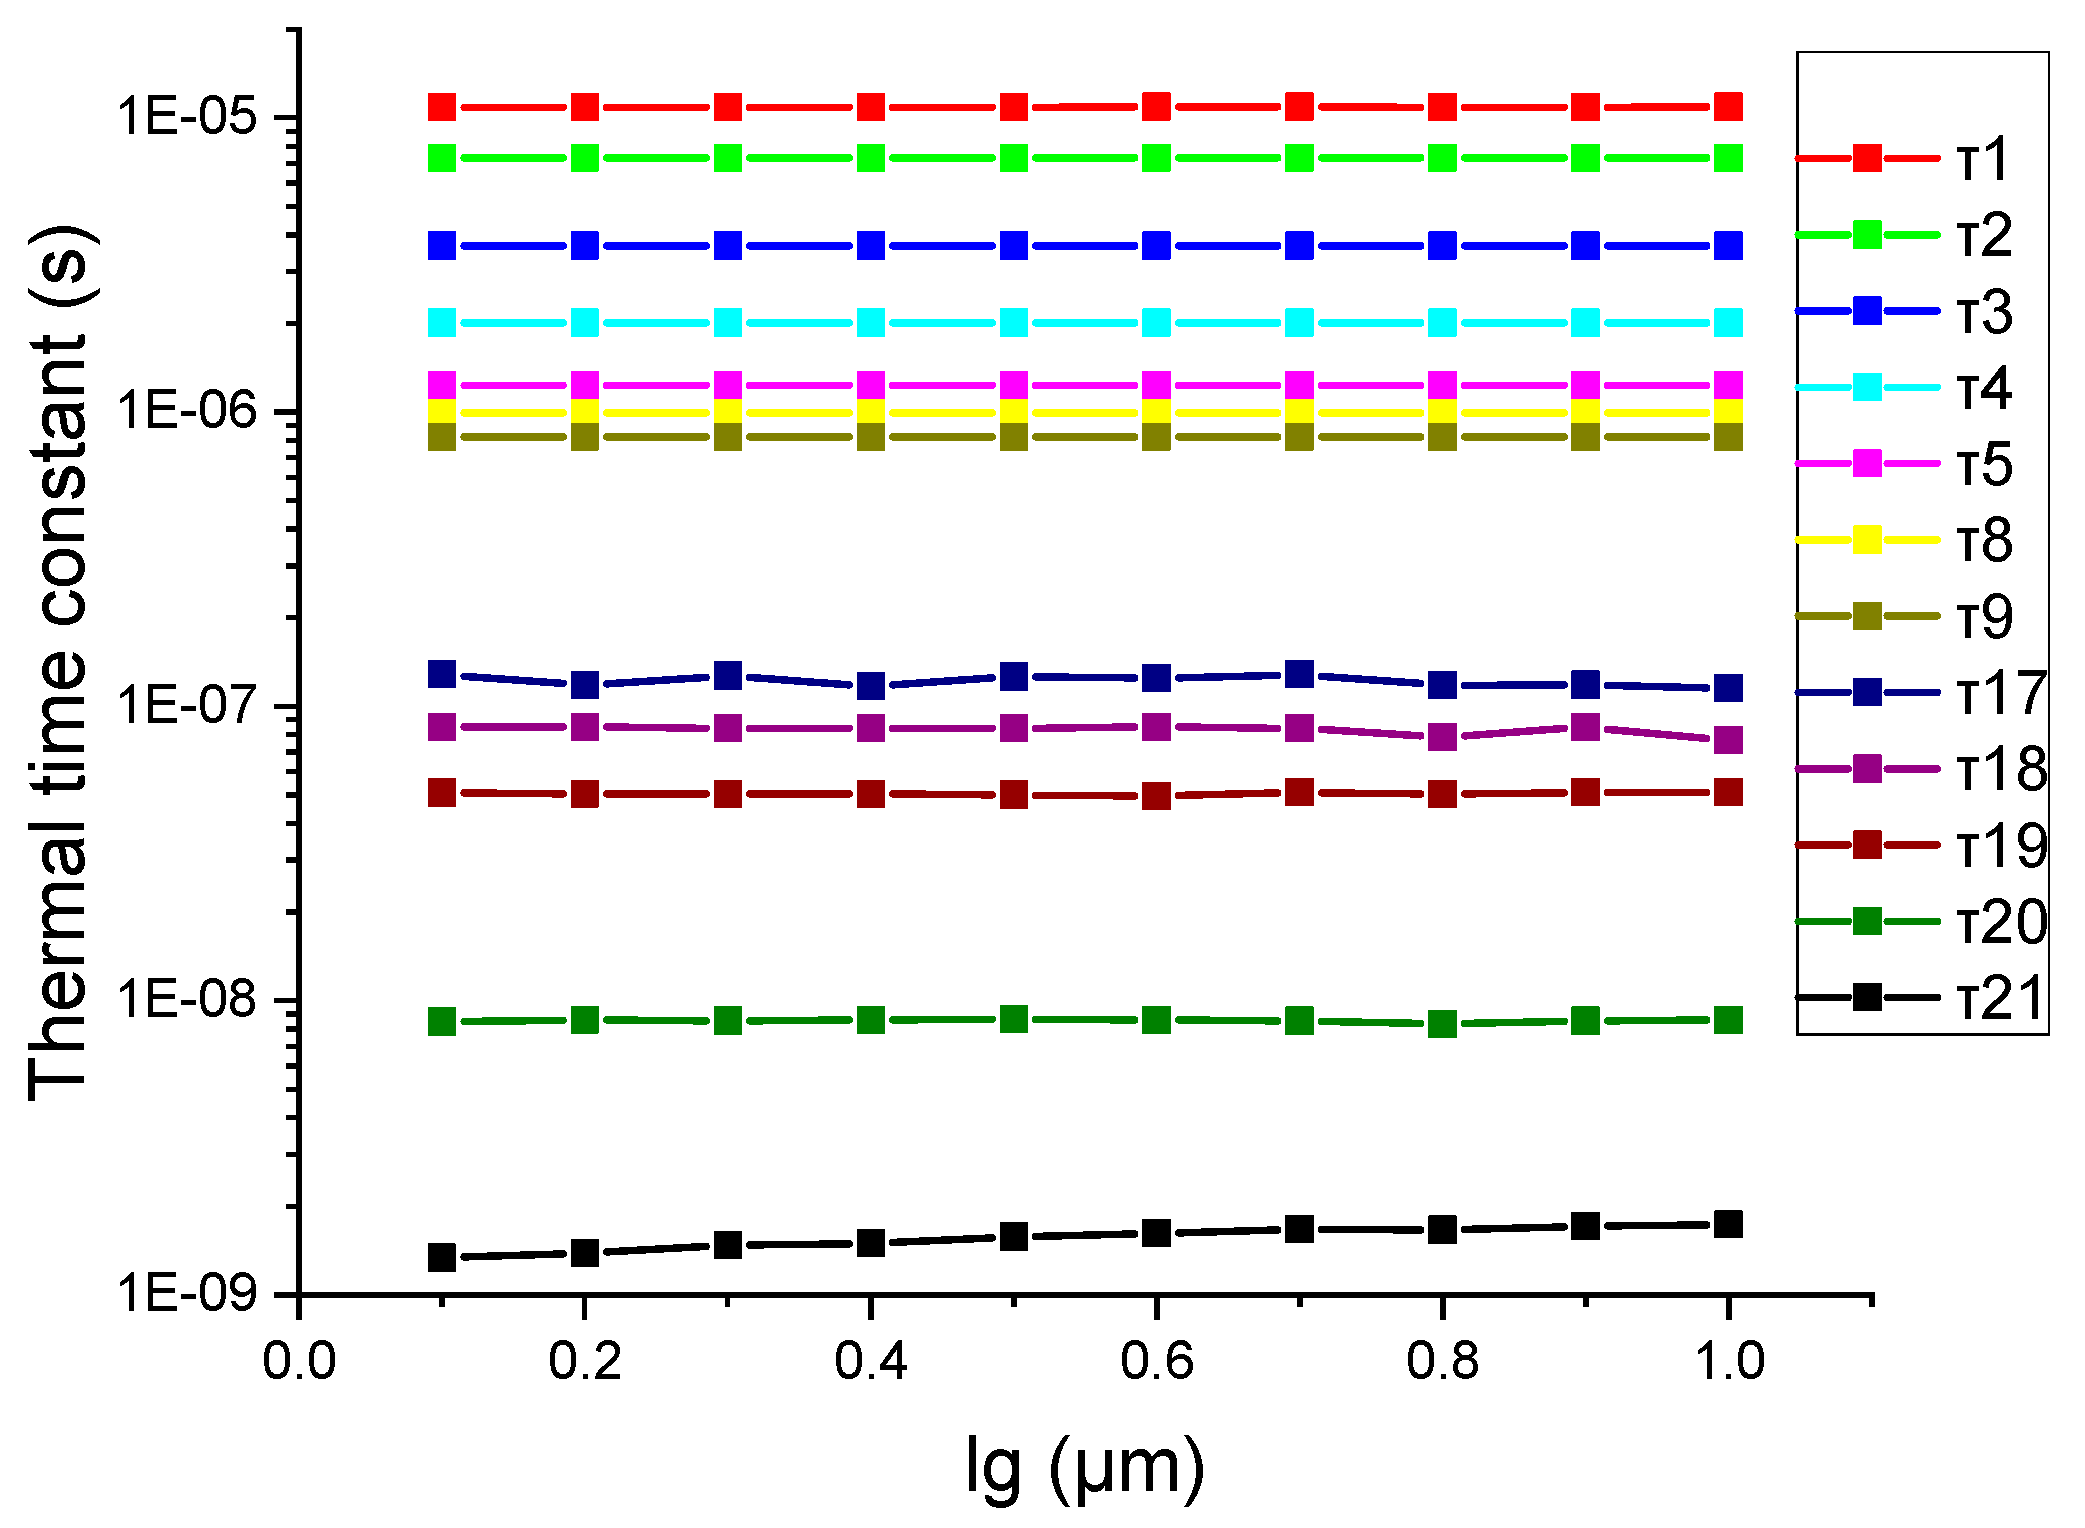
Figure 12 shows that all the extracted thermal time constants were independent of the gate length except for the shortest one τ21. Regarding the thermal resistances (Figure 13), the only non-constant resistance was the one corresponding to the shortest thermal time constant (τ21) i.e., the one corresponding to the close vicinity of the heat source. In addition, another interesting result relies on the fact that the shortest thermal capacitance was linear in function of “lg” while the thermal resistance was linear with log (lg) [14]. This observation on the trend of the thermal resistances is fully consistent with Darwish and al. [6], where it is explained that only a part of the resistance depends on log (lg).
Then, the temperature transient response for this structure can be modeled using a Foster-type circuit with 20 constant-value RC blocks with one variable-parameter RC block.

4.2. 2-D, Two-Layer Simulation

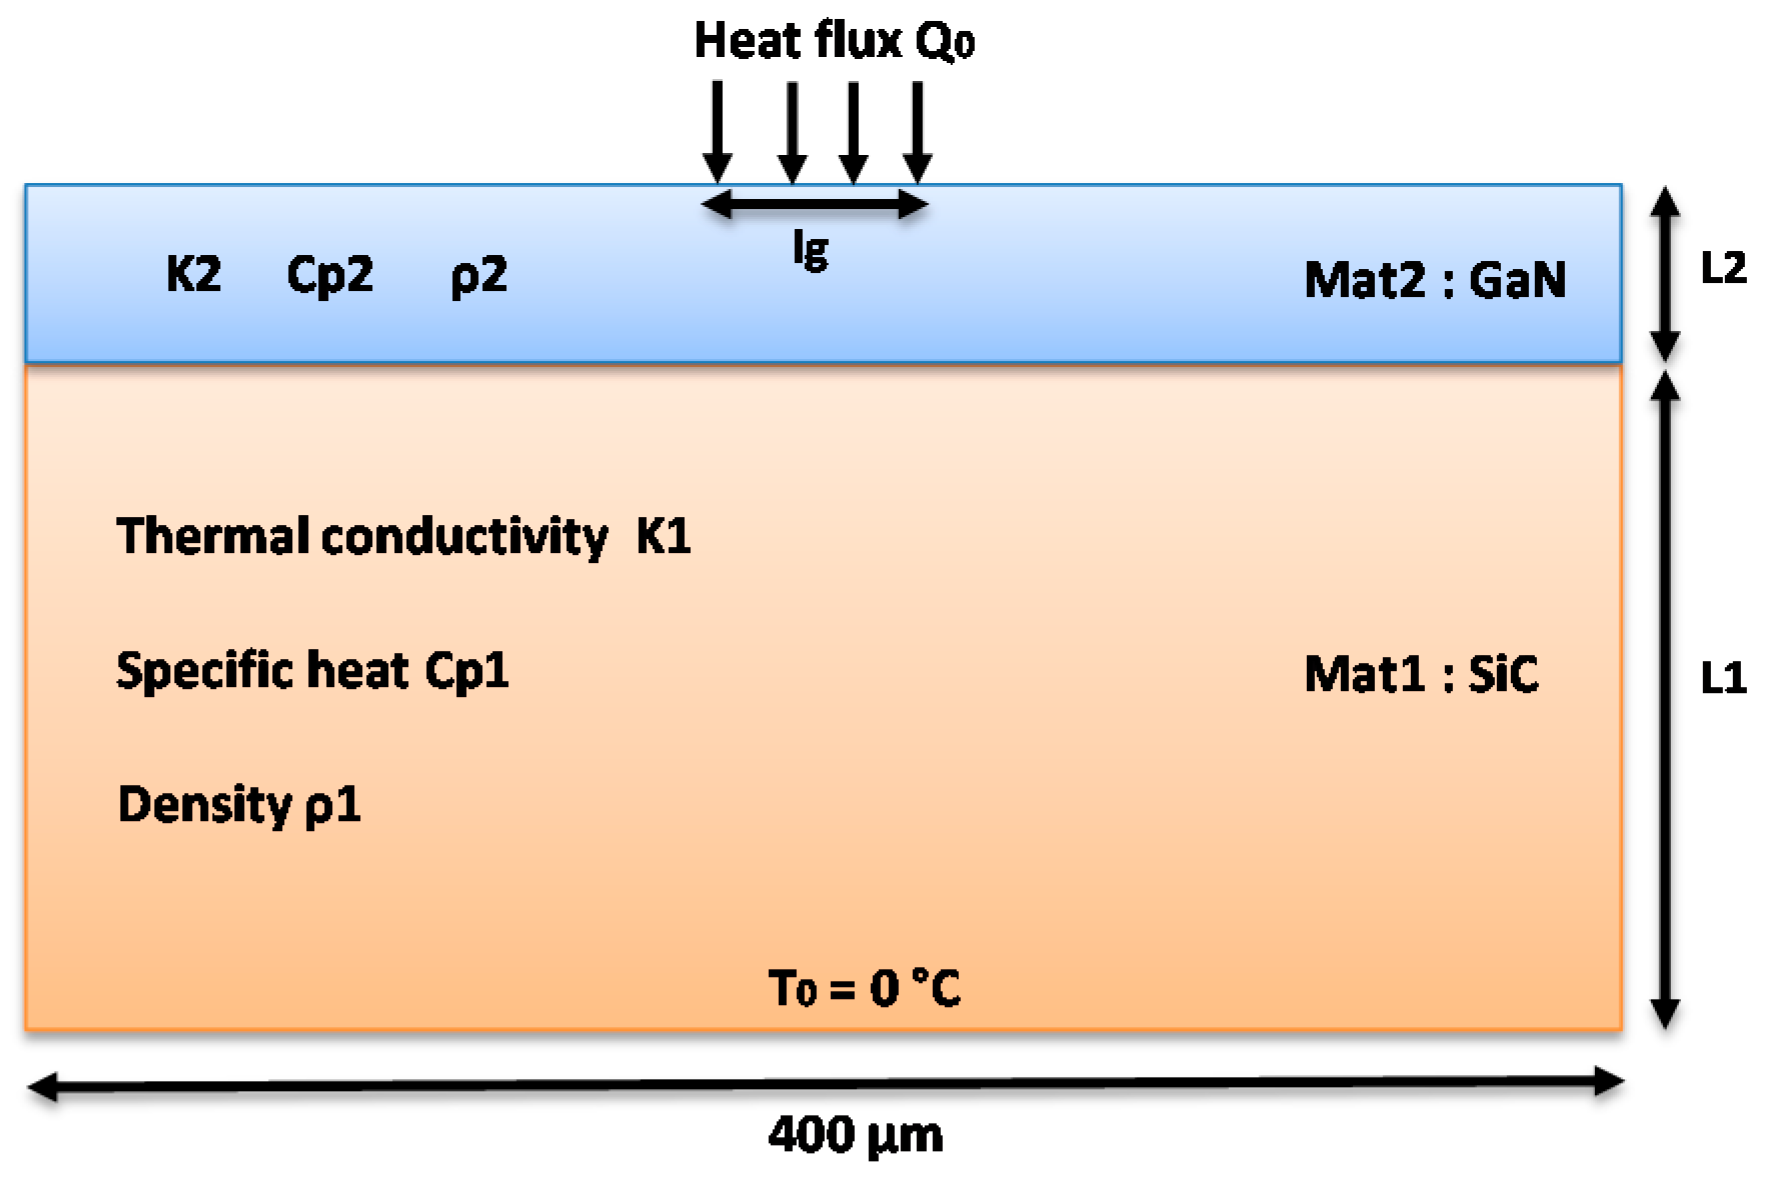
As previously mentioned, GaN HEMTs require more than the substrate to be considered in determining the transient response of the device; thus, approximating the real structure of GaN transistors, a GaN epitaxy layer was added with a gate length between 0.1 and 1 µm. Figure 14 shows the structure used for the 2-D two-layer simulations. For the first simulation, lg = 0.1 µm, L2 = 1.7 µm, and L2 = 70 µm.
Figure 15 shows that the GaN layer epitaxy had a larger impact on the thermal transient response than for large gate length, and due to the to the small GaN thickness as compared with the substrate layer, the impact on the thermal time constant was negligible, as shown in Figure 16.

5. Calibration between Simulation Results and Measurements

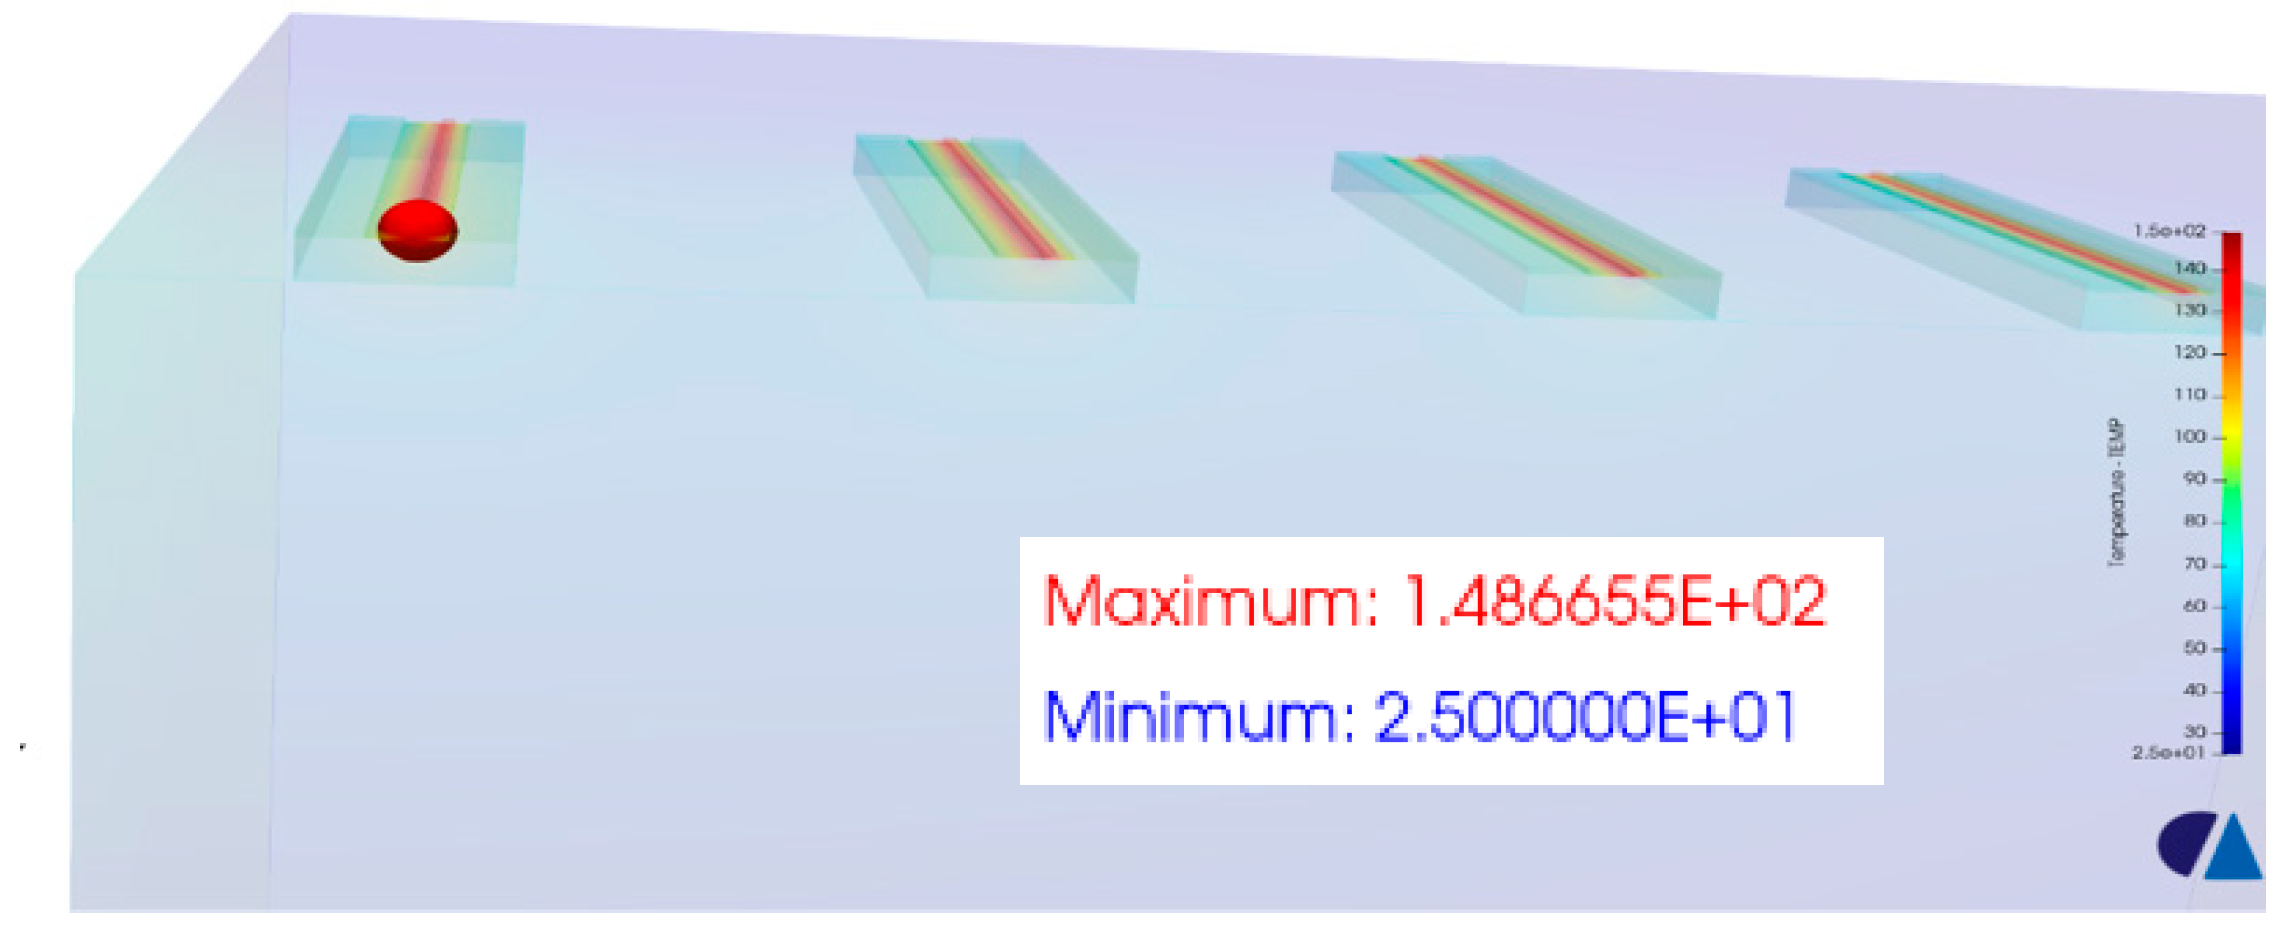
These results presented in Figure 17 concern the steady state for an eight-finger GaN HEMT with gate length of 0.15 µm and gate width of 50 µm. They allow us to validate the FEM approach in terms of thermal resistance as well as the geometry and mesh.
A thermoreflectance measurement of the temperature is presented in [15,16]. The maximum of temperature variation from ambient for this device was 22 °C during a dissipated power of 0.7 W, leading to a thermal resistance of 31.4 °C/W.
The Finite Element simulation presented in Figure 18 was performed by considering symmetries for ¼ of the structure. Adiabatic lateral boundary conditions, a baseplate of 25 °C, and a total dissipated power of 4 W were considered for the simulation. Thus, the extracted thermal resistance obtained was (148.6 − 25)/4, i.e., 30.9 °C/W.

6. Conclusions

In this paper, we provided elements for the understanding of thermal time constants in GaN HEMTs. The main goal of this work was not to propose the best physics-based method to understand the submicronic GaN HEMT device properties, but instead a new approach based on a well-known Fourier theory and Finite Element Method tools, which are commonly used in labs and the electronics industry.
In summary, we intended to show:
that there are several thermal time constants in a HEMT, even with a 1-D, single layer;
the influence of the GaN layer on the thermal time constants;
the evolution of the thermal time constants with the dimensions of the devices, and in particular with the gate length, which is one of the key points to address in high-frequency applications.
The last conclusion that emerged from this work is that by using the common tools and a model order reduction technique, it is possible to extract real physical thermal time constants, which is usually only possible using analytical approaches.

Author Contributions

Project administration, R.S.; Software, A.J., R.S.; Validation, A.J., R.S. and J.-C.N.; Visualization, A.J.; Writing—original draft, A.J., R.S., F.S. and J.-C.N.; Writing—review & editing, A.J., R.S. and J.-C.N. All authors have read and agreed to the published version of the manuscript.

Funding

This research received no external funding.

Institutional Review Board Statement

Not applicable.

Informed Consent Statement

Not applicable.

Data Availability Statement

The data presented in this study are available upon reasonable request from the corresponding author. The data are not publicly available due to the intellectual property protection rights.

Conflicts of Interest

The authors declare no conflict of interest.

References

  1. Chowdhury, S.; Mishra, U.K. Lateral and Vertical Transistors Using the AlGaN/GaN Heterostructure. IEEE Trans. Electron. Devices 2013, 60, 3060–3066. [Google Scholar] [CrossRef]
  2. Albers, J. An exact recursion relation solution for the steady-state surface temperature of a general multilayer structure. IEEE Trans. Compon. Packag. Manuf. Technol. Part A 1995, 18, 31–38. [Google Scholar] [CrossRef]
  3. Yovanovich, M.M.; Muzychka, Y.S.; Culham, J.R. Spreading Resistance of Isoflux Rectangles and Strips on Compound Flux Channels. J. Thermophys. Heat Transf. 1999, 13, 495–500. [Google Scholar] [CrossRef]
  4. Geer, J.; Desai, A.; Sammakia, B. Heat Conduction in Multilayered Rectangular Domains. J. Electron. Packag. 2007, 129, 440–451. [Google Scholar] [CrossRef]
  5. Masana, F. A closed form solution of junction to substrate thermal resistance in semiconductor chips. IEEE Trans. Compon. Packag. Manuf. Technol. Part A 1996, 19, 539–545. [Google Scholar] [CrossRef]
  6. Darwish, A.; Bayba, A.; Hung, H. Thermal Resistance Calculation of AlGaN–GaN Devices. IEEE Trans. Microw. Theory Tech. 2004, 52, 2611–2620. [Google Scholar] [CrossRef]
  7. Bagnall, K.R.; Wang, E.N. Transient thermal dynamics of GaN HEMTs. In Proceedings of the 2016 15th IEEE Intersociety Conference on Thermal and Thermomechanical Phenomena in Electronic Systems (ITherm), Las Vegas, NV, USA, 31 May–3 June 2016; pp. 1551–1557. [Google Scholar]
  8. Bagnall, K.R.; Wang, E.N. Theory of Thermal Time Constants in GaN High-Electron-Mobility Transistors. IEEE Trans. Compon. Packag. Manuf. Technol. 2017, 8, 606–620. [Google Scholar] [CrossRef]
  9. Cahill, D.G.; Ford, W.K.; Goodson, K.E.; Mahan, G.D.; Majumdar, A.; Maris, H.J.; Merlin, R.; Phillpot, S.R. Nanoscale thermal transport. J. Appl. Phys. 2003, 93, 793–818. [Google Scholar] [CrossRef] [Green Version]
  10. Lacroix, D.; Joulain, K.; Lemonnier, D. Monte Carlo transient phonon transport in silicon and germanium at nanoscales. Phys. Rev. B 2005, 72, 064305. [Google Scholar] [CrossRef] [Green Version]
  11. Sommet, R.; Chang, C.; Quere, R.; Dueme, P. Model order reduction of linear and nonlinear 3D thermal finite-element description of microwave devices for circuit analysis. Int. J. RF Microwawe Comput.-Aided Eng. 2005, 15, 398–411. [Google Scholar] [CrossRef]
  12. Jobert, N. Working Wonders with ADPL Math Illustrated: Thermal Modal Analysis. Available online: https://www.padtinc.com/blog/author/nicolas-jobert/ (accessed on 12 September 2017).
  13. Wilson, E.L.; Yuan, M.W. Dynamic analysis bydirect superposition of Ritz vectors. Earthq. Eng. Struct. Dyn. 1982, 10, 813–821. [Google Scholar] [CrossRef]
  14. Cahill, D.G.; Braun, P.V.; Chen, G.; Clarke, D.R.; Fan, S.; Goodson, K.E.; Keblinski, P.; King, W.P.; Mahan, G.D.; Majumdar, A.; et al. Nanoscale thermal transport. II. 2003–2012. Appl. Phys. Rev. 2014, 1, 011305. [Google Scholar] [CrossRef] [Green Version]
  15. Jakani, A.; Sommet, R.; Gaillard, F.; Nallatamby, J.-C. Comparison of GaN HEMTs Thermal Re-sults through Different Measurements Methodologies: Validation with 3D Simulation. In Proceedings of the International Workshop on Integrated Nonlinear Microwave and Millimetre-Wave Circuits, Berlin, Germany, 23 September 2021. [Google Scholar]
  16. Shakouri, A.; Ziabari, A.; Kendig, D.; Bahk, J.-H.; Xuan, Y.; Ye, P.D.; Yazawa, K.; Shakouri, A. Stable thermoreflectance thermal imaging microscopy with piezoelectric position control. In Proceedings of the 2016 32nd Thermal Measurement, Modeling & Management Symposium (SEMI-THERM), San Jose, CA, USA, 14–17 March 2016; pp. 128–132. [Google Scholar] [CrossRef]
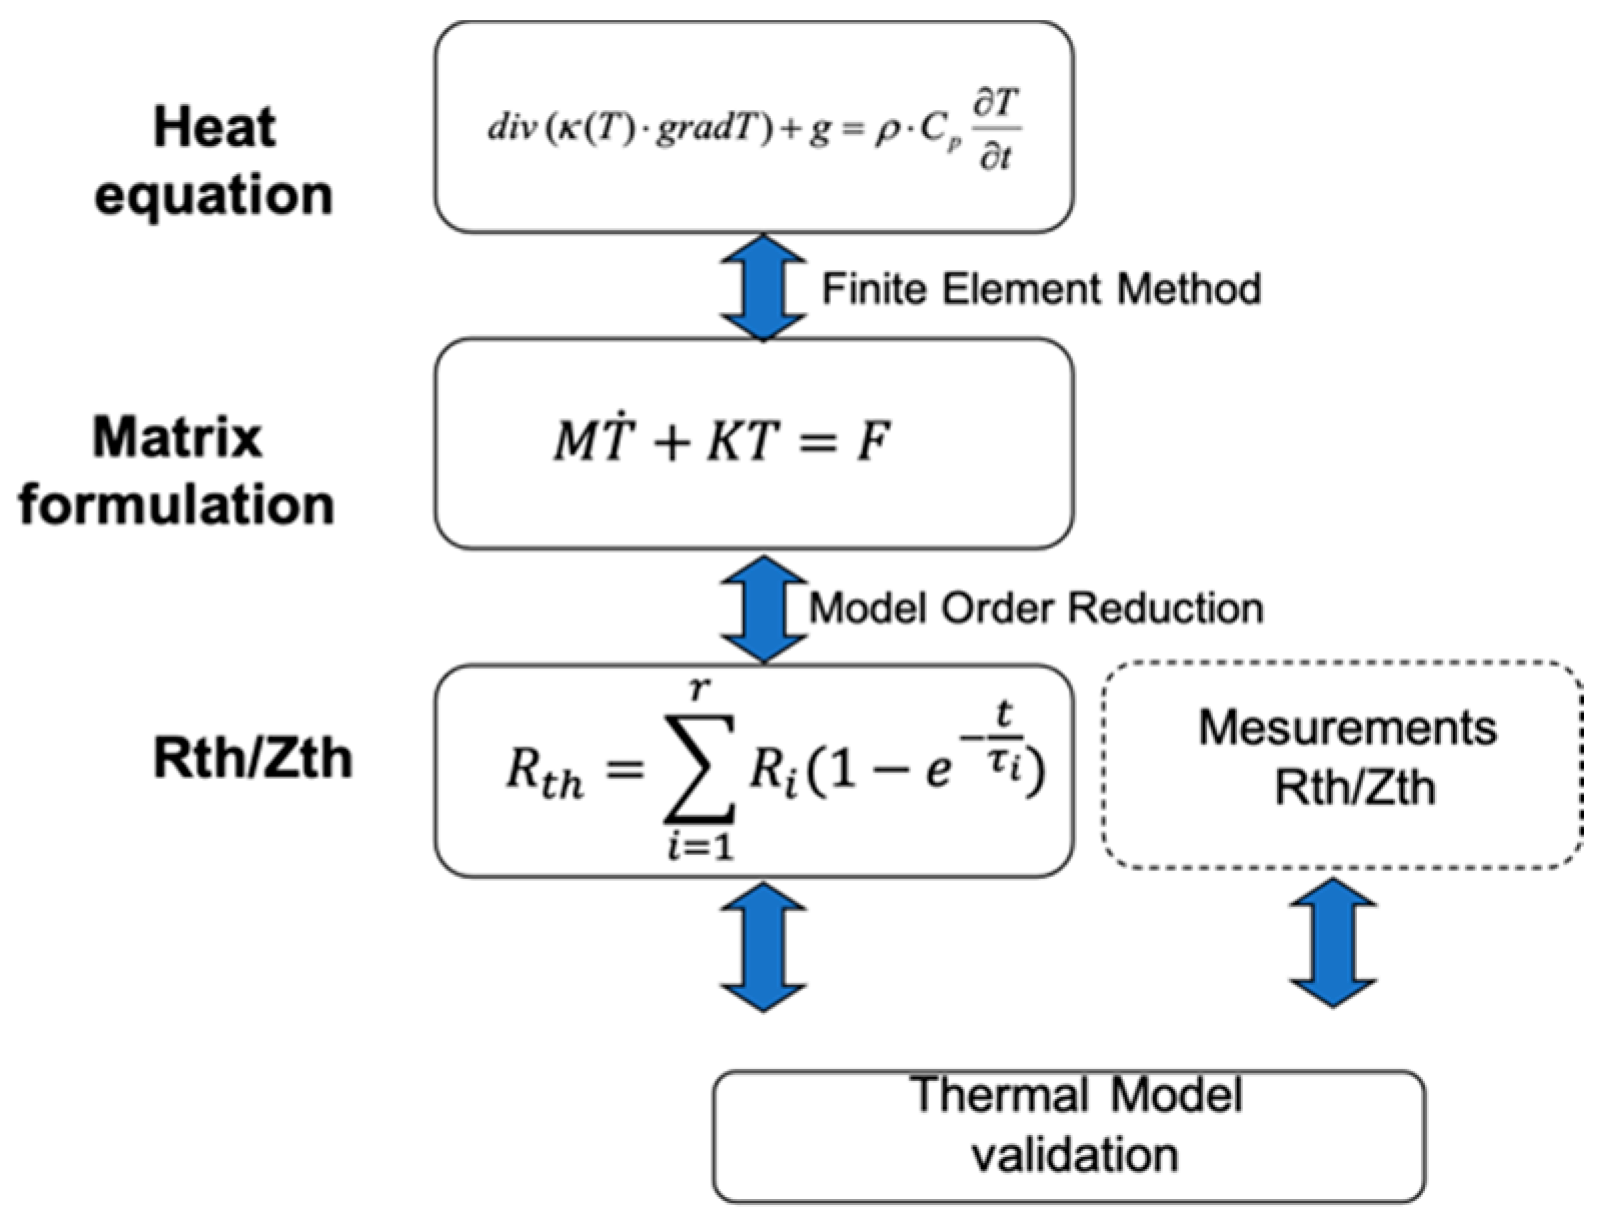
Figure 1. Extraction flow.
Electronics 10 03138 g001
Figure 2. 1-D single-layer structure.
Electronics 10 03138 g002
Figure 3. Normalized temperature response versus time (inset log (Temperature) vs. log (time)).
Electronics 10 03138 g003
Figure 4. Thermal time constant spectrum for a 1-D single layer structure using MOR in black and Equation (9) in red (analytical solution).
Electronics 10 03138 g004
Figure 5. Comparison between FEM results and MOR results.
Electronics 10 03138 g005
Figure 6. 1-D, two-layer structure.
Electronics 10 03138 g006
Figure 7. Comparison of transient normalized temperature simulation for one-layer and two-layer structures.
Electronics 10 03138 g007
Figure 8. Thermal time constant spectrum for one and two layers.
Electronics 10 03138 g008
Figure 9. 2-D single-layer structure.
Electronics 10 03138 g009
Figure 10. Normalized temperature response versus time (inset log (Temperature) vs. log (time)).
Electronics 10 03138 g010
Figure 11. Thermal time constant spectrum for 2-D structure using MOR in black and Bagnall equation in red.
Electronics 10 03138 g011
Figure 12. Thermal time constants versus gate length.
Electronics 10 03138 g012
Figure 13. Thermal resistance versus gate length.
Electronics 10 03138 g013
Figure 14. 2-D, two-layer structure.
Electronics 10 03138 g014
Figure 15. Normalized temperature response versus time (inset log (Temp) versus log (time)).
Electronics 10 03138 g015
Figure 16. Thermal time constant spectrum for 2-D lg = 0.1 µm structure: comparison between single layer and 2-layer structure.
Electronics 10 03138 g016
Figure 17. Thermoreflectance measurements of the device temperature.
Electronics 10 03138 g017
Figure 18. Finite Element Simulation.
Electronics 10 03138 g018
Table 1. SiC Thermal properties and layer width used in the simulation.
ρ (Kg.m−3)Cp (J. Kg−1. K−1)K (W.m−1. K−1)L (m)
321066539070 × 10−6
Table 2. Comparison between MOR results and the Bagnall Equation (9).
Thermal Time Constant (s)Order ReductionRef. [7]
τ11.087 × 10−51.087 × 10−5
τ21.208 × 10−61.208 × 10−6
τ34.358 × 10−74.348 × 10−7
τ42.228 × 10−72.218 × 10−7
τ51.352 × 10−71.342 × 10−7
Table 3. Thermal properties for the two-layer structure.
Exampleα1 (W.m2.J−1)α2L1 (µm)L2 (µm)
11.827 × 10−46.414 × 10−5702
21.827 × 10−46.414 × 10−5708
38.696 × 10−56.414 × 10−5702
Table 4. Thermal time constants extracted.
Thermal Time Constant (s)Order ReductionEquation (14)Equation (15)
Example 1
(GaN 2 µm/SiC)
τ 1 = 1.165 × 10 5 τ 1 = 1.168 × 10 5 τ 1 = 1.180 × 10 5
τ 2 = 1.296 × 10 6 τ 2 = 1.298 × 10 6 τ 2 = 1.311 × 10 6
τ 3 = 4.667 × 10 7 τ 3 = 4.674 × 10 7 τ 3 = 4.721 × 10 7
Example 2
(GaN 8 µm /SiC)
τ 1 = 1.420 × 10 5 τ 1 = 1.403 × 10 5 τ 1 = 1.460 × 10 5
τ 2 = 1.613 × 10 6 τ 2 = 1.560 × 10 6 τ 2 = 1.622 × 10 6
τ 3 = 6.039 × 10 7 τ 3 = 5.613 × 10 7 τ 3 = 5.839 × 10 7
Example 3
(GaN 2 µm/Si)
τ 1 = 2.519 × 10 5 τ 1 = 2.428 × 10 5 τ 1 = 2.480 × 10 5
τ 2 = 2.798 × 10 6 τ 2 = 2.698 × 10 7 τ 2 = 2.755 × 10 7
τ 3 = 1.006 × 10 6 τ 3 = 9.713 × 10 7 τ 3 = 9.918 × 10 7
Publisher’s Note: MDPI stays neutral with regard to jurisdictional claims in published maps and institutional affiliations.