Article

Cloud Server and Internet of Things Assisted System for Stress Monitoring

1
Department of Research and Development, Uttaranchal Institute of Technology, Uttaranchal University, Dehradun 248007, India
2
Department of Computer Engineering, Faculty of Science and Technology, Vishwakarma University, Pune 411048, India
3
Department of Electronics & Communication Engineering, University of Petroleum and Energy Studies, Dehradun 248001, India
4
Department of Information Technology, College of Computer and Information Technology, Taif University, P.O. Box 11099, Taif 21944, Saudi Arabia
5
Department of Computer Engineering, College of Computer and Information Technology, Taif University, P.O. Box 11099, Taif 21994, Saudi Arabia
*
Author to whom correspondence should be addressed.
Electronics 2021, 10(24), 3133; https://doi.org/10.3390/electronics10243133
Submission received: 10 November 2021 / Revised: 8 December 2021 / Accepted: 13 December 2021 / Published: 16 December 2021
(This article belongs to the Special Issue Electronic Devices on Intelligent IoT Applications)

Abstract

:
Currently, the Internet of Things (IoT) has gained attention for its capability for real-time monitoring. The advancement in sensor and wireless communication technology has led to the widespread adoption of IoT technology in distinct applications. The cloud server, in conjunction with the IoT, enables the visualization and analysis of real-time sensor data. The literature concludes that there is a lack of remote stress-monitoring devices available to assist doctors in observing the real-time stress status of patients in the hospital and in rehabilitation centers. To overcome this problem, we have proposed the use of the IoT and cloud-enabled stress devices to detect stress in a real-time environment. The IoT-enabled stress device establishes piconet communication with the master node to allow visualization of the sensory data on the cloud server. The threshold value (volt) for real-time stress detection by the stress device is identified by experimental analysis using MATLAB based on the results obtained from the performance of three different physical-stress generating tasks. In addition, the stress device is interfaced with the cloud server, and the sensor data are recorded on the cloud server. The sensor data logged into the cloud server can be utilized for future analysis.

1. Introduction

The Internet of Things (IoT) is considered one of the most significant communication advancements in recent years, and it also serves as the foundation for the creation of autonomous services and applications [1]. Currently, various IoT applications provide useful features that promote healthy lifestyles by monitoring and overseeing individual health conditions [2]. The IoT allows devices to capture and transfer crucial patient data, enabling real-time tracking of individual health [3]. Furthermore, the IoT allows for the effective monitoring of patients in their surroundings through the deployment of a customized remote monitoring system and a mobile-health solution [4]. When the IoT and cloud computing are combined, they create a significant platform for remotely monitoring patients and transmitting continuous health information to doctors and caregivers [5]. The advancement in cloud computing delivers parallel computing, resource sharing, scalable data storage, and secure communication. Using the real-time sensor data available on the cloud server, the analytics model can be implemented to identify patterns in the data and also to observe new insights [6]. Moreover, the doctor can utilize this data for a clinical investigation to develop a decision support system that could assist in early detection and diagnosis [7].
Currently, the individual IoT device can deliver personal assistance to a patient under stress. Stress is described by behavioral scientists as the perception of danger with resultant anxiety or discomfort [8], whereas neuroendocrinologists define it as any stimulus that stimulates the release of the adrenocorticotropic hormone and glucocorticoids [9]. According to an American Institute of Stress report, around 33% of individuals face extreme stress and 77% of the population reports that this stress is affecting their physical health [10]. According to the World Health Organization’s [11] Global Burden of Disease Survey, ‘By the year 2020, depression and anxiety disorders, including stress-related mental health conditions, will be highly prevalent, second only to ischemic heart disease in terms of the scope of disabilities experienced by sufferers.’ The measurement of stress is carried out with both a traditional approach and a modern approach. In the traditional approach, clinical tests and biomarkers are widely used methods of measuring stress [12]. Trier Social Stress Test (TSST), Perceived Stress Scale, and Kessler Psychological Distress Scale (K10) are the widely adopted clinical tests used to quantify stress levels [13,14,15,16]. Biomarkers provide quantitative indicators of biological processes, allowing medical experts to study abnormalities occurring within the body without performing surgery [17]. Non-invasive sampling of biofluids such as saliva and sweat allows for continuous and real-time analyte monitoring [18].
In the modern approach, many devices that assess real-time stress rely on photoplethysmography data. Other devices combine photoplethysmography data with other physiological signals such as heart rate variability, ECG data, and respiration signals [19,20]. These signals, however, are not the primary cause of a stress reaction; rather, they represent the physiological outcome of the production of stress biomarkers in the body [21]. As a result, biomarker sensing may provide a more accurate method of stress sensing and will be the primary focus of this manuscript. Moreover, recent studies conclude that skin temperature can accurately identify the exact stress of the patient using galvanic skin reaction (GSR), where the GSR electrodes are used to sense skin temperature using a patient’s sweat [22]. If the GSR sensor data recorded show the maximal peak, then the patient is considered to be highly stressed. If the GSR sensor data recorded show the minimal peak, then the patient is considered to be in a relaxed state. It is concluded that the clinical tests and biomarkers, such as ECG and respiratory signals, provide less-accurate data than the GSR sensor. As the socio-economic need for chronic stress management continues to increase, it is necessary to adopt a problem-preventative approach by introducing a real-time monitoring system [23].
According to previous studies, it is concluded that there is a lack of real-time monitoring devices in hospitals and rehabilitation centers for the remote stress monitoring of patients. The real-time monitoring of patients using the IoT and the cloud server assists the doctor in analyzing the stress patterns of patients and prescribing appropriate medication [24]. With this motivation, this study aims to develop an IoT and a cloud-server-enabled stress device capable of providing the doctor with the real-time stress level of patients using Bluetooth and Wi-Fi technology. In order to implement this system in real-time, the threshold value is identified through experimental study. The contribution of the study is as follows:
  • An IoT-enabled stress device is proposed and developed to monitor stress using the galvanic skin response (GSR).
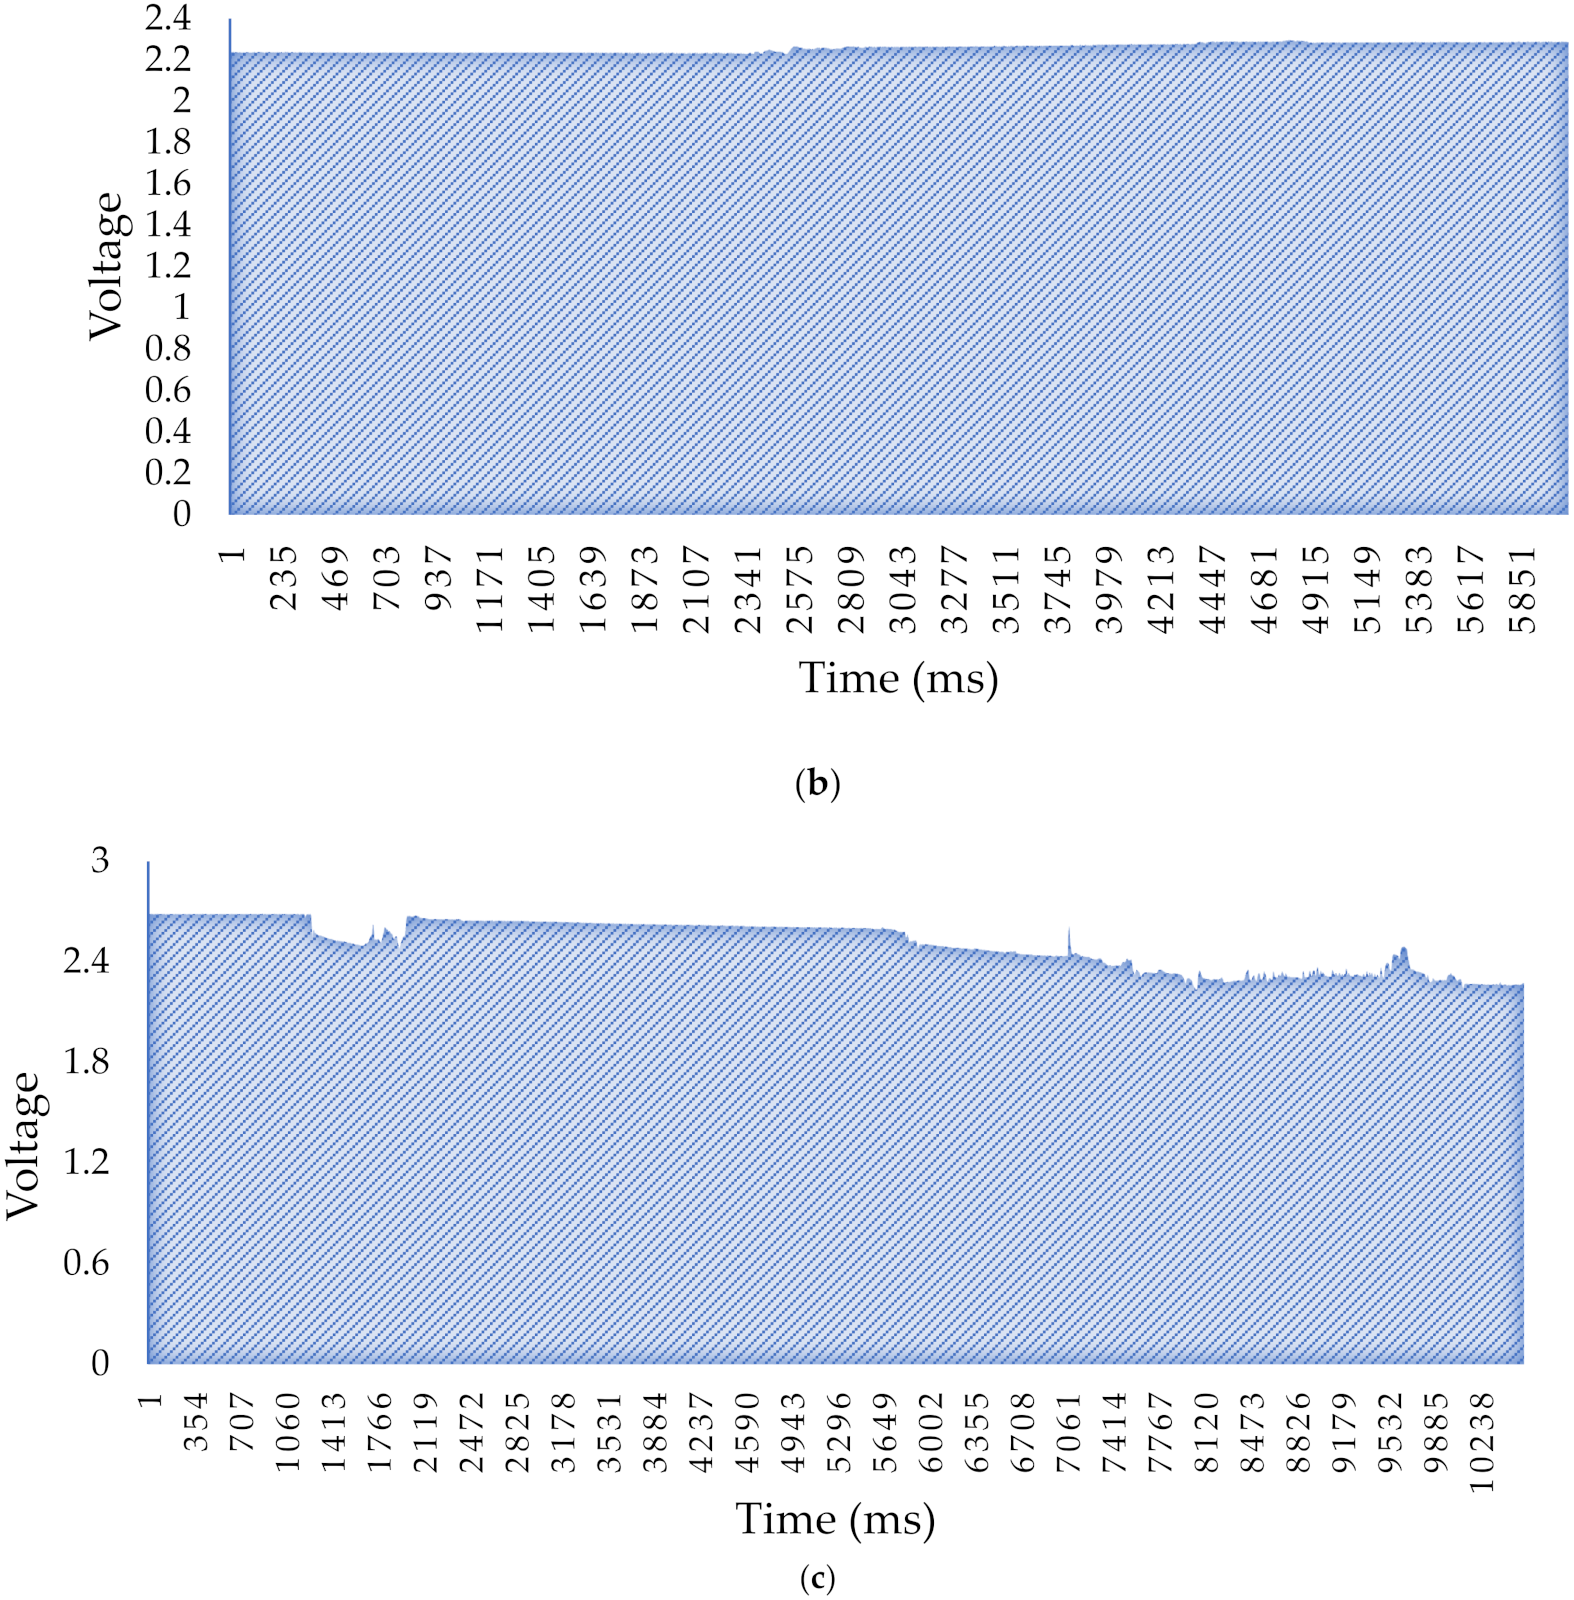
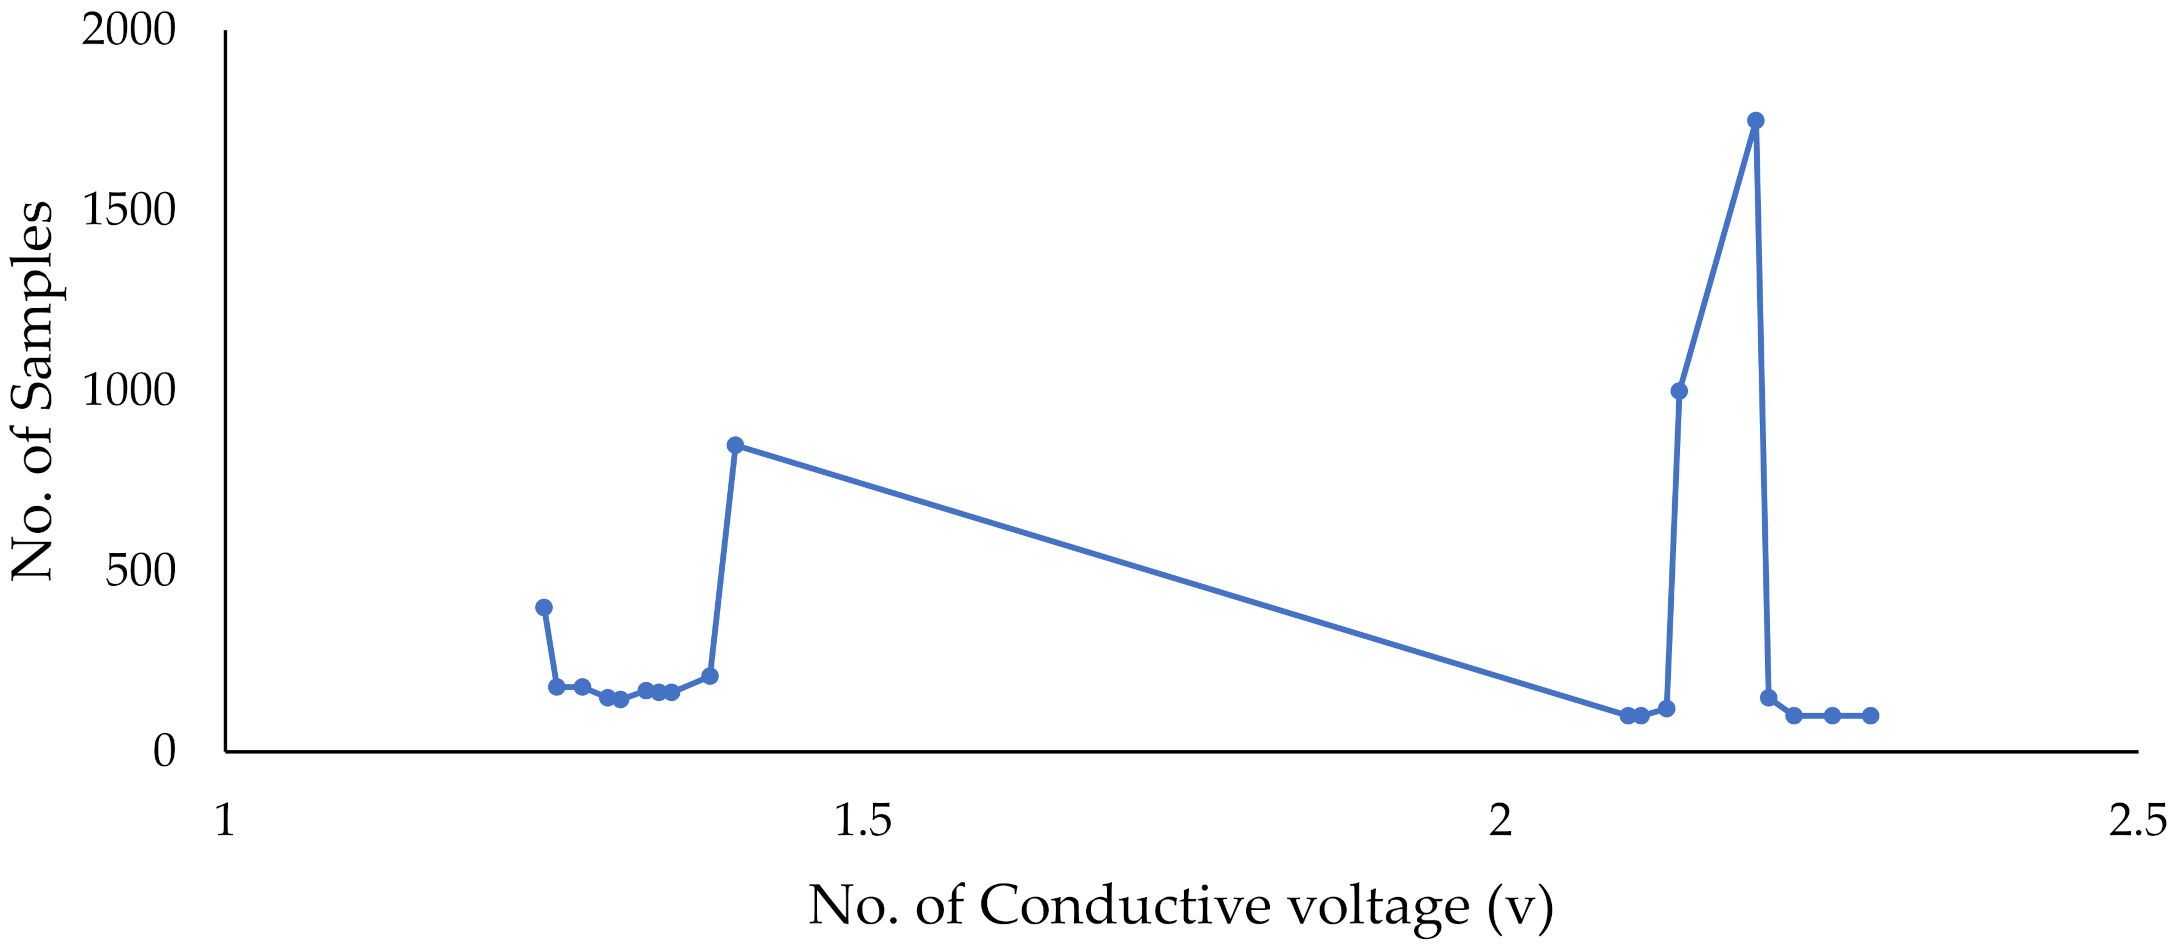
  • The threshold value is identified through the analysis of conductive voltage using MATLAB.
  • The cloud server is interfaced with a stress-monitoring device to log the real-time data.
The organization of the study is as follows: Section 1 covers the introduction; Section 2 covers the literature review; Section 3 covers the proposed architecture; Section 4 covers the methodology; Section 5 covers the experimental setup and results; Section 6 covers the novelty of the study, and Section 7 covers the conclusion.

2. Literature Review

A system using GSR and Zigbee has been proposed to measure stress, and algorithms that are built into the system to identify different stress levels [25]. An eye tracker to monitor pupil diameter (PD) is provided to record an individual’s eye data and changes in PD to accurately note the response to temperature and ambient light levels in all subjects for the duration of the experiment [26]. A device is proposed to extract new features of local maxima and minima (LMM) from HRV and GSR, along with the use of voting and similarity-based fusion methods (VSBF) [27]. A technique is implemented using two different stress-detection methods to evaluate the stress based on signal amplitude, and this technique records the periods of relaxation and stress [28]. The automated stress-detection system is established in real-time using physiological signals acquired from portable devices. The system extracts the crucial information from the physiological data using modality-specific artifact removal and feature extraction [29]. A cognitive stress-level detection system (Detect Stress) is intended for assessing an individual’s stress levels using data from a smartphone and a wireless physical activity tracker [30]. An electroencephalography (EEG) sensor is used in this study to identify student stress, and the EEG signal is pre-processed with the Hilbert-Huang Transform (HHT) method to remove artifacts [31]. A smart wristband is constructed and developed to identify stress in older individuals by evaluating blood volume pulse (BVP), electrodermal activity (EDA), interbeat intervals (IBI), and photoplethysmogram (PPG) signals acquired from the bracelet [32]. A detection model is implemented with cortisol as a stress biomarker, and the model utilizes GSR and PPG sensors for validating the stress level [33].
A continuous, intelligent human stress monitoring system responsible for monitoring user/patient stress levels is implemented through a wireless, body-area network of intelligent sensors [34]. A study has identified the stress levels accurately in a non-invasive manner by assessing the contextual and behavioral data collected through current stress level self-assessment, audio, and gyroscope characteristics [35]. A study is carried out to uncover physiological or behavioral stress indicators for identifying statistically significant stress-related characteristics based on data obtained from wrist sensors, smartphones, and questionnaires [36]. In this study, everyday stress is consistently identified using human behavior indicators collected from mobile phone activities (call log, SMS log, and Bluetooth interactions) and an original approach for feature extraction, selection, and model training based on Random Forest and Gradient Boosted Machine algorithms is carried out [37].
Table 1 presents the comparative analysis to address the advancement of the proposed study compared to previous studies for stress detection. In the previous studies, the primary focus was on implementing the device for stress monitoring. Limited studies have identified a threshold to define the stress level by using the wireless hardware-enabled device. The proposed studies implement IoT-enabled stress detection using Bluetooth and Wi-Fi. A customized hardware implementation is carried out for identifying the threshold value. In the process of identifying the threshold value, experiments are carried out on different users using three activities. Three stress-state thresholds are identified through MATLAB analysis. Moreover, the proposed system logs the sensor data over the cloud server using Wi-Fi.

3. Proposed Architecture

Nowadays, it is challenging to identify the stress of an individual through facial expressions alone, as facial expressions often deliver incorrect signals related to stress identification. Technological advancement in the development of sensors and communication devices has empowered the implementation of the IoT and cloud-enabled individual stress detection through Bluetooth and Wi-Fi communication. The architecture proposed in Figure 1 determines the implementation of the IoT and cloud-enabled stress detection systems. The proposed architecture is feasible for stress detection in a contained indoor environment. The architecture comprises three different layers, namely the detection layer, master node layer, and analysis layer. The detection layer is comprised of a stress-detection device that is built using the galvanic sense response (GSR) and Bluetooth communication. The GSR sensor measures the electrical conductivity of the skin. The conductive voltage obtained through the GSR is sent to the computing unit. The computing unit converts the analog signal to a digital signal, and then further data are sent to the master node layer through piconet. The master node layer in the architecture establishes the personal area network (PAN) through piconet communication using multiple detection layers. A piconet is a small Bluetooth network that uses ultra-high frequency (UHF) radio waves to connect multiple devices wirelessly across a 10 m radius (PAN).
The piconet is formed with a maximum of eight stations where one is the master node, and the remaining seven are the slave nodes. The communication between the master node and slave nodes involves one-to-one and one-to-many but not direct communication between the slaves. In the architecture, the master is present in the master node layer, and the slaves are located in the detection layer ‘1’. The stress-related data received in the master node layer are communicated to the cloud server over Wi-Fi, where the stress is then identified through analysis. The Wi-Fi enables the master node layer to connect to the internet for logging the sensor data on the cloud server. Moreover, a MATLAB experiment is carried out on 15 individuals on successive days to identify the threshold value for stress detection. The obtained threshold value is preset in the cloud server, and during the stress detection of the subject, the sensor value will be sent to the cloud server for use in identifying the stress state.

4. Methodology

The technique used to implement the GSR sensor-based system is discussed in this section. The flow of the process is explained by the system approach depicted in Figure 2. Positioning of GSR electrodes, measurement of the electrical conductivity of the skin, acquisition using LabVIEW, data processing, and threshold value identification are the stages that are included in the proposed technique. The GSR electrodes connected to the fingers are used to obtain the electrical conductivity voltage, and the controller attached to the stress device converts the data into digital output. The conductive voltage stress is shown on the display unit based on the values used to set the threshold and is linked to the threshold detected by the installation.
Data acquired using LabVIEW is capable of interfacing with a hardware component to acquire and visualize data on the GUI interface. The following functions are available on the front panel: connection type, analog input pin (0), baud rate, VISA resource, board type, stop, electrical conductivity waveform, and table. In threshold value identification, MATLAB analysis is applied. The phenomenon detector, along with the external nursing detector, is utilized to obtain ground truth data during activities carried out by the participants. This component offers activity baseline readings (i.e., skin behavior) for each session. In this case, the computation is used to distinguish between common baseline measurements during each activity segment. Thus, in each meeting, the average readings of the phenomena detector during the specified activities are computed, allowing fluctuations of stress levels to be visualized.

5. Experimental Setup and Implementation

In this section, we present the real-time implementation of a stress-monitoring device for sensing stress using a GSR sensor and the LabVIEW GUI. The data obtained using the data acquisition system, i.e., LabVIEW, is utilized for specifying the threshold values to determine the level of stress. In this study, the physical stress is created by allotting each of 10 participants three distinct activities, namely reading for speed, focusing on the timer clock, and watching a video. The average of these tasks is calculated, and the maximum and minimum values are thrown out. Further, the threshold limit value is specified by the histogram detection methodology for the number of subjects and the number of dimensions using MATLAB.

5.1. Evaluation of Stress Device

A stress-monitoring device is used to monitor the stress level of each subject. The final prototype of the device is illustrated in Figure 3. The real-time data is obtained by connecting the subject to the microcontroller by attaching the electrodes to two fingers. The microcontroller then compares the obtained value to the value set as a threshold. The threshold value is set by conducting a comparative study of 15–20 participants. Thus, based on the threshold value, the microcontroller displays stressed, relaxed, or moderate conditions. The conductive voltage generated is displayed on the LCD. The Bluetooth device that is interfaced with the microcontroller receives the data and transmits it to the receiver side using the Android BlueTerm App.
The device is attached to the 10 participants for evaluating the performance of the system. As discussed earlier in this section, the three distinct tasks are allotted to 10 participants to initiate physical stress. The average of these tasks is calculated, and the maximum and minimum values are thrown out. The average value is illustrated in Table 2. The level of accuracy can be increased by increasing either the number of inputs or the number of participants. In this study, the number of participants is increased. The results of three participants participating in three different tasks (such as reading analysis) are shown in Table 2.
The analyses of three different tasks performed by user ‘1’ are presented in Figure 4a–c. The conductive voltage of user ‘1’ is recorded at different time intervals. The conductive voltage is represented on the y-axis, and the time (milliseconds) is represented on the x-axis. The variation in the conductive voltage determines the amount of stress. In the same manner, the analyses of three tasks performed by user ‘2’ are presented in Figure 5a–c.

5.2. Identification of Threshold Value

To identify the threshold level for stress identification, the following procedure is followed: The threshold level is calculated by multiplying the number of samples on the x-axis by the number of conductive voltages on the y-axis (in volts); the level of accuracy of the values in the graph depends on the graph’s expansions; the line graph shown in the figure represents the average values of the samples between two participants. Every individual was given one minute to complete three activities. The average of these tasks was computed to remove the greatest and lowest values. The threshold-level assessment is carried out between two persons using diverse cases. In the analysis of the first participant, the maximum electrical conductivity voltage is recorded as 1.2 v, and the minimum electrical conductivity voltage is recorded as 0.9 v (Figure 6). The lowest taping voltage of the second participant is <0.9 v, and the highest taping voltage of the second participant is 2.8 v. Figure 7 shows that the maximum electrical conductivity voltage of the second participant is recorded as 2.4 v and the lowest electrical conductivity voltage is 2.1 v.
The maximum electrical conductivity voltage of the first participant is recorded as 1.6 v, and the minimum electrical conductivity voltage is recorded as 1.5 v (Figure 8). The minimum and maximum electrical conductivity voltage of the second participant in the figure is recorded as 1.2 v and 1.25 v. The maximum electrical conductivity voltage of the first participant is recorded as 1.7 v, and the minimum electrical conductivity voltage is recorded as 1.5 v (Figure 9) The minimum and maximum electrical conductivity voltage of the second participant is the figure recorded as 1.7 v and <1.3 v.
Based on the four cases, it is identified that the electrically conductive voltage of the first participant peaks at 1.8 v, while the electrical conductive voltage is minimal by 1.7 v. It has been concluded that the maximum conductive voltage (GSR sensor value) is 1.75 v, and the minimal conductive voltage is 1.44 v. The conductive voltage levels of each participant are classified as being at a moderate state at less than 1.75 v, at a normal state between 1.44 v and 1.75 v, and at a stressed state at greater than 1.44 v.

5.3. Data Visualization in Cloud Server

In the previous section, a stress-detection device is used to identify the threshold parameter detected in the three different states of stress. As discussed in section ‘3’, the stress detection device is able to transmit the sensor data to the cloud server for visualization and analysis. To connect to the cloud server, the application programming interface key is logged in to the hardware of the master node. An API key is a simple encrypted string that identifies an application but does not contain any principal information. An API key enables anonymous access to public data and is also used to associate API requests. The device is connected to the three different users who perform three distinct activities; reading for speed, focusing on the time clock, and watching the video. Figure 10 presents the data visualization analysis of three users at different time instances. Activity ‘1’ is related to reading for speed, activity ‘2’ is related to focusing on the time clock, and activity ‘3’ is related to watching the video.

6. Novelty of Study

In this section, we have provided the novelty of the present study compared to similar previous studies. The novelty of the study is as follows:
The proposed stress device transmits the sensor data related to the stress condition of an individual on the cloud server through a Wi-Fi-enabled master node. The proof of the concept of a stress device is also realized in this study.
An experimental analysis of the stress device is implemented on 10 participants to identify the threshold by assigning three different tasks. The identified threshold value is logged in the stress device to identify a subject’s real-time stress status.
The cloud server records the real-time sensor data of the individual using Bluetooth and internet connectivity. The real-time sensor data available in the cloud server empowers the doctors to precisely read the stress pattern of the individual.

7. Conclusions

A World Health Organization survey estimates that stress is currently the second-most serious health risk (following heart disease) suffered by individuals all over the world. The survey suggests implementing a solution of continuous monitoring to help patients overcome the problem of stress. The literature concludes that there is a lack of remote stress-monitoring devices available to assist doctors in observing the real-time stress status of patients in the hospital and in rehabilitation centers. In this study, we implemented an IoT-enabled stress device based on Bluetooth and internet connectivity that allows doctors to monitor real-time human stress in hospitals and rehabilitation centers. The threshold value (volt) for real-time stress detection using the stress device is identified by experimental analysis using MATLAB by assigning three different physical-stress generating tasks. From the analysis, it is concluded that the maximum conductive voltage (GSR sensor value) is 1.75 v, and the minimal conductive voltage is 1.44 v. Therefore, the threshold values concluded from our analysis are as follows: conductive voltage greater than 1.44 v is considered as a stress state; conductive voltage less than 1.75 v is considered as a moderate state, and a conductive voltage range between 1.44 v and 1.75 v is considered as a normal state. This threshold value is logged into the stress device to achieve real-time stress detection. In addition, the conductive voltages of the three different tasks are logged over the cloud server using internet connectivity.

Author Contributions

R.S. (Rajesh Singh), A.G., and S.V.A. made contributions to conception and manuscript writing; S.S.A. and A.S.A. examined and supervised research and outcomes; M.R. and R.S. (Ritika Saxena). revised and polished the manuscript. All authors have read and agreed to the published version of the manuscript.

Funding

This research was supported by Taif University, Research Supporting Project Number (TURSP-2020/215), Taif University, Taif, Saudi Arabia.

Data Availability Statement

The data will be shared on request to the first author of the paper.

Conflicts of Interest

The authors declare no conflict of interest.

References

  1. Ala, I.; Al-Fuqaha, M.G.; Mehdi, M.; Mohammed, A.; Moussa, A. Internet of Things: A Survey on Enabling Technologies, Protocols, and Applications. IEEE Commun. Surv. Tutor. 2015, 17, 2347–2376. [Google Scholar]
  2. Islam, M.M.; Rahaman, A.; Islam, M.R. Development of smart healthcare monitoring system in IoT environment. SN Comput. Sci. 2020, 1, 1–11. [Google Scholar] [CrossRef] [PubMed]
  3. Wu, F.; Taiyang, W.; Mehmet, R.Y. An internet-of-things (IoT) network system for connected safety and health monitoring applications. Sensors 2019, 19, 21. [Google Scholar] [CrossRef] [PubMed] [Green Version]
  4. Yew, H.T.; Ming, F.N.; Soh, Z.P.; Seng, K.C.; Ali, C.; Jamal, A.D. Iot based real-time remote patient monitoring system. In Proceedings of the 2020 16th IEEE International Colloquium on Signal Processing & Its Applications (CSPA), HIG Hotel, Langkawi Island, Malaysia, 28–29 February 2020; IEEE: Piscatway, NJ, USA, 2020; pp. 176–179. [Google Scholar]
  5. Sahu, M.L.; Mithilesh, A.; Mitul, K.A.; Afsar, A. IoT-enabled cloud-based real-time remote ECG monitoring system. J. Med. Eng. Technol. 2021, 45, 473–485. [Google Scholar] [CrossRef] [PubMed]
  6. Adi, E.; Adnan, A.; Zubair, B.; Sherali, Z. Machine learning and data analytics for the IoT. Neural Comput. Appl. 2020, 32, 16205–16233. [Google Scholar] [CrossRef]
  7. Satija, U.; Barathram, R.M.; Sabarimalai, M. Real-time signal quality-aware ECG telemetry system for IoT-based health care monitoring. IEEE Internet Things J. 2017, 3, 815–823. [Google Scholar] [CrossRef]
  8. Fink, G. Stress: Concepts, definition and history. In Reference Module in Neuroscience and Biobehavioral Psychology; Stein, J.P., Ed.; Elsevier: Amsterdam, The Netherlands, 2016. [Google Scholar]
  9. Miller, D.B.; O’Callaghan, J.P. Neuroendocrine aspects of the response to stress. Metab. Clin. Exp. 2002, 51, 5–10. [Google Scholar] [CrossRef]
  10. Stress Facts, Statistics and Trends. The Recovery Village. Available online: https://www.therecoveryvillage.com/mental-health/stress/related/stress-statistics/ (accessed on 6 December 2021).
  11. Oken, B.S.; Irina, C.; Wayne, W. A systems approach to stress, stressors and resilience in humans. Behav. Brain Res. 2015, 282, 144–154. [Google Scholar] [CrossRef]
  12. Mental Health. Available online: https://www.who.int/health-topics/mental-health#tab=tab_1 (accessed on 6 December 2021).
  13. Allen, A.P.; Kennedy, P.J.; Cryan, J.F.; Dinan, T.G.; Clarke, G. Biological and psychological markers of stress in humans: Focus on the Trier Social Stress Test. Neurosci. Biobehav. Rev. 2014, 38, 94–124. [Google Scholar] [CrossRef]
  14. Kessler, R.C.; Gavin, A.; Lisa, J.C.; Eva, H.; Daniel, K.M.; Normand, S.-L.T.; Ellen, E.W.; Alan, M.Z. Short screening scales to monitor population prevalences and trends in non-specific psychological distress. Psychol. Med. 2002, 32, 959–976. [Google Scholar] [CrossRef]
  15. Labuschagne, I.; Caitlin, G.; Peter, R.; Gill, T.; Markus, H. An introductory guide to conducting the Trier Social Stress Test. Neurosci. Biobehav. Rev. 2019, 107, 686–695. [Google Scholar] [CrossRef]
  16. Nielsen, M.G.; Ørnbøl, E.; Vestergaard, M.; Bech, P.; Larsen, F.B.; Lasgaard, M.; Christensen, K.S. The construct validity of the Perceived Stress Scale. J. Psychosom. Res. 2016, 84, 22–30. [Google Scholar] [CrossRef]
  17. Strimbu, K.; Jorge, A.T. What are biomarkers? Curr. Opin. HIV AIDS 2010, 5, 463. [Google Scholar] [CrossRef]
  18. Katchman, B.A.; Meilin, Z.; Jennifer, B.C.; Karen, S.A. Eccrine sweat as a biofluid for profiling immune biomarkers. Proteom.–Clin. Appl. 2018, 12, 1800010. [Google Scholar] [CrossRef] [Green Version]
  19. Park, J.; Jongsu, K.; Sung-Phil, K. Prediction of daily mental stress levels using a wearable photoplethysmography sensor. In Proceedings of the TENCON 2018–2018 IEEE Region 10 Conference, Jeju, Korea, 28–31 October 2018; IEEE: Piscatway, NJ, USA, 2018; pp. 1899–1902. [Google Scholar]
  20. Shanmugasundaram, G.; Yazhini, S.; Hemapratha, E.; Nithya, S. A comprehensive review on stress detection techniques. In Proceedings of the 2019 IEEE International Conference on System, Computation, Automation and Networking (ICSCAN), Pondicherry, India, 29–30 March 2019; IEEE: Piscatway, NJ, USA, 2019; pp. 1–6. [Google Scholar]
  21. Mohan, P.; Madhan, V.N.; Sounak, R.D. Stress measurement from wearable photoplethysmographic sensor using heart rate variability data. In Proceedings of the 2016 International Conference on Communication and Signal. Processing (ICCSP), Melmaruvathur, Tamilnadu, India, 6–8 April 2016; IEEE: Piscatway, NJ, USA, 2016; pp. 1141–1144. [Google Scholar]
  22. Can, Y.S.; Chalabianloo, N.; Ekiz, D.; Ersoy, C. Continuous stress detection using wearable sensors in real life: Algorithmic programming contest case study. Sensors 2019, 19, 1849. [Google Scholar] [CrossRef] [Green Version]
  23. Minguillon, J.; Eduardo, P.; Miguel, A.L.-G.; Francisco, P.; Maria, J.S.-C. Portable System for Real-Time Detection of Stress Level. Sensors 2018, 18, 2504. [Google Scholar] [CrossRef] [Green Version]
  24. Mamdiwar, S.D.; R, A.; Shakruwala, Z.; Chadha, U.; Srinivasan, K.; Chang, C.-Y. Recent Advances on IoT-Assisted Wearable Sensor Systems for Healthcare Monitoring. Biosensors 2021, 11, 372. [Google Scholar] [CrossRef]
  25. Vanitha, V.; Krishnan, P. Real time stress detection system based on EEG signals. Biomed. Res. 2016, 271–275. [Google Scholar]
  26. Hirt, C.; Eckard, M.; Kunz, A. Stress generation and non-intrusive measurement in virtual environments using eye tracking. J. Ambient Intell. Humaniz. Comput. 2020, 11, 5977–5989. [Google Scholar] [CrossRef] [Green Version]
  27. Khowaja, S.A.; Prabono, A.G.; Setiawan, F.; Yahya, B.N.; Lee, S.-L. Toward soft real-time stress detection using wrist-worn devices for human workspaces. Soft Comput. 2021, 25, 2793–2820. [Google Scholar] [CrossRef]
  28. Nath, R.K.; Thapliyal, H.; Caban-Holt, A. Validating physiological stress detection model using cortisol as stress bio marker. In Proceedings of the 2020 IEEE International Conference on Consumer Electronics (ICCE), Taoyuan, Taiwan, 28–30 September 2020; IEEE: Piscatway, NJ, USA, 2020; pp. 1–5. [Google Scholar]
  29. Sun, F.-T.; Kuo, C.; Cheng, H.-T.; Buthpitiya, S.; Collins, P.; Griss, M. Activity-aware mental stress detection using physiological sensors. In Proceedings of the International Conference on Mobile Computing, Applications, Services, Santa Clara, CA, USA, 25–28 October 2010; Springer: Berlin/Heidelberg, Germany, 2010; pp. 282–301. [Google Scholar]
  30. Sengupta, J.; Baviskar, N.; Shukla, S. Biosignal acquisition system for stress monitoring. In Proceedings of the International Conference on Advances in Information Technology and Mobile Communication, Bangalore, India, 1–2 August 2012; Springer: Berlin/Heidelberg, Germany, 2012; pp. 451–458. [Google Scholar]
  31. Nath, R.K.; Thapliyal, H. Smart wristband-based stress detection framework for older adults with cortisol as stress biomarker. IEEE Trans. Consum. Electron. 2021, 67, 30–39. [Google Scholar] [CrossRef]
  32. Krupinski, E.; Reiner, B.I. Real-time occupational stress and fatigue measurement in medical imaging practice. J. Digit. Imaging 2012, 25, 319–324. [Google Scholar] [CrossRef] [PubMed] [Green Version]
  33. Seoane, F.; Mohino-Herranz, I.; Ferreira, J.; Alvarez, L.; Buendia, R.; Ayllón, D.; Llerena, C.; Gil-Pita, R. Wearable biomedical measurement systems for assessment of mental stress of combatants in real time. Sensors 2014, 14, 7120–7141. [Google Scholar] [CrossRef] [PubMed] [Green Version]
  34. Khan, M.; Rizvi, Z.; Shaikh, M.Z.; Kazmi, W.; Shaikh, A. Design and implementation of intelligent human stress monitoring system. Int. J. Innov. Sci. Res. 2014, 10, 179–190. [Google Scholar]
  35. Sysoev, M.; Kos, A.; Pogačnik, M. Noninvasive stress recognition considering the current activity. Pers. Ubiquitous Comput. 2015, 19, 1045–1052. [Google Scholar] [CrossRef] [Green Version]
  36. Sano, A.; Picard, R.W. Stress recognition using wearable sensors and mobile phones. In Proceedings of the2013 Humaine Association Conference on Affective Computing and Intelligent Interaction (ACII), Geneva, Switzerland, 2–5 September 2013; IEEE: Piscatway, NJ, USA, 2013; pp. 671–676. [Google Scholar]
  37. Bogomolov, A.; Lepri, B.; Ferron, M.; Pianesi, F.; Pentland, A.S. Pervasive stress recognition for sustainable living. In Proceedings of the 2014 IEEE International Conference on Pervasive Computing and Communications Workshops (PERCOM Workshops), Budapest, Hungary, 24–28 March 2014; IEEE: Piscatway, NJ, USA, 2014; pp. 345–350. [Google Scholar]
  38. Navea, R.F.; Buenvenida, P.J.; Cruz, C.D. Stress Detection using Galvanic Skin Response: An Android Application. J. Phys. Conf. Ser. 2019, 1372, 012001. [Google Scholar] [CrossRef]
  39. Aqajari, S.A.H.; Naeini, E.K.; Mehrabadi, M.A.; Labbaf, S.; Rahmani, A.M.; Dutt, N. GSR Analysis for Stress: Development and Validation of an Open Source Tool for Noisy Naturalistic GSR Data. arXiv 2020, arXiv:2005.01834. [Google Scholar]
  40. Durán-Acevedo, C.M.; Carrillo-Gómez, J.K.; Albarracín-Rojas, C.A. Electronic devices for stress detection in academic contexts during confinement because of the COVID-19 pandemic. Electronics 2021, 10, 301. [Google Scholar] [CrossRef]
  41. Raj, J.V.; Sarath, T.V. An IoT based Real-Time Stress Detection System for Fire-Fighters. In Proceedings of the 2019 International Conference on Intelligent Computing and Control Systems (ICCS), Secunderabad, India, 27–28 June 2019; IEEE: Piscatway, NJ, USA, 2019; pp. 354–360. [Google Scholar]
Figure 1. IoT-Enabled Stress Detector using GSR.
Electronics 10 03133 g001
Figure 2. System methodology.
Electronics 10 03133 g002
Figure 3. Stress detector system used in our study.
Electronics 10 03133 g003
Figure 4. (a) Video analysis of User ‘1’. (b) Timer clock analysis of User ‘1’; (c) Reading analysis of User ‘1’.
Electronics 10 03133 g004aElectronics 10 03133 g004b
Figure 5. (a) Timer clock analysis of User ‘2’; (b) Video analysis of User ‘2’; (c) Reading analysis of User ‘2’.
Electronics 10 03133 g005aElectronics 10 03133 g005b
Figure 6. Graph of the first case with two participants.
Electronics 10 03133 g006
Figure 7. Graph of the second case with two participants.
Electronics 10 03133 g007
Figure 8. Graph of the third case with two participants.
Electronics 10 03133 g008
Figure 9. Graph of the fourth case with two participants.
Electronics 10 03133 g009
Figure 10. Data visualization in the cloud server.
Electronics 10 03133 g010
Table 1. Comparison with previous studies.
RefFunctionData Acquisition SystemThreshold Value
Identification
Data
Visualization
[38]Monitoring GSR using a mobile applicationAndroid
Application
The hardware only implemented for collecting for GSRAndroid-based mobile application
[39]Extraction of GSR features for stress detection using deep learningOpen-source tool in Python that collects noisy naturalistic GSR dataThis study is focused on several peaks, max peak amplitudeNot Available
[40]Implemented Electronic Nose (E-nose) for stress detection through emotional sweatA graphic interface is designedOnly measuring different signals for stress detectionA graphic interface is designed
[41]Wireless sensor node prototype implanted on the gloves of firemen for real-time stress detectionSensor node placed on the gloves acquire the dataThresholdAdafruit IO
Table 2. Stress analysis of three distinct tasks.
Task
(60 Seconds)
User ‘1’ (v)User ‘2’
(v)
User ‘3’
(v)
User ‘4’
(v)
User ‘5’
(v)
User ‘6’
(v)
User ‘7’
(v)
User ‘8’
(v)
User ‘9’
(v)
User ‘10’
(v)
Time clock analysis0.45182.79541.40932.34541.61331.51321.28451.45121.61920.9894
Video analysis1.35052.25970.86852.15631.64931.45571.26971.24871.83750.8924
Reading analysis0.37362.69521.41642.16721.73861.72321.14681.63291.76481.2319
Publisher’s Note: MDPI stays neutral with regard to jurisdictional claims in published maps and institutional affiliations.

