
A Survey to Reduce STDs Infection in Mongolia and Big Data Virtualization Propagation


Abstract
1. Introduction
2. Materials and Methods
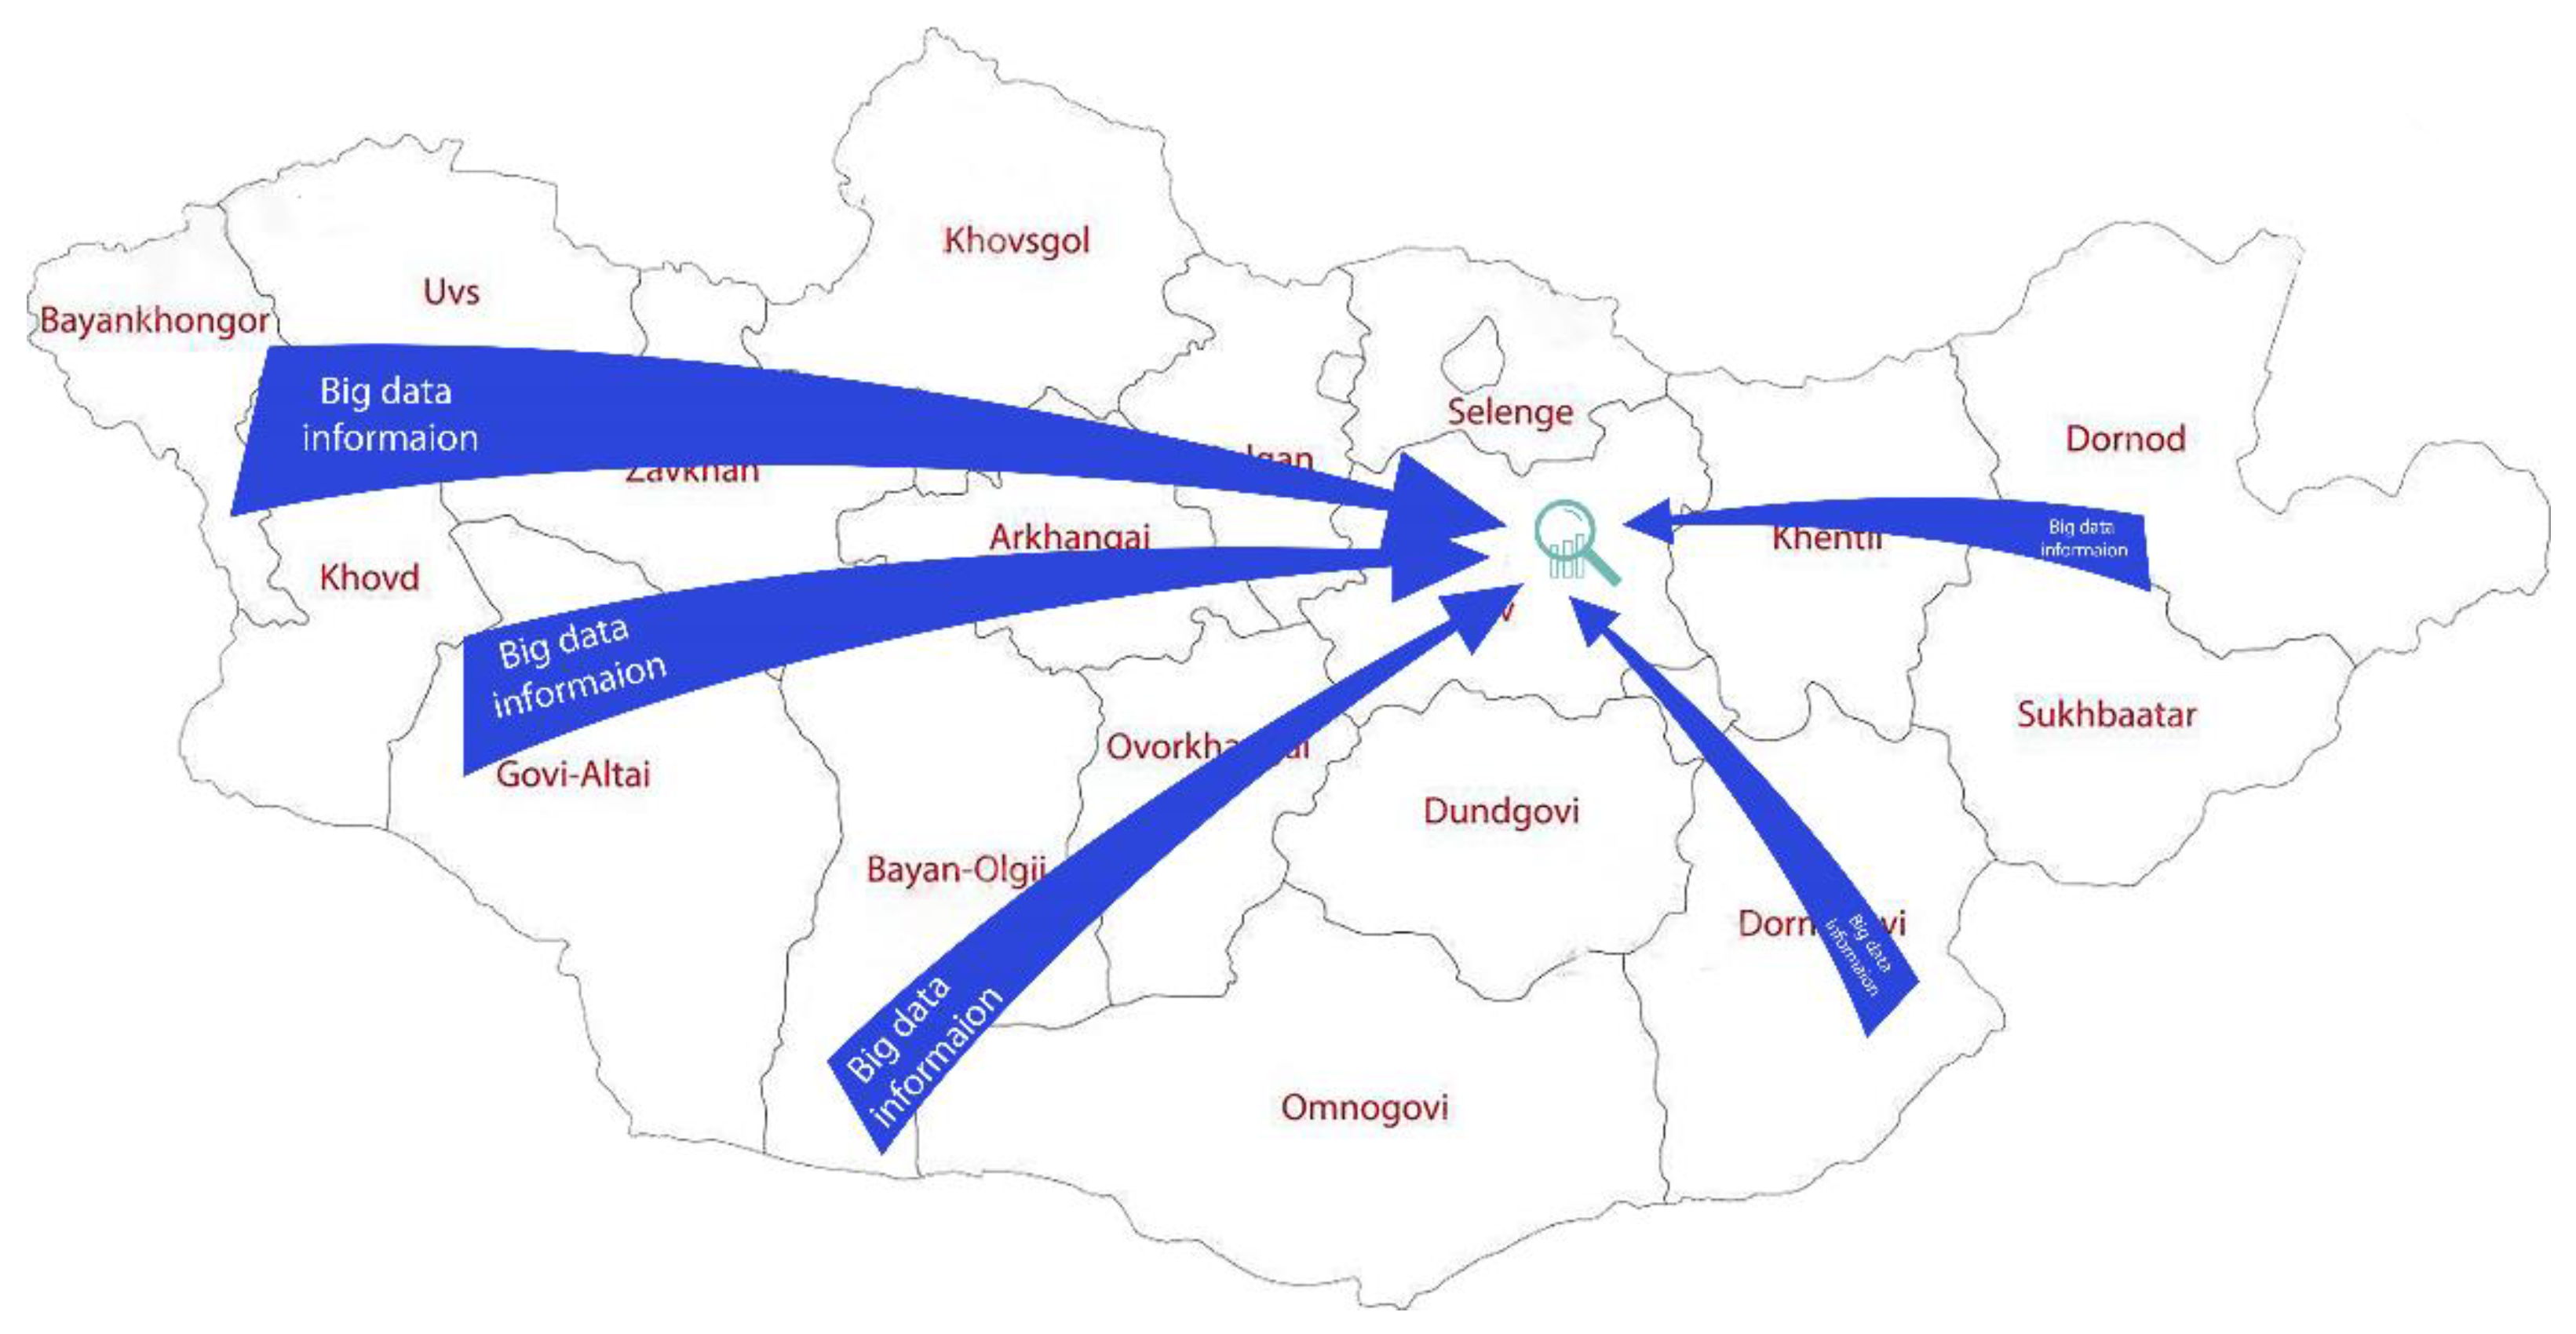
2.1. Description of Big Data Use
2.2. Materials and Methods
3. A Survey to Reduce STDs Infection in Mongolia Case Study Using Big Data Virtualization
3.1. Mongolian Medical System Status
3.1.1. Health Insurance Fund (HIF)
3.1.2. Mongolia’s Medical System
3.1.3. Major Health Indicators
3.1.4. Medical Institution
3.1.5. Medical Institution
3.2. STDs in Mongolia
3.2.1. Mongolian Gender Perception
3.2.2. STDs Outbreak in Mongolia
4. Idea of Big Data Analytical Approach to Mongolia’s STDs
- −
- Basic health services: family hospitals in Ulaanbaatar, hospitals in the province (aimag) or counties (soum).
- −
- Secondary health and medical services: general hospitals in Ulaanbaatar and general hospitals in the province (aimag).
- −
- Three tertiary health services: major hospitals and specialized centers in Ulaanbaatar.
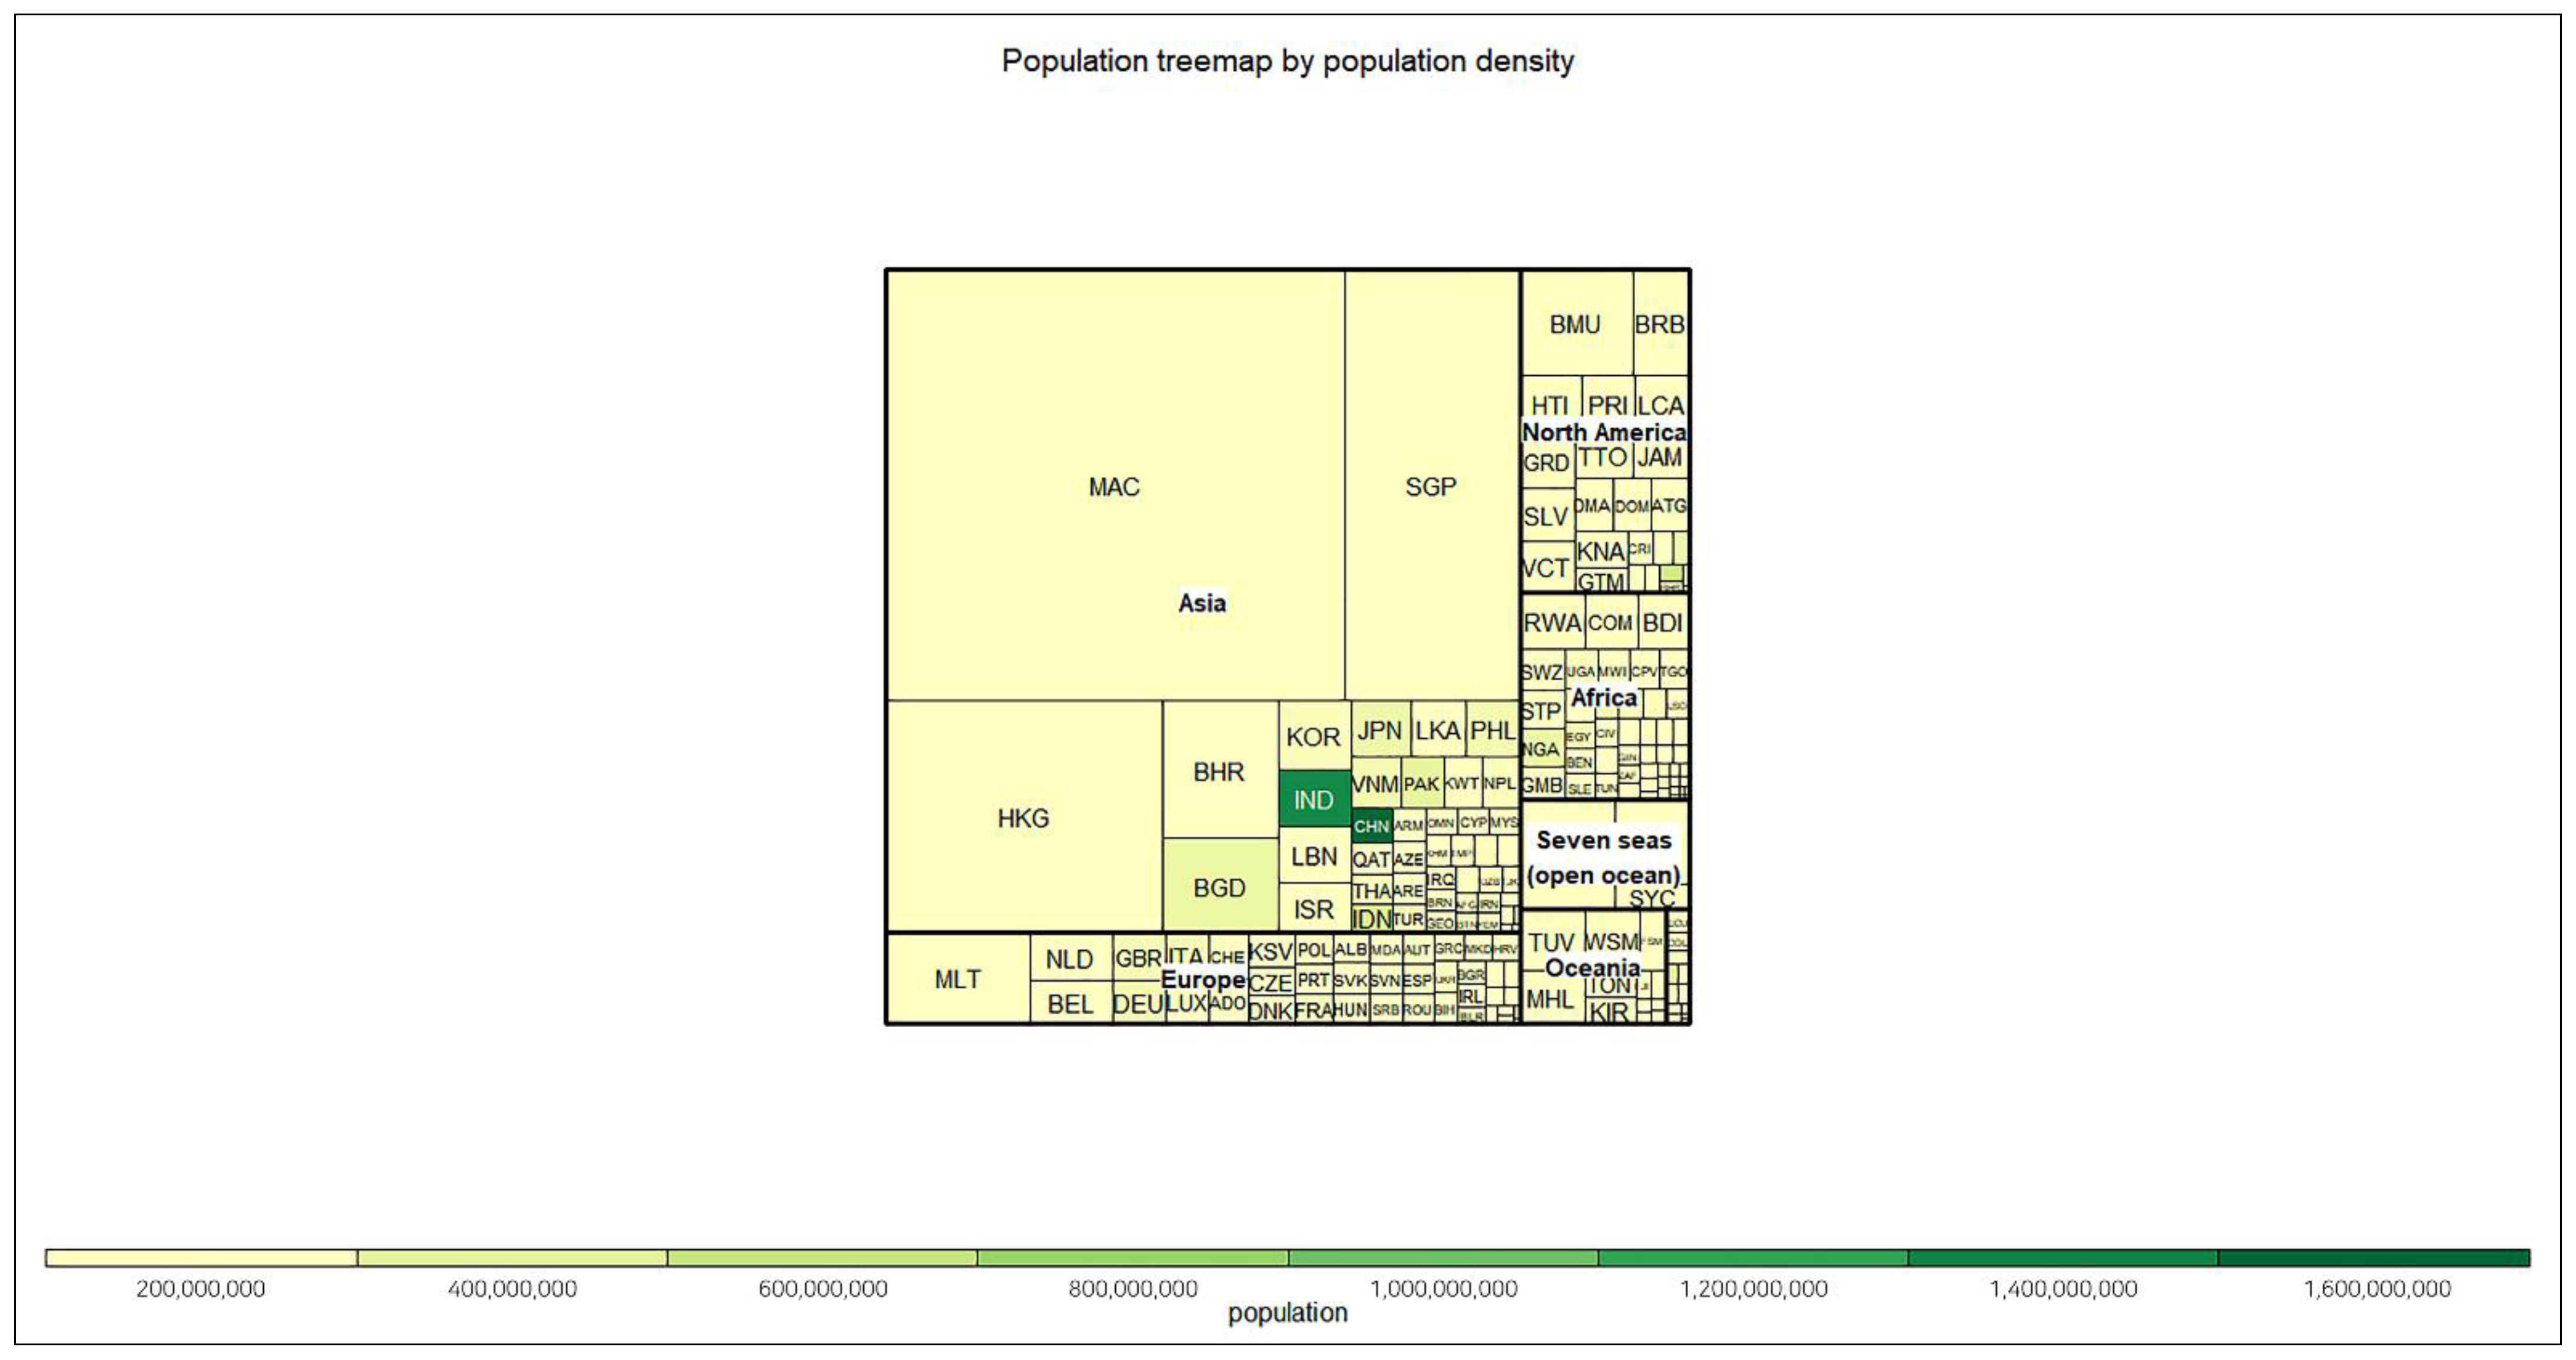
5. Inter-Country Big Data Analysis According to HIV, One of the STDs (Focused on Mongolia)
6. Conclusions and Limitations
Author Contributions
Funding
Conflicts of Interest
Abbreviations
| STDs | Sexually Transmitted Diseases |
| WHO | World Health Organization |
| HIV | Human Immunodeficiency Virus |
| HSV | Herpes Simplex Virus |
| HPV | Human Papillomavirus |
| AIDS | Acquired Immune Deficiency Syndrome |
| STI | Sexually Transmitted Infection |
| STIs | Sexually Transmitted Infections |
| OECD | Organization for Economic Co-operation and Development |
| GDP | Gross Domestic Product |
| FGP | Family Group Practice |
| DNA | Deoxyribonucleic Acid |
| HBV | Hepatitis B Virus |
| HIF | Health Insurance Fund |
References
- Multidisciplinary Digital Publishing Institute. Available online: https://www.mdpi.com/journal/biomedicines/special_issues/bioinformatics_biomedicine (accessed on 11 August 2021).
- Workowski, K.A.; Berman, S.M. Sexually Transmitted Diseases Treatment Guidelines, 2006. MMWR Recomm. Rep. 2006, 55, 1–94. [Google Scholar]
- Workowski, K.A.; Bolan, G.A. Sexually Transmitted Diseases Treatment Guidelines, 2015. MMWR Recomm. Rep. 2015, 64, 1–140. [Google Scholar]
- Lee, I.-S. Historical Changes and the Present Situation of Sexually Transmitted Diseases. J. Korean Med. Assoc. 2008, 51, 868–874. [Google Scholar] [CrossRef][Green Version]
- UNAIDS. Force for Change: World AIDS Campaign with Young People. UNAIDS 1998 Theme; UNAIDS: Geneva, Switzerland, 1998; pp. 8–9. [Google Scholar]
- WHO. Global Strategy for Prevention and Control of Sexually Transmitted Infections (2006–2015); WHO: Geneva, Switzerland, 2017; pp. 1–69. [Google Scholar]
- Workowski, K.A. Centers for Disease Control and Prevention Sexually Transmitted Diseases Treatment Guidelines. Clin. Infect. Dis. 2015, 61, 759–762. [Google Scholar] [CrossRef]
- Saag, M.S. HIV Infection—Screening, Diagnosis, and Treatment. N. Engl. J. Med. 2021, 384, 2131–2143. [Google Scholar] [CrossRef]
- Williamson, D.A.; Chen, M.Y. Emerging and Reemerging Sexually Transmitted Infections. N. Engl. J. Med. 2020, 382, 2023–2032. [Google Scholar] [CrossRef]
- Ağaçfidan, A.; Kohl, P. Sexually transmitted diseases (STDs) in the world. FEMS Immunol. Med. Microbiol. 1999, 24, 431–435. [Google Scholar] [CrossRef]
- Ryan, K.J.; Ray, C.G. Sherris Medical Microbiology, 4th ed.; McGawHill: New York, NY, USA, 2004. [Google Scholar]
- Detels, R.; Green, A.M.; Klausner, J.D.; Katzenstein, D.; Gaydos, C.; Handsfield, H.H.; Pequegnat, W.; Mayer, K.; Hartwell, T.D.; Quinn, T.C. The incidence and correlates of symptomatic and asymptomatic Chlamydia trachomatis and Neisseria gonorrhoeae infections in selected populations in five countries. Sex. Transm. Dis. 2011, 38, 503–509. [Google Scholar] [CrossRef]
- Davies, B.; Turner, K.M.E.; Frølund, M.; Ward, H.; May, M.T.; Rasmussen, S.; Benfield, T.; Westh, H.; Danish Chlamydia Study Group. Risk of reproductive complications following chlamydia testing: A population-based retrospective cohort study in Denmark. Lancet Infect. Dis. 2016, 16, 1057–1064. [Google Scholar] [CrossRef]
- Wolff, K.; Goldsmith, S.K.L.; Gilchrest, B.; Paller, A.S.; Leffell, D. Fitzpatrick’s Dermatology in General Medicine, 7th ed.; McGraw-Hill: New York, NY, USA, 2008; pp. 1955–1977. [Google Scholar]
- Jones, H.W.; Georgeanna, S. Novak’s Textbook of Gynecology, 10th ed.; Williams & Wilkins: Philadelphia, PA, USA, 1981. [Google Scholar]
- Cho, K.S.; Lee, D.G.; Park, Y.D.; Shin, S.C.; Lee, S.H.; Roh, H.J. Analysis of Otorhinolaryngologic disease in patients with human immunodeficiency virus infection. Korean J. Otorhinolaryngol. Head Neck Surg. 2009, 52, 506–511. [Google Scholar] [CrossRef]
- Barcelona, D.; Laski, L.; Gerdits, C. Universal sexuality education in mongolia: Educating today to protect tomorrow. Soc. Behav. Sci. Res. 2002, 12, 1–39. [Google Scholar]
- Cartagena, R.G.; Veugelers, P.J.; Kipp, W.; Magigav, K.; Laing, L.M. Effectiveness of an HIV prevention program for secondary school students in Mongolia. J. Adolesc. Health 2006, 39, 925. [Google Scholar] [CrossRef]
- Ebright, J.R.; Altantseteseg, T.; Oyungerel, R. Emerging infectious diseases in Mongolia. J. Emerg. Infect. Dis. 2003, 9, 1509–1515. [Google Scholar] [CrossRef] [PubMed]
- Kipp, W.; Sodnompil, T.; Tuya, M.; Erdenchimeg, E.; Nymadawa, P. Reproductive health in Mongolia: Results from three provinces and one urban district. Trop. Dr. 2002, 32, 159–162. [Google Scholar] [CrossRef] [PubMed]
- Bayasgalan, G.; Naranbat, D.; Tsedmaa, B.; Tsogmaa, B.; Sukhee, D.; Amarjargal, O.; Lhagvasuren, T.; Radnaabazar, J.; Rowe, P.J. Clinical patterns and major causes of infertility in Mongolia. J. Obstet. Gynaecol. Res. 2004, 30, 386–393. [Google Scholar] [CrossRef]
- UNAIDS. Report on the Global HIV/AIDS Epidemics; UNAIDS: Geneva, Switzerland, 2000. [Google Scholar]
- Peer Educator Training Manual; Directorate of Medical Services, Ministry of Health: Ulaanbaatar, Mongolia, 2004.
- Smith, C.J. Social geography of sexually transmitted diseases in China: Exploring the role of migration and urbanization. Asia Pac. Viewp. 2005, 46, 65–80. [Google Scholar] [CrossRef]
- Netesov, S.V.; Conrad, J.L. Emerging infectious diseases in Russia 1990–1999. Emerg. Infect. Dis. 2001, 7, 1–5. [Google Scholar] [CrossRef]
- New Horizons: The Newsletter of the UN in Mongolia; United Nations: New York, NY, USA, 2003; Volume 4, pp. 4–10.
- Grassley, N.; Garnett, G. The future of the HIV pandemic. Bull. World Health Organ. 2005, 83, 378–383. [Google Scholar]
- Chayavichitsilp, P.; Buckwalter, J.V.; Krakowski, A.C.; Friedlander, S.F. Herpes simplex. Pediatr. Rev. 2009, 30, 119–129. [Google Scholar] [CrossRef] [PubMed]
- zur Hausen, H. Perspectives of contemporary papillomavirus research. Vaccine 2006, 24, iii–iv. [Google Scholar] [CrossRef] [PubMed]
- World Health Organization. Available online: https://www.who.int/en/news-room/fact-sheets/detail/hepatitis-b (accessed on 11 August 2021).
- Adler, M.W. Sexually transmitted diseases control in developing countries. Sex. Transm. Infect. 1996, 72, 83–88. [Google Scholar] [CrossRef] [PubMed][Green Version]
- Bhuiyan, B.U.; Rahman, M.; Miah, M.R.; Nahar, S.; Islam, N.; Ahmed, M.; Rahman, K.M.; Albert, M.J. Antimicrobial susceptibilities and plasmid contents of Neisseria gonorrhoeae isolates from commercial sex workers in Dhaka, Bangladesh: Emergence of high-level resistance to ciprofloxacin. J. Clin. Microbiol. 1999, 37, 1130–1136. [Google Scholar] [CrossRef]
- Apalata, T.; Zimba, T.F.; Sturm, W.A.; Moodley, P.; Nabi, M.H.; Hawlader, M.D.H. Antimicrobial susceptibility profile of Neisseria gonorrhoeae isolated from patients attending a STD facility in Maputo, Mozambique. Sex. Transm. Dis. 2009, 36, 341–343. [Google Scholar] [CrossRef]
- Farabi, T.J.; Jahangir, Y.T.; Clara, A.A.; Nabi, M.H.; Hawlader, M.D.H. Sexually Transmitted Infections among Street, Hotel, and Residence-Based Female Sex Workers in Dhaka, Bangladesh: Prevalence from Three HIV/STI Drop-in-Centers. Sexes 2021, 2, 69–78. [Google Scholar] [CrossRef]
- Namjil, T. Family Manner & Tradition in Mogolids; Minseokwon: Seoul, Korea, 2007. [Google Scholar]
- Kim, G.S. Mongolia Cultural History; Tongmoonseon: Seoul, Korea, 1991. [Google Scholar]
- WHO. World Health Statistics 2021: Annex 2; WHO: Geneva, Switzerland, 2021. [Google Scholar]
- UNDP. Human Development Reports 2020; UNDP: New York, NY, USA, 2020. [Google Scholar]
- Lee, J.-H.; Je, M.-G.; Jo, M.-J.; Son, H.-S. Trends in the use of big data in the health care field. Korea Inst. Inf. Commun. Eng. 2014, 32, 63–75. [Google Scholar]
- Yoo, W.-K. Mongolian Health Care System and the Health Status of Mongolian People. Korean Assoc. Mong. Stud. 2010, 1, 327–341. [Google Scholar]
- KHIDI. Guide to Korean Medical Advancement to Mongolia; KHIDI: Chungcheongbuk, Korea, 2014; pp. 1–186. [Google Scholar]
- WHO. Health Financing Strategy for the Asia Pacific Region (2010–2015); WHO: Geneva, Switzerland, 2009; pp. 1–43. [Google Scholar]
- WHO and Mongolian Ministry of Health. Health Service Delivery Profile; WHO and Mongolian Ministry of Health: Ulaanbatar, Mongolia, 2012; pp. 4–5. [Google Scholar]
- Central Intelligence Agency. Available online: https://www.cia.gov/ (accessed on 11 August 2021).
- Nam, E.-W. Hospital Management; Shinkwang: Seoul, Korea, 2002. [Google Scholar]
- A Study on the Criteria for Accreditation of Tertiary Care Institutions; NECA: Hillside, NJ, USA, 1995; p. 12.
- Kim, G.-H. Measures to establish functions of medical institutions to establish a medical delivery system. Stud. Health Insur. Rev. Assess. Serv. 2015, 9, 1–11. [Google Scholar]
- Health Indicators. 2018. Available online: http://www.hdc.gov.mn/media/uploads/2019-11/2018eng.pdf (accessed on 5 August 2021).
- WHO. World Health Statistics; WHO: Geneva, Switzerland, 2011; Available online: https://reliefweb.int/report/world/world-health-statistics-2011?gclid=EAIaIQobChMIorSj7JzE9AIVl1VgCh3kxwOKEAAYASAAEgJhw_D_BwE (accessed on 3 August 2021).
- Lee, P.-R. Korean Intellectuals’ Recognition on Mongolia in the First Half of the 20th Century 3, Misunderstanding and Prejudice about Mongolia and its Culture. Korean Assoc. Cent. Asian Stud. 2014, 17, 195–228. [Google Scholar]
- June, M.K.; Choi, J.Y.; Jeong, W.Y.; Seong, H.; Kim, S.W.; Kim, W.J.; Choi, H.J.; Kim, M.J.; Woo, J.H.; Kim, Y.J.; et al. Mode of Human Immunodeficiency Virus Transmission in Korea: The Korea HIV/AIDS Cohort Study. Korean J. Med. 2018, 93, 379–386. [Google Scholar]
- Lee, S.-H.; Kim, S.-J.; Lee, Y.-J.; Kim, S.-Y. Knowledge and Actual Condition of Sexually-Transmitted Disease in Mongolian. J. Korean Public Health Nurs. 2011, 25, 255–265. [Google Scholar]
- Mavragani, A.; Ochoa, G. Infoveillance of infectious diseases in USA: STDs, tuberculosis, and hepatitis. J. Big Data 2018, 5, 30. [Google Scholar] [CrossRef]
- Mavragani, A.; Sampri, A.; Sypsa, K.; Tsagarakis, K.P. Integrating Smart Health in the US Health Care system: Infodemiology Study of asthma monitoring in the Google era. JMIR Public Health Surveill. 2018, 4, e24. [Google Scholar] [CrossRef]
- Baseman, J.G.; Revere, D.; Painter, I. Big data in the era of health information exchanges: Challenges and opportunities for public health. Informatics 2017, 4, 39. [Google Scholar] [CrossRef]
- Zhou, X.; Ye, J.; Feng, Y. Tuberculosis surveillance by analyzing google trends. IEEE Trans. Biomed. Eng. 2011, 58, 2247–2254. [Google Scholar] [CrossRef]
- Johnson, A.K.; Mehta, S.D. A comparison of internet search trends and sexually transmitted infection rates using google trends. Sex. Transm. Dis. 2014, 41, 61–63. [Google Scholar] [CrossRef]
- Rohart, F.; Milinovich, G.J.; Avril, S.M.R.; Lê Cao, K.-A.; Tong, S.; Hu, W. Disease surveillance based on Internet-based linear models: An Australian case study of previously unmodeled infection diseases. Sci. Rep. 2016, 6, 38522. [Google Scholar] [CrossRef]
- Mavragani, A.; Ochoa, G. Forecasting AIDS prevalence in the united states using online search traffic data. J. Big Data 2018, 5, 17. [Google Scholar] [CrossRef]
- Mavragani, A.; Sypsa, K.; Sampri, A.; Tsagarakis, K.P. Quantifying the UK online interest in substances of the EU watch list for water monitoring: Diclofenac, estradiol, and the macrolide antibiotics. Water 2016, 8, 542. [Google Scholar] [CrossRef]
- Gahr, M.; Uzelac, Z.; Zeiss, R.; Connemann, B.J.; Lang, D.; Schönfeldt-Lecuona, C. Linking annual prescription volume of antidepressants to corresponding web search query data: A possible proxy for medical prescription behavior? J. Clin. Psychopharmacol. 2015, 35, 681–685. [Google Scholar] [CrossRef] [PubMed]
- Song, T.; Song, J. Social Big Data Analysis and Utilization Methodologies-With Special Reference to Forecasting the Dangers of Sexting in Korea Using Social Big Data. Available online: http://repository.kihasa.re.kr/bitstream/201002/15079/1/%EC%9B%8C%ED%82%B9%ED%8E%98%EC%9D%B4%ED%8D%BC%202015-02.pdf (accessed on 1 August 2021).
- University of Mongolia. Students and Graduates Department. Available online: https://www.student.num.mn/p=6999 (accessed on 25 September 2021).
- Yu, W.S. The tradition and present situation of pastoral nomadism in the Mongolian plateau. J. Hum. Stud. 2012, 67, 349–380. [Google Scholar]
- Shin, H.D. Culture Shock! Mongolia: A Guide to Customs and Etiquette; Whistler: Seoul, Korea, 2005; pp. 121–130. [Google Scholar]
- Kim, J.; Cha, N.H. Validity and Reliability of the Sexual Knowledge and Sexual Attitude for Mongolian University Students. J. Converg. Cult. Technol. 2021, 7, 139–148. [Google Scholar]
- Kang, H.-J. National-Level Use of Health Care Big Data and Its Policy Implications. Health Welf. Policy Forum 2016, 238, 55–71. [Google Scholar]
- Korea Foundation. Korea Foundation for International Healthcare. 2011. Available online: https://www.who.int/pmnch/about/members/database/kofih/en/ (accessed on 3 August 2021).
- Kim, G.; Cho, S. Factors Influencing Sexually Transmitted Diseases Prevention and Screening Intentions (Behaviors) among Young Koreans in their 20s Applying Extended Health Belief Model. J. Public Relat. 2020, 24, 92–126. [Google Scholar]
- Kim, H.; Lee, P. Mongolian ICT industry achievements and prospects. Turk. Altaic Econ. Belt 2018, 22, 34–41. [Google Scholar]
- Mundur, B.; Chandaga, U.; Narantsogt, G.; Jagdagsuren, D.; Magsar, T.; Minjuur, E.; Shijee, N.; Gombodorj, A.; Agvaandaram, G.; Dorjsuren, T. Prevalence of Syphilis and HIV Diseases among Some Universities’ Students in Mongolia. J. Health Sci. 2017, 5, 298–302. [Google Scholar]
- WHO. World Health Statistics 2021: Monitoring Health for the SDGs; WHO: Geneva, Switzerland, 2021; pp. 1–132. [Google Scholar]
- Human Development Reports. Available online: http://hdr.undp.org/en/content/human-development-index-hdi (accessed on 22 October 2021).
- UNESCO. UNESCO Institute for Statistics; UNESCO: Montreal, QC, Canada, 2010. [Google Scholar]
- Barro, R.J.; Lee, J.-W. A New Data Set of Educational Attainment in the World, 1950–2010. 2010. Available online: https://www.nber.org/papers/w15902 (accessed on 11 August 2021).


| Indicator Name | Figures | Unit | Calculation Year |
|---|---|---|---|
| Population | 2,912,190 | persons | July 2014 est. |
| Life expectancy | Average: 68.98 | age | 2014 est. |
| Male: 64.72 | |||
| Female: 73.45 | |||
| Per capita | 5900 | $ | 2012 est. |
| Medical expenditure per person | 5.3 of GDP | % | 2011 |
| Infant mortality rate (per 1000 people) | 23.15 | persons | 2014 est. |
| Maternal mortality rate (per 100,000 births) | 63 | persons | 2010 |
| Number of beds per 10 million people | 6.8 | amount | 2008 |
| Number of doctors per 10 million | 2.76 | persons | 14,083 |
| Classification | Number | |
|---|---|---|
| Primary medical institution | Family health centers | 221 |
| Soum health centers | 271/19 | |
| Intersoum hospitals | 39 | |
| Secondary medical institution | District hospitals | 8 |
| Rural general hospitals | 6 | |
| Aimag general hospitals | 20 | |
| Tertiary medical institution | Regional diagnostic and treatment centers | 5 |
| Central hospital and specialized services | 16 | |
| Maternity hospitals | 3 | |
| Other hospitals | 45 | |
| Private hospitals | 179 | |
| Other | Private clinics | 851 |
| Sanatoriums | 100 | |
| Drug supply companies | 155 | |
| Drug manufacturers | 42 | |
| Private pharmacies | 855 | |
| Other | 46 | |
| Total number of medical institutions | 2881 | |
| Infectious Diseases | Republic of Korea | Per 10,000 Population | Mongolia | Per 10,000 Population |
| Syphilis | 2280 | 0.45 | 6670 | 21.8 |
| Gonorrhea | 2361 | 0.47 | 4422 | 14.5 |
| Trichomoniasis | 10,606 | 2.1 | 4247 | 13.9 |
| HIV/AIDS | 1260 | 0.25 | 25 | 0.1 |
| Total | 14,148 | 15,364 | ||
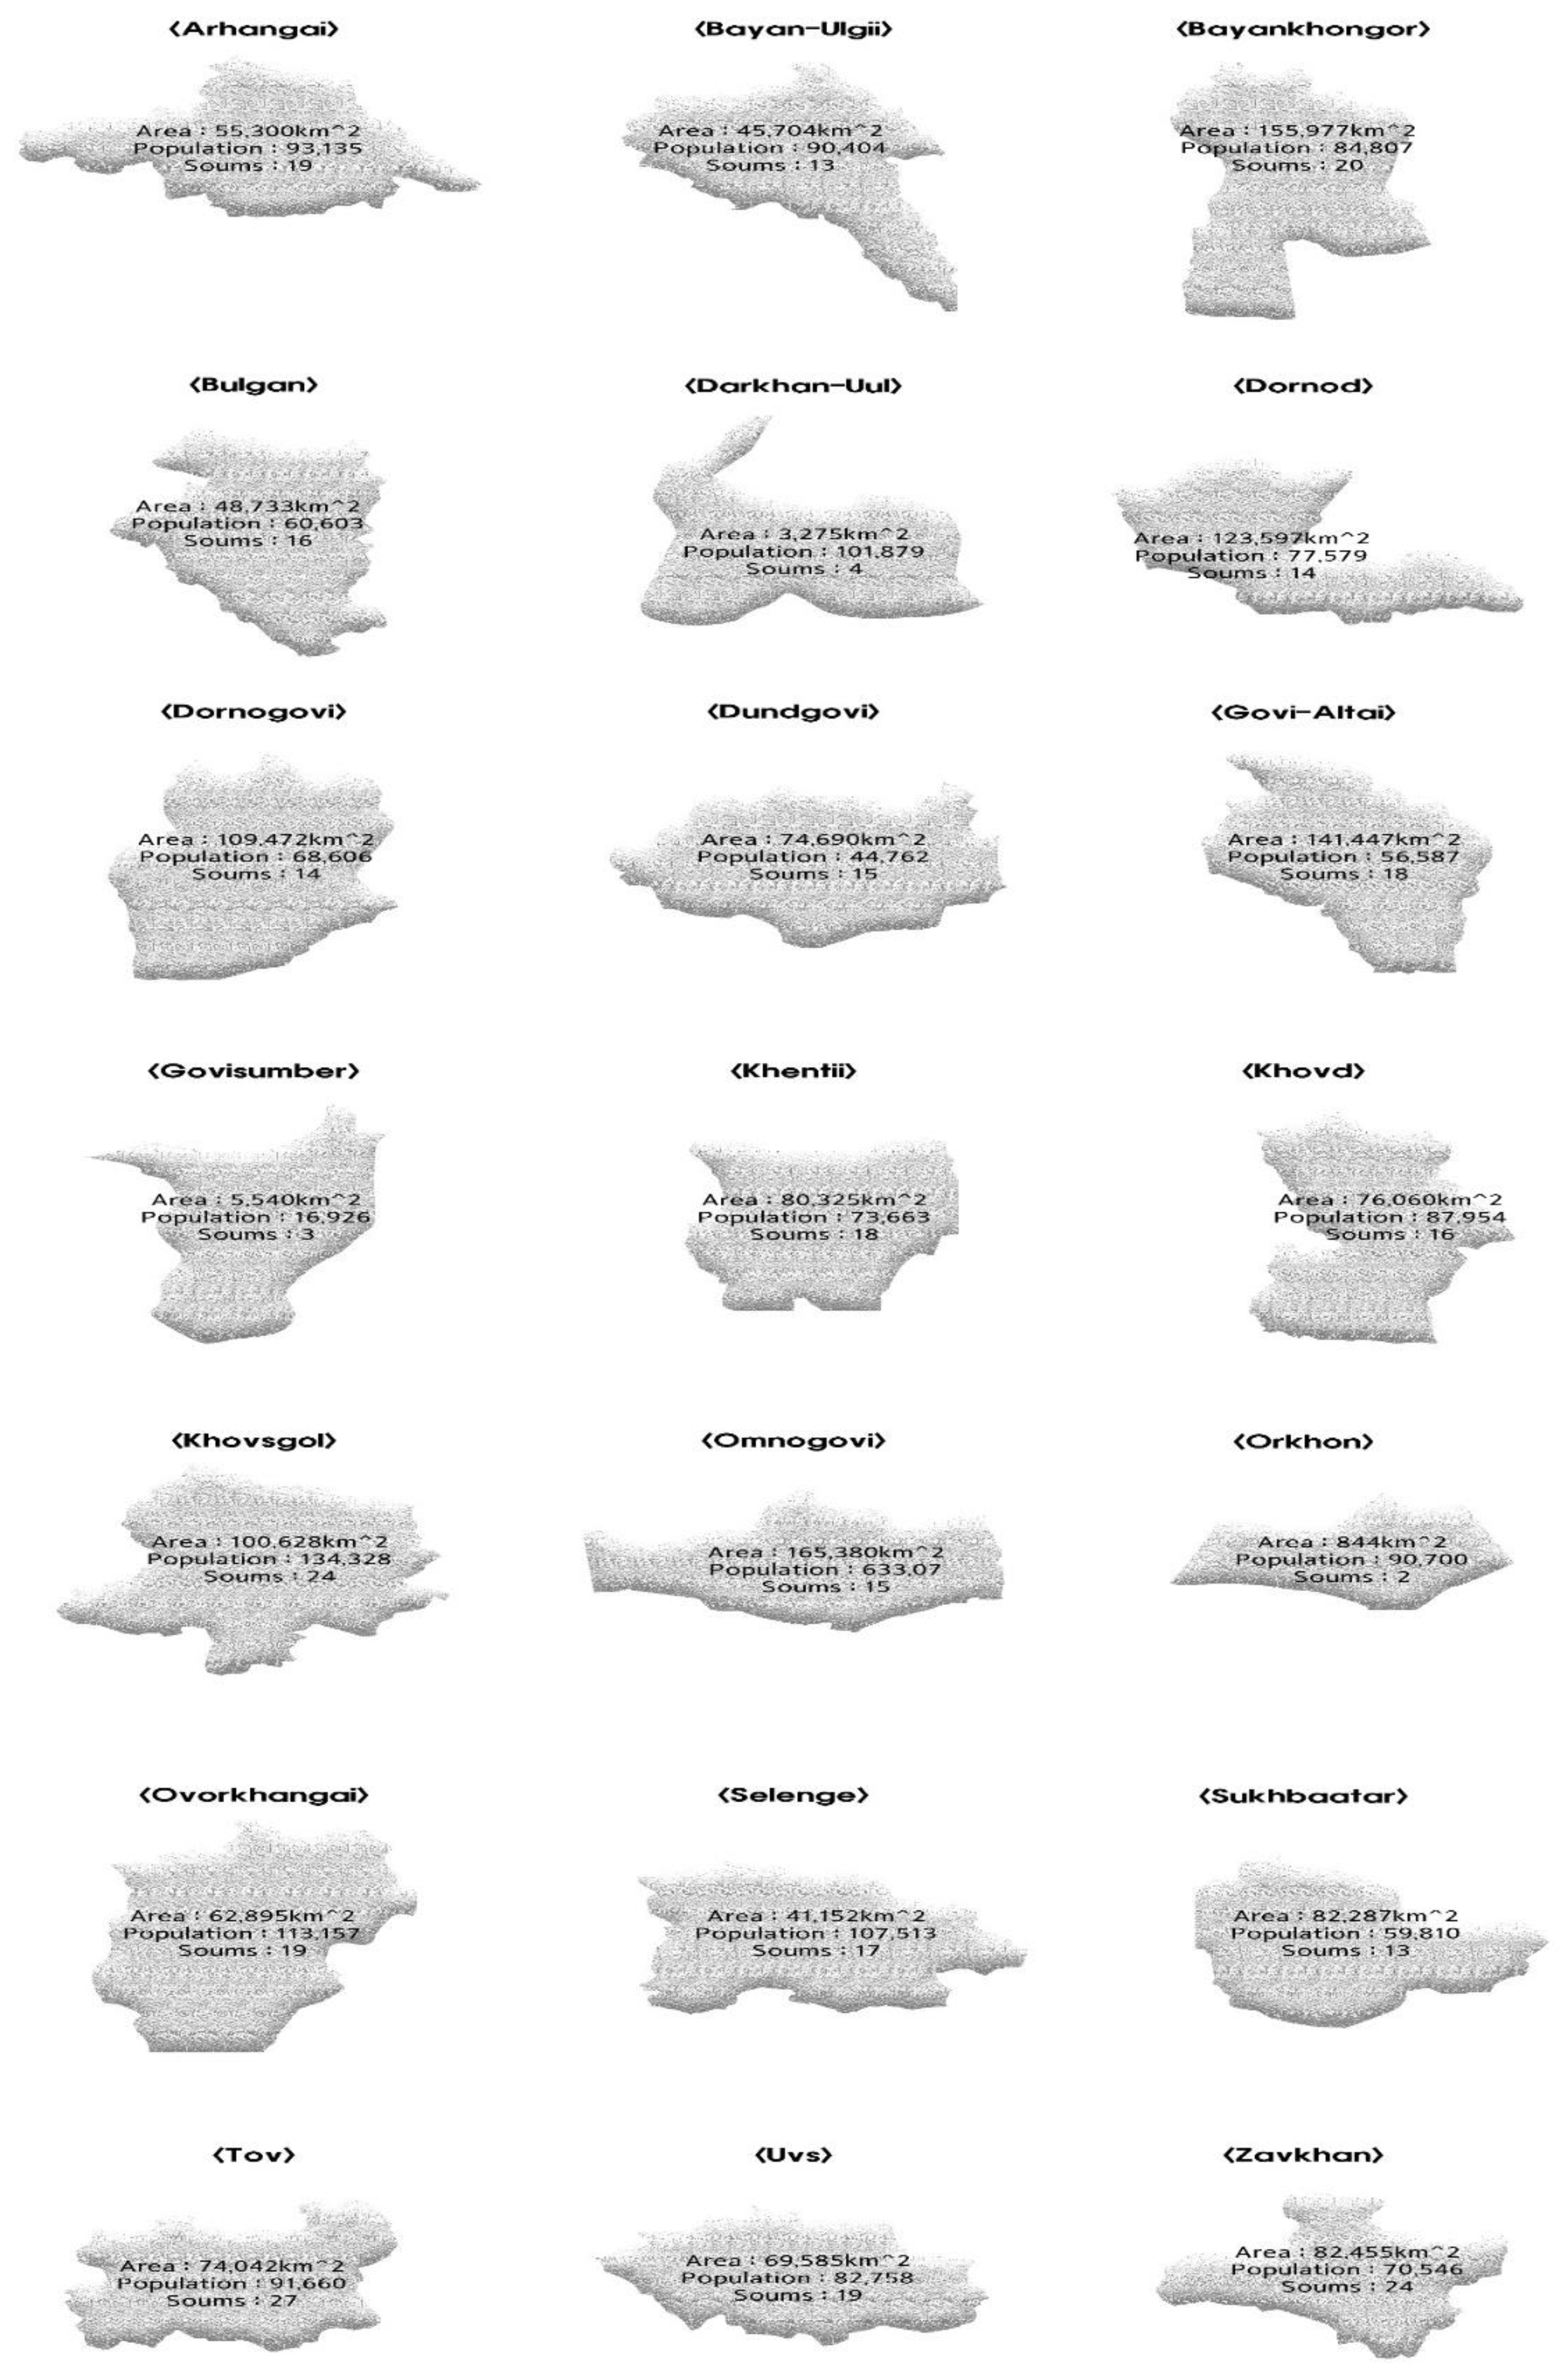
| Name | Area (km2) | Population | Soums | Distance from Ulaanbaatar (km) |
|---|---|---|---|---|
| Arhangai | 55,300 | 93,135 | 19 | 454 |
| Bayan-Ulgii | 45,704 | 90,404 | 13 | 1278 |
| Bayankhongor | 115,977 | 84,807 | 20 | 506 |
| Bulgan | 48,733 | 60,603 | 16 | 270 |
| Darkhan-Uul | 3275 | 101,879 | 4 | 181 |
| Dornod | 123,597 | 77,579 | 14 | 635 |
| Dornogovi | 109,472 | 68,606 | 14 | 470 |
| Dundgovi | 74,690 | 44,762 | 15 | 256 |
| Govi-Altai | 141,447 | 56,587 | 18 | 886 |
| Govisoumber | 5540 | 16,926 | 3 | 201 |
| Khentii | 80,325 | 73,663 | 18 | 228 |
| Khovd | 76,060 | 87,954 | 16 | 1133 |
| Khovsgol | 100,628 | 134,318 | 24 | 521 |
| Omnogovi | 165,380 | 63,307 | 15 | 1122 |
| Orkhon | 844 | 90,700 | 2 | 261 |
| Ovorkhangai | 62,875 | 113,157 | 19 | 373 |
| Selenge | 41,152 | 107,513 | 17 | 276 |
| Sukhbaatar | 82,287 | 59,810 | 13 | 263 |
| Tov | 74,042 | 91,660 | 27 | 84 |
| Uvs | 69,585 | 82,758 | 19 | 1015 |
| Zavkhan | 82,455 | 70,546 | 24 | 1023 |
| > Mongolnumber ← read.csv(‘mongol(number).csv’) > cor(mongolnumber) Area Population soums Area 1.00000000 −0.07349966 0.5411437 Population −0.07349966 1.00000000 0.3443261 soums 0.54114373 0.34432607 1.0000000 > library(corrgram) > corrgram(mongolnumber) |
| > mongolnumber ← read.csv(‘mongolmap(number).csv’) > str(mongolnumber) ‘data.frame’: 21 obs. of 3 variables: $ Area (km2): int 55,300 45,704 115,977 48,733 3275 123,597 109,472 74,690 141,447 5540 … $ Population(persons): int 93,135 90,404 84,807 60,603 101,879 77,579 68,606 44,762 56,587 16,926 … $ soums(number) : int 19 13 20 16 4 14 14 15 18 3 … > plot(mongolnumber) > library(PerformanceAnalytics) > chart.Correlation(mongolnumber, histogram = TRUE, pch = 19) |
| - | Estimate | Std. Error | t(p) Pr (>|t|) | F(p) | R2 |
|---|---|---|---|---|---|
| (Intercept) | 9.699 | 2.466 | 3.933 0.000892 *** | 7.8618 * | 0.2556 |
| Regression between area and number of soums | 0.00081 | 2.888 | 2.805 0.011300 * | - | - |
| data: Data$New.HIV.infectionsg.per.1000.uninfected.population. and Data$ratio t = −0.38614, df = 140, p-value = 0.7 alternative hypothesis: true correlation is not equal to 0 95 percent confidence interval: −0.1962899 < m < 0.1328237, m: Confidence Interval Estimates sample estimates: cor −0.03261727 |
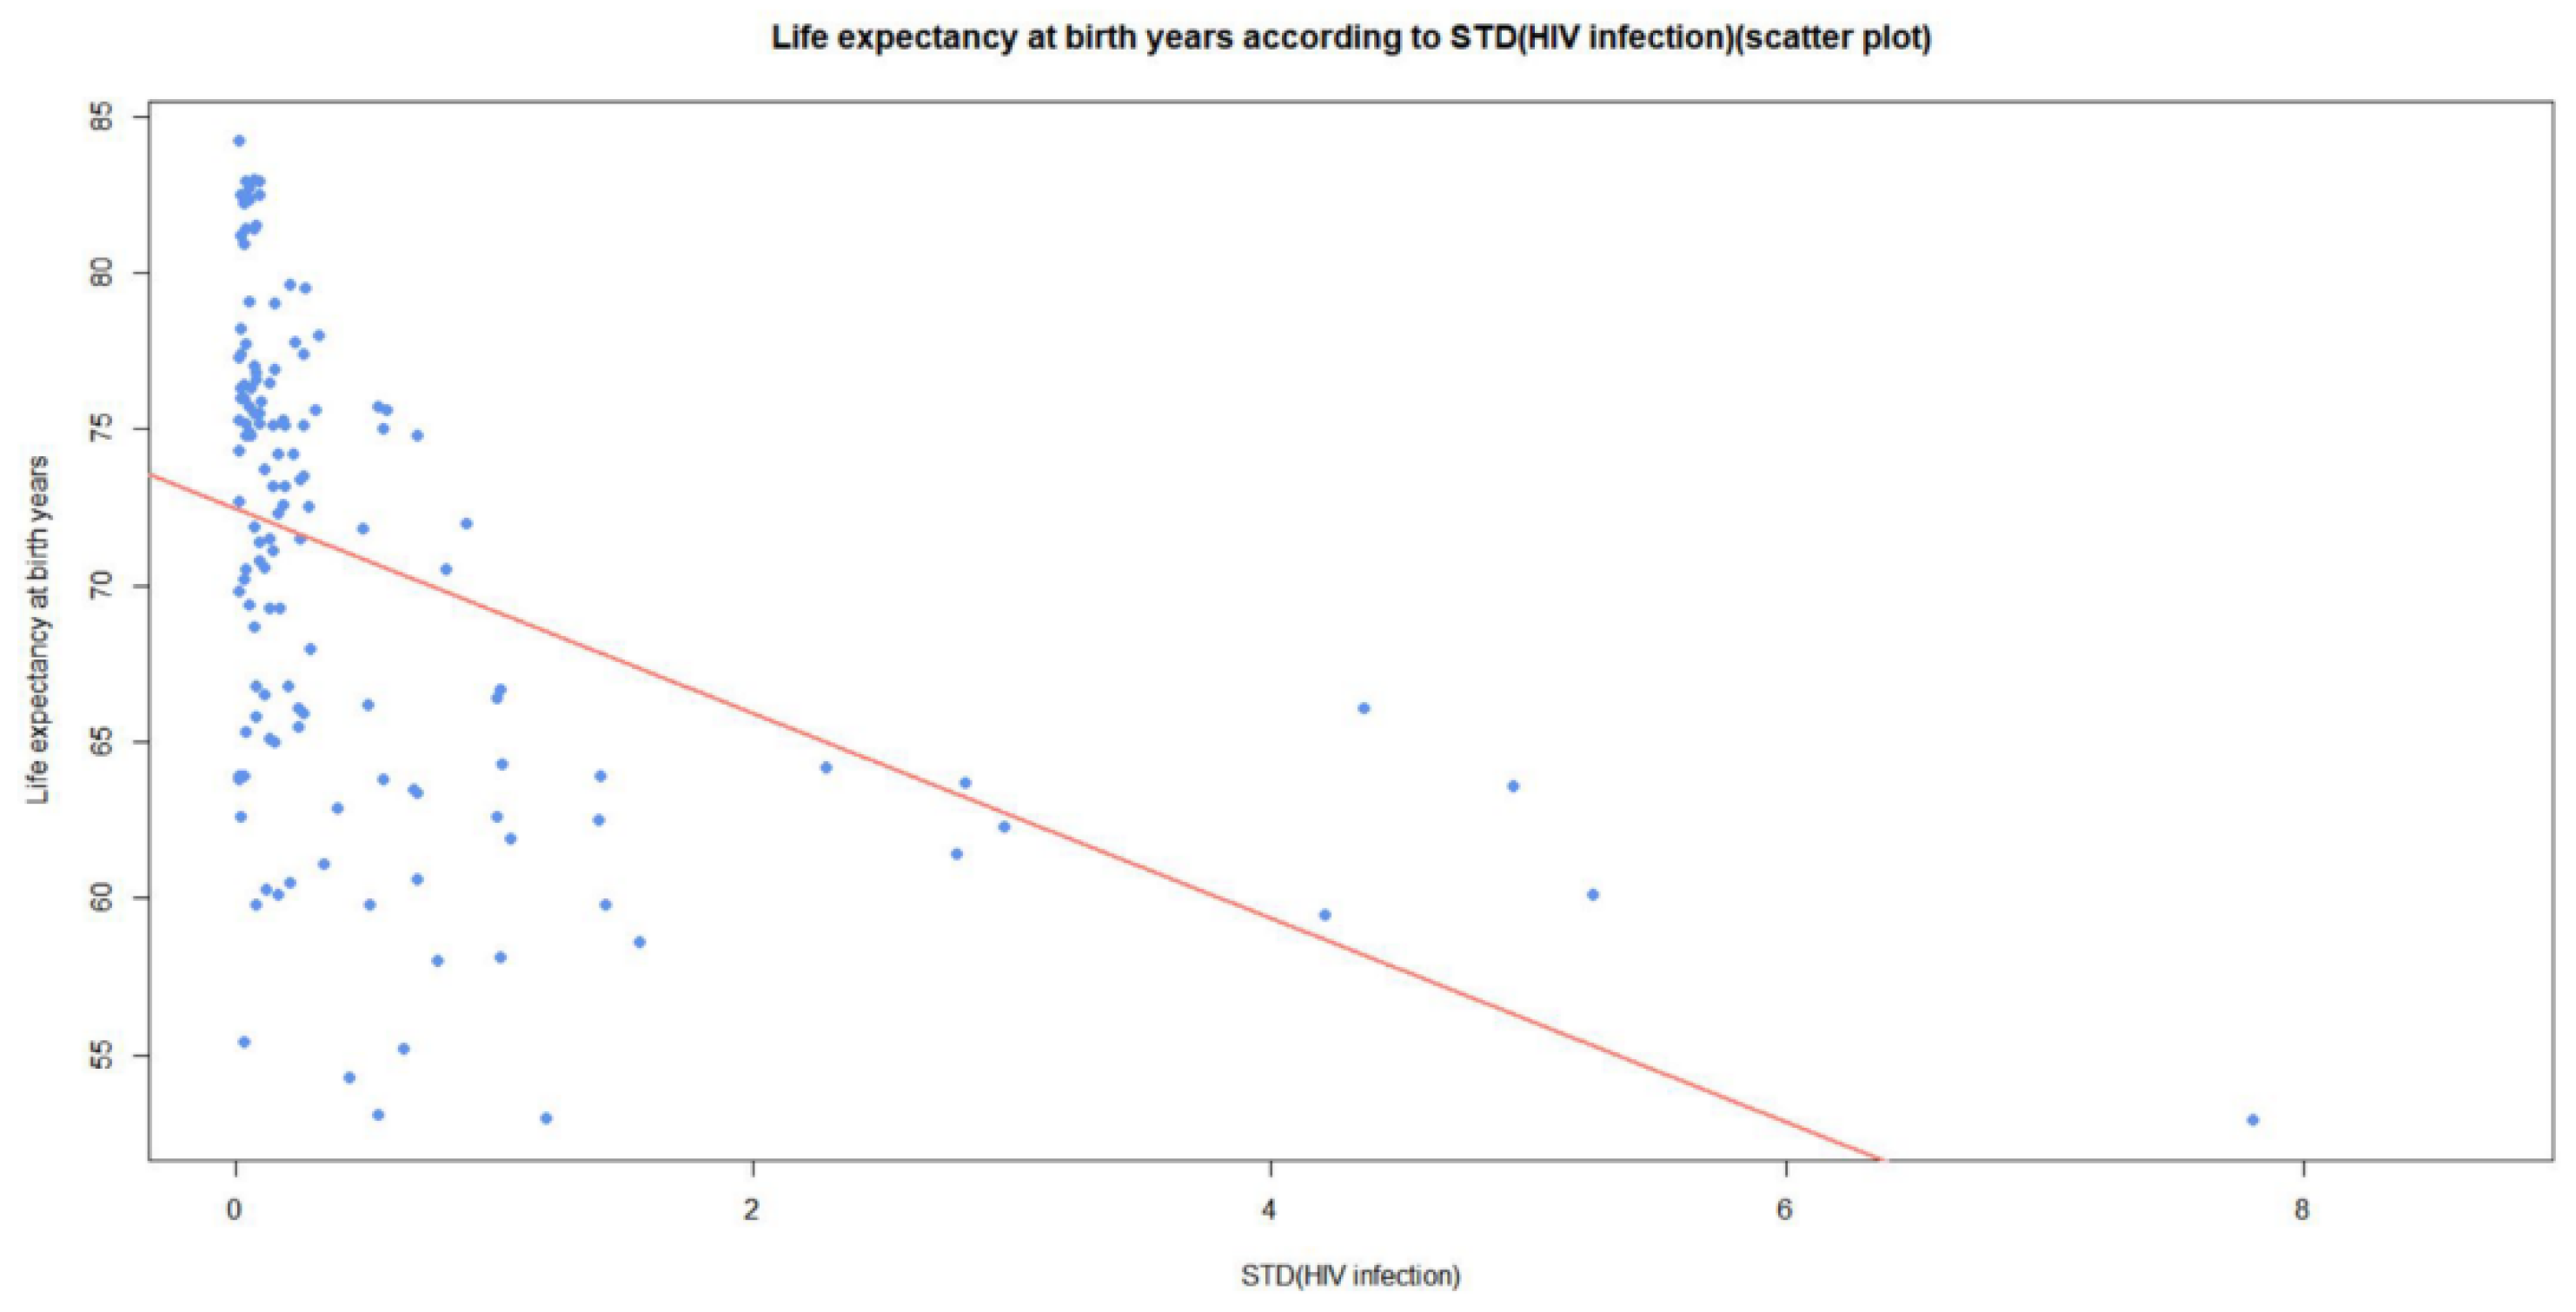
| data: Data$New.HIV.infectionsg.per.1000.uninfected.population. and Data$Life.expectancy.at.birth.years. t = −6.129, df = 137, p-value = 0.000000008851 alternative hypothesis: true correlation is not equal to 0 95 percent confidence interval: −0.5851884 < m < −0.3222770, m: Confidence Interval Estimates sample estimates: cor −0.463886 |
| data: Data$New.HIV.infectionsg.per.1000.uninfected.population.and Data$Population.with.household.expenditures.on.health.25.of.total.household.expenditure.or.incomer. t = −0.54717, df = 89, p-value = 0.5856 alternative hypothesis: true correlation is not equal to 0 95 percent confidence interval: −0.2607386 < m < 0.1498285, m: Confidence Interval Estimates sample estimates: cor −0.05790301 |
| data: Data$New.HIV.infectionsg.per.1000.uninfected.population.andData$ Population.density..persons.per.square.km. t = −0.70764, df = 142, p-value = 0.4803 alternative hypothesis: true correlation is not equal to 0 95 percent confidence interval: −0.2207148 < m < 0.1053180, m: Confidence Interval Estimates sample estimates: cor −0.05927912 |
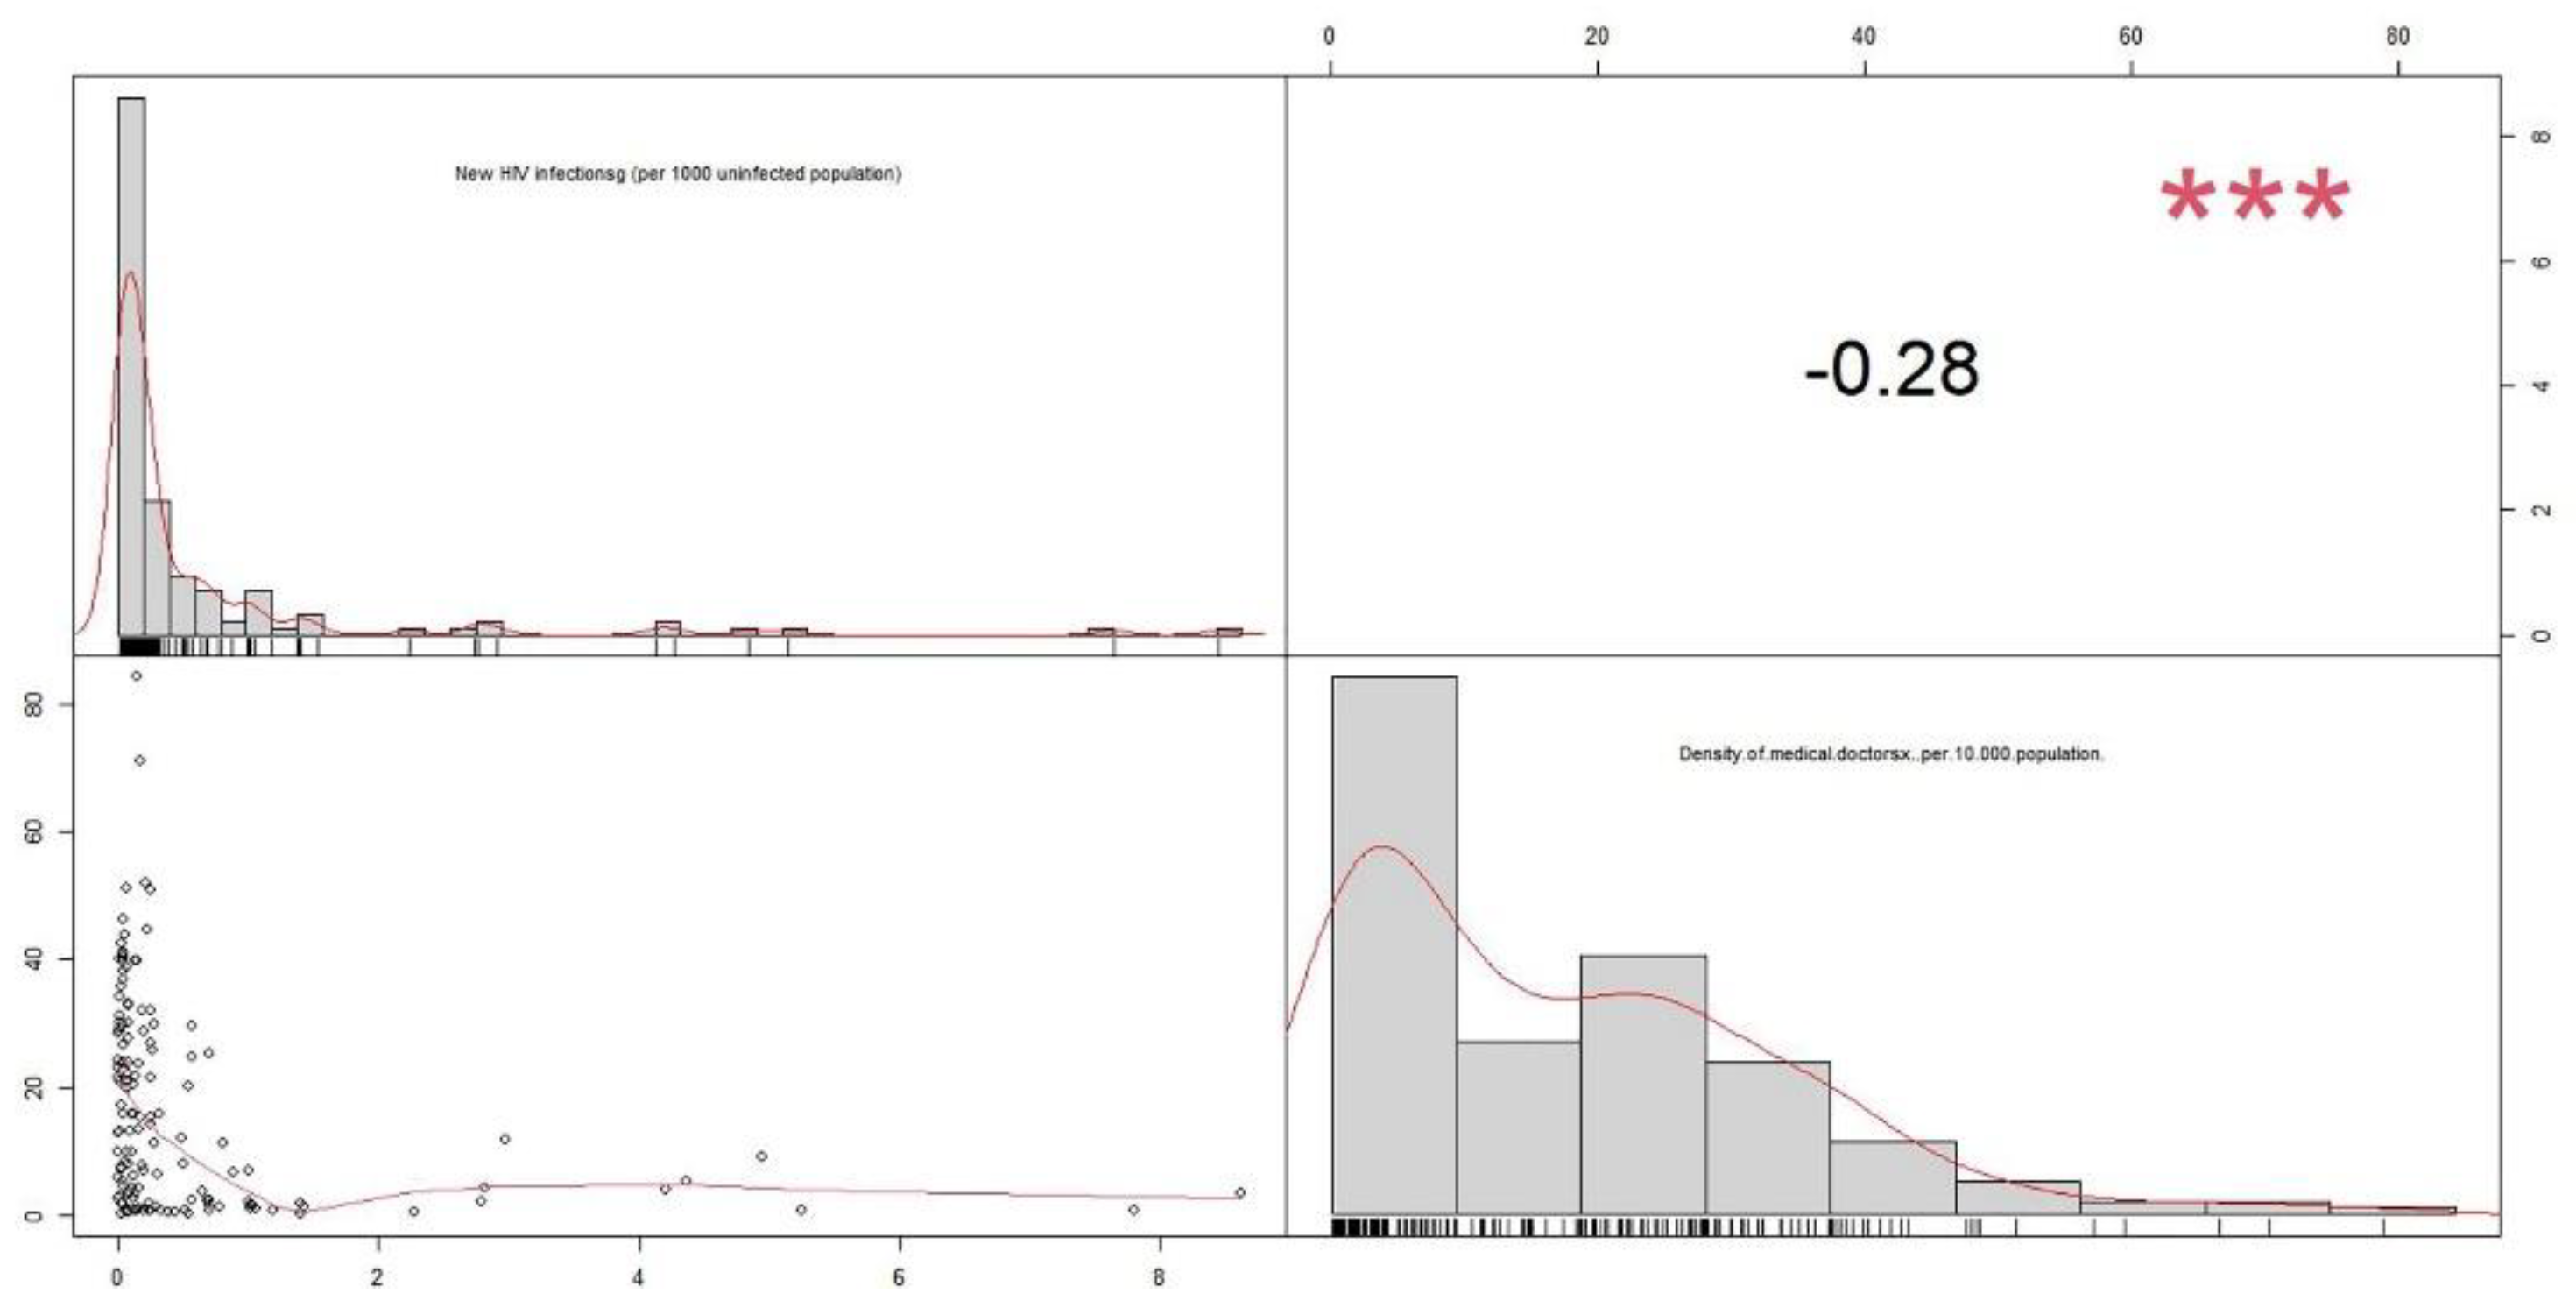
| data: Data$New.HIV.infectionsg..per.1000.uninfected.population.and Data$Density.of.medical.doctorsx..per.10.000.population. t = −3.4625, df = 141, p-value = 0.0007088 alternative hypothesis: true correlation is not equal to 0 95 percent confidence interval: −0.4245757 < m < −0.1213652, m: Confidence Interval Estimates sample estimates: cor −0.2799369 |
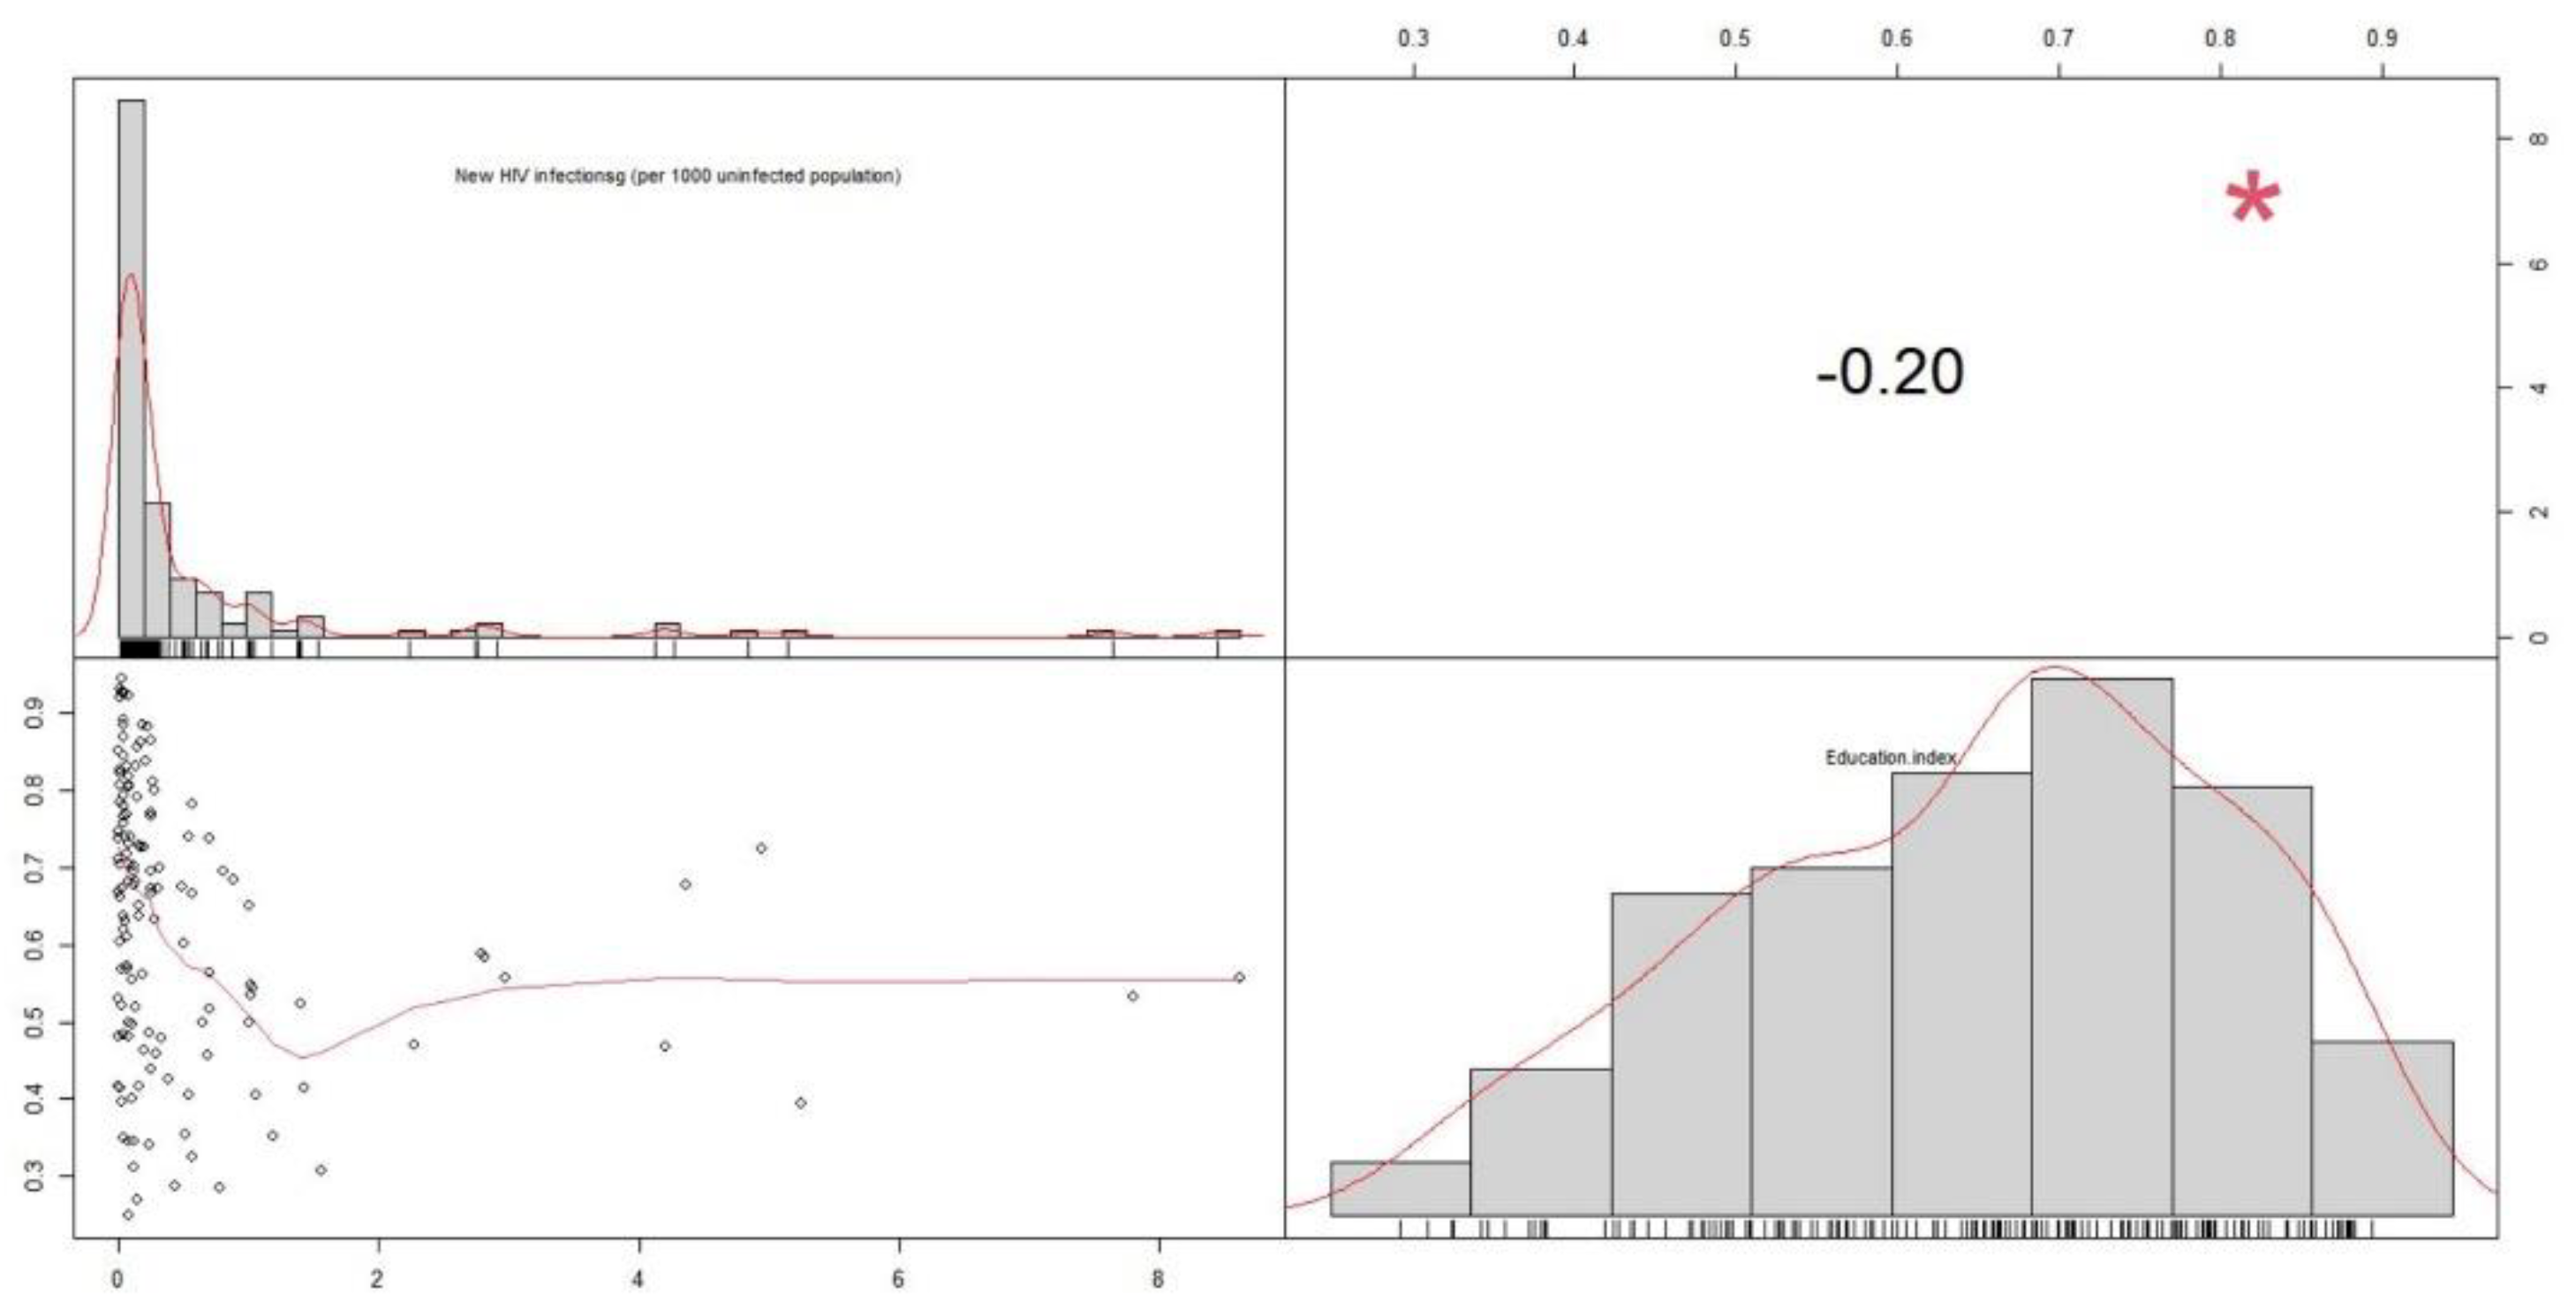
| data: Data$New.HIV.infectionsg..per.1000.uninfected.population. and Data$Education.index t = −2.3931, df = 138, p-value = 0.01805 alternative hypothesis: true correlation is not equal to 0 95 percent confidence interval: −0.35380321 < m < −0.03486831, m: Confidence Interval Estimates sample estimates: cor −0.1996169 |
| - | Estimate | Std. Error | t(p) Pr (>|t|) | F(p) | R2 |
|---|---|---|---|---|---|
| (Intercept) | 72.4708 | 0.6048 | 111.845 <0.0000000000000002 *** | 37.56 *** | 0.2152 |
| STDs (HIV infection) | −3.2737 | 0.5341 | −6.129 0.00000000885 *** | - | - |
| - | Estimate | Std. Error | t(p) Pr (>|t|) | F(p) | R2 |
|---|---|---|---|---|---|
| (Intercept) | 18.570 | 1.430 | 12.987 <0.0000000000000002 *** | 11.09 * | 0.07183 |
| STDs (HIV infection) | −3.557 | 1.027 | −3.463 0.000709 *** | - | - |
| - | Estimate | Std. Error | t(p) Pr (>|t|) | F(p) | R2 |
|---|---|---|---|---|---|
| (Intercept) | 0.64960 | 0.01606 | 40.439 <0.0000000000000002 *** | 5.727 * | 0.03289 |
| STDs (HIV infection) | −0.02733 | 0.01142 | −2.393 0.181 * | - | - |
| Classification | Disease |
|---|---|
| Curable STDs | Gonorrhea Chlamydia trachomatis Syphilis Trichomonas vaginalis infections |
| Incurable STDs | Human Immunodeficiency Virus (HIV) Herpes Simplex Viruses (Herpes Simplex Virus, HSV) Human Papillomavirus (HPV) Hepatitis B virus |
Publisher’s Note: MDPI stays neutral with regard to jurisdictional claims in published maps and institutional affiliations. |
© 2021 by the authors. Licensee MDPI, Basel, Switzerland. This article is an open access article distributed under the terms and conditions of the Creative Commons Attribution (CC BY) license (https://creativecommons.org/licenses/by/4.0/).
Share and Cite
Choi, W.-H.; Huh, J.-H. A Survey to Reduce STDs Infection in Mongolia and Big Data Virtualization Propagation. Electronics 2021, 10, 3101. https://doi.org/10.3390/electronics10243101
Choi W-H, Huh J-H. A Survey to Reduce STDs Infection in Mongolia and Big Data Virtualization Propagation. Electronics. 2021; 10(24):3101. https://doi.org/10.3390/electronics10243101
Chicago/Turabian StyleChoi, Woo-Hyuk, and Jun-Ho Huh. 2021. "A Survey to Reduce STDs Infection in Mongolia and Big Data Virtualization Propagation" Electronics 10, no. 24: 3101. https://doi.org/10.3390/electronics10243101
APA StyleChoi, W.-H., & Huh, J.-H. (2021). A Survey to Reduce STDs Infection in Mongolia and Big Data Virtualization Propagation. Electronics, 10(24), 3101. https://doi.org/10.3390/electronics10243101