1. Introduction
The computer vision domain is being conquered by deep learning (DL) techniques in general and convolutional neural networks (CNN). Computer vision (CV) endures extensive research in ODT for domestic appliances, medical imaging, industrial automation, defense, and video surveillance. CV is envisioned to have a flourishing market growth of USD 50 billion by the close of the financial year 2020 [
1]. CV is executed on a high-performance cloud-based system. The application of edge devices is very similar to sensors that serve raw data equal to the cloud. CV-based Internet of Things (IoT) devices are also besieged by this DL real 3D motion-based YOLOv3 model [
2]. Visual imaging is one of the vital senses of humans, as well as stray and wild animals. Our vision is a source of witness on which we have an unshakable trust. We pick up an object while passing through an environment that represents roadways of smart cities, forests, and any other locations while travelling through the vehicle, but neither probes into mere things on the way or recognizes object faces.
Object recognition and localization are indispensable for all such tasks, which means that, while we are moving or travelling through some vehicle to somewhere, the essential thing is to monitor whether any object is coming towards us or not. If it happens, we should locate and recognize that particular object immediately for saving a life. The significant research area is monitoring Indian road crossing by stray and wild animals in both smart cities and roadsides of forest areas [
3]. The study opens the window preceded by the increasing menace for stray animals and endangered wild species on jungle roadsides [
4]. Therefore, for the conservation of stray and wild animals, a technologically competent and versatile model with problem-solving techniques is the need of the hour. One such capable model is neural network systems/CV techniques incorporated with a machine learning (ML) algorithm. This research paper utilizes the CV, ML, and DL methods to recognize, detect, or fuse both tasks. This research intends to devise a real-time oriented, optimum algorithm that could be operated on online mode. This is to detect stray and wild animals using CV techniques and further the deep neural network (DNN) to detect the same. The research scope is restricted to detect untamed stray and wild animals in smart city traffic and roadsides of jungles. A market study conducted by information handling services (HIS) automotive proclaims that the global market for gesture recognition within cars is speculated to reach an altitude of more than 38 million units in 2023, which is far ahead 700,000 in 2013 [
5]. Traffic safety demands an active driver–vehicle interaction, i.e., the driver’s interaction with the vehicle when his attention is on the road.
The present-day road accidents are mainly due to deviation in driving, e.g., adjusting the car accessories, such as seat belts, tuning audio set, smartphone usage, and, most importantly, the intrusion of stray and wild animals. A higher-end version vehicle is obliged to sense stray and wild animals’ current positions and behavior for the utmost safety driving [
6]. For instance [
7], some positions and behavior of the animals are hazardous for the unfolding of airbags. The National Highway Safety Administration (NHSA) survey report says that more than 2% of fatalities result from dozy driving. It is evident that unwanted body movements, such as scratching the head, changing postures, shrugging shoulders, etc., cause doziness. Behavioral changes in stray and wild animals can be monitored by tracking them over time and preventing any mishaps caused due to human error before its occurrence. The Smart Eye concept mandated this research article to apply inventive deep-learning techniques to maximize the passenger’s safety by encouraging stary and wild animal–human interaction.
The raw input data are represented in the form of a matrix pixel to recognize the object. The pixels and encodes are conceptualized by the first layer of representation; the encodes edge arrangement is integrated with the second layer; the encodes eyes and noses are layered in the third layer. The face in the image is recognized by the end layer. The process of DL usually categorizes the facial features according to their levels without much guidance. CNN [
8] disregard manual feature extraction in object classification applications, and hence manual image classification does not require feature identification. There is no direct extraction of pre-trained images from CNN; however, during the training of the network on gathered images, these images learn. The accuracy of DL models is high in CV because of automatic feature extraction. The models of deep CNN architecture are intricate. It needs large image datasets for improved accuracy. CNN requires huge labelled datasets to carry out similar CV tasks, such as classification, ODT, and object recognition. Futuristic technology and accessibility of powerful graphics processing units (GPUs) [
9] have induced DL on datasets motivating the researchers to use it in areas, such as classification, object detection, and tracking (ODT), as well as recognition of objects. DL calls for dynamic computational resources and massive datasets for the performance of training and testing.
The main objective in generic OBT is to determine if there is a presence of any object from a particular kind (for instance, animals, automobiles, and walkers) in an image; the spatial location and a single object distance are returned if any object is present (using bounding box). The detection of an object has proved to be an essential source to resolve excessively complicated tasks related to vision, such as ODT, knowledge of situations, captioning of the image, semantic and instance segmentation, etc. Internet of Things (IoT) and artificial intelligence (AI) [
10] are the ancillaries of object detection applications. IoT and AI incorporate security, defense surveillance systems, self-driven cars, robotic vision, domestic devices, and human–computer interaction (HCI). CV algorithms can be fetched from an open-source computer vision library (Open CV) [
11]. Erstwhile, enhanced images that are supposed to be used on embedded devices can be brought from libraries. An optimum solution would be to manipulate the breakthroughs offered by DNN that permit image classifiers to self-learn the image features in the course of supervised learning. The entire original work has drained into the cloud server in a typical environment. However, all the implementation in an embedded vision application is performed on the embedded device, thus sending only the essential data to the cloud server.
The dire need to construct models capable of perfect monitoring of stray and wild animals in a wild ecosystem is well-defined in this research. The variables of ecosystem monitoring can minimize the involvement of humans in species recognition from the captured images. The image captured at night in poor weather is the variable that is liable for the low image quality. Hence, daytime is always optimum for capturing and detecting the images of stray and wild animals. The distance of the camera and interference of miscellaneous objects would obstruct the species detection [
12]. These complications are faced by humans and the computer system that surrounds a DL model. In fundamental research, ODT problems are addressed and rectified by designing a perfect detection model.
Neural network-based DL systems for accurate two-dimensional (2D) object detection have been progressing well. As far as vehicle driving is concerned, everyone aspires for a three-dimensional (3D) space, since distance estimation between objects is of paramount importance. Though the spheres of object detection are flourishing, there is no notable performance gap in less dimensional data. The utmost aim is to automatically recover complete 3D surfaces of objects from a sole unrestricted image “in the wild” [
13]. The confined nature of embedded systems needs computationally intelligent algorithms. Humans’ best practices describe the two factors of the well-designed 3D deformation: the first thing for the changes in the model is due to pose, and the second is due to individual’s shape differences. Nonetheless, most earlier works learn such models using various registered 3D object scans of different shapes and poses. However, those things cannot be demonstrated in animals since bringing all the animals into the lab for scanning is impossible, especially with wild and ferocious animals.
Moreover, stray and wild animals cannot pose at the time of scanning. An artist can create 3D models of those animals. However, it is too costly and may not be realistic. Alternatively, natural images of animals can be easily obtained. We have proposed a model R-3D-YOLOv3 for learning a 3D deformation designed explicitly for rectifying the postural changes with the help of a set of user-annotated 2D images and template 3D mesh [
14]. We have switched from kinematic skeleton to model pose because the fabrication of such a structure warrants previous knowledge about how stray and wild animals deform. Instead, articulation with the incessant rigid field administers the deformation permitted for every local area. The perception is that mostly deformable regions are rare. This was considered from several images by emphasizing sparsity on the rigid area, whereas the template undergoes deformation to get appropriated into each image. This was proved on cats and horses. Then, a shape model was learned by taking some scanned images of quadruped stray and wild animals of lifelike toy figurines. The scanned stray and wild animals are insufficient, and we know the multi-species shape model by partaking commonalities across quadrupeds. To learn a statistical shape model, responses for 3D data is mandatory. These demands schedule a standard template mesh for all the scans. However, this is challenging, as the shape difference across animal species goes beyond the difference visualized between humans [
15].
Above all, when the human data for shape learning contain numerous people’s scanned images in a regular neutral pose, these toys possess distinct shapes and positions. We proposed R-3D-YOLOv3, a multi-stage registration process in which an innovative analytical shape model is applied to align scans by resuming the process approximately. While appropriating, the silhouettes are used to get perfect shape fits. Though the training is performed on toy scans, our model summarizes the original images of stray and wild animals with well-captured shapes.
Objectives of the Paper
A skeleton of stray and wild animals as images is considered ODT through CV techniques and DNN using R-3D-YOLOv3.
The results of R-3D-YOLOv3 examined the training dataset that comprises DNN for detecting stray and wild animals using a 3D model in the Indian context.
The system is real-time oriented and works on an embedded platform to stimulate image recognition and general ML capabilities, which are resource-bound.
We have designed a framework for tracking random ODT of stray and wild animals and body features.
Detecting stray and wild animals aims to attain greater accuracy and competence by creating robust R-3D-YOLOv3 object detection algorithms.
The primary objective is to compare the accuracy and time efficiency of innovative CNN for R-3D-YOLOv3 models, and to create and train highly performing 3D models in stray and wild animals ODT presented by the training dataset at the time of vehicle driving.
The rest of the paper is organized as follows.
Section 2 discusses the related works of various traditional object detection methodologies that are available to observe roadway crossing of stray and wild animals by classification and filtering methods.
Section 3 consists of the proposed R-3D-YOLOv3 methodology for identifying road crossing stray and wild animals to avoid accidents while travelling through the roadway.
Section 4 contains complete experimental analysis for classification by using CNN training dataset, and
Section 5 contains the conclusion part of this research article. At last,
Section 6 shows the future work related to the present research methodology.
2. Related Works
Visual object detection-based research studies have earned fame in yesteryears because their application is functional and easily accessible [
16]. ODTs ought to adapt to the impacts of changing illumination, messy backdrops, and extensive shifting of image positions and scales. To get in-tuned with these complications, the researchers have developed highly edifying descriptors, influential classifiers, and training devices. Producing unfailing correspondences from detectors of generic qualities is intricate in whole objects. Hence, ODT methods typically scan a dedicated object detection window, closely packed across the image at numerous places and scales. The easiest way of this kind is called sliding window detectors.
ML originated in the early 1950s is not earlier than the invention of the first electronic general-purpose computer. Alan Turin implemented the first Turing test to detect if a computer can think or be one step ahead of that if a machine can “learn” [
17]. Doctor Turing asserted that the time machines could “think” and “learn,” ultimately passing the Turing Test. Inspired by this idea, many scientists started exploring “Artificial Intelligence.” Arthur Samuel was the pioneer of writing the checkers program, which is usually learned by playing against human opponents, standardized its approach, and finally defeated human players at the beginning of the 1970s. This artificial intelligence (AI) [
18] took a paradigm shift and is now called by everyone as ML.
The multiple ImageNet trained datasets comprise 1000 distinct classes for the classification task and 200 classes for detection by the yearly use ImageNet Large Scale Visual Recognition Challenge (ILSVRC). The challenge witnessed a remarkable performance growth in 2012 during the researcher’s first entry into a CNN. A decline in the Top-5 classification error from 25.2% to 15.3% and the localization error from 50% to 34.3% could be made possible by them. From then, the convolutional neural networks of greater depth control the ILSVRC [
19].
DL is a methodology to deal with a multi-layered neural network that is very difficult. There is no universally accepted definition of DL. Typically, it could be considered a DNN to be something too large for the processor to train. It would not be able to fit the data set into memory since it would be too large and required for the graphics processing unit (GPU) to speed up the training process. Whereas CNN can indeed be deep or shallow, depending on whether it adheres to this “feature hierarchy” structure, some neural networks, such as 2-layer models, are not deep. ML tasks can be classified as the following: supervised, unsupervised, and reinforcement learning. Among them, our research uses the techniques of supervised learning in our models. In simple terms, supervised learning is illustrated as learning a function f:X→Y, to signify the mapping of a given input X into a forecasted output Y. Taking into account the examples, a forecast of prototype’s output as Y and later adjusted the parameters as the forecasting goes to the proximity of ground truth Y. The repetition through examples helps the model to correct it until its appropriation with the data [
20].
The artificial neural network (ANN) [
21], which is inspired by biological neural networks, contains artificial neurons. Bearing the examples in mind, an ANN that is similar to supervised learning could learn the essential features of the same issue it attempted to resolve. An image is fed into totally concealed and connected multi-layers, entirely fabricated with a set of neurons. The data used to forecast classifications or regression tasks are forward-propagated until the output layer. The factors used to estimate the function f:X→Y is known as weights and biases.
Since the establishment of ML [
22], image classification has become a prominent research area because it is a fundamental method for machines to intersect with the material world. The initial step for machines to acquire action-based intelligence is the recognition and remembrance of objects in images. The primary ML approaches used single-layer systems for feature extraction and image classification to resolve classification issues. In the late 1960s, due to the setbacks in the approaches, such as accuracy and system execution, the research was paused. In 1988, CNN’s devised at Bell Labs was a smashing hit in supervised learning, thus becoming famous. After that, several systems, such as the check reading system set in the United States of America and Europe in 1996, exploited CNNs [
23].
The conventional CV applications are centered on custom-built algorithms to identify specific objections in images. In recent years, conventional ODT algorithms outperformed CNNs and some other learning approaches in several image detection tasks. Conventional algorithms are contrary to DL methods because the modern techniques are widely trained through examples for recognizing unique object classes [
24]. The CNN works on advanced machines/general-purpose computers, with a paradigm shift in pushing these actions to the end devices. The emergence of dynamic, cost-effective, and efficient energy processors is trustworthy. The accomplishment of numerous groundwork causes embedding these functionalities into user/embedded devices, thus naming it “embedded vision.” It serves CV applications with embedded devices. Hence, the term embedded vision explains CV’s real-time application in embedded devices to facilitate environment identification using visual perceptions.
The primitive phases of 2D and 3D object detection and tracking consist of the highly advanced approaches that were mostly handcrafted and given as input for standard classifiers, such as the support vector machine (SVM) [
25]. These sorts of techniques are superseded by DL approaches where the CNN trains the classifiers from the data. Though this method is easily understandable, it is still vague so that the architecture and feature representation could correctly detect the object because predicting the CNN learning process’ behavior is challenging. For ODT-animated objects in the urban atmosphere, the author proposes a model-free approach. Rather than trusting in detecting changes in the atmosphere induced by motion, the author classifies different objects with motion signals.
The researcher [
26] proposes a multi-level random sample consensus (RANSAC) algorithm that increases computation speed. Multi-level-RANSAC decreases the number of hypotheses with a compatibility matrix and gradually enhances data association and estimation performance. The algorithm does the effective tracking of moving objects by running simultaneous localization and mapping (SLAM) via data association techniques. The merit of multi-level RANSAC is that it makes use of animated objects as landmarks for localization and mapping.
To cater to accuracy vs. efficiency, the profound and closely associated backbones, such as residual neural network (ResNet), ResNeXt, AmoebaNet/fewer weight backbones (including MobileNet, ShuffleNet, etc.), SqueezeNet, Xception, and MobileNetV2 are used. Such applications in mobile phones facilitate the fewer weight backbones to meet out the needs Such applications in mobile phones facilitate the fewer weight backbones to meet out the needs [
27,
28,
29,
30]. An exclusive ODT model with real-time features was proposed by incorporating PeleeNet with SSD and enhanced architecture for improving processing speed. To change the prerequisite of accurate real-time applications, intricate backbones are a must. Alternatively, real-time applications, such as video/webcam, do not require speed-efficient processing but improved precision that necessitates a highly fabricated backbone to accustom with the detection architecture and swap between speed and accuracy.
The sole application of a CNN to localize and classify many objects in a single image is not a simple task. Theoretically, one should instead classify each object in the image individually by executing the CNN on the image’s sub-region, which holds only the recent object. This region could later be used straight away, like the bounding box, which performs object localization or further enhanced fine-tuned bounding box forecasting. Detecting the perfect region for the entire image by not detecting the objects is the greatest challenge. Mere evaluation of all the potential areas is not an ideal task, but a classified set of best guesses is optimal for use. Subsequently, a proposed selective search algorithm (SSA) is fetched to the fore for the generation of such a region. This algorithm has been used in the state-of-the-art technology algorithms, such as region-based convolutional neural networks (R-CNN) and Google Inception Net (GoogLeNet) [
31].
For performing any 3D reconstruction, the communication challenges (also known as image pattern matching) within image sets should be determined. The earlier attempts to match an image pair was originated from the stereo and optical flow that exploited pixel intensity values to discover communication levelled on relied brightness assumption. Most of the research time and knowledge have been spent constructing strong, reliable, and moderate appearance features to compete with solid-state drive (SSD), filter banks for detecting corners, silhouettes for shape context, histogram of gradients (HOG), digital audio-based information system (DAISY), scale invariant feature transform (SIFT), and vector of locally aggregated descriptors (VLAD), and much more till early 2010. The majority of works spotlight similar objects from various perceptions or succeeding video frames.
The researcher [
32,
33] attempted to design a 3D-faced statistical model by arranging 3D-scanned faces to compute a model of low-dimensional shape. There were comparatively less variations among faces than with the human body or among animal kinds leading to an easy alignment of training data. In addition to that, faces with fewer expressions present trouble-free modelling.
Furthermore, 2D and 3D depth image-oriented approaches featuring the efficacy of shape or motion or a blend of shape and motion have been discussed. The 2D shape-based methods make use of features based on shape and contour in place of action, and techniques that are motion-based use optical flow or its alternatives for representing action [
34]. The features of both shape and motion are used by specific procedures for describing and identifying action. For the execution of 3D-based methods, a human body that represents action was created. This model uses cylinders, ellipsoids, visual hulls, etc., which were sourced from silhouettes or surface mesh. Few illustrations were based on these models are 3D optical flow, motion history volume, shape histogram, and 3D body skeleton.
For depicting action, motion features are used by the motion-based action recognition methods after the action was recognized by a generic-based classifier. In order to represent multi-view action, a new motion descriptor, which is modelled on intensified histogram motion and motion direction with further assistance from an SVM for classification, was proposed. One more proposed model is completed with 2D patterns utilizing motion history images and oriented gradients’ histograms. The significant elements that belong to motion encoding are contained in the action recognition approach and local motion direction swaps using a predetermined bag-of-words technique.
Many researchers have ventured into researching the DL stream, which is identical to this one in specific ways. Certain people tried out identification on the same dataset adopting networks of a different sort. Simultaneously, some others tried specially built capsule networks as we did, and individual people’s capsule networks were designed on either uncomplicated/complicated trained datasets. Related work in Hinton et al. deals with dynamic routing between capsules. The existing paper is a groundbreaking achievement in the Capsule network as its error rate is just 0.25% on the MNIST dataset, which is far better than the earlier high-tech models. Still, those were executed on a “simple” dataset. Saponara et al. also captured wild animals in cameras and invented cutting-edge models for unique identification with 94.9% top-1 accuracy and 99.1% top-5 accuracy, respectively [
35].
For collecting information from the real world, the camera is a brilliant and low-cost option. The real-world image is projected on a 2D plane absorbing the light intensity, and thus images are produced, and at each projected location, frequency is detected. The values of the probable locations are saved as red–green–blue (RGB) pixel values [
36]. This indicates that information regarding the distant objects is missing since the regular 2D images have no depth. As the distance between objects is one of the essential demands in perceiving autonomous driving, usually 3D-based ODT models use cameras as sensory input. Besides, light differences and climatic conditions are accountable if cameras are used as input sensors. Different colors indicate different information at each pixel in the images; two images from the same scenes and different weather differ significantly.
3. Proposed R-3D-YOLOv3 Methodology
Many research works were completed following the initial idea with breakthroughs, and different algorithms were discovered and fine-tuned. The most significant breakthrough came in CNN when the researchers rediscovered the back-propagation algorithm, and its benefits are applied to the entire field of ML. Using CNN, a model is developed against the human brain, named “Deep Learning”. Some of the types of ML are supervised, unsupervised, and reinforcement learning. CV and image classifications are coming under a supervised learning problem, and it is an important region in recognizing the objects to gain knowledge about criminal intelligence in order to extract the features and classify the images. Recently, CNN has multi-layer neural networks to achieve greater accuracy with computational resources [
37,
38].
Figure 1 represents the systematic representation of the R-3D-YOLOv3. CNN is induced to extract the feature for pre-processing (Gaussian smoothing function) the input image (in 2D form of image ranges from 0 to 255) and recognize what type of object is nearer. During pre-processing, the noise present in the captured image is removed at this stage (Denoise). Initially, the camera captures images for analyzing the framework from moving objects. The color image is transformed into a grayscale image that extracts the values in the form of pixels. In DL, the extracted features are classified and given to the activation function to identify the object. After extracting the features, it goes for the pooling layer, which produces an output that identifies the feature map. The output image is specified to a 3D CV multimedia converter by feature map for converting the object from a 2D image to a 3D image. The identified object has displayed the form of 3D representation at the output layer.
3.1. R-3D-YOLOv3 Mathematical Model
The R-3D-YOLOv3 method utilizes the ODT as a neural network. The class probabilities and image boundary limit offsets are directly predicted from detected images with a 1 × 1 feed-forward CNN. The image eliminates the development of the regional proposed plan and resampling of the feature, and captures all the phases in a single network for devising a simple edge detection method. The R-3D-YOLOv3 polarizes the image into a 3 × 3 Matrix. When an object’s center drops into a source image, the classification algorithm detects the object. Each 3 × 3 matrix forecasts the Bb image boundaries location coordinates and determines the object scores corresponding to such input vectors. The declaration can be completed for each object score:
whereby
is the object score of the
yth,
Bb in the xth 3 × 3 matrix.
is simply an object’s function. The
represents the image merger between the expected and original image boundaries. The R-3D-YOLOv3 procedure includes an assumed and original object that results from a 3 × 3 Matrix due to the image detection feature. The statement can be displayed:
Each border-limit direction is divided into four predictions:
pi,
pj,
pk, and
pl, presuming that (
OSx,
OSy) is the offset from the image’s top-left corner of the vector point. The centrifugal point of the last image limit of the image’s top-left corner is offset.
whereby
is a shaped curve function. The width and height of the predicted 3D image limit are measured in terms:
where
Pwidth and
Pheight are the width and height of the image shape limits, respectively. They are detected by 3D
k-means clustering.
The ground original OS consists of the following parameters
, which correspond to the predicted parameters
,
respectively. The resultant values
can be denoted by:
The mean squared error (MSE) of coordinate prediction is used by the R-3D-YOLOv3 method as one part of image detection loss as expressed:
3.2. Working Method of R-3D-YOLOv3
You Only Look Once (YOLO) released versions for splitting the feature map into the grid, setting bounding boxes for each location. This YOLO model has not achieved the highest accuracy along with the CNN model, and it allowed less inference time with 2D object detection. Besides, the YOLOv3 model extracts different layers from the CNN model. This allows better accuracy in the prediction of smaller objects too. The tiny fast YOLO (TF-YOLO) design is incorporated into R-3D-YOLOv3 for multi-scale detection, k-means clustering, and fusion to detect the moving object. The workflow of R-3D-YOLOv3 is as follows:
Initialize center c1 dataset X;
Next center ci;
Calculate distance D(X) between c1 and ci with probability;
;
For i = {c1, c2, …, ck}, where i = {1, 2, …, k};
To find the closest points in the cluster ;
Repeat steps 5 and 6 until C converges;
This creates clusters to classify animals that are detected across the road.
3.3. Embedded Computer Vision
CV applications have historically been focused on explicitly developed algorithms that have been carefully programmed to identify particular types of objects in images. Recently, however, in several image development competence tasks, CNNs and other DL methods have proved to be much more superior to conventional algorithms. DL methods are generalized learning algorithms trained by examples to recognize a particular cluster of objects compared to conventional algorithms. Still, on higher-end machines/general-purpose personal computers, CNN has been operating with the tendency of these acts to be transferred to end devices. Due to the introduction of energy-efficient and low-cost pro-processor, this is turning into a reality. To embed these functionalities into end-user/embedded real-time applications, more work is being performed, which is known as “embedded vision.” The CV real-time applications are fully served with embedded sensors.
The Jevois framework operates to capture the camera sensor’s video to identify the camera processor’s machine vision model. The results are streamed through the USB to serial and then to the micro-controller. Jevois is C++17-based software for real-time CV on running cameras live with a Linux operating system. This method is constructed for complex machine vision using re-usable components with tunable runtime parameters and produces a new framework for detecting animals in the 3D view while travelling. This software framework consists of a USB gadget driver, user interface classes, and kernel-level full-featured camera chip driver to detect data flow from the camera to the processor.
Optimizations for Embedded Vision Classification
The utilization of embedded vision applications produces more difficult computational issues for dense data processing. For example, image classification has limits in designing vector processing to optimize the classifier. These different methods are available in numerous optimizations: binarization, network structure modifications, and precision adjustment. Here, precision adjustment is used for adjusting the precision value for classifying the animals with other moving objects.
3.4. Object Conversion 2D Implies R-3D-YOLOv3
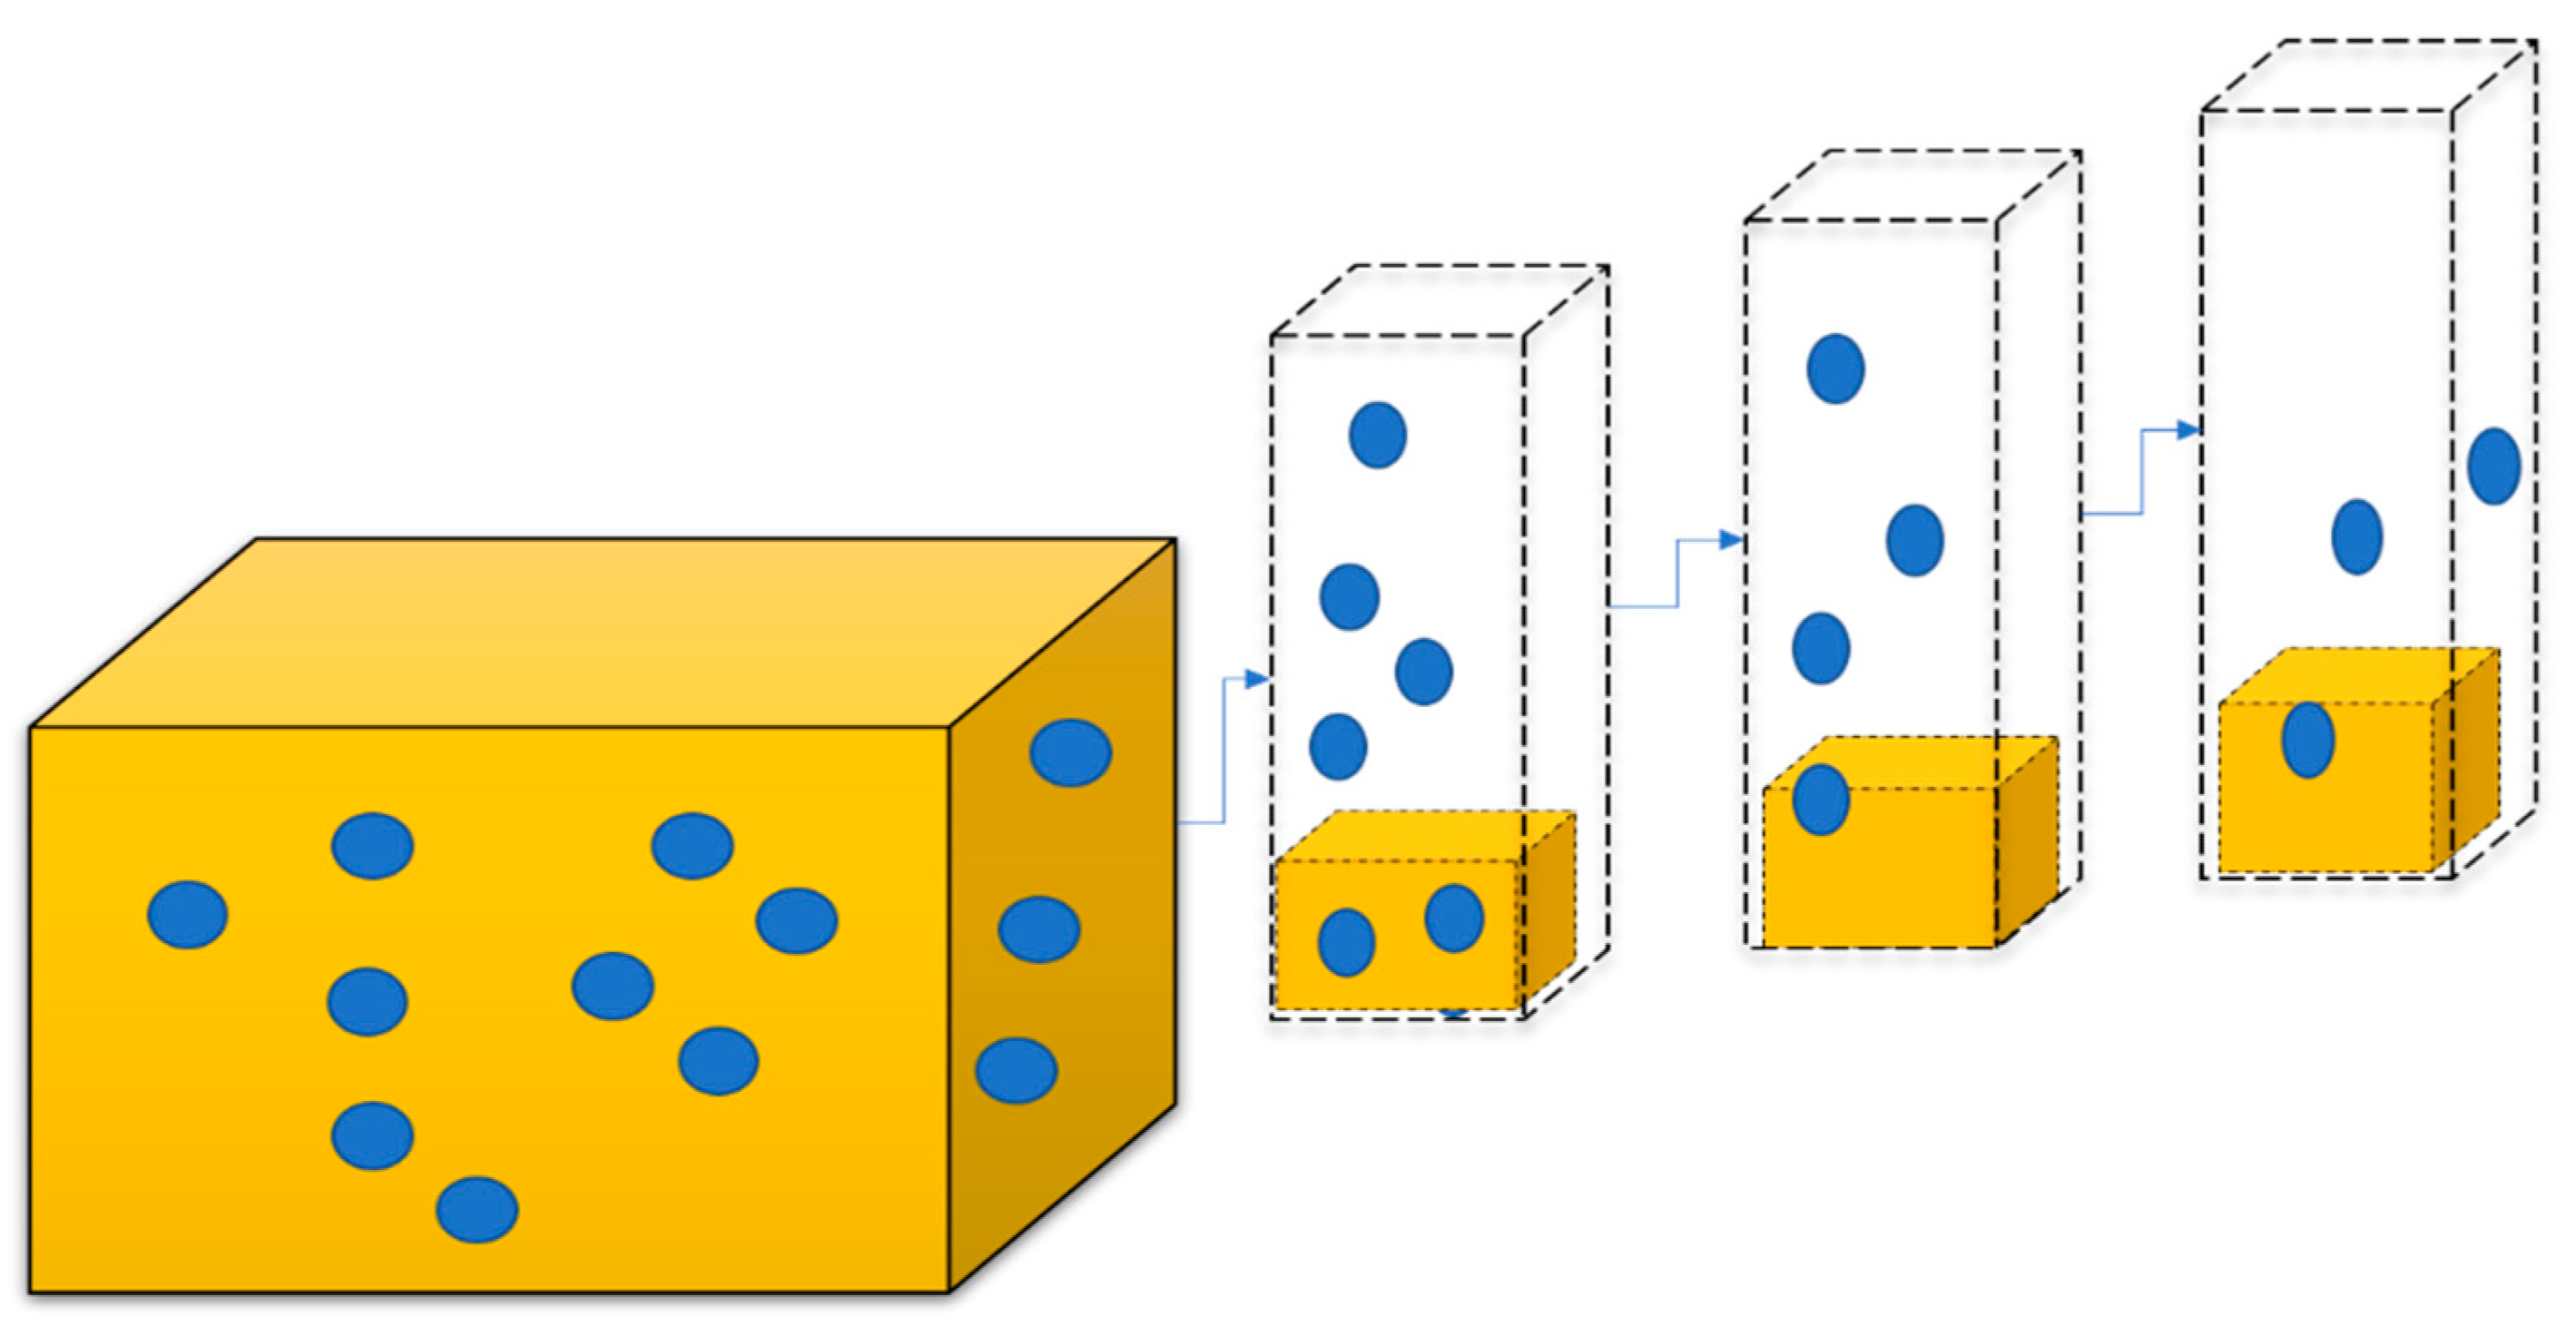
This proposed R-3D-YOLOv3 model produces 3D object detection expressly pointing towards the data with its position led by convolutional filters through YOLO (feature extraction). It encodes the data representation with values that exist towards every location by software over the air 3-dimensions (SOTA 3D) to use object detection methods. This creates bounding boxes to match the animals nearer to the vehicle with additional dimensions for regression targets. The complex R-3D-YOLOv3 joins with 3D-ODT, which projects grid image, as shown in
Figure 2.
Data Sets
We train many data sets by collecting various inputs (in different animal positions) available in public datasets for research purposes. We consider animal images in 3D view to train the model to detect images in 3D view and create a virtual representation by comparing it with the real-time keyframe of the animal images. These images are almost used when driving on the road, whether in the smart city/forest. The two most publicly accessible 3D-ODT datasets, KITTI and nuScenes, are introduced in this section. In this article, KITTI was not expressly used, but it is presented here because of its presence in many models. Here, the nuScenes dataset is used primarily due to the availability of substantially more data compared to KITTI.
The KITTI dataset was published by the Karlsruhe Institute of Technology and the Toyota Institute of Technology in 2012. Since its inception, it has been widely used as a standard for comparing DL-ODT functions within autonomous driving among researchers. The entire training dataset consists of approximately 15,000 roughly and evenly divided trained data samples into a training and test collection. The training data were obtained by two front-facing cameras (stereo) and a 360° light detection and ranging (LiDAR). Here, we recognize the animals, and official tests were executed for this model. The NuScenes dataset also consists of a 360° LiDAR scanner to view images by placing six cameras all around the vehicles that are in moving condition. Once the basic process of training a dataset for CNN contains more than 10,000 trained datasets, the machine can start analytical training, and everything is converted into labels. At the same time, 25% of the data set is separated for the testing process and the balance 75% for training the proposed methodology. It locates all the images coming closer by splitting scenes to train the images in order to detect the animal. It annotates 40,000 trials in 1000 scenes for training and validates the dataset in 3D bounding boxes using R-3D-YOLOv3 classes.
4. Experimental Setup
Since the targeted end devices were resource-limited, animal detection and network training are more computationally intensive processes than inference. The proposed classifier’s training was conducted using the central processing unit onboard the virtual machine.
The data set, for example, was changed to meet our needs for training purposes and then compiled as described in this section. The network was then trained using the parameters as in
Table 1.
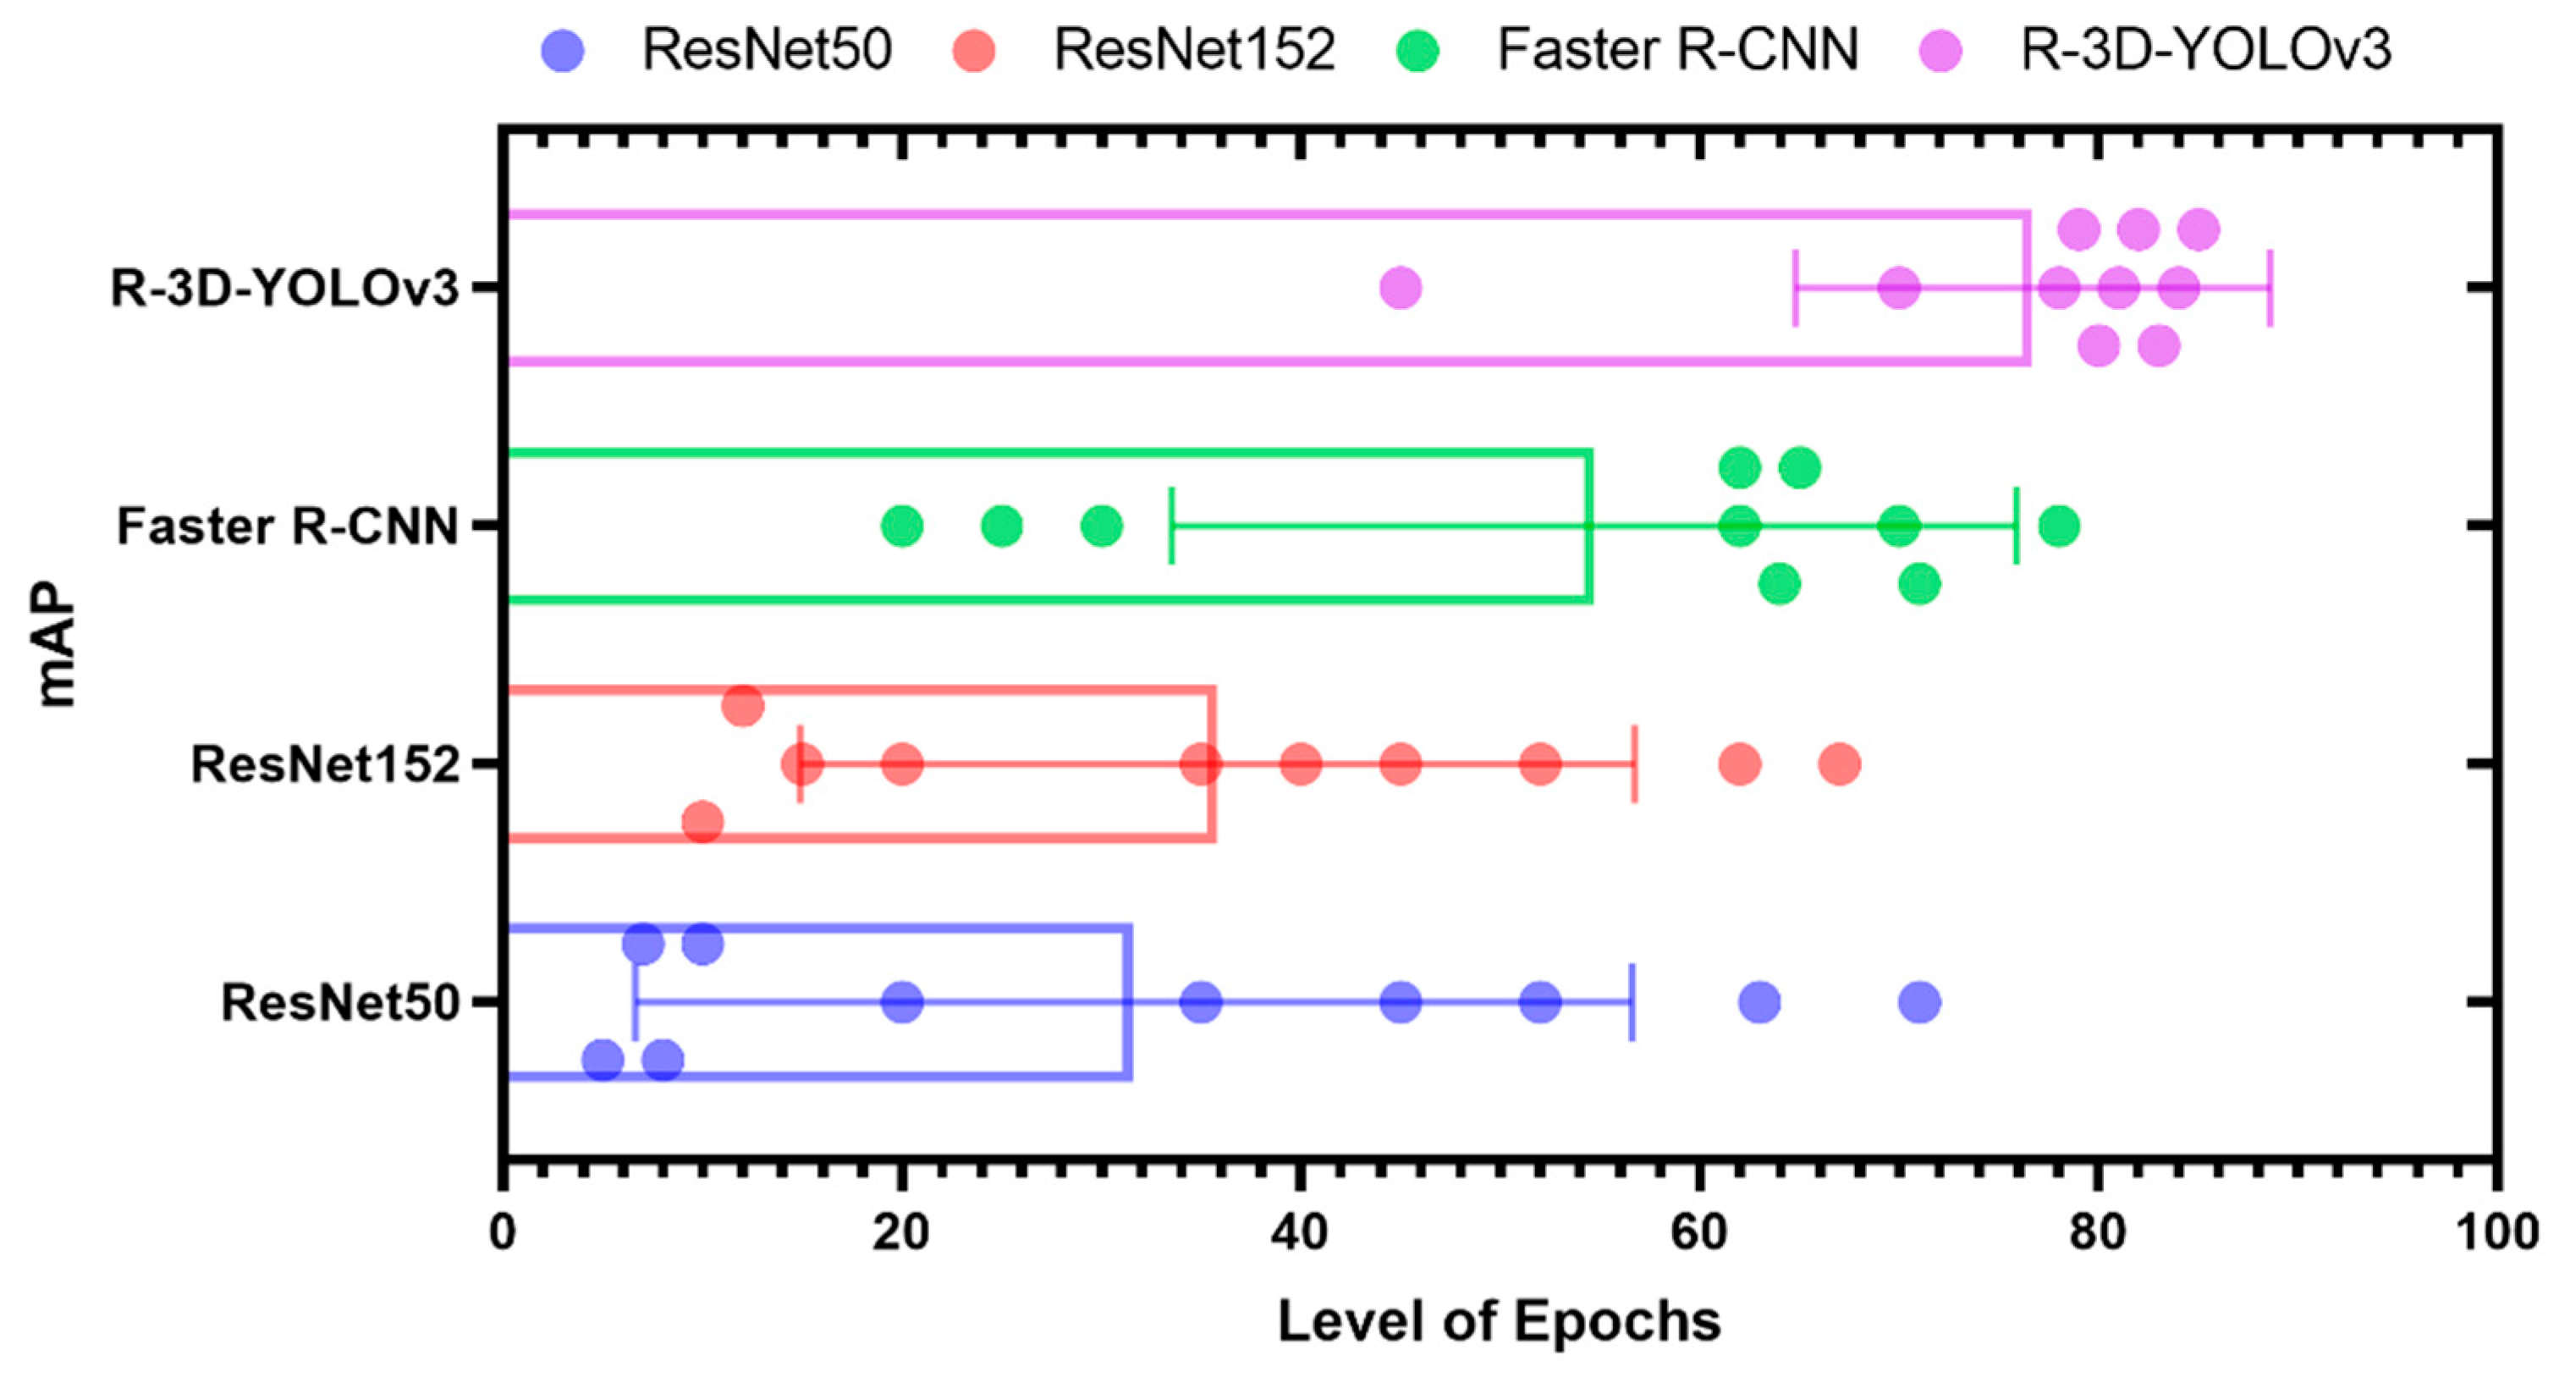
The following data is received in mAP for Epochs in
Table 2.
Here, we trained the images of animals, such as cats and cows, with various samples at different positions. This was submitted to the model to train the data to set subject to epoch, which indicates the number of passes that the dataset should undergo in batches. We give 1000s of samples as a batch for processing (
Figure 3). The proposed model is compared with various existing models, such as ResNet50, ResNet152, and Faster R-CNN. In this proposed model, R-3D-YOLOv3, along with CNN, produces a better precision output.
Object Visibility
nuScenes have an annotation visibility level for all objects which depends on the distance. It is represented in the form of a percentage and how much distance is obtained closer to the vehicle. Five levels depend on how the camera captures the image and how it is imputed into the proposed model.
Table 3 provides the level of visibility and detection of an object at a particular distance.
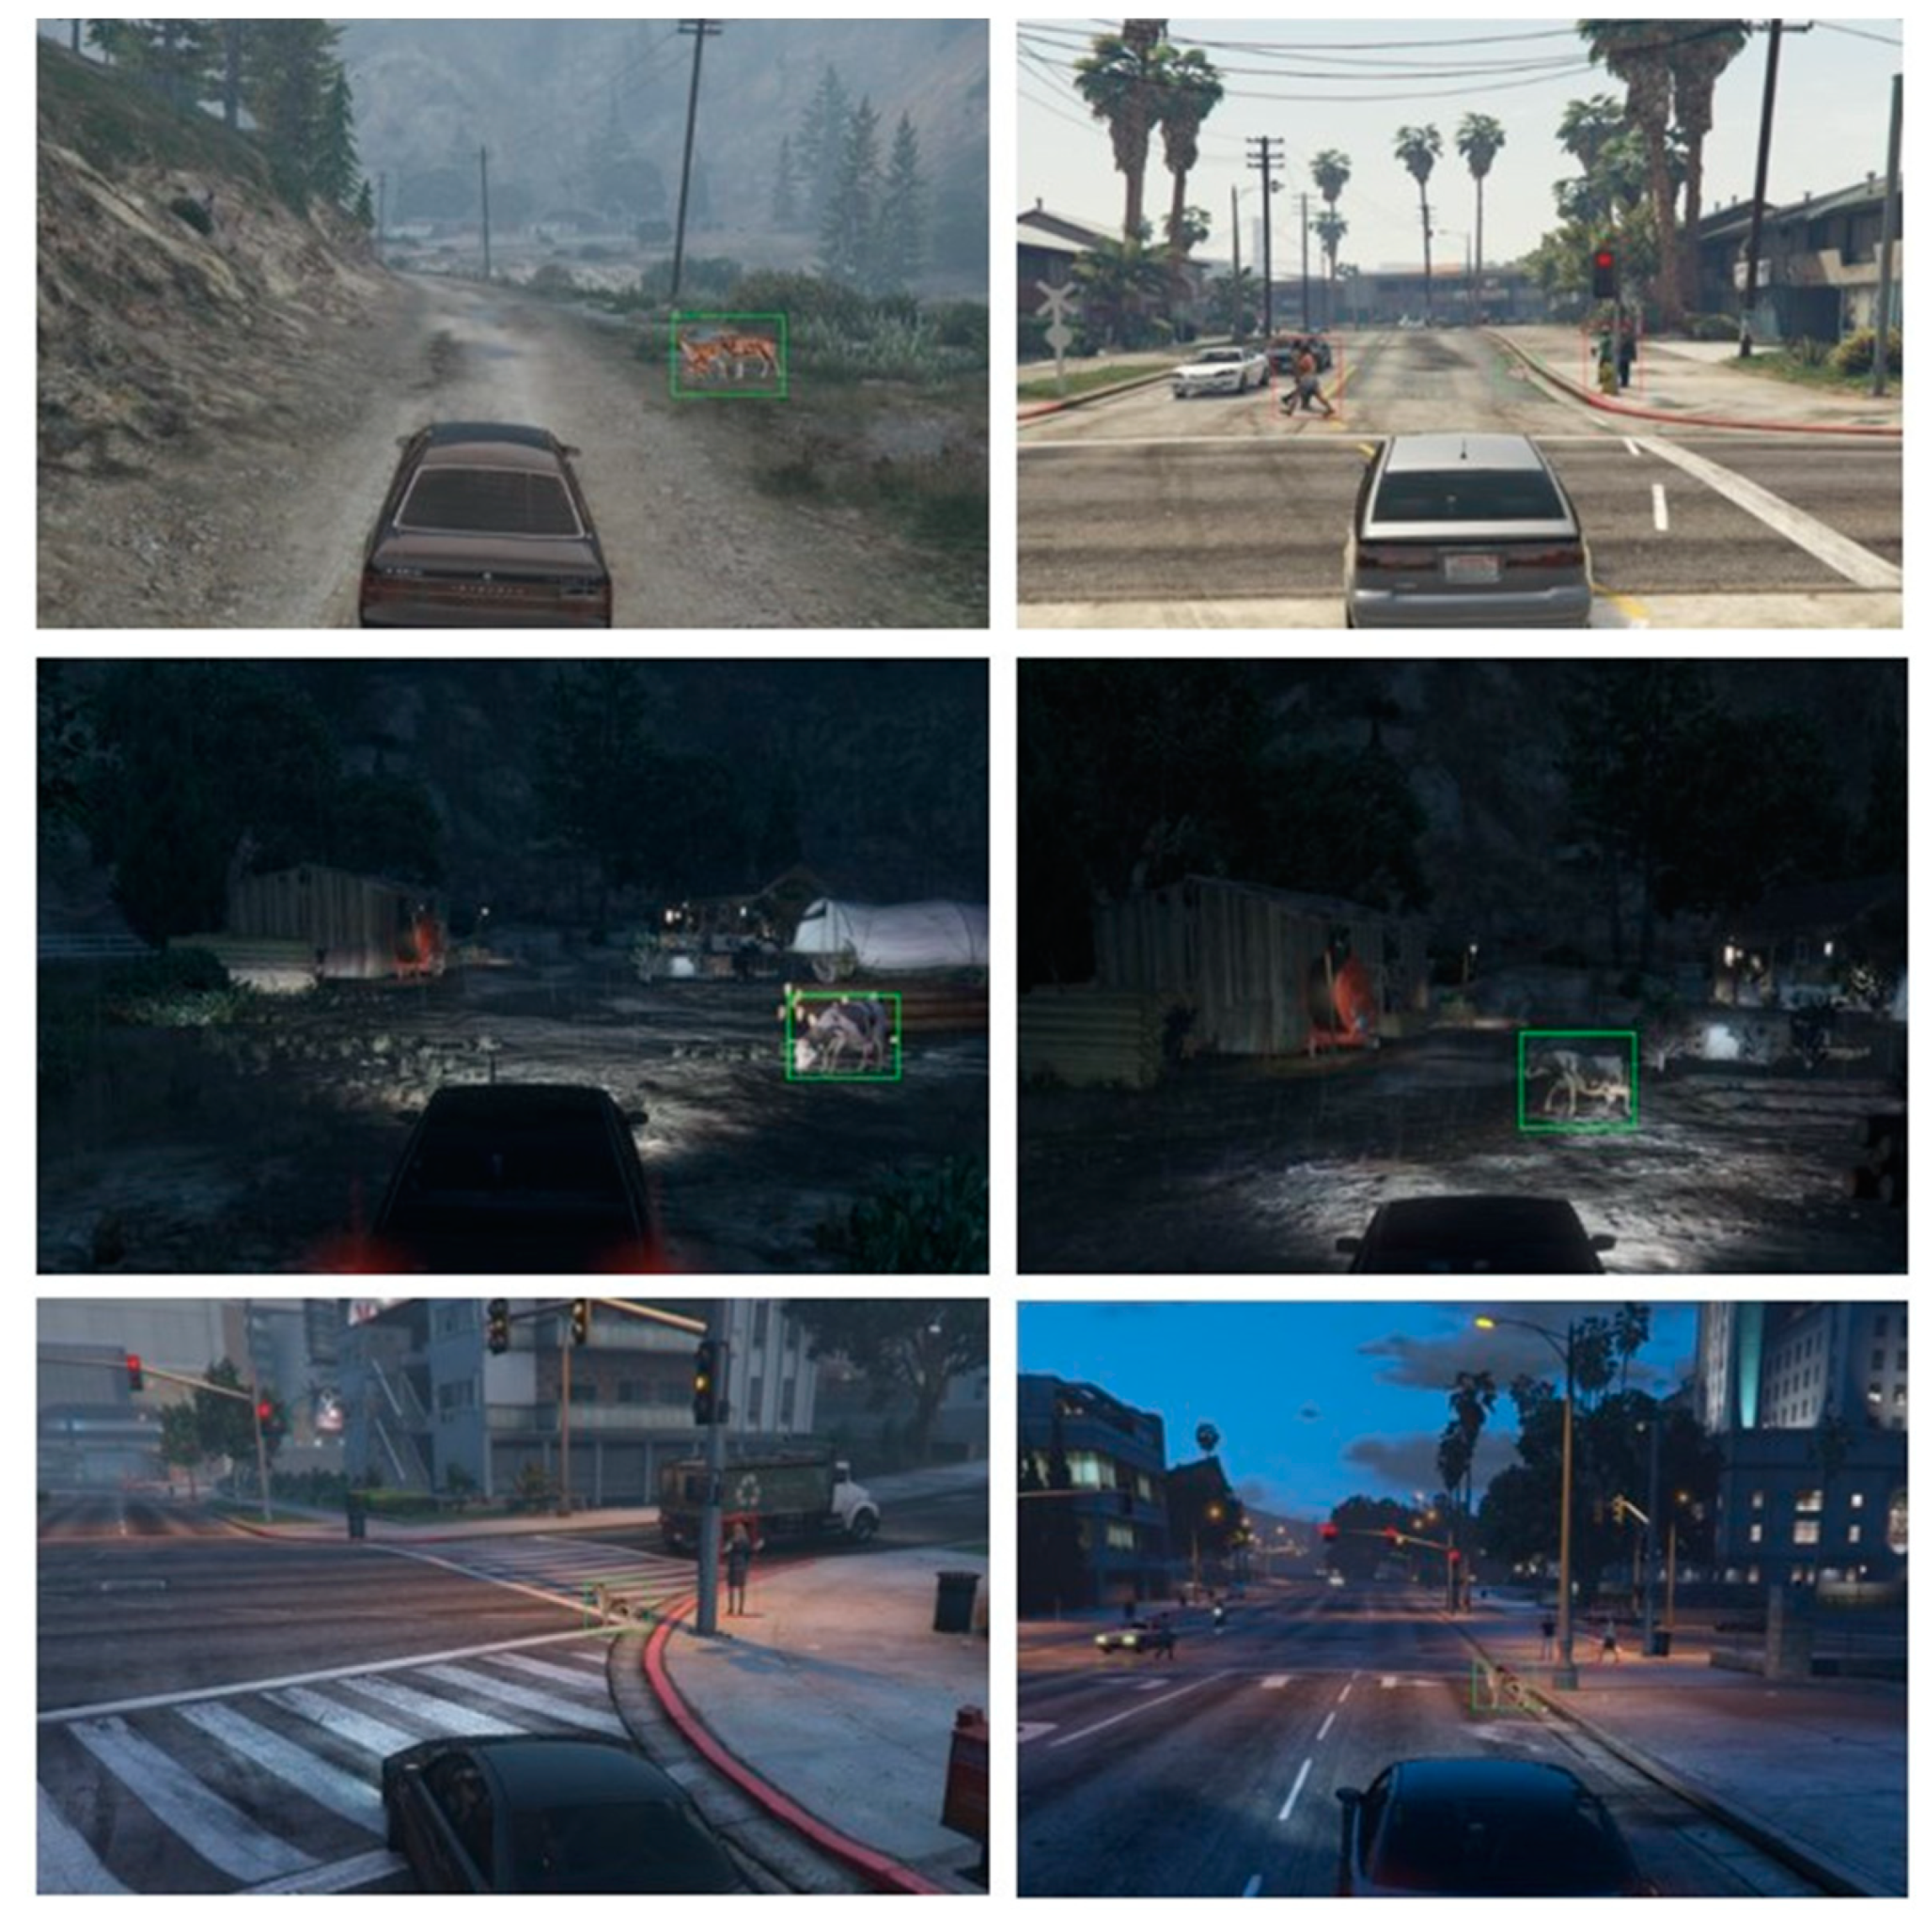
In
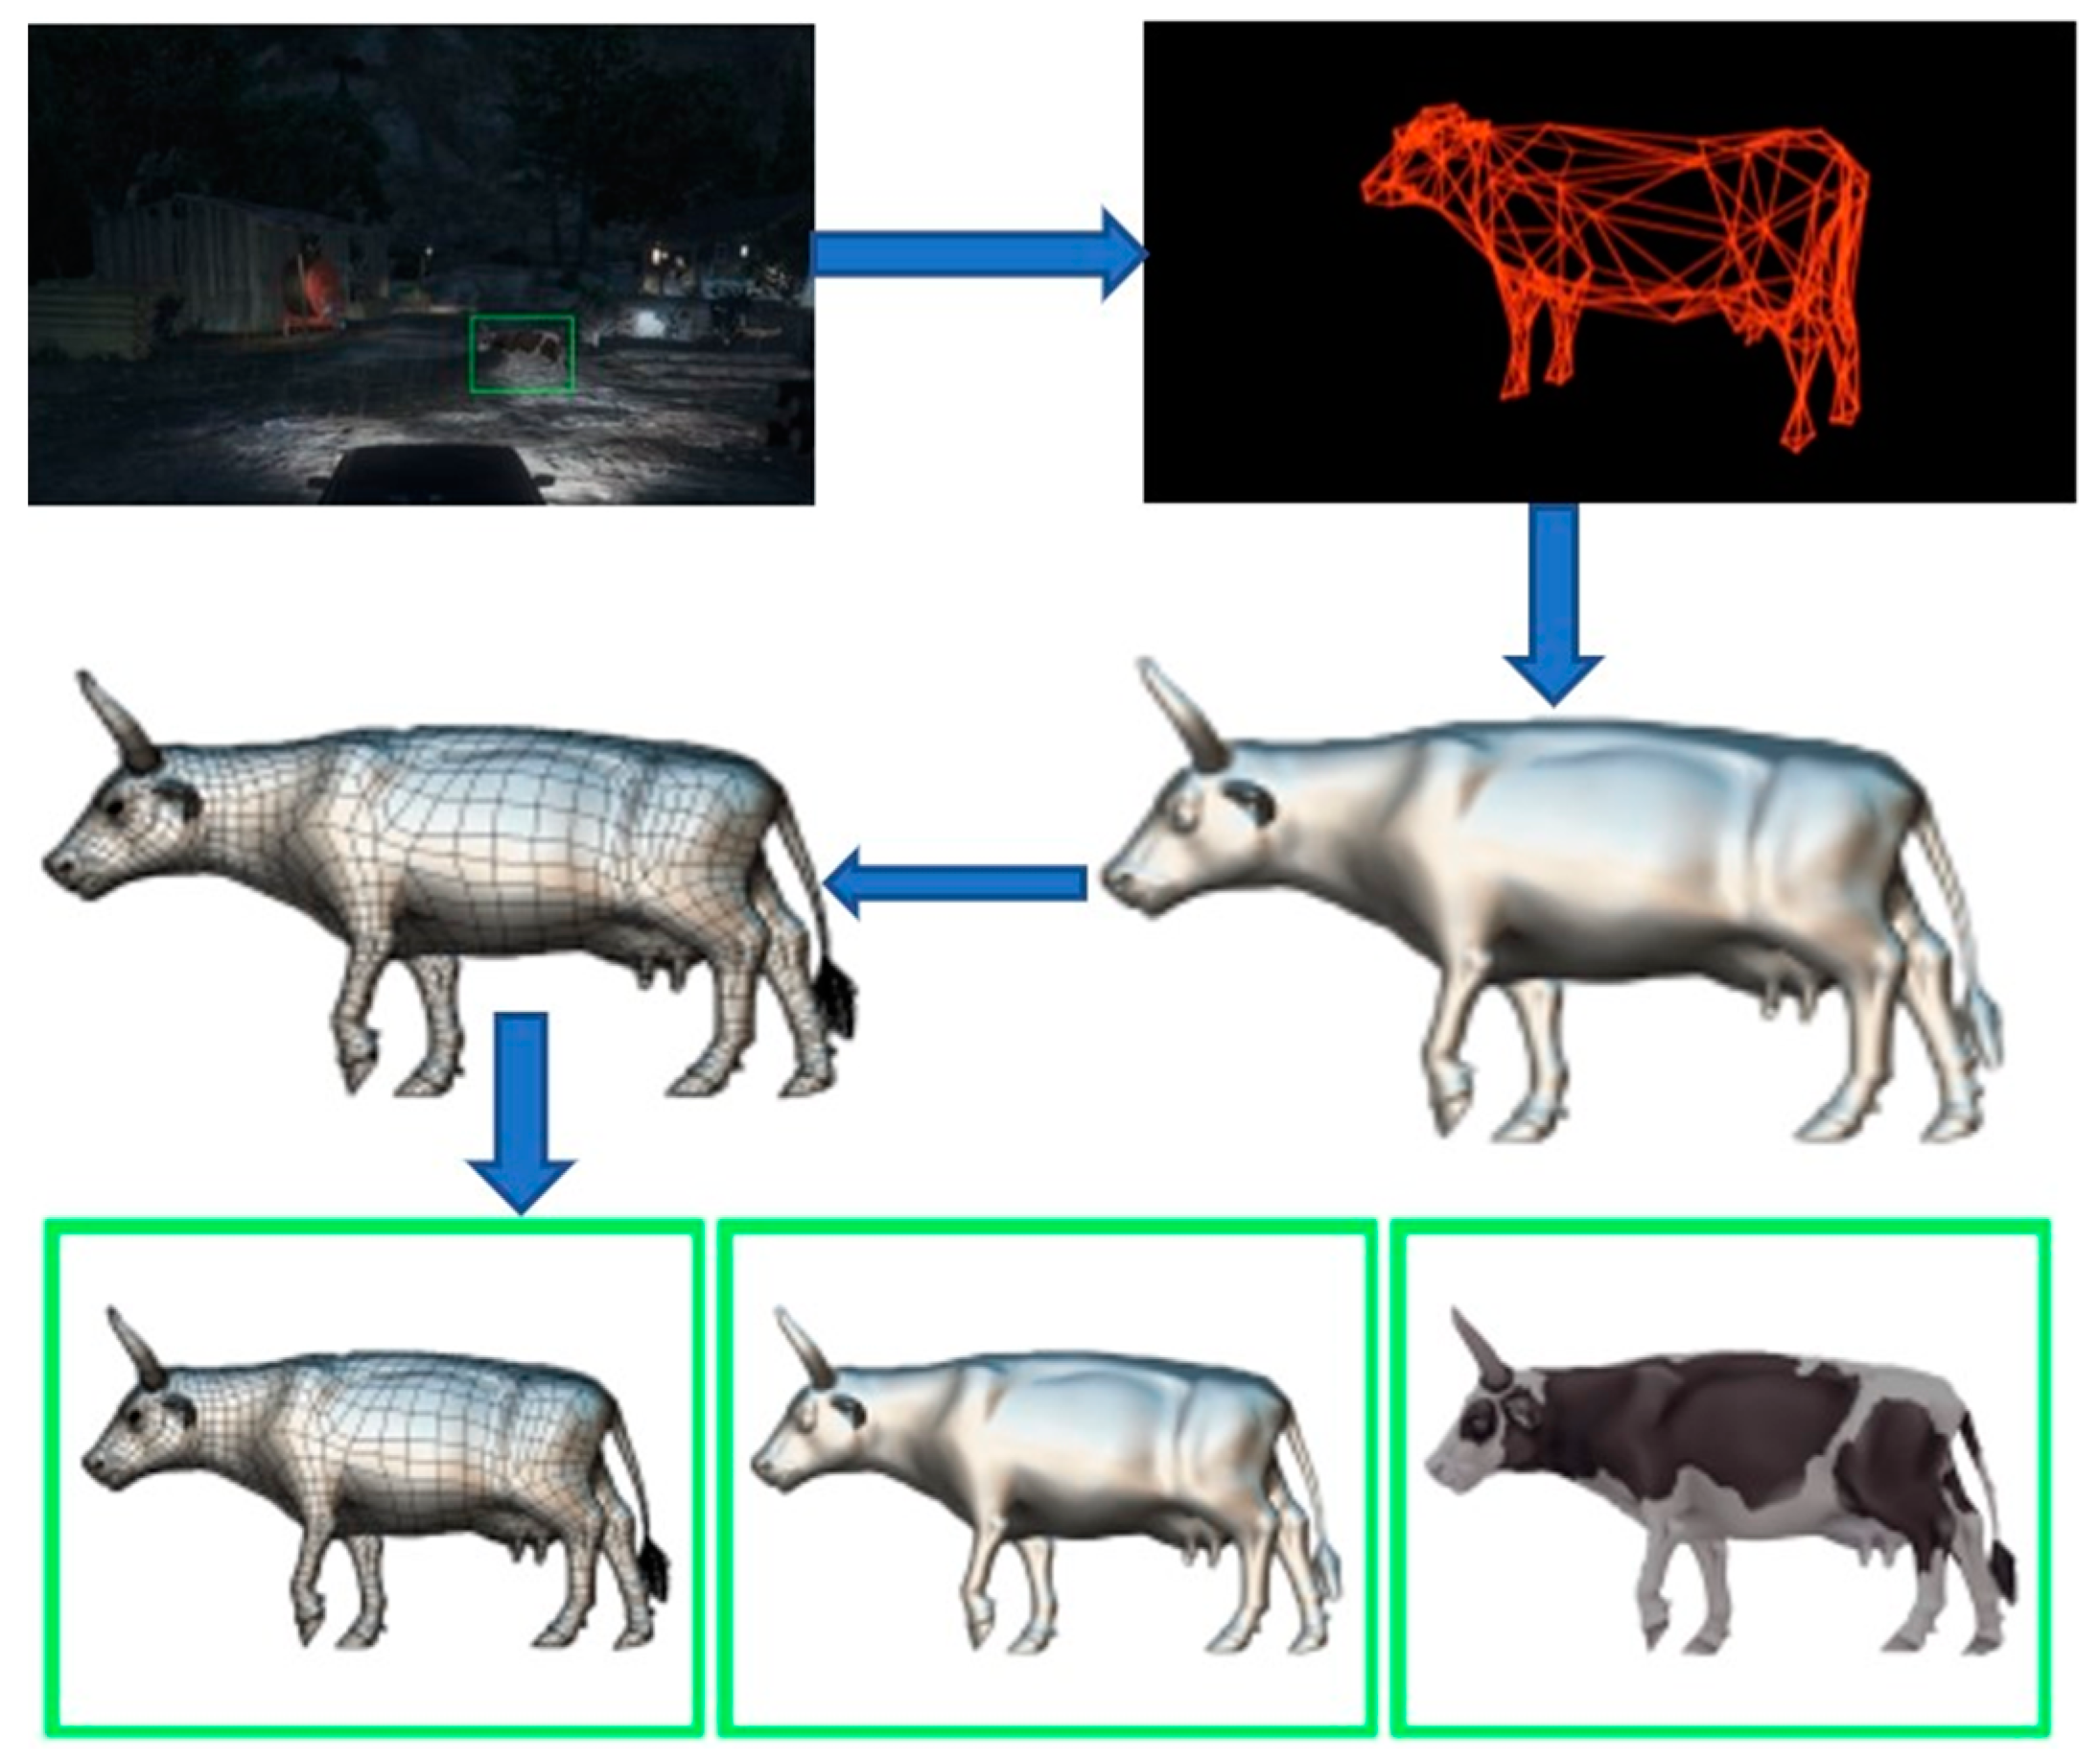
Figure 4, the model is executed with both bright and dark lights. The model identifies the animal and humans, which come nearer to the vehicle. The objects are detected, and two types of bounding boxes (green and red colors) are generated. The moving object is detected using R-3D-YOLOv3 with the CNN DL method. The detected object is displayed as the 3D animated object from the 2D input image to the output layer using filters over the feature extracted boundary boxes in
Figure 5.
The model learns advanced CV and graphics by collecting 3D images in high quality using the Autodesk 3Ds max tool with deep commercial sensors. To determine the object’s realism, the object’s skeletal structure is extracted. However, at different poses, we should restrict the structure’s deformation by the length, and local stiffness field learned from the set of vertex-aligned 3D meshes. We apply the method for the experimental analysis to change the user-clicked object location-based template 3D mesh in 2D images. Later, we introduce an ablation analysis that removes the crucial elements of our model for evaluating their significance and give qualitative and quantitative analyses. We experimented with two types of animals: cats and cows. In a wide range of poses, we gathered 10 Cat and 11 Cow images from the Internet. The dataset of the non-rigid world provides 3D models. These models consist of approximately 10,000 faces and 5000 vertices that are basic and transformed through a test generation program via 510 and 590 vertices’ of tetrahedral meshes and 1600 and 1800 tests for the cat and the cow, respectively.


 ,
, 


