Article

Conversion Method of Thermionic Emission Current to Voltage for High-Voltage Sources of Electrons

1
Department of Automatics and Metrology, Lublin University of Technology, 20-618 Lublin, Poland
2
Department of Electronic and Photonic Metrology, Wrocław University of Technology, 50-317 Wrocław, Poland
*
Author to whom correspondence should be addressed.
Electronics 2021, 10(22), 2844; https://doi.org/10.3390/electronics10222844
Submission received: 11 October 2021 / Revised: 11 November 2021 / Accepted: 15 November 2021 / Published: 19 November 2021
(This article belongs to the Section Circuit and Signal Processing)

Abstract

:
The stability of the electron thermionic emission current is one of the most important requirements for electron sources used, inter alia, in evaporators, production of rare gas excimers, and electron beam objects for high energy physics. In emission current control systems, a negative feedback signal, directly proportional to the emission current is transferred from the high-voltage anode circuit to the low-voltage cathode circuit. This technique, especially for high-voltage sources of electrons, requires the use of galvanic isolation. Alternatively, a method of converting the emission current to voltage in the cathode power supply circuit was proposed. It uses a linear cathode current intensity distribution and multiplicative-additive processing of two voltage signals, directly proportional to the values of cathode current intensity. The simulation results show that a relatively high conversion accuracy can be obtained for low values of the electron work function of the cathode material. The results of experimental tests of the dynamic parameters of the electron source and the steady-state Ie-V characteristic of the converter are presented. The implementation of the proposed Ie-V conversion method facilitates the design of the emission current controller, especially for high-voltage sources of electrons, because a negative feedback loop between the anode and cathode circuits is not required, all controller sub-components are at a common electrostatic potential.

1. Introduction

Thermionic electron sources operated in temperature limited or space charge limited mode are a key component of vacuum devices, which use the interaction of the thermionic electron beam with matter, including evaporators [1], X-ray photoelectron spectroscopy [2], electron beam facilities for high energy physics [3], production of rare gas excimers [4], and others, e.g., electron beam inspection for integrated circuit manufacturing process monitoring [5].
The stability of the emission current has a significant impact on the quality of electron beam devices. The problem of stabilization includes the conversion of the thermionic emission current to voltage, comparing its value with the reference voltage and controlling the electric power supplied to the cathode, e.g., in evaporators, or controlling the bias voltage on the control grid electrode of electron source, for a constant cathode temperature, e.g., on the Wenhelt electrode in electron microscopes. With regard to evaporators, there are also designs in which the electric power supplied to the cathode is controlled by the voltage directly proportional to the ion current [6]. In commonly used emission current control systems, the Ie-V conversion is performed in the anode power supply circuit and its output signal is transferred as a negative feedback signal to the low-voltage cathode power control circuit [7,8,9,10]. For a relatively small value of the cathode-anode potential difference and, consequently, a relatively low electron energy, e.g., in mass spectrometers, ionization vacuum gauges, a galvanic connection can be used to implement the negative feedback loop. The works [7,9] present systems in which the negative feedback signal is transferred from the anode power supply circuit to the low-voltage cathode power supply circuit by means of a current mirror, a high-voltage differential amplifier used for this purpose is described in [8,10]. These controllers ensure high-quality stabilization of the emission current, however, the value of the electron accelerating voltage is limited by the breakdown voltage of semiconductor components. For higher anode power supply voltages, the problem of stabilizing the emission current is more complex. The paper [4] describes the original system of the emission current controller for the infrared emission spectroscopy of rare gas excimers, in which the electron accelerating voltage of 100 kV is used. In the system, the measurement of the emission current is performed in the high-voltage anode power supply circuit and its result is transferred as a negative feedback signal to the cathode control circuit by means of an optical fiber. The optoelectronic connection was also used in the digital controller of the electron beam evaporator, described in [1].
The necessity to transfer the negative feedback signal from the high-voltage anode circuit to the low-voltage cathode circuit in the controllers of high-voltage sources of electrons justifies an attempt to convert the emission current into voltage in the cathode power supply circuit. The article presents the results of simulation tests of the Ie-V conversion method in the cathode power supply circuit for the electron source in a diode configuration, operating in temperature limited mode and the results of experimental tests of the dynamic parameters of the electron source and the static characteristic of the Ie-V converter.

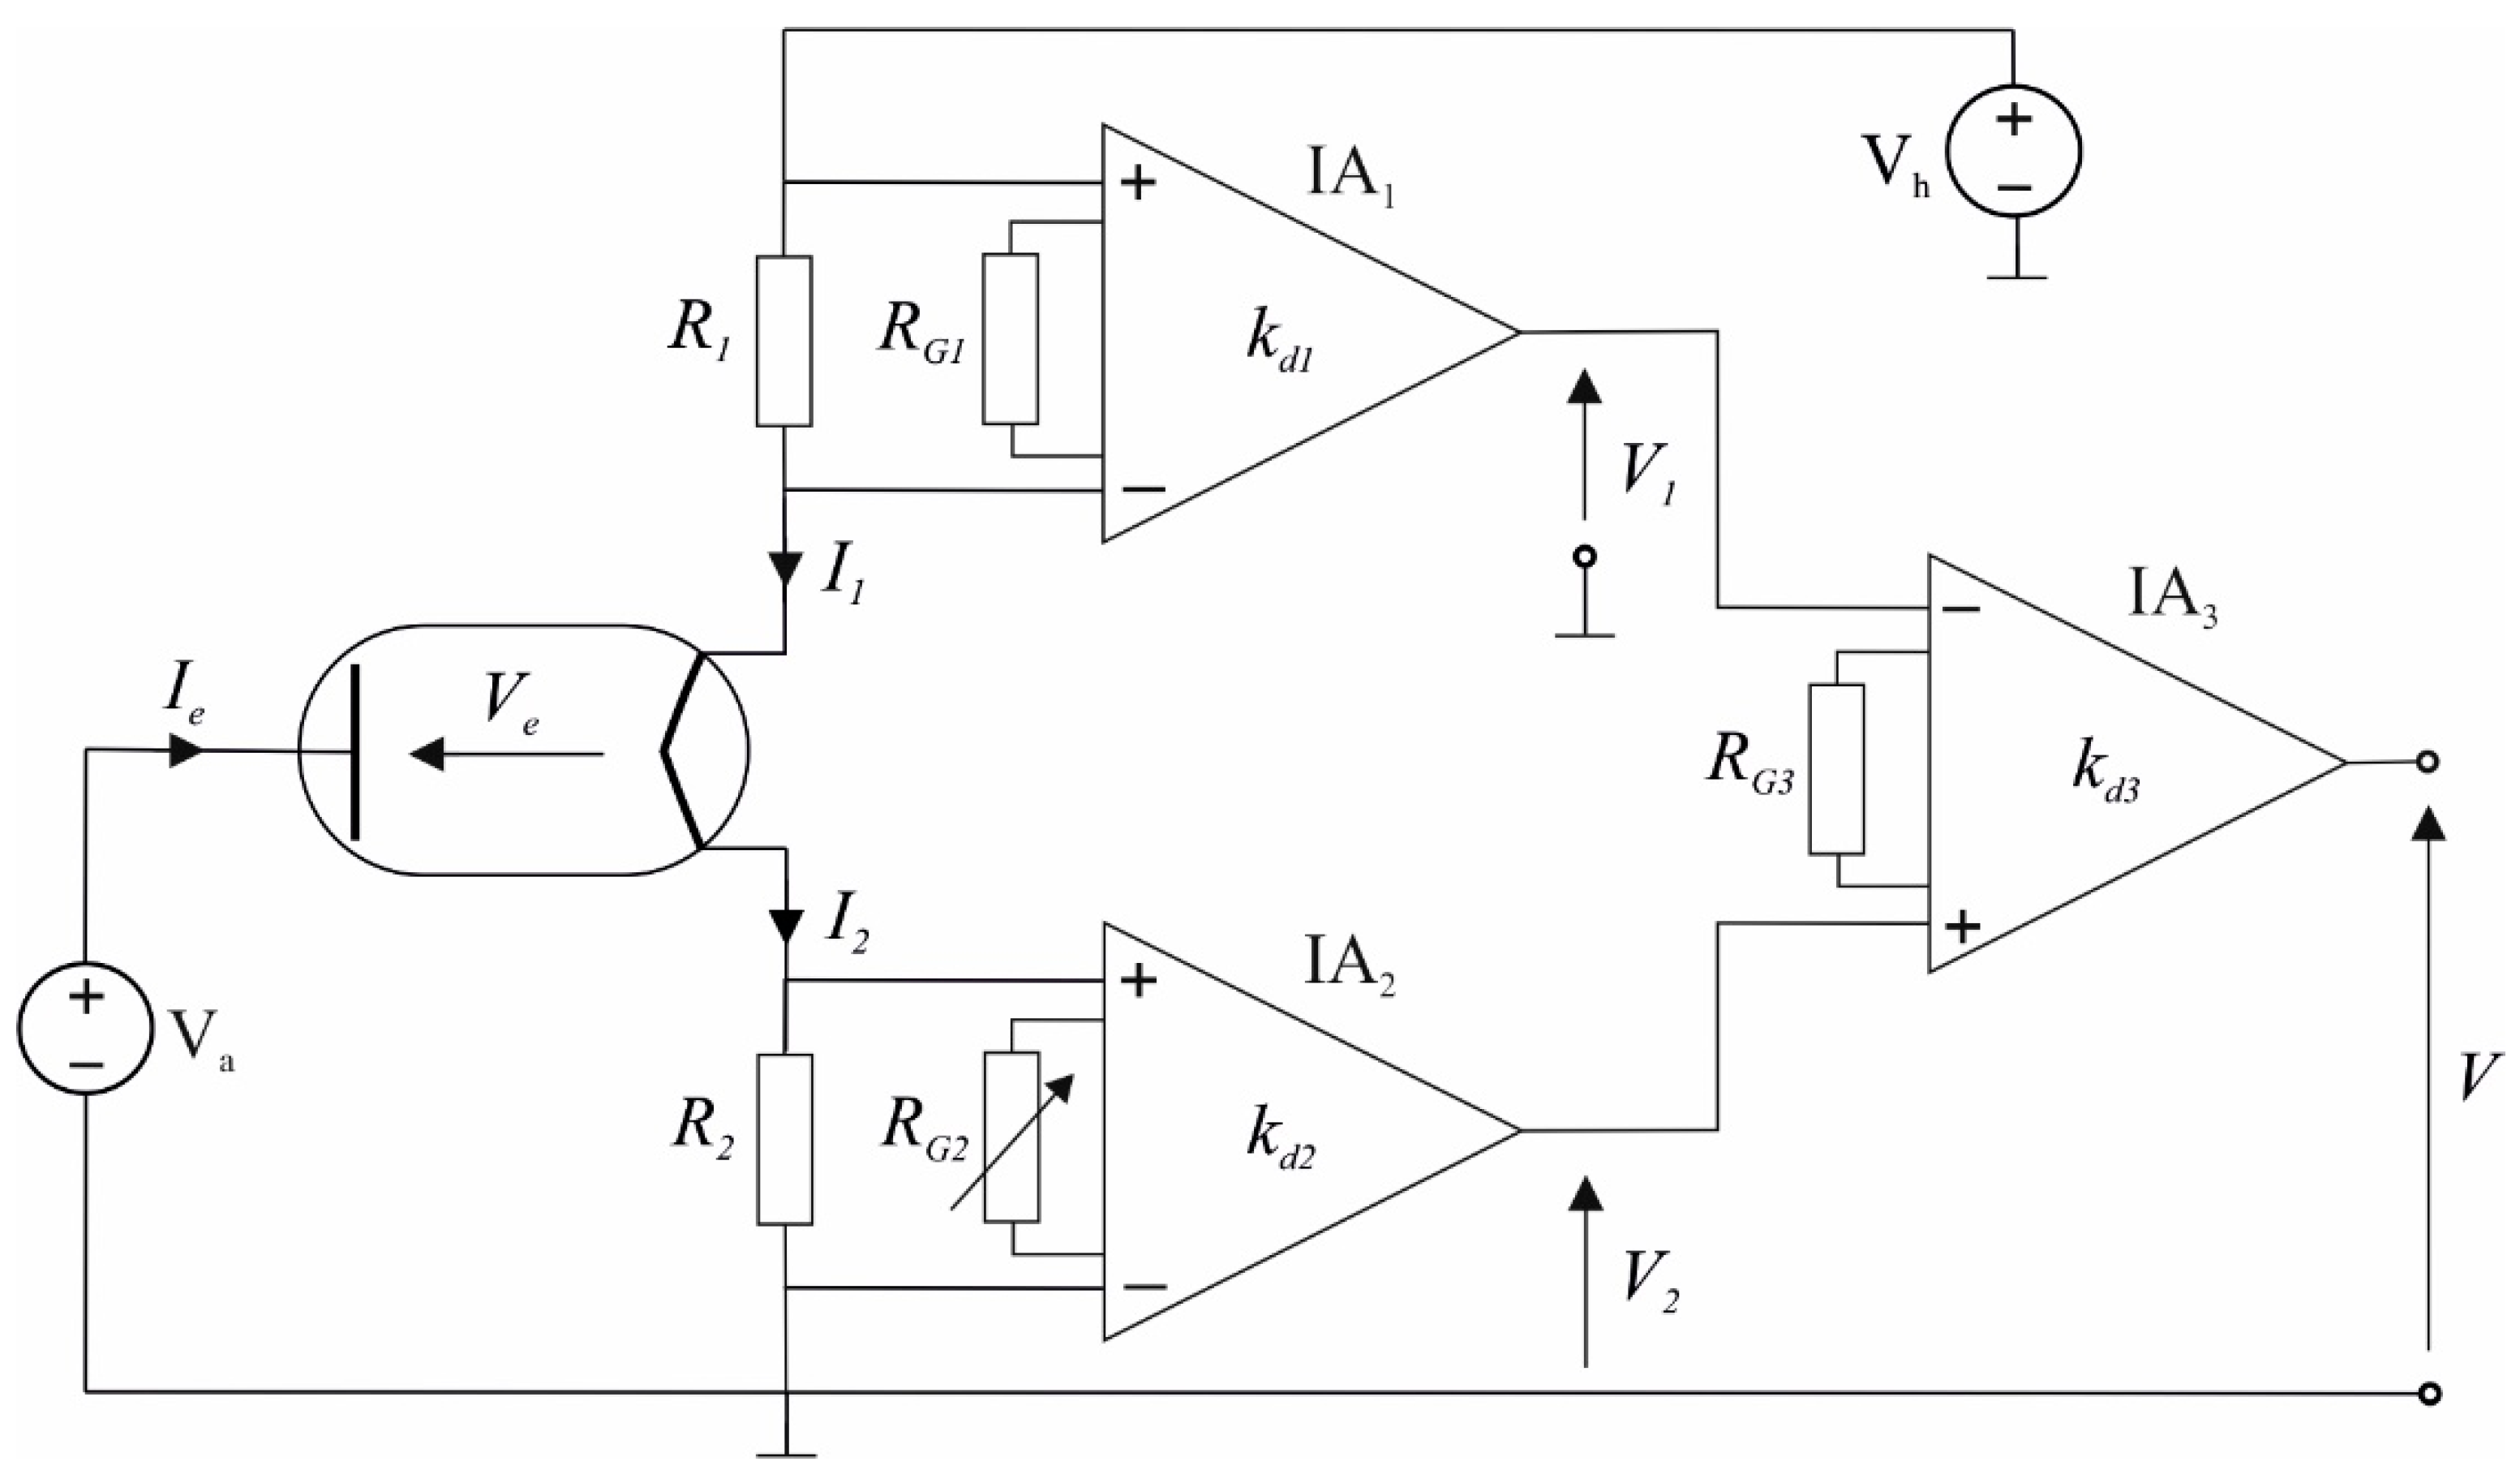
2. Modeling of the Emission Current-to-Voltage Conversion in the Cathode Power Supply Circuit

In terms of the thermionic electron source working under temperature limited conditions, the temperature dependence of the intensity of the emission current is described by the Richardson-Dushmann equation [11]:
I e = A S T 2 exp ( φ k B T ) ,
where A = 1.2 × 10⁶ Am−2 K−2 is the Richardson constant, S is the surface from which the electrons are emitted, T is the temperature, φ is the electron work function for the cathode material, kB is the Boltzmann constant.
Due to the cathode’s heat capacity, the thermionic electron source is a higher-order inertial system. In order to simplify considerations, its small signal transconductance G(s) can be approximated by the following expression [12,13]:
G ( s ) = G 0 T C s + 1 e s T 0 ,
where G0 is the DC transconductance, Tc is the time constant, T0 is the delay time, s is the Laplace operator.
In order to justify the method of converting the emission current to the voltage in the cathode power supply circuit, a simplified equivalent circuit of the diode-type electron source has been presented. Figure 1a shows a scheme of the biasing system of the thermionic electron sources, which simplified equivalent circuit as presented in Figure 1b.
The cathode is divided into n elementary parts with the resistance values r1, r2, …, rn, which at a fixed value of the heating voltage Vh give an emission current with the intensity values Ie1, Ie2, …, Ien. The resistances ri of individual elements and the values of the intensity Iei of the emission current depend on the temperature of the individual cathode elements, which can be determined using the cathode temperature distribution [14]. The current intensity Iei is described by the Richardson-Dushmann equation:
I e i = A S i T i 2 exp ( φ k B T i ) ,
where: Si is the side area of the i-th element, Ti is the temperature of the i-th cathode element. It was assumed that the electron work function is equal to φ for all cathode elements.
According to the diagram shown in Figure 1b, the intensity of the cathode current Ici flowing through the i-th element can be expressed as follows:
I c i = I 1 + j = i n I e j
The cathode current intensity depends on the location along the cathode, described by the generalized variable i. Consequently, the above formula describes a linear cathode current intensity distribution. For the j = 1 limit value, the intensity I2 of the current flowing from the cathode can be written as follows:
I 2 = I 1 + j = 1 n I e j .
As
I e = j = 1 n I e j
Then
I 2 = I 1 + I e
The above relationship was used to convert the thermionic emission current to voltage in the cathode power supply circuit.
Based on the diagrams shown in Figure 1, the electron accelerating voltage Ve was derived. The voltage accelerating the electrons emitted from the i-th element is given by the formula:
V e i = V a V c i
In order to determine the voltage Vci, it is helpful to determine, first the voltage Vc1 at the upper terminal of the resistor r1 with respect to ground:
V c 1 = ( j = 1 n I e j + I 1 ) r 1
Similarly, the voltage at the upper terminal of the resistor r2 with respect to ground is described by the formula:
V c 2 = V c 1 + ( j = 2 n I e j + I 1 ) r 2
With the above in mind, a generalized equation can be expressed to describe the voltage at the upper terminal of the resistor ri relative to ground:
V c i = k = 1 i ( j = k n I e j r k ) + I 1 k = 1 i r k .
Equation (8), after substituting Formula (11), takes the following form:
V e i = V a [ k = 1 i ( j = k n I e j r k ) + I 1 k = 1 i r k ]
The above equation describes the electron accelerating voltage Vei at the i-th cathode element. For a relatively long cathode, it can be assumed that the temperature distribution is uniform, then the resistances rk and the values of the current intensity Iei are respectively equal:
r k = 1 n R C ,
I e j = 1 n I e ,
where Rc is the cathode resistance for the given heating voltage Vh.
Combining the dependencies (12) and (13) and performing the summation with respect to j and k, has the following form:
V e i = V a i n R c [ 2 n i + 1 2 n I e + I 1 ]
Given the emission current and the electron accelerating voltage for the i-th cathode element, the electron beam power can be determined:
P e n = i = 1 n V e i I e i
Taking into account the expression (15), the formula (16) can be presented as follows:
P e n = V a I e R c n ( I e i = 1 n i I e i I e 2 n i = 1 n i 2 I e i + + I e 2 n i = 1 n i I e i + I 1 i = 1 n i I e i )
Using the equation given in the work [15]:
i = 1 n i 2 = 1 6 n ( n + 1 ) ( 2 n + 1 )
and summing in Formula (17) with respect to i, we obtain:
P e n = V a I e R c I e [ 2 n 2 + 3 n + 1 6 n 2 I e + 1 2 n I 1 + 1 2 I 1 ]
Assuming that the cathode is divided into infinitely many elementary parts, the power of the electron beam can be determined using the relationship:
P e = lim n P e n
Substituting Equation (19) to the above formula, we obtain:
P e = ( V a 1 3 R c I e 1 2 R c I 1 ) I e
Hence the electron accelerating voltage Ve can be written as follows:
V e = V a 1 3 R c I e 1 2 R c I 1
The above relation shows the effect of the cathode heating current and the thermionic emission current on the value of Ve. For high-voltage sources, the electron accelerating voltage can be approximated by the anode power supply voltage Va.
The simplified scheme shown in Figure 2 is used to explain the conversion of the emission current to voltage in the cathode power supply circuit.
The cathode power supply circuit consists of a voltage source Vh, sensing resistors R1, R2, and a cathode. The difference in the voltage drops across the resistors R1, R2 is equal to:
V = R 2 I 2 R 1 I 1
After taking into account the Formula (7), the following is obtained:
V = R 2 I e + ( R 2 R 1 ) I 1
In order to make the voltage V independent of the current I1, the following condition should be assumed:
V I 1 = 0
For the ideal case described in this way, the voltage V = Videal is given by the formula:
V ideal = R 2 I e
To determine the electron accelerating voltage, the voltage drop across the resistor R2 should be taken into account in Formula (24), hence:
V e = V a I 1 ( 1 2 R c + R 2 ) I e ( 1 3 R c + R 2 ) .
In practice, given the finite values of the tolerances of the resistors δR1 = δR2, the Equation (26) does not have to be met. The discrepancy between the voltages V and Videal can be described by the relative voltage difference (VVideal)/Videal). Using Formulas (24) and (26) we obtain:
V V ideal V ideal = I 1 I e R 2 R 1 R 2 .
Assuming that the resistances R1 = R2 and the tolerances of the resistors δR1 = δR2, for the most unfavorable distribution of the values of R1 and R2, the Formula (28) takes the form:
V V ideal V ideal = I 1 I e 2 δ R 1
In order to quantify the relative voltage difference, first the numerical relationship of the I1/Ie ratio as a function of the electron work function was simulated, using the cathode model described by the Formula (A2) and the graphical relationship shown in Figure A3 in Appendix A. For the simulation, model tungsten wire cathodes with a diameter of d = 1.2 × 10⁻⁴ m and a length of l = 4.5 × 10⁻² m, surface-coated with materials with the electron work function φ in the range from 0.9 eV to 4.5 eV were used. The calculations were made for the set values of the intensity of the emission current: Ie = 1 mA, Ie = 10 mA, Ie = 50 mA, and Ie = 100 mA. The results are shown in Table 1:
Using the above data, the relative voltage difference ((VVideal)/Videal) was determined, based on the Formula (29), for the tolerance of the sensing resistors R1 and R2 equal to δR1 = δR2 = 0.01%. The results are shown in Figure 3.
The analysis of the results shows that the described Ie-V conversion method in the cathode power supply circuit is predestined for electron sources with low electron work function of the cathode material. For a fixed electron work function, the relative voltage difference decreases with the increase of the emission current. An important design issue is the selection of sensing resistors with high temperature stability, because a relatively high cathode current flows through them, which causes their heating.

3. Experimental Results

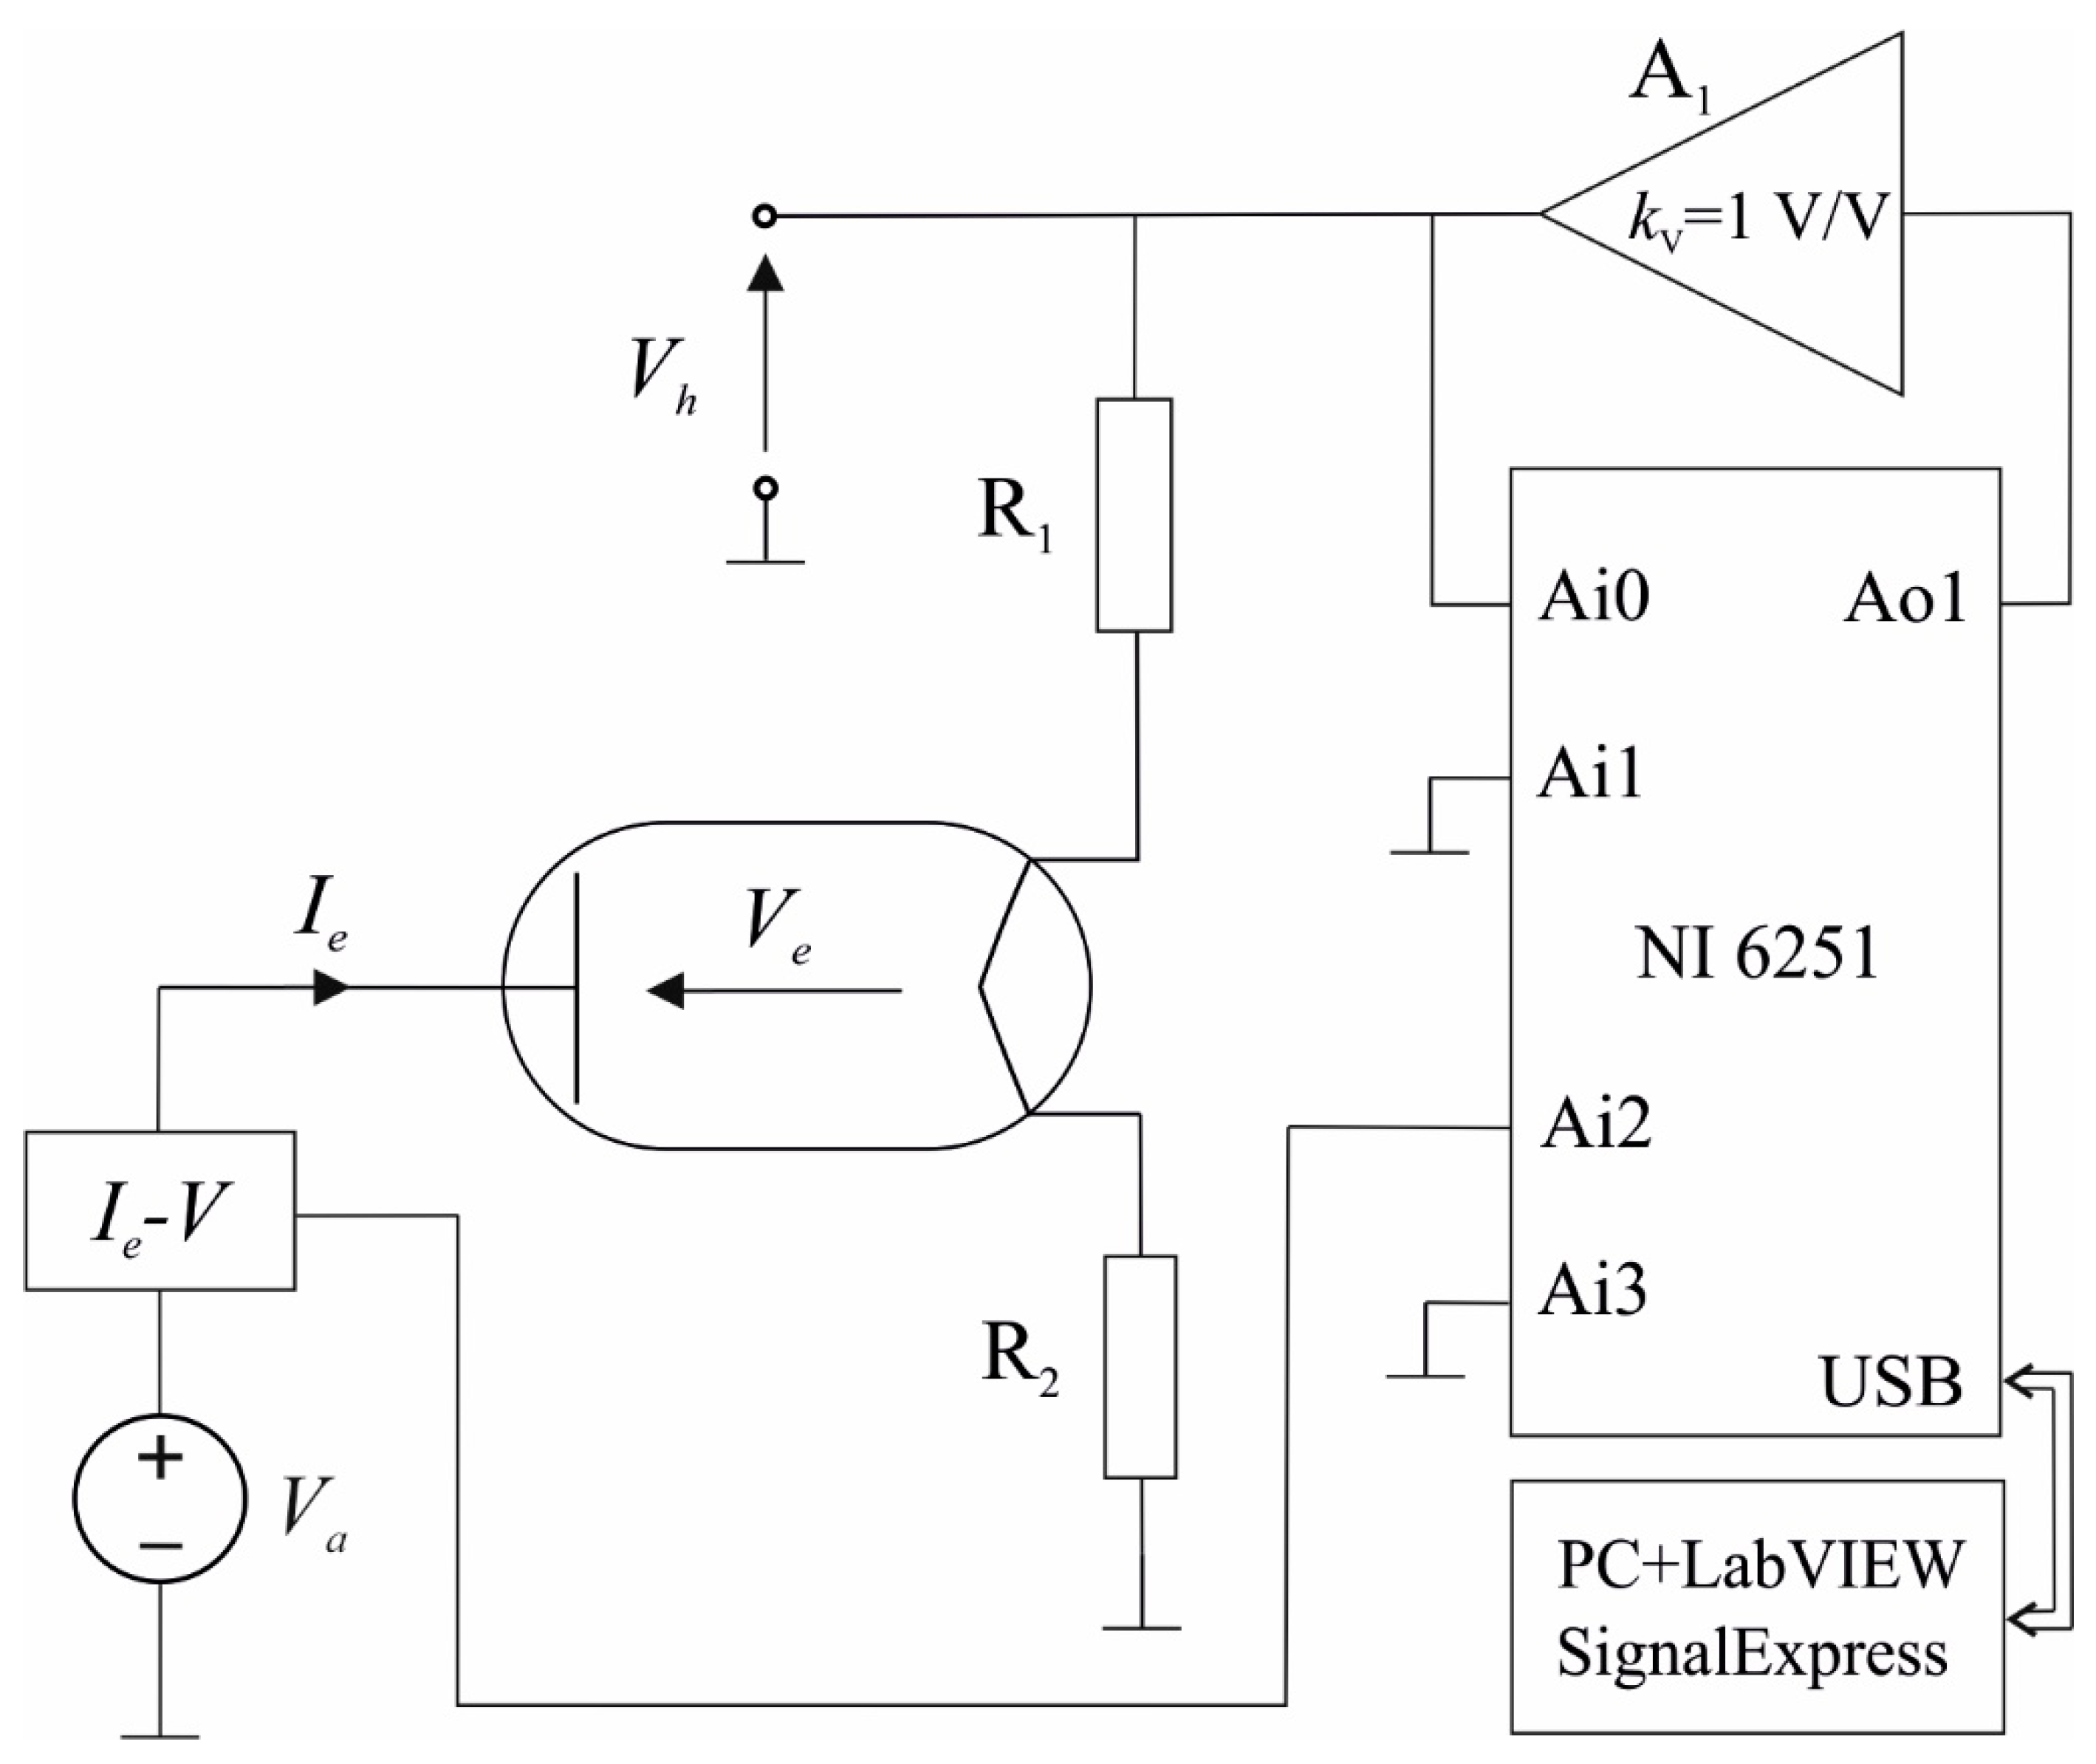
3.1. Dynamic Parameters of the Electron Source with Sensing Resistors Connected in Series in the Cathode Supply Circuit

In order to assess the influence of the sensing resistors on the dynamic properties of the thermionic electron source, the time constant Tc and the delay time T0 were determined using step response method [13]. The scheme of the measuring system is presented in Figure 4. The square wave control signal is fed from the Ao1 output of the NI 6251 data acquisition card to the input of the power amplifier A1 operating in a voltage follower configuration, the output of which is connected to the cathode power supply circuit and the input Ai0. The voltage, directly proportional to the emission current intensity, is supplied to the Ai2 input from the Ie-V anode converter built on the basis of the current mirror [7].
For the square wave period, the value of 10 s was assumed, which is sufficient for the cathode temperature and the emission current to reach the set values. Measurements were made for a Bayart-Alpert gauge electron source at a pressure of 0.1 Pa, with a thoriated tungsten cathode (d = 0.00012 m and l = 0.045 m). Sensing resistors R1 = R2 with nominal values of 0.100 Ω, 0.383 Ω, 0.562 Ω, 1.000 Ω were used in the measurements. The waveforms of the control voltage and the emission current step response were acquired for the set values of the constant component Vh0 and the step voltage ΔVh. An example of the waveforms of the control voltage Vh(t), emission current Ie(t) and the step response of the first-order inertial model with a delay are shown in Figure 5.
Successive step responses Ie were registered for the set values of the constant component Vh0 and the step voltage ΔVh = 0.05·Vh0. The values of the time constant Tc and the delay time T0 determined on the basis of these waveforms are presented as a function of the intensity of the emission current in Figure 6.
As can be seen, with increasing emission current, the time constant decreases while the delay time remains approximately constant. According to the results of work [13], for the electron source without sensing resistors, the delay time decreases with increasing emission current. In the present work, the delay time remains approximately constant due to the use of linear, sensing resistors connected in series with the cathode, which have a linearizing effect on the temperature dependence of the resistance of the new control object (cathode + sensing resistors). The decrease in the time constant results from faster cathode-ambient thermal energy exchange at higher and higher temperatures. Analogous measurements were made for the electron source itself and for the electron source with sensing resistors 0.100 Ω, 0.562 Ω, 1.000 Ω. The summary of all the results is shown in Figure 7.
Increase in series resistance in the cathode circuit causes an increase in the time constant of the electron source circuit. For example, for Ie = 0.45 mA and resistance R1 = R2 = 1.000 Ω the increase of time constant is close to 75% in relation to time constant of the electron source itself. For this reason, the resistances of R1, R2 should be as low as possible. On the other hand, the resistance values have an influence on the measured voltage drops (Formula (23)) and the signal/noise ratio, hence the need for a compromise when choosing their values.

3.2. Static Characteristic of the Ie-V Converter

In order to verify the proposed conversion method, a prototype of the Ie-V converter was designed. A simplified scheme of the converter, hereinafter referred to as the cathode converter, is presented in Figure 8.
The converter consists of sensing resistors R1, R2 placed on a common heat sink and three instrumentation amplifiers IA1, IA2, IA3 with differential-mode gains kd1, kd2, kd3, respectively. Resistors RG1, RG2, RG3 are used to adjust these gains. The common-mode gains of the amplifiers were assumed to be negligible. The output voltages V1, V2 are directly proportional to the voltage drops across the sensing resistors R1, R2, respectively:
V 1 = k d 1 R 1 I 1 ,
V 2 = k d 2 R 2 I 2 .
The output voltage V of the amplifier IA3 is equal to:
V = k d 3 ( V 2 V 1 ) .
Combining the relations (30)–(32) and (7), we obtain:
V = k d 3 [ I e k d 2 R 2 + I 1 ( k d 2 R 2 k d 1 R 1 ) ] .
Assuming the condition:
V I 1 = 0 ,
the ideal case is obtained, in which the voltage V = Videal is expressed by the relationship:
V ideal = k d 3 k d 2 R 2 I e .
The discrepancy between the output voltage of the ideal converter (Formula (35)) and the output voltage of the analyzed converter (Formula (33)) is expressed by the relative voltage difference:
V V ideal V ideal = I 1 I e ( k d 2 R 2 k d 1 R 1 ) k d 2 R 2 .
Appropriate selection of the kd2 differential-mode gain value with the RG2 resistor allows to compensate the influence of the sensing resistors tolerance on the conversion accuracy. The estimated maximum relative contributions of components in the output signals of the IA1 and IA2 amplifiers due to common-mode gains are 0.43% and 3.00%, respectively.
In order to determine the static dependence of the output voltage V as a function of the emission current Ie of the cathode converter, measurements were carried out in the circuit, the diagram of which is shown in Figure 9.
The system uses an electron source with a tungsten cathode installed in a Bayard-Alpert gauge. The sensing resistors R1 = R2 = 0.383 Ω were used. The intensity of the emission current was adjusted by the voltage Vh. The output voltage V of the cathode converter was measured with an Agilent 34461A multimeter, while the emission current was measured with a Brymen 859 multimeter in the anode power supply circuit. Figure 10 shows the static characteristic of the converter output voltage as a function of the emission current intensity.
The characteristic of the converter was approximated by the equation:
V = 0.37   I e + 0.01 .
The relative non-linearity of the characteristic is lower than 0.77%.
The obtained results constitute an experimental verification of the proposed method of converting the emission current into voltage. Based on the dependencies (30)–(32), it can be concluded that the multiplicative-additive processing of voltage signals directly proportional to the values of the cathode current intensity enables the conversion of the emission current into voltage in the cathode power supply circuit. Although the anode voltage Va = 100 V was used in the measurements, it is clear that the upper value of the voltage Va is only limited by the parameters of the electron source.
The use of a cathode converter facilitates the design of the emission current controller. The simplified scheme of an exemplary controller using a cathode converter is shown in Figure 11.
For the amplifier A1, the voltage V, directly proportional to the emission current Ie, is a negative feedback signal that is compared with the reference voltage Vref and the amplified error signal (Vref–V)kv controls the cathode heating so as to maintain the pre-set value of the emission current. In the controller diagram shown, the anode is at a high potential, but it is easy to polarize the cathode circuit with a high negative voltage, and the anode is grounded, which is used in many electron beam devices.
As can be seen in Figure 11, the Ie-V cathode converter is the negative feedback loop of the A1 amplifier. Comparison of presented and reported feedback loop applications used in emission current controllers is shown in Table 2.

4. Conclusions

The method of converting the emission current to the voltage in the cathode power supply circuit was proposed. Based on the original static model of the thermionic electron source in a diode configuration, a linear distribution of the cathode current intensity was determined on the basis of which the conversion of the emission current to voltage with the use of sensing resistors in the cathode power supply circuit was justified. The results of simulation studies show that a relatively high conversion accuracy can be obtained for low values of the electron work function of the cathode material. The influence of the sensing resistors on the time constant of the electron source system was determined experimentally. A prototype of a cathode converter with a tungsten cathode was developed and its static characteristic was determined, for which the relative nonlinearity is lower than 0.77%. The use of the Ie-V cathode converter in the automatic control system of the emitted electron current eliminates the need to transfer the negative feedback signal from the high-voltage anode circuit to the low-voltage cathode circuit, which may be the key application advantage of the presented converter, especially in relation to high-voltage sources of electrons.
Currently, a prototype of a digital cathode converter applied in a digital emission current controller is being designed and tested. The investigations for electron sources with an yttrium oxide coated iridium cathode and a thoriated tungsten cathode will be performed.

Author Contributions

Conceptualization, J.S., J.M.; methodology, D.K., J.S.; investigation, D.K., A.K.; validation, D.K., A.K., J.S.; formal analysis, J.S., J.M.; writing—original draft preparation, D.K., J.S.; writing—revision, J.M. All authors have read and agreed to the published version of the manuscript.

Funding

This research was supported by Lublin University of Technology, Lublin, Science fund No. FD-20/EE-2/000.

Conflicts of Interest

The authors declare no conflict of interest.

Appendix A

In many devices that use the thermionic electron sources, the directly heated cathode is made of a thin wire of a suitably selected metal or composite. For high vacuum conditions, the cathode power balance equation for a steady state can be written as follows [16,17]:
I c 2 ρ 0 F [ 1 + α ( T T 0 ) ] d x = = σ ε L ( T 4 T 0 4 ) d x λ F d 2 T d x 2 d x + A L 2 k B T + φ e T 2 e φ k B T d x
where Ic is the cathode heating current, ρ0 is the cathode material resistivity, F is the cathode cross-sectional area, α is the temperature coefficient of the cathode resistance, T is the cathode temperature, T0 is the ambient temperature, σ = 5.671·10−8 W·m2·K−4 is the Stefan-Boltzmann constant, ε is the temperature-dependent total emissivity of the cathode surface, L is the cathode circumference, λ is the temperature-dependent conductivity of the cathode material, A = 1.2 × 10⁶ Am−2 K−2 is the Richardson constant, kB is the Boltzmann constant, φ is the electron work function of the cathode material, e is the charge of the electron.
The expression on the left side of the Equation (A1) describes the power delivered to an element dx of the cathode, the first component of the right side of the equation describes the power dissipated by radiation, the second term describes the power dissipated by heat conductivity of the cathode material [16], the third term describes the energy per unit time dissipated by electrons (cathode cooling effect [17]). For a relatively long cathode, its temperature can be determined from Equation (A1) omitting the power dissipated by the heat conductivity of the cathode material. The power balance equation has the form:
I c 2 ρ 0 F [ 1 + α ( T T 0 ) ] l = k r L l ( T 4 T 0 4 ) + A L l k B T + φ e T 2 e φ k B T .
From the above equation, the dependence of the cathode temperature T as a function of the heating current intensity Ic, for a tungsten cathode with dimensions d = 0.00012 m and l = 0.045 m was determined. The results are presented in Figure A1.
Figure A1. Model dependence of the cathode temperature T as a function of the cathode heating current Ic, for tungsten cathode with dimensions d = 0.00012 m and l = 0.045 m.
Electronics 10 02844 g0a1
Then, using the Richardson-Dushmann equation, the dependence of the intensity Ie of the emission current as a function of the temperature T was determined. The results are presented in Figure A2.
Figure A2. Model temperature dependence of the emission current Ie for a tungsten cathode with a diameter of d = 0.00012 m and length l = 0.045 m.
Electronics 10 02844 g0a2
By combining the relationships shown in Figure A1 and Figure A2, the characteristic of the intensity Ie of the emission current as a function of the intensity Ic of the cathode heating current, which is illustrated in Figure A3, was determined.
Figure A3. Model dependence of the emission current Ie as a function of the cathode heating current Ic, for a tungsten cathode with dimensions d = 0.00012 m and l = 0.045 m.
Electronics 10 02844 g0a3
The obtained dependence combines the electrical quantities of the input Ic and the output Ie of the thermionic electron source and is helpful in the simulation studies of the method of converting the emission current to voltage in the cathode power supply circuit.

References

  1. Meyer zu Heringdorf, F.-J.; Belton, A.C. Flexible microprocessor-based evaporation controller. Rev. Sci. Instrum. 2004, 75, 5288–5292. [Google Scholar] [CrossRef]
  2. Stevie, F.A.; Donle, C.L. Introduction to X-ray photoelectron spectroscopy. J. Vac. Sci. Technol. A 2020, 38, 063204. [Google Scholar] [CrossRef]
  3. Pepitone, K.; Cassany, B.; Doebert, S.; Gardelle, J.; Garolfi, L. Operation of a high-current drive beam electron gun prototype for the Compact Linear Collider. Rev. Sci. Instrum. 2020, 91, 093302. [Google Scholar] [CrossRef] [PubMed]
  4. Barcella, L.; Berto, E.; Carugno, G.; Galet, G.; Galeazzi, G.; Borghesani, A.F. A battery-operated, stabilized, high energy pulsed electron gun for the production of rare gas excimers. Rev. Sci. Instrum. 2011, 82, 095103. [Google Scholar] [CrossRef] [PubMed] [Green Version]
  5. Oberai, A.; Yuan, J.S. Smart E-Beam for Defect Identification & Analysis in the Nanoscale Technology Nodes: Technical Perspectives. Electronics 2017, 6, 87. [Google Scholar] [CrossRef] [Green Version]
  6. Band, A.; Strosicio, J.A. A closed loop controller for electrocarbon evaporators. Rev. Sci. Instrum. 1996, 67, 2366–2369. [Google Scholar] [CrossRef] [Green Version]
  7. Sikora, J. Dual Application of a Biasing System to an Electron Source with a Hot Cathode. Meas. Sci. Technol. 2003, 15, N10–N14. [Google Scholar] [CrossRef]
  8. Flaxer, E. Programmable Smart Electron Emission Controller for Hot Filament. Rev. Sci. Instrum. 2011, 82, 025111. [Google Scholar] [CrossRef] [PubMed]
  9. Sikora, J.; Halas, S. A Novel Circuit for Independent Control of Electron Energy and Emission Current of a Hot Cathode Electron Source. Rapid Commun. Mass Spectrom. 2011, 25, 689–692. [Google Scholar] [CrossRef] [PubMed]
  10. Sikora, J.; Kania, B.; Mroczka, J. Thermionic Electron Beam Current and Accelerating Voltage Controller for Gas Ion Sources. Sensors 2021, 21, 2878. [Google Scholar] [CrossRef] [PubMed]
  11. Gaertner, G.; Koops, H.W.P. Vacuum electron sources and their Materials and Technologies. In Vacuum Electronics, Components and Devices; Eichmeier, J.A., Thumm, M.K., Eds.; Springer: Berlin/Heidelberg, Germany, 2008; ISBN 978-3-540-71928-1. [Google Scholar]
  12. Donkov, N.; Knapp, W. Control of Hot-Filament Ionization Gauge Emission Current: Mathematical Model and Model-Based Controller. Meas. Sci. Technol. 1997, 8, 798–803. [Google Scholar] [CrossRef]
  13. Kania, B.; Sikora, J. System Identification of a Hot Cathode Electron Source: Time Domain Approach. AIP Adv. 2018, 8, 105107. [Google Scholar] [CrossRef] [Green Version]
  14. Kania, B. A LabView-based hot cathode electron source simulator with no-boundary condition computation method. Int. J. Numer. Model. 2016, 29, 1149–1160. [Google Scholar] [CrossRef]
  15. Graham, R.; Knuth, D.E.; Patashnik, O. Concrete Mathematics: A Foundation for Computer Science; Addison-Wesley: Reading, MA, USA, 1994; ISBN 0-201-55802-5. [Google Scholar]
  16. Hałas, S.; Durakiewicz, T. Temperature distribution along a metal filament heated in vacuum by DC current. Vacuum 1998, 49, 331–336. [Google Scholar] [CrossRef]
  17. Ding, Z.M.; Chen, L.G.; Sun, F.R. Optimum performance analysis of combined thermionic-thermoelectric refrigerator with external heat transfer. J. Energy Inst. 2015, 88, 169–188. [Google Scholar] [CrossRef]
Figure 1. (a) Scheme of the thermionic electron source biasing system. Va is the anode voltage, Ie is the thermionic emission current intensity, Ve is the electron accelerating voltage, Vh is the cathode heating voltage. (b). Simplified equivalent circuit of a thermionic electron source is inserted inside the dashed rectangle in place of the electron source. I1, I2 are the boundary values of the intensity of the cathode current.
Electronics 10 02844 g001
Figure 2. A simplified scheme of the Ie-V conversion circuit.
Electronics 10 02844 g002
Figure 3. The simulation results of the relative voltage difference (VVideal)/Videal) as a function of the cathode electron work function, for the set values of the emission current.
Electronics 10 02844 g003
Figure 4. Scheme of the measuring system for determining the dynamic parameters of the electron source. The NI 6251 is a data acquisition card (DAQ) from National Instruments, Ai0–Ai3 are the analog inputs, and Ao1 is the analog output of DAQ, A1 is a power amplifier in a voltage follower configuration with an output current up to 3 A.
Electronics 10 02844 g004
Figure 5. Emission current step response and the step response of the first-order inertial model with a delay, for thoriated tungsten cathode with dimensions d = 0.00012 m and l = 0.045 m, sensing resistors R1 = R2 = 0.383 Ω, sampling period Ts = 1 ms, and anode voltage Va = 100 V.
Electronics 10 02844 g005
Figure 6. Dependence of the time constant Tc and the delay time T0 as a function of the intensity Ie of the emission current, for thoriated tungsten cathode with dimensions d = 0.00012 m and l = 0.045 m, sensing resistors R1 = R2 = 0.383 Ω and Va = 100 V. The Type B relative standard uncertainty value of time is less than 0.15%.
Electronics 10 02844 g006
Figure 7. Dependence of the time constant Tc as a function of the intensity Ie of the emission current, at selected values of the sensing resistors, for thoriated tungsten cathode (d = 0.00012 m and l = 0.045 m) and Va = 100 V.
Electronics 10 02844 g007
Figure 8. A simplified scheme of the Ie-V cathode converter. IA1, IA2, IA3 are instrumentation amplifiers AD8221 (Analog Devices), R1, R2 are sensing resistors (Caddock Electronics), RG1 = 49.42 kΩ; 47 kΩ ≤ RG2 ≤ 52.47 kΩ Vh is the LPS-305 power supply (Motech Industries INC.), Va is the CPX400DP (Aim TTi) power supply, all instrumentation amplifiers are powered with +/−15 V from the DF 1743005C (NDN) power supply.
Electronics 10 02844 g008
Figure 9. Scheme of the measuring system for determining the static characteristic of the Ie-V. Regulated voltage Vh is supplied with LPS-305 (Motech Industries INC.), Va = 100 V is supplied with CPX400DP (Aim TTi).
Electronics 10 02844 g009
Figure 10. Static characteristic of the emission current to voltage converter. The Type B relative standard uncertainty values of voltage and current are less than 0.013% and 0.029%, respectively.
Electronics 10 02844 g010
Figure 11. A simplified scheme of the controller of the emitted electron current using a cathode converter. A1 is the kv voltage transmittance amplifier, Vref is the reference voltage.
Electronics 10 02844 g011
Table 1. The simulation results of the I1/Ie quotient as a function of the electron work function φ, at the set values of the emission current: 1 mA, 10 mA, 50 mA, and 100 mA.
φ, eVIe = 1 mAIe = 10 mAIe = 50 mAIe = 100 mA
I1, AI1/IeI1, AI1/IeI1, AI1/IeI1, AI1/Ie
4.51.641637.991.93195.512.2645.132.4224.20
4.21.441442.461.73171.631.9839.552.1120.99
3.91.261256.391.51150.691.7334.511.8418.40
3.61.091086.971.30129.771.4929.811.5915.85
3.30.93925.031.11109.761.2725.461.3613.60
3.00.78777.170.9392.591.0721.421.1411.40
2.70.64639.480.7776.630.8917.710.949.34
2.40.52514.530.6261.780.7214.320.767.61
2.10.40403.680.4948.440.5611.250605.98
1.80.31304.070.3736.830.438.520.464.56
1.50.22217.750.2726.310.316.130.333.26
1.20.14143.320.1817.360.204.090.222.18
0.90.0880.820.1010.050.122.400.131.30
Table 2. Comparison of feedback loop applications used in emission current controllers.
Feedback Loop Based on the Cathode
Converter
(Present Work)
Feedback Loop Based on the Differential
Amplifier [8,10]
Feedback Loop Based on the Current Mirror [7,9]Feedback Loop Based on the
Optical Link [4]
Ie-V conversion
implementation
Cathode circuitAnode circuitAnode circuitAnode circuit
Feedback signal transferring from the anode to the cathode circuitNot requiredVoltageCurrentVoltage
Electron accelerating voltageHighLowLowHigh
Electron work function of the cathode LowWide rangeWide rangeWide range
Galvanic isolation in the feedback loopNot requiredNot requiredNot requiredApplied
ComplexityLowLowLowHigh
Publisher’s Note: MDPI stays neutral with regard to jurisdictional claims in published maps and institutional affiliations.

