Article

Compact System for Colorimetric Sensor Arrays Characterization Based on Computer Screen Photo-Assisted Technology

by
Giovanni Gugliandolo
1,
Giovanni Pilato
2,* and
Nicola Donato
1
1
Department of Engineering, University of Messina, 98166 Messina, Italy
2
ICAR-CNR, Italian National Research Council, 90146 Palermo, Italy
*
Author to whom correspondence should be addressed.
Electronics 2021, 10(21), 2587; https://doi.org/10.3390/electronics10212587
Submission received: 14 September 2021 / Revised: 15 October 2021 / Accepted: 20 October 2021 / Published: 22 October 2021
(This article belongs to the Collection Image and Video Analysis and Understanding)

Abstract

:
The detection of the spectral fingerprint of chemical sensors through the combined use of an LCD and a webcam is an alternative approach for chemical sensor characterization. This technique allows the development of more compact, cheap, and user-friendly measurement systems compared to the more classic instruments, such as spectrometers and gas chromatography systems. In the Computer Screen Photo-assisted Technique (CSPT), a display acts as a light source, and a conventional camera (e.g., a webcam) plays the role of a detector. The light from the LCD is reflected (or transmitted) by the chemical sensor, and the camera detects it. In the present contribution, we propose a compact and low-cost platform based on CSPT for the characterization of colorimetric sensor arrays. The system can provide spectral information of both reflected and transmitted light from the sample. Further, a 2.4-inch LCD and three different detector’s (a webcam, an RGB sensor, and a camera module) performances have been evaluated and discussed. The developed system includes a UDOO-based single board computer that makes it a stand-alone measurement system.

1. Introduction

Chemical sensors with an optical response play a key role in industrial, environmental, and clinical fields due to their low-cost, miniaturization capability, and great flexibility [1,2,3,4,5]. Among the various typologies of optical sensors, colorimetric sensors are desirable because they can identify target substances by associating the concentration with a color change, thereby ensuring an easily measurable analytical response [6,7,8,9,10]. Such devices use reagents fixed in a solid or liquid matrix, usually produced in the form of a thick or thin film [11,12]. By using the inkjet printing technique, it is possible to obtain a homogeneous and reliable film deposition and to use materials more efficiently, avoiding the use of expensive devices [13,14,15]. In addition, by preventing masks, it is possible to dispense defined volumes of chemicals quickly and accurately. Colorimetric sensors based on paper or plastic have been proposed as a low-cost, user-friendly alternative to conventional analytical instrumentation [13,14,16,17]. The use of paper itself seems preferable to plastic substrates because it is inexpensive, widely available, and easy to use. These features make paper-based sensors the best candidates for adoption in developing countries. In particular, colorimetric sensors on paper strips are widely used for the determination of many metal ions, either toxic or non-toxic [15,18,19]. Among these, the analysis of Fe ions is of paramount importance because it is an essential element for plants and animals, it plays a vital role in a variety of biochemical processes, and it is one of the necessary micronutrients. The colorimetric detection of iron (II) and iron (III) ions has been extensively investigated, due to the characteristics of rapid response and high sensitivity, using different dyes [15].
Colorimetric sensors are devices whose fluorescence emission or absorption properties in the visible spectrum change upon interaction with specific targets. They are based on the variation of optical properties such as absorption and emission [20,21,22]. The operating principle of these sensors is relatively simple: they are used in combination with a light source, with a set wavelength and a detector. The light source illuminates the sensor, and the changes in the spectral properties of the reflected/transmitted radiation or the fluorescence emission are evaluated by using the detector.
In this article, only the reflected and transmitted radiation of colorimetric sensors are taken into account. In this regard, a schematic of the required hardware arrangement is reported in Figure 1. For the assessment of the transmitted radiation, the sensor is placed in the middle between the light source and the detector. The light source emits a radiation that passes through the sensor so that the detector identifies possible changes in the spectral properties of the transmitted light. On the other hand, for assessing the reflectance properties, the sensor can be placed in front of the light source and the detector. In this case, the reflected radiation is considered instead of the transmitted one.
The earliest types of such sensors were based on fiber optics [23,24]. Today, with the great improvement in resolution, different devices can be used as detectors, including scanners, webcams, cameras, etc. [25,26,27]. These types of sensors are widely used in biomedical applications [28]: in particular, glucose sensors based on the enzymes GOD (Glucose Oxidase enzyme for the measurement of glucose concentration in blood) and peroxidase (enzymes that use electron acceptors of peroxidic type) with the addition of a chromogen are now very popular [29]. Other applications of colorimetric sensors can be found in the field of food control and detection of drugs [16,30].
The Computer Screen Photo-assisted Technique is a characterization technique that is based on a simple but effective idea: it exploits the possibility of using parts of a computer screen as a programmable light source and a camera to record and analyze changes in the spectrum produced by the sample [25,26,31,32,33,34,35,36]. This technique aims to create a device capable of analyzing the presence of certain gases in the air by using mainly commercially available devices. This approach reduces the costs of both the device itself and the measurements, which are considerably higher in other techniques of chemical-optical sensors.
The CSPT has been successfully used in different fields. In [33], the CSPT analysis was used to evaluate the surface optical properties of apricot fruits that were subjected to various post-harvest treatments. This technique allowed the detection of mechanical damages useful for fruit sorting in the food industry. Moreover, in [25], Santonico et al. used an analytical procedure based on the absorbance change to determine the amount of hexavalent chromium (Cr(VI)) in water. By using the CSPT, they could measure the concentration of Cr(VI) down to the ppb range. The CSPT has also been employed for volatile organic molecules detection [37]; by using image processing techniques, the authors highlighted the possibility to improve the optical fingerprints generated from the interaction process between the colorimetric sensor and the target molecules. This approach enabled them to enhance the analytical performance of the instrumentation proposed. More recently, in [28], Debus et al. proposed a low-cost CSPT-based platform for the rapid assessment of creatinine levels in urine. The developed system met the requirements for clinical analysis with good performance in terms of accuracy with a relative error in the quantitative determination of creatinine below 10%.
The possibility of using detection devices such as webcams ensures excellent immunity from electromagnetic noise present in any electronic sensor. Computer screens generate colors through a linear combination of the spectral radiance of the three primary colors that humans can see: red, green, and blue ( R , G , B ). The weighted sum of the values of these three channels generates the color and brightness of the emitted light according to the relationship [34,38]:
c i ( λ ) = r i R ( λ ) + g i G ( λ ) + b i B ( λ )
with c i ( λ ) the spectral distribution of the RGB color, R ( λ ) , G ( λ ) , B ( λ ) spectral distributions of the primary colors, r i , g i , and b i numbers between 0 and 1 representing the modulation for a given color and λ the wavelength limited in the visible spectrum (390–800 nm). Conventional systems have a resolution of 8 bits with values from 0 to 255 for each channel, which implies a total of 16,777,216 ( 2 24 ) colors can be displayed on the screen. Once the sequence of illuminating colors has been set, the sensor is placed in front of the screen. Usually, a sensor array based on colorimetric indicators is used, and the changes in terms of absorption and spectral emission are observed. In contrast to the more consolidated spectral reconstruction techniques, the CSPT technique aims to obtain as much spectral information as possible without any specific preliminary study so that it is possible to obtain high-performance measurement systems with devices that are widely used everywhere, such as computers and webcams. Webcams are not the only possible detector tools [39]. The CSPT approach can also work with chemically sensitive light detectors, so the CSPT technique can also be used for similar purposes such as the Scanning Light Pulse Technique (SLPT) or chemical imaging technique [40]. Once the sensor response has been recorded, the acquired data are analyzed.
There are different ways to evaluate the information included in the measurement since CSPT does not have a given standard. The most widely used technique is to analyze the recorded video frame by frame. Each frame and region considered is associated with a weight to minimize the influence of edge and non-uniform light distribution. For every color of the sequence, each particular pixel of the image will record spatially correlated information used to show a distinctive signature of the analyzed region at the end of the process. Furthermore, if part of the area in the image is intentionally left white, this can be used as a measure of the light source (reference) [15]. If the interest is in the reflectance property of the observed samples, this can be obtained through the sum of the three channels recorded by the webcam divided by the intensity of the white reference zones. Once the entire video is analyzed, it would be helpful to generate a graph with the results obtained, discriminating the results for the three primary color channels. Sometimes it would be more efficient to create a data file that stores the intensities measured for each of the individual channels and then use different pattern recognition-based algorithms on the recorded data [35,41]. In addition, to reduce the need to check every single pixel stored in the various frames, it is possible to define Regions of Interest, commonly indicated as ROI [41], which allow us to analyze only the parts of the image relevant for the measurement. By assigning to each ROI the areas where the sensitive layers of the sensors are located, it is possible to reduce the regions to be analyzed and, consequently, also the processing time of the entire video. The graphs that will be generated must therefore take into account the different ROIs for each color channel.
The CSPT technique was originally conceived for biomedical applications but it was later applied to all the applications that require the simultaneous characterization of sensitive surfaces with optical response. Basically, the CSPT concept is versatile and has advantages that cannot be found in any competing system. It is possible to:
  • Use any type of screen available as a light source: desktops, laptops, displays or even cell phone screens;
  • Use low-cost and easily accessible devices such as webcams for the detection process;
  • Obtain a highly customizable device: the kind of application is in fact determined by the sensors typologies that are used (medical diagnostic, environmental monitoring, etc.) while the platform used is always the same;
  • Avoid to install any particular software: often an internet connection is enough to send the video file and obtain measured data;
  • Evaluate any colorimetric phenomenon (absorption, reflection, emission, etc.);
  • Use any commercially available material as an indicator material.
Both the spectroscopy technique, which often uses massive spectrometers, and the CSPT technique, which requires a screen to illuminate the area subject to the measure and a PC for data processing, are solutions that do not allow the analysis of the sensors to be characterized outside of a laboratory.
Image-based measurement systems have been successfully exploited in many fields, recently, for example, in environmental monitoring [42], and biomedical applications [43]. In this paper, a compact and low-cost measurement system for the characterization of colorimetric sensors is presented. The system can provide spectral information of both reflected and transmitted light from the sample. The device has been tested and the main results are reported in Section 3. Finally, conclusions are drawn in the last section.

2. Materials and Methods

The characterization system described in this article uses low-cost components, broadly available on the market. The sensors, which will detect gaseous substances, are illuminated by a screen with a predefined color sequence. The used display is a small 2.4-inch LCD. A detector records changes in the optical response presented by the sensor. The user can choose one of three detectors for data acquisition: a webcam, a camera module, and an RGB sensor, which extract the R, G, and B components of the sensor under test. The device is connected to a single-board computer, which includes a 7-inch touch screen display. The resulted system is powerful, versatile, and compact: once assembled, its dimensions enable it to fit in one hand. Moreover, because of its quite limited power consumption (approximately 12 W), it can be battery powered thus increasing the system portability. This features is not yet implemented and the proposed prototype is meant to be powered by AC mains. A block diagram and a picture of the developed device are reported in Figure 2.
The entire measurement system is managed by a software that makes it possible to choose three different measurement options: multicolor, if it is desired to send to the display a well-defined sequence of colors; monochrome, if it is desired to illuminate the sensor with a single color, and LED, which allows leaving the display off and illuminating the area of interest with a led light. The software also provides the possibility to choose which one of the three acquisition devices needs to be used; if the webcam has been selected, the software gives the option to change some optical parameters of the device to improve the final results (e.g., contrast and brightness). When starting the program, by selecting the Multicolor mode, it is possible to choose the sequence of illuminating colors to be sent to the display. Another feature is the possibility to analyze the previous measurements recorded. Measurements are carried out in two separate sets: in one set, the sensor will be put in contact with a target gas, while in the other, it will be kept in normal conditions. The two sets will then be compared (subtracting the first from the second), to obtain the most valuable information from the measurements. In Figure 3 a block diagram of the developed software is shown while, in Figure 4, some screenshots of the user interface are reported.
The UDOO platform [44] was selected as a single-board PC to develop a compact and robust system. This powerful tool can be employed to develop measurement solution for several applications [45,46,47]. The three detectors included in the project, each with their own features, were used to create a complete and compact measurement system for colorimetric sensors. The three devices under consideration are a webcam (LinQ C2018), the UDOO camera module, and the Adafruit 1334 RGB sensor. The latter acquires the three fundamental color components (red, green, and blue) of the object in front of it. The Adafruit board mounts the TCS34725 color sensor with an integrated IR blocking filter that minimizes the infrared spectral component of the incoming light and allows high precision color measurements.
The system, once assembled, has been tested by carrying out different measures to test its validity. The three acquisition devices were compared in order to provide a complete and exhaustive analysis of the developed device. In the next section, the method used for the validation of the system is described and the performance of each detector is evaluated.

3. Results

For the validation of the system, a test was carried out, which consists of placing a litmus paper in front of the various acquisition devices and reading their response. In particular, great attention was paid to the variation of the response due to the variation of the color detected by the devices. Such variations indicate the presence of a reactant element in contact with the analyte placed upon the sensor. The litmus paper in Figure 5 is a map used in several applications to calculate pH of liquid substances. The paper was placed in front of the detectors by letting them scan a different color sequentially.

3.1. Measurement Setup Optimization

For a proper measurement system design, it is essential to know the optimal distance between the images to be acquired and the corresponding detector. This allows the system to obtain appreciable responses from the sensor under test. Keeping the device too far away (or too close) could compromise the image quality in the case of cameras or introduce noise factors in the case of the RGB sensor. For the webcam and the UDOO camera module, the tests focused on the minimum distance at which the devices could be placed maintaining proper focus. From this point of view, the performances of the two devices are roughly equivalent: it has been calculated that the minimum distance for a correct focus of the webcam and the UDOO camera module is about 8 cm and 7 cm, respectively. The RGB sensor was placed as close as possible to avoid unwanted reflections interfering with the measurement. Then the paper was moved away progressively from the measurement device, checking whether data read by the sensor were still acceptable. The sensor was able to detect the color components excellently if it was placed at a distance not exceeding 3 mm.

3.2. Tests on the Detectors

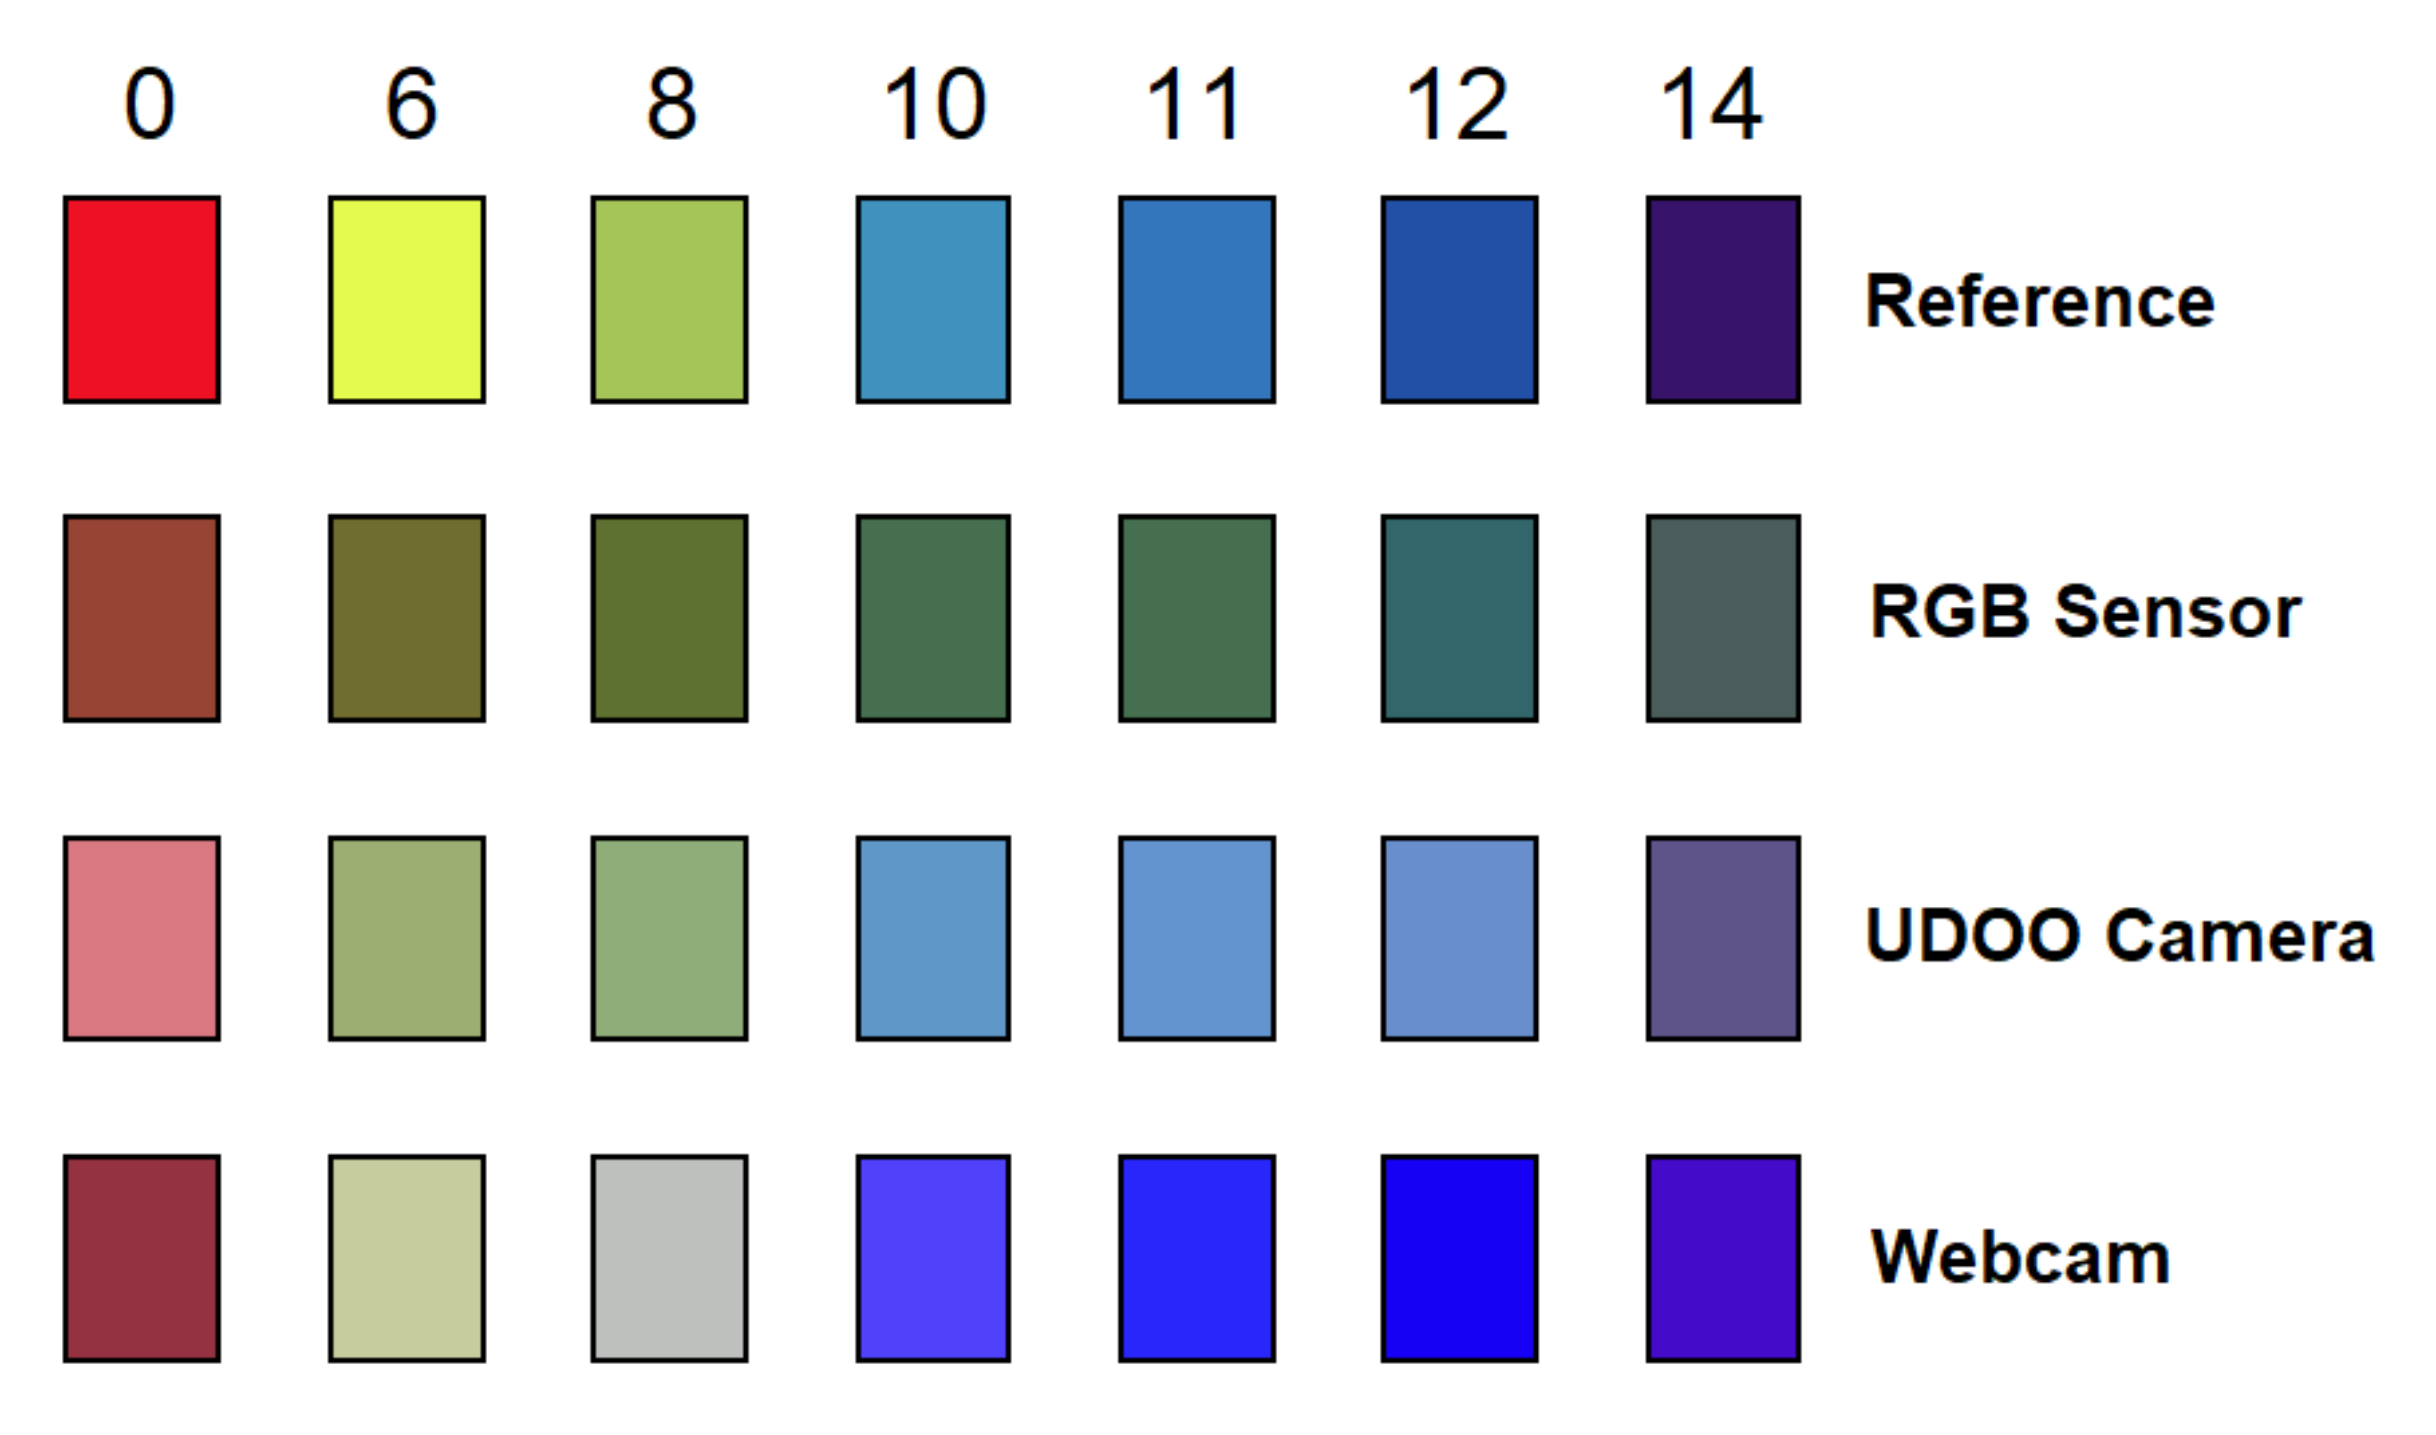
The first device tested was the Adafruit RGB sensor. The sensor was placed into a controlled environment, with the LCD turned off, and its white LED turned on, providing the only available source of light. The idea was to isolate the system from any potential external light that may reveal instability even for a few hours. The system was able to discriminate all the fifteen colors of the map. Subsequently, the response of the UDOO camera module was taken into account. Since the module did not have an LED to illuminate the area of interest, it was necessary to use the external light to carry out the measurements, leaving the illuminating display off. Finally, the response of the webcam to the different colors of litmus paper was analyzed. In this case, since the webcam is equipped with an illuminating LED, the same light conditions used in the case of the RGB sensor were used again. Further, in this case, the device was able to discriminate colors with pretty good accuracy. The response of the three devices to some of the colors present in the litmus paper is shown in Figure 6. In particular, the response to the colors corresponding to the numbers 0, 6, 8, 10, 11, 12, 14 of the pH scale is presented.

3.3. Detectors Comparison

We analyzed the correlation between the reference values of colors and the responses given by the RGB sensor, the UDOO camera, and the webcam.
In particular, the Pearson coefficient correlation, a classical measure for the strength of a linear association between two variables x and y has been used. In particular, if ρ = 1 , there is a perfect positive correlation, while if ρ = 1 a perfect negative correlation is present between the two variables. The Person correlation formula is the following:
ρ = ( x i x ¯ ) ( y i y ¯ ) ( x i x ¯ ) 2 ( y i y ¯ ) 2
where ρ is the correlation coefficient, x i is the i-th value of the x-variable in a sample, y i is the i-th value of the y-variable in a sample, while x ¯ and y ¯ are the mean of the x and the y values, respectively.
First of all, we have determined the RGB triplets corresponding to the reference as depicted in Figure 6. We have visually compared the colors and picked up the triplets that gave the closer match to the reference color.
We have computed the ρ value of each R, G, B channel between the reference and each one of the sensors (RGB sensor, UDOO camera, and webcam). The results are reported in the following Table 1.
The highest value of average correlation with the reference values, by considering the three different R,G,B coordinates, is given by the UDOO camera ( ρ = 0.925 ), followed by the webcam ( ρ = 0.9 ).
However, considering the correlation between the single RGB coordinates can be misleading. For this reason, we have also computed the Euclidean distance between each point in the RGB space and its subsequent one associated with the pH scale given in Figure 6. This allows us to understand the responsiveness of each sensor to the variation of the pH.
To better understand the responsiveness of the different sensors, we have therefore computed the Pearson correlation matrix between the four different variables, i.e., the vectors of six dimensions whose values were the distances reported in Figure 7.
The correlation matrix is reported in Table 2.
As it can be seen, the distances of the webcam sensor show the best correlation with the color distances given by the reference, while the webcam and the RGB sensor provide the most correlated responses by considering the relative distances between points associated with pH values in the RGB color space.

3.4. Measurements

The developed system allows for spectral measurements of both reflected and transmitted light from the sample. Measurements were made under the total absence of external light in order to avoid noise or bias errors. From the considerations emerging in the previous sections, it was decided to use two different data acquisition systems, each with its characteristics and both with an excellent compromise between quality and cost. The two devices under consideration are a LinQ C2018 HD webcam and the Adafruit 1334 RGB sensor. The system has been tested on colored samples made of transparent sheets by performing several measurements; in principle, each evaluated color reproduces a particular concentration of a target analyte. A multicolor mode measurement was then performed considering a color sequence made by a total of 50 colors, from red to violet, emulating the visible spectrum. The software allows the color components of the samples under test to be captured in synchronism with the illumination sequence, thus evaluating the sample response to the given radiation.
For measurements carried out in transmission mode, the samples were placed in the optical path between the LCD screen and the detector so that the latter captures the light transmitted through the samples when illuminated by the LCD screen. In addition to the colored samples, a uncolored transparent sheet was used as a sample to measure the reference intensity I ( r e f e r e n c e ) and calculate the transmittance ( T ) in the same way as visible absorption spectroscopy:
T s a m p l e i = I s a m p l e i / I r e f e r e n c e ,
where the light intensity (I) for each triplet ( r , g , b ) is given by [34,48]:
I = 0.299 r + 0.587 g + 0.114 b
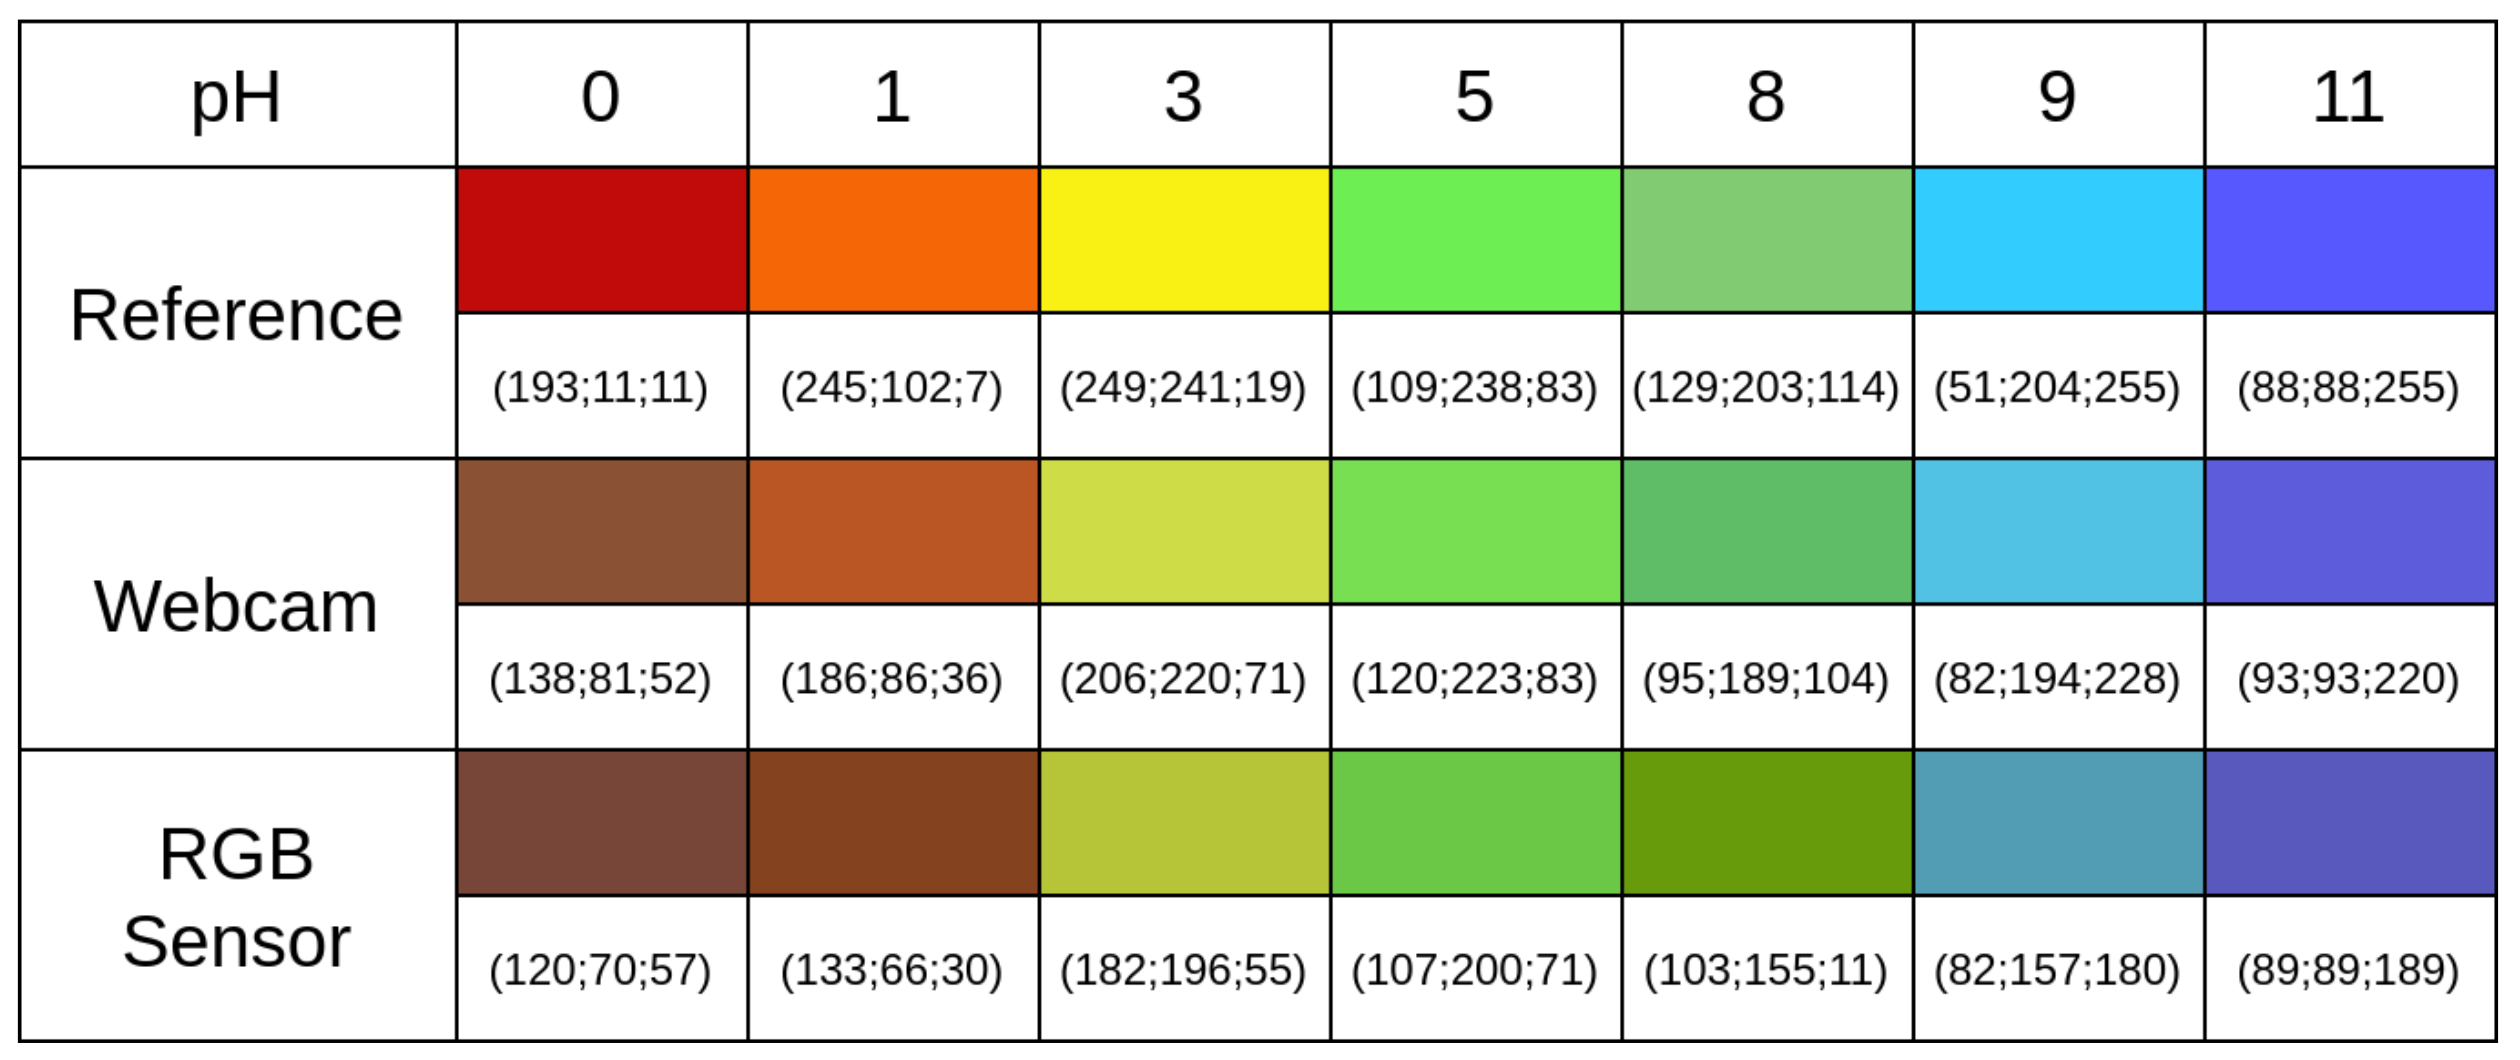
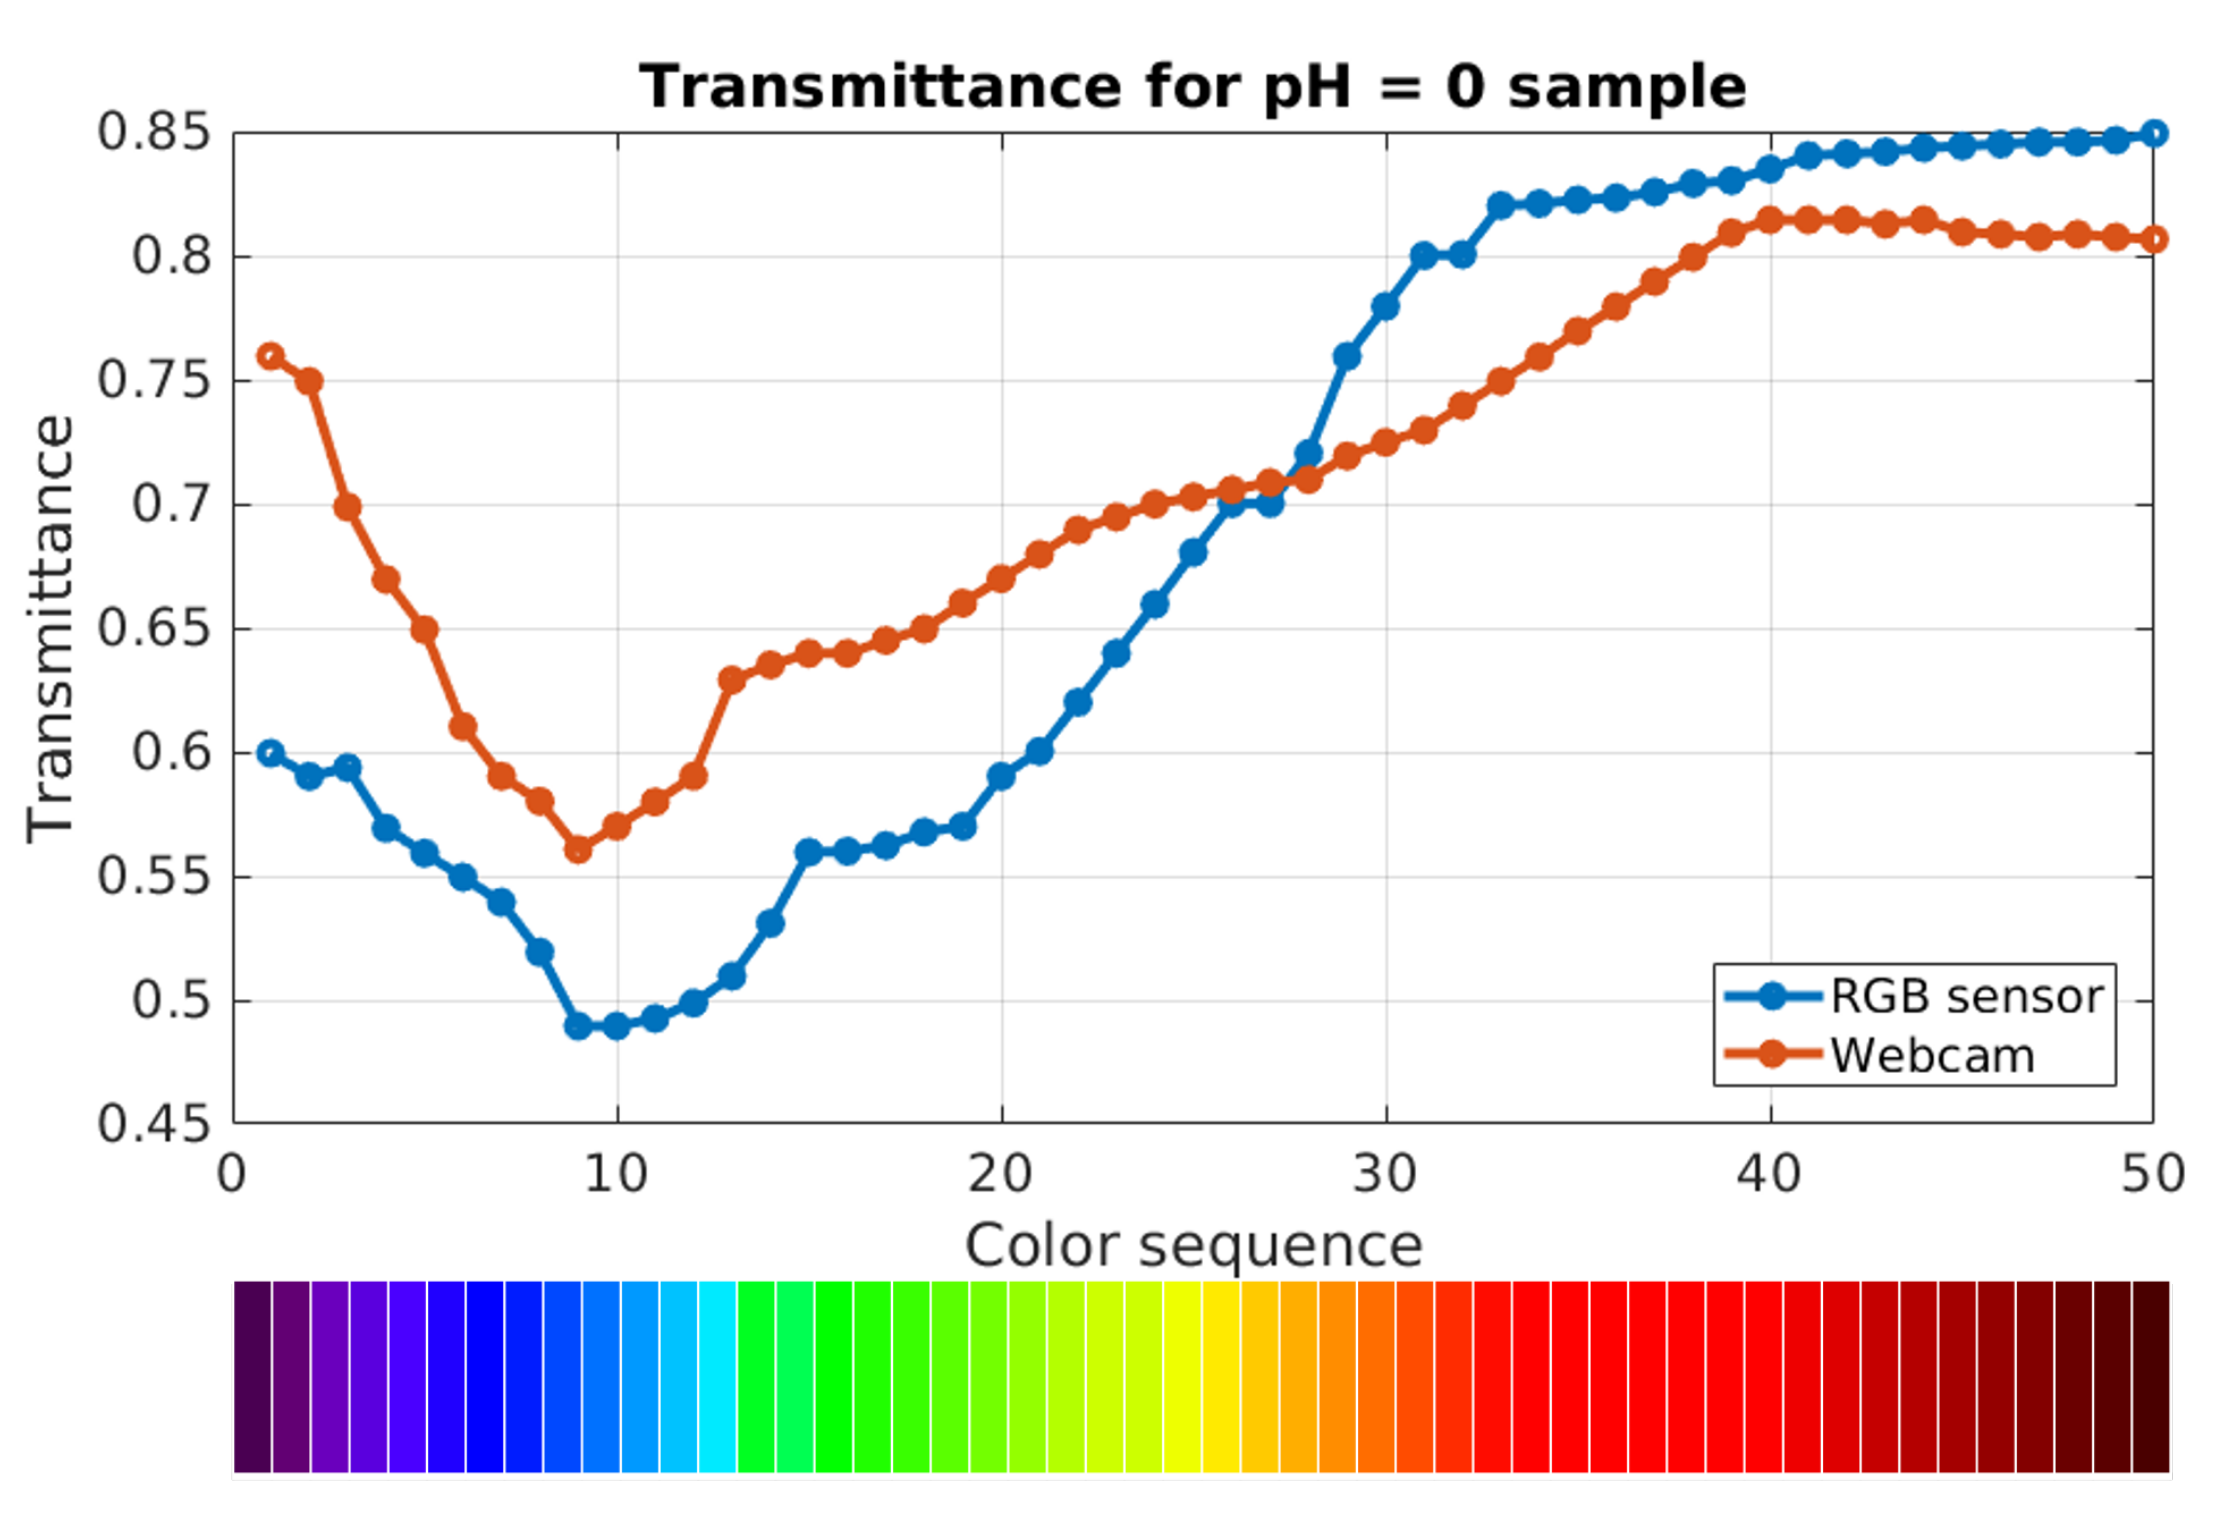
Figure 8 shows the response of the two devices to certain colors of litmus paper (0, 1, 3, 5, 8, 9, 11 on the pH scale) in transmission configuration. Figure 9 shows the calculated transmittance values of the sample corresponding to pH = 0 for the selected color sequence.
In reflection configuration, the semi-transparent samples were placed on top of a white opaque paper, in front of the detectors and a white LED. The LCD screen was turned off. In this case, the LED represented the only available source of light and the detectors captured light reflected from the samples. The measurement conditions were very similar for both the detectors employed: the RGB sensor and the webcam. As in the transmission analysis, the system, differentiated all 15 colors of the map. Figure 10 shows the response of the two devices to the colors of litmus paper already considered in the transmission analysis. Since the LED illuminated the samples with a white light, it was not possible to estimate the reflectance of each sample as a function of the color sequence. As a future perspective, a RGB LED could be included into the project or the same LCD screen could be also employed for reflection measurements.

4. Conclusions

Inkjet printing, and more generally rapid prototyping systems, enable the spread of newly developed devices that are becoming cheaper and easier to use. In this context, the realization of colorimetric sensors as litmus paper for multiple substances may be desirable in applications that rely on large-scale diffusion and ease of use as their cornerstones. Based on these perspectives, a compact prototype measurement system for the characterization of colorimetric sensors has been developed, together with software optimized. The system is equipped with three different detectors whose performance has been evaluated and discussed in this article.
The developed device supports multiple colorimetric sensors and can then be used, as a future perspective, for field applications such as low-cost detection of contaminants (Fe ions and others, especially highly toxic heavy metals) present in wastewater and used as tracers of chemical contamination.

Author Contributions

Conceptualization, N.D. and G.P.; methodology, N.D.; software, G.G.; validation, N.D., G.P. and G.G.; formal analysis, G.P. and G.G.; investigation, N.D.; resources, N.D.; data curation, N.D.; all the authors contributed in writing the paper. All authors have read and agreed to the published version of the manuscript.

Funding

This research received no external funding.

Acknowledgments

The authors would thank Salvatore Salpietro for his partial contribution to the experimental trials.

Conflicts of Interest

The authors declare no conflict of interest.

Abbreviations

The following abbreviations are used in this manuscript:
BBlue
CSICamera Serial Interface
CSPTComputer Screen Photo-assisted Technique
GGreen
GODGlucose Oxidase enzyme
I2CInter-Integrated Circuit
LCDLiquid Crystal Display
LEDLight Emission Diode
LVDSLow-Voltage Differential Signaling
PCPersonal Computer
pHpotential of Hydrogen
RRed
ROIRegion of Interest
SLPTScanning Light Pulse Technique
SPISerial Peripheral Interface
USBUniversal Serial Bus

References

  1. Gruber, P.; Marques, M.P.; Szita, N.; Mayr, T. Integration and application of optical chemical sensors in microbioreactors. Lab Chip 2017, 17, 2693–2712. [Google Scholar] [CrossRef] [Green Version]
  2. Muthukumar, P.; John, S.A. Highly sensitive detection of HCl gas using a thin film of meso-tetra (4-pyridyl) porphyrin coated glass slide by optochemical method. Sens. Actuators B Chem. 2011, 159, 238–244. [Google Scholar] [CrossRef]
  3. Lin, F.W.; Xu, X.L.; Wu, J.; Wan, L.S.; Xu, Z.K. Cobalt-porphyrin/dansyl piperazine complex coated filter paper for “turn on” fluorescence sensing of ammonia gas. RSC Adv. 2015, 5, 99361–99363. [Google Scholar] [CrossRef]
  4. Kladsomboon, S.; Kerdcharoen, T. A method for the detection of alcohol vapours based on optical sensing of magnesium 5, 10, 15, 20-tetraphenyl porphyrin thin film by an optical spectrometer and principal component analysis. Anal. Chim. Acta 2012, 757, 75–82. [Google Scholar] [CrossRef]
  5. Bozkurt, S.S.; Merdivan, E.; Benibol, Y. A fluorescent chemical sensor for ethanol determination in alcoholic beverages. Microchim. Acta 2010, 168, 141–145. [Google Scholar] [CrossRef]
  6. Prosposito, P.; Burratti, L.; Venditti, I. Silver nanoparticles as colorimetric sensors for water pollutants. Chemosensors 2020, 8, 26. [Google Scholar] [CrossRef] [Green Version]
  7. Weston, M.; Kuchel, R.P.; Ciftci, M.; Boyer, C.; Chandrawati, R. A polydiacetylene-based colorimetric sensor as an active use-by date indicator for milk. J. Colloid Interface Sci. 2020, 572, 31–38. [Google Scholar] [CrossRef]
  8. Li, Z.; Suslick, K.S. Colorimetric sensor array for monitoring CO and ethylene. Anal. Chem. 2018, 91, 797–802. [Google Scholar] [CrossRef]
  9. Promphet, N.; Rattanawaleedirojn, P.; Siralertmukul, K.; Soatthiyanon, N.; Potiyaraj, P.; Thanawattano, C.; Hinestroza, J.P.; Rodthongkum, N. Non-invasive textile based colorimetric sensor for the simultaneous detection of sweat pH and lactate. Talanta 2019, 192, 424–430. [Google Scholar] [CrossRef]
  10. Zhu, X.; Chen, W.; Wu, K.; Li, H.; Fu, M.; Liu, Q.; Zhang, X. A colorimetric sensor of H2O2 based on Co3O4–montmorillonite nanocomposites with peroxidase activity. New J. Chem. 2018, 42, 1501–1509. [Google Scholar] [CrossRef]
  11. Gavrilenko, N.A.; Saranchina, N.V.; Gavrilenko, M.A. A colorimetric sensor based on a polymethacrylate matrix with immobilized 1-(2-pyridylazo)-2-naphthol for the determination of cobalt. J. Anal. Chem. 2015, 70, 1475–1479. [Google Scholar] [CrossRef]
  12. Gavrilenko, N.A.; Saranchina, N.V.; Gavrilenko, M.A. Colorimetric sensor based on silver nanoparticle–Embedded polymethacrylate matrix. In Advanced Materials Research; Trans Tech Publ. Switzerland: Bäch, Switzerland, 2014; Volume 1040, pp. 923–927. [Google Scholar]
  13. Soga, T.; Jimbo, Y.; Suzuki, K.; Citterio, D. Inkjet-printed paper-based colorimetric sensor array for the discrimination of volatile primary amines. Anal. Chem. 2013, 85, 8973–8978. [Google Scholar] [CrossRef] [PubMed]
  14. Sahu, M.; Shrivas, K.; Kant, T.; Patel, S.; Devi, R.; Dahariya, N.S.; Pervez, S.; Deb, M.K.; Rai, M.K.; Rai, J.; et al. Inkjet-printed paper-based colorimetric sensor coupled with smartphone for determination of mercury (Hg2+). J. Hazard. Mater. 2021, 414, 125440. [Google Scholar]
  15. Donato, N.; Aloisio, D.; Leonardi, S.G.; Neri, G. Ink-jet printed colorimetric sensor for the determination of Fe (II). IEEE Sens. J. 2014, 15, 3196–3200. [Google Scholar] [CrossRef]
  16. Chen, Y.; Fu, G.; Zilberman, Y.; Ruan, W.; Ameri, S.K.; Zhang, Y.S.; Miller, E.; Sonkusale, S.R. Low cost smart phone diagnostics for food using paper-based colorimetric sensor arrays. Food Control 2017, 82, 227–232. [Google Scholar] [CrossRef]
  17. Jalal, U.M.; Jin, G.J.; Shim, J.S. Paper–plastic hybrid microfluidic device for smartphone-based colorimetric analysis of urine. Anal. Chem. 2017, 89, 13160–13166. [Google Scholar] [CrossRef]
  18. Sharifi, H.; Tashkhourian, J.; Hemmateenejad, B. A 3D origami paper-based analytical device combined with PVC membrane for colorimetric assay of heavy metal ions: Application to determination of Cu (II) in water samples. Anal. Chim. Acta 2020, 1126, 114–123. [Google Scholar] [CrossRef]
  19. Dong, R.E.; Kang, P.; Xu, X.L.; Cai, L.X.; Guo, Z. Cation-exchange strategy for a colorimetric paper sensor: Belt-like ZnSe nanoframes toward visual determination of heavy metal ions. Sens. Actuators B Chem. 2020, 312, 128013. [Google Scholar] [CrossRef]
  20. Zhao, L.; Zhao, L.; Miao, Y.; Liu, C.; Zhang, C. A colorimetric sensor for the highly selective detection of sulfide and 1, 4-dithiothreitol based on the in situ formation of silver nanoparticles using dopamine. Sensors 2017, 17, 626. [Google Scholar] [CrossRef] [Green Version]
  21. Terra, I.A.; Mercante, L.A.; Andre, R.S.; Correa, D.S. Fluorescent and colorimetric electrospun nanofibers for heavy-metal sensing. Biosensors 2017, 7, 61. [Google Scholar] [CrossRef] [PubMed] [Green Version]
  22. Wei, W.; Huang, J.; Gao, W.; Lu, X.; Shi, X. Carbon Dots Fluorescence-Based Colorimetric Sensor for Sensitive Detection of Aluminum Ions with a Smartphone. Chemosensors 2021, 9, 25. [Google Scholar] [CrossRef]
  23. Obrovski, B.; Bajić, J.; Mihajlović, I.; Miloradov, M.V.; Batinić, B.; Živanov, M. Colorimetric fiber optic probe for measurement of chemical parameters in surface water. Sens. Actuators B Chem. 2016, 228, 168–173. [Google Scholar] [CrossRef]
  24. Schmitt, K.; Rist, J.; Peter, C.; Wöllenstein, J. Low-cost fiber-optic waveguide sensor for the colorimetric detection of ammonia. Microsyst. Technol. 2012, 18, 843–848. [Google Scholar] [CrossRef]
  25. Santonico, M.; Scozzari, A.; Brozzo, G.; Marini, L.; D’Amico, A.; Filippini, D.; Lundström, I.; Di Natale, C. Detection of natural Cr (VI) with computer screen photo-assisted technology. Procedia Chem. 2009, 1, 317–320. [Google Scholar] [CrossRef] [Green Version]
  26. Polese, D.; Magna, G.; Dini, F.; Martinelli, E.; Paolesse, R.; D’Amico, A.; Filippini, D.; Lundström, I.; Di Natale, C. Facile sensors replacement in optical gas sensors array. Procedia Eng. 2011, 25, 35–38. [Google Scholar] [CrossRef] [Green Version]
  27. Askim, J.R.; Suslick, K.S. Hand-held reader for colorimetric sensor arrays. Anal. Chem. 2015, 87, 7810–7816. [Google Scholar] [CrossRef] [Green Version]
  28. Debus, B.; Kirsanov, D.; Yaroshenko, I.; Sidorova, A.; Piven, A.; Legin, A. Two low-cost digital camera-based platforms for quantitative creatinine analysis in urine. Anal. Chim. Acta 2015, 895, 71–79. [Google Scholar] [CrossRef] [Green Version]
  29. Giri, B. 11—Simultaneous Determination of Protein and Glucose in Urine Sample Using a Paper-Based Bioanalytical Device. In Laboratory Methods in Microfluidics; Giri, B., Ed.; Elsevier: Amsterdam, The Netherlands, 2017; pp. 69–75. [Google Scholar] [CrossRef]
  30. Mao, K.; Yang, Z.; Li, J.; Zhou, X.; Li, X.; Hu, J. A novel colorimetric biosensor based on non-aggregated Au@ Ag core–shell nanoparticles for methamphetamine and cocaine detection. Talanta 2017, 175, 338–346. [Google Scholar] [CrossRef] [Green Version]
  31. Paolesse, R.; Alimelli, A.; D’Amico, A.; Venanzi, M.; Battistini, G.; Montalti, M.; Filippini, D.; Lundström, I.; Di Natale, C. Insights on the chemistry of a, c-biladienes from a CSPT investigation. New J. Chem. 2008, 32, 1162–1166. [Google Scholar] [CrossRef]
  32. Filippini, D.; Comina, G.; Lundström, I. Computer screen photo-assisted reflectance fingerprinting. Sens. Actuators B Chem. 2005, 107, 580–586. [Google Scholar] [CrossRef]
  33. Di Natale, C.; Filippini, D.; Pennazza, G.; Santonico, M.; Paolesse, R.; Bellincontro, A.; Mencarelli, F.; D’Amico, A.; Lundström, I. Sorting of apricots with computer screen photoassisted spectral reflectance analysis and electronic nose. Sens. Actuators B Chem. 2006, 119, 70–77. [Google Scholar] [CrossRef]
  34. Manzano, J.; Filippini, D.; Lundström, I. Computer screen illumination for the characterization of colorimetric assays. Sens. Actuators B Chem. 2003, 96, 173–179. [Google Scholar] [CrossRef]
  35. Polese, D.; Martinelli, E.; Magna, G.; Dini, F.; Catini, A.; Paolesse, R.; Lundstrom, I.; Di Natale, C. Sharing data processing among replicated optical sensor arrays. Sens. Actuators B Chem. 2013, 179, 252–258. [Google Scholar] [CrossRef]
  36. Yoo, Y.; Yoo, W.S. Turning Image Sensors into Position and Time Sensitive Quantitative Colorimetric Data Sources with the Aid of Novel Image Processing/Analysis Software. Sensors 2020, 20, 6418. [Google Scholar] [CrossRef]
  37. Dini, F.; Filippini, D.; Paolesse, R.; Lundström, I.; Di Natale, C. Computer screen assisted digital photography. Sens. Actuators B Chem. 2013, 179, 46–53. [Google Scholar] [CrossRef]
  38. Wyszecki, G.; Stiles, W.S. Color science: Concepts and methods, quantitative data and formulas. Phys. Bull. 1982, 18, 353. [Google Scholar] [CrossRef]
  39. Paolesse, R.; Nardis, S.; Monti, D.; Stefanelli, M.; Di Natale, C. Porphyrinoids for chemical sensor applications. Chem. Rev. 2017, 117, 2517–2583. [Google Scholar] [CrossRef] [Green Version]
  40. Filippini, D.; Lundström, I. Chemical imaging by a computer screen aided scanning light pulse technique. Appl. Phys. Lett. 2002, 81, 3891–3893. [Google Scholar] [CrossRef]
  41. Paolesse, R.; Monti, D.; Dini, F.; Di Natale, C. Fluorescence based sensor arrays. Lumin. Appl. Sens. Sci. 2010, 139–174. [Google Scholar] [CrossRef]
  42. Lombardo, L.; Parvis, M.; Angelini, E.; Grassini, S. An Optical Sampling System for Distributed Atmospheric Particulate Matter. IEEE Trans. Instrum. Meas. 2019, 68, 2396–2403. [Google Scholar] [CrossRef]
  43. Iannucci, L.; Lombardo, L.; Parvis, M.; Cristiani, P.; Basséguy, R.; Angelini, E.; Grassini, S. An imaging system for microbial corrosion analysis. In Proceedings of the 2019 IEEE International Instrumentation and Measurement Technology Conference (I2MTC), Auckland, New Zealand, 20–23 May 2019; pp. 1–6. [Google Scholar] [CrossRef] [Green Version]
  44. UDOO Single Board COMPUTER: X86 and ARM POWERFUL Arduino Mini PC. 2020. Available online: https://www.udoo.org/ (accessed on 14 August 2021).
  45. Borrello, G.; Salvato, E.; Gugliandolo, G.; Marinkovic, Z.; Donato, N. UDOO-Based Environmental Monitoring System. In Applications in Electronics Pervading Industry, Environment and Society; De Gloria, A., Ed.; Springer International Publishing: Cham, Switzerland, 2017; pp. 175–180. [Google Scholar]
  46. Gugliandolo, G.; Campobello, G.; Marinkovic, Z.; Crupi, G.; Quartarone, A.; Neri, G.; Donato, N. Development of a multi-transduction system for breath analysis in neurodegenerative diseases. In Proceedings of the 2021 IEEE International Symposium on Medical Measurements and Applications (MeMeA), Lausanne, Switzerland, 23–25 June 2021; pp. 1–6. [Google Scholar] [CrossRef]
  47. Campobello, G.; Segreto, A.; Donato, N. A new frequency estimation algorithm for IIoT applications and low-cost instrumentation. In Proceedings of the 2020 IEEE International Instrumentation and Measurement Technology Conference (I2MTC), Dubrovnik, Croatia, 25–28 May 2020; pp. 1–5. [Google Scholar] [CrossRef]
  48. Jackson, R.; MacDonald, L.; Freeman, K. Computer Generated Color: A Practical Guide to Presentation and Display; John Wiley & Sons, Inc.: Hoboken, NJ, USA, 1994. [Google Scholar]
Figure 1. Schematic of a CSPT (Computer Screen Photo-assisted Technique measurement) system: (a) Reflection configuration; (b) transmission configuration.
Electronics 10 02587 g001
Figure 2. (a) Block diagram of the developed measurement system. Photo of the developed system, front (b) and back view (c).
Electronics 10 02587 g002
Figure 3. Block diagram of the developed software.
Electronics 10 02587 g003
Figure 4. Software developed: user interface during: (a) UDOO camera module selection; (b) ROI selection; (c) measurement acquisition; (d) visualization of saved measurements.
Electronics 10 02587 g004
Figure 5. pH Scale. Values lower than 7 indicate acid substances while a pH greater than 7 indicates alkali substances. A pH equal to 7 characterizes neutral solutions (e.g., water).
Electronics 10 02587 g005
Figure 6. Colors acquired through the three detector tested in comparison to the reference colors.
Electronics 10 02587 g006
Figure 7. Distances in the RGB space between the considered pH values.
Electronics 10 02587 g007
Figure 8. Response of the two sensing devices in transmission configuration.
Electronics 10 02587 g008
Figure 9. Transmittance values of the sample corresponding to pH = 0 calculated with the RGB sensor and the webcam.
Electronics 10 02587 g009
Figure 10. Response of the two sensing devices in reflection configuration.
Electronics 10 02587 g010
Table 1. Correlation ( ρ ) values between each R, G, B dimension of the reference and those ones of each considered sensor. The mean correlation for each is also reported along with its respective standard deviation (in %).
SensorRef-RRef-GRef-BMeanStDev (%)
RGB Sensor0.9510.7320.8130.83213.317
UDOO Camera0.9430.9100.9220.9251.800
Webcam0.8770.8850.9370.9003.642
Table 2. Correlation ( ρ ) values between the six-dimension vectors containing the relative distances between subsequent values of pH as reported in Figure 7.
ρ ValuesReferenceRGB SensorUDOOWebcam
Reference1
RGB Sensor0.8631
UDOO Camera0.7240.7181
Webcam0.9170.9560.7721
Publisher’s Note: MDPI stays neutral with regard to jurisdictional claims in published maps and institutional affiliations.